| Issue |
A&A
Volume 510, February 2010
|
|
|---|---|---|
| Article Number | A72 | |
| Number of page(s) | 7 | |
| Section | Interstellar and circumstellar matter | |
| DOI | https://doi.org/10.1051/0004-6361/200912810 | |
| Published online | 12 February 2010 | |
Timescale of mass accretion in pre-main-sequence stars
D. Fedele1,2 - M. E. van den Ancker3 - Th. Henning1 - R. Jayawardhana4 - J. M. Oliveira5,![]()
1 - Max Planck Institut für Astronomie, Königstuhl 17, 69117
Heidelberg, Germany
2 -
Departamento de Fisica Teórica, Facultad de Ciencias, Universidad Autónoma
de Madrid, Cantoblanco, 28049 Madrid, Spain
3 -
European Southern Observatory, Karl Schwarzschild Strasse 2, 85748
Garching bei München, Germany
4 -
Department of Astronomy and Astrophysics, University of Toronto, 50 St. George Street, Toronto, ON, M5S 3H4, Canada
5 -
Lennard-Jones Laboratories, School of Physical & Geographical Sciences, Keele
University, Staffordshire ST5 5BG, UK
Received 1 July 2009 / Accepted 17 November 2009
Abstract
We present the initial result of a large spectroscopic survey aimed
at measuring the timescale of mass accretion in young,
pre-main-sequence stars in the spectral type range K0-M5. Using
multi-object spectroscopy with VIMOS at the VLT we identified the
fraction of accreting stars in a number of young stellar clusters and
associations of the ages of between 1-30 Myr. The fraction of
accreting stars decreases from ![]() 60% at 1.5-2 Myr to
60% at 1.5-2 Myr to ![]() 2% at 10 Myr. No accreting stars are found after 10 Myr at a
sensitivity limit of 10-11
2% at 10 Myr. No accreting stars are found after 10 Myr at a
sensitivity limit of 10-11
![]() .
We compared the fraction of stars
showing ongoing accretion (
.
We compared the fraction of stars
showing ongoing accretion (
![]() )
to the fraction of stars with near-to-mid
infrared excess (
)
to the fraction of stars with near-to-mid
infrared excess (
![]() ). In most cases we find
). In most cases we find
![]() <
<
![]() ,
i.e.,
mass accretion appears to cease (or drop below detectable level) earlier
than the dust is dissipated in the inner disk. At 5 Myr, 95% of the
stellar population has stopped accreting material at a rate of
,
i.e.,
mass accretion appears to cease (or drop below detectable level) earlier
than the dust is dissipated in the inner disk. At 5 Myr, 95% of the
stellar population has stopped accreting material at a rate of
![]()
![]() ,
while
,
while ![]() 20% of the stars show near-infrared excess
emission. Assuming an exponential decay, we measure a mass accretion
timescale (
20% of the stars show near-infrared excess
emission. Assuming an exponential decay, we measure a mass accretion
timescale (
![]() )
of 2.3 Myr, compared to a near-to-mid infrared excess
timescale (
)
of 2.3 Myr, compared to a near-to-mid infrared excess
timescale (
![]() )
of 3 Myr. Planet formation and/or migration, in the
inner disk might be a viable mechanism to halt further accretion onto the
central star on such a short timescale.
)
of 3 Myr. Planet formation and/or migration, in the
inner disk might be a viable mechanism to halt further accretion onto the
central star on such a short timescale.
Key words: accretion, accretion disks - stars: pre-main sequence - planetary systems: protoplanetary disks
1 Introduction
Circumstellar disks around young, pre-main-sequence stars are the natural loci
of planet formation (e.g. Henning 2008). Such a protoplanetary
disk is formed during the collapse of the molecular cloud to conserve the
initial angular momentum. It consists of interstellar gas and dust. The
conventional planet formation model is the so-called core-accretion
model (e.g. Mordasini et al. 2008; Pollack et al. 1996). In the simulations of
Pollack et al. (1996), the formation of solar-system like planets takes up to 16 Myr. Giant planet formation is much faster (![]() 3 Myr) if planet
migration is included (Alibert et al. 2005,2004). Gravitational instability
in the disk was also proposed as a viable scenario to form planets,
especially in the outer disk (Boss 1998; Durisen 2007; Boss 1997). If
gravitational instabilities occur, the disk may fragment and form dense
self-gravitating clumps which are the precursor of gas giant planets. In
this model planet formation is very fast (
3 Myr) if planet
migration is included (Alibert et al. 2005,2004). Gravitational instability
in the disk was also proposed as a viable scenario to form planets,
especially in the outer disk (Boss 1998; Durisen 2007; Boss 1997). If
gravitational instabilities occur, the disk may fragment and form dense
self-gravitating clumps which are the precursor of gas giant planets. In
this model planet formation is very fast (![]() 1 Myr).
1 Myr).
Planet formation models face the fast evolution of protoplanetary
disks. Star forming regions show a steady decline with time in
the fraction of stars having infrared excess emission (e.g. Hillenbrand 2008; Haisch et al. 2005,2001; Bouwman et al. 2006). This is thought to be caused by
gradual clearing of dust in the inner disk. The growing consensus is that
the warm small dust grains disappear within the first 5![]() 9 Myr
(
9 Myr
(
![]() ). The quantity
). The quantity
![]() is sometimes adopted as the disk
lifetime. Although dust is essential to form a planet in terms of disk
mass and hence dynamics and evolution, it accounts only for a small
percentage of the disk mass. The bulk of the disk mass is thought to be
gaseous. At present, it is unclear whether the gas dissipation timescale
(
is sometimes adopted as the disk
lifetime. Although dust is essential to form a planet in terms of disk
mass and hence dynamics and evolution, it accounts only for a small
percentage of the disk mass. The bulk of the disk mass is thought to be
gaseous. At present, it is unclear whether the gas dissipation timescale
(
![]() )
is similar to
)
is similar to
![]() .
.
In this paper we report on a study aimed to determine the timescale for mass
accretion (
![]() )
in protoplanetary disks. The timescale
)
in protoplanetary disks. The timescale
![]() ,
i.e. the
time at which the disk accretion phase ceases, provides a strong constraint
on
,
i.e. the
time at which the disk accretion phase ceases, provides a strong constraint
on
![]() .
Gas may still be present after
.
Gas may still be present after
![]() ,
but the amount of the remaining gas and hence of the disk mass may be
too low to be able to form giant planet(s). Our observational strategy,
observations and data reduction are presented in Sect. 2. Analysis
and results are presented in Sects. 3 and 4 respectively. In
Sect. 5 we compare our result with literature data. Conclusions
are drawn in Sect. 6.
,
but the amount of the remaining gas and hence of the disk mass may be
too low to be able to form giant planet(s). Our observational strategy,
observations and data reduction are presented in Sect. 2. Analysis
and results are presented in Sects. 3 and 4 respectively. In
Sect. 5 we compare our result with literature data. Conclusions
are drawn in Sect. 6.
Table 1: Regions observed with VIMOS.
2 Method
In order to measure
![]() in a reliable way, we performed an optical
spectroscopic survey of a large number of stars towards seven young
stellar clusters (Table 1). Multi-object spectroscopy was
performed with
VIMOS
in a reliable way, we performed an optical
spectroscopic survey of a large number of stars towards seven young
stellar clusters (Table 1). Multi-object spectroscopy was
performed with
VIMOS![]() (LeFevre et al. 2003) at the VLT. No a priori target selection was made,
instead we optimized the position of the slits in the multi-object masks in
order to get the spectrum of as many stars as possible in the proximity of
the cluster center. We did not aim at taking the spectrum of each (known)
cluster member, but rather at building an unbiased inventory of the stellar
population in a sub-region of the cluster down to a limiting magnitude of V
= 21 mag. For each cluster we estimated the fraction of stars with ongoing
mass accretion by analyzing the H
(LeFevre et al. 2003) at the VLT. No a priori target selection was made,
instead we optimized the position of the slits in the multi-object masks in
order to get the spectrum of as many stars as possible in the proximity of
the cluster center. We did not aim at taking the spectrum of each (known)
cluster member, but rather at building an unbiased inventory of the stellar
population in a sub-region of the cluster down to a limiting magnitude of V
= 21 mag. For each cluster we estimated the fraction of stars with ongoing
mass accretion by analyzing the H![]() line profile. Finally, the
fraction of accreting stars was plotted against the age of the clusters.
line profile. Finally, the
fraction of accreting stars was plotted against the age of the clusters.
In this paper we present the analysis of the mass accretion evolution. Results on individual clusters will be presented in a forthcoming paper.
The following criteria were adopted for the sample selection:
- Age:
- the clusters have ages covering the interval of 2-30 Myr;
- Distance and extinction:
- nearby and optically visible systems were selected to ensure the detection of low mass stars down to the spectral type M3 (at least);
- Stellar density profile:
- to avoid any bias introduced by e.g.mass segregation, we only selected clusters known to have a spherical density profile;
- Angular radius:
- (also linked to the previous point) only clusters with an angular size comparable to the field of view (FOV) of VIMOS were considered in order to minimize the number of contaminants.
Data reduction was performed with IRAF and specific IDL routines. The spectra were reduced using a long-slit approach, i.e., extracting each spectrum separately. Due to distortion of the instrument night-time wavelength calibration exposures were taken. No night-time flat-field images were taken. For this reason we preferred to leave the MOS spectra uncorrected for flat field so no further source of noise was introduced. The following scheme was applied: bias subtraction, wavelength calibration, background removal and spectrum extraction using the Horne optimal extraction method (Horne 1986). Multiple dithered spectra were combined afterwards using a specific IDL routine: before combining the spectra, a scaling factor was applied to take into account slit losses in different exposures.
Figure 1 shows some examples of VIMOS spectra of our program stars.
3 Analysis
3.1 Spectral type
The spectral type of the objects classified as cluster members was
derived. For this purpose we used the TiO index defined as
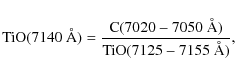
|
(1) |
where C(7020-7050 Å) is the spectral continuum computed between 7020-7050 Å, and TiO(7125-7155 Å) is the intensity of the TiO molecular band absorption between 7125-7155 Å (Oliveira et al. 2003; Briceño et al. 1998; Allen & Strom 1995). The TiO molecule is very sensitive to the stellar gravity and correlates very well with the spectral type in the range of K5-M6. We computed the spectral type of the VIMOS spectra, following the scheme of Jeffries et al. (2007). For earlier spectral types (K0-K5) we directly compared the VIMOS spectra with a set of standard star spectra which covered the same spectral range and had similar spectral resolution. The uncertainty on spectral type derived with these techniques is one sub-class.
In the following analysis we consider only stars with a spectral type between K0 and M5.
3.2 Membership
The cluster membership was established on the basis of the presence of two
spectral features: emission of the H![]() line at 6563 Å and
absorption of the Li 6708 Å line. H
line at 6563 Å and
absorption of the Li 6708 Å line. H![]() emission in young stars
is either produced by mass accretion or by chromospheric activity. The
presence of Li is also widely used as a youth indicator
(e.g. Basri et al. 1991); Li is depleted very fast once the thermonuclear
reactions begin in the core of the star. The abundance of Li in the
stellar atmosphere is inversely proportional to the age of the star
(Jeffries et al. 2007; Mentuch et al. 2008). This youth indicator is best suited for K- and
M-type stars younger than
emission in young stars
is either produced by mass accretion or by chromospheric activity. The
presence of Li is also widely used as a youth indicator
(e.g. Basri et al. 1991); Li is depleted very fast once the thermonuclear
reactions begin in the core of the star. The abundance of Li in the
stellar atmosphere is inversely proportional to the age of the star
(Jeffries et al. 2007; Mentuch et al. 2008). This youth indicator is best suited for K- and
M-type stars younger than ![]() 30 Myr (Jeffries et al. 2007). Some stars have
strong Li absorption in their spectrum, but no H
30 Myr (Jeffries et al. 2007). Some stars have
strong Li absorption in their spectrum, but no H![]() emission. These
might be cluster members with no or a reduced chromospheric activity. We
measured the EW of Li 6708 Å of these sources and compared this with the
typical Li 6708 Å EW measured for the certain members of the cluster
(0.2 Å < EW [Li] < 0.6 Å). We note that the lower limit of EW
Li measured here (0.2 Å) is an intermediate value assumed as a Li-indicator
applied by other authors (e.g. Jeffries et al. 2007, EW > 0.3 Å;
Winston et al. 2009, EW > 0.1 Å). In most of the cases the spectra show
either a tiny (EW
emission. These
might be cluster members with no or a reduced chromospheric activity. We
measured the EW of Li 6708 Å of these sources and compared this with the
typical Li 6708 Å EW measured for the certain members of the cluster
(0.2 Å < EW [Li] < 0.6 Å). We note that the lower limit of EW
Li measured here (0.2 Å) is an intermediate value assumed as a Li-indicator
applied by other authors (e.g. Jeffries et al. 2007, EW > 0.3 Å;
Winston et al. 2009, EW > 0.1 Å). In most of the cases the spectra show
either a tiny (EW ![]() 0.1 Å) H
0.1 Å) H![]() emission or small
absorption. In the latter case, the absorption is much smaller than the
typical photospheric absorption for the same spectral type. The ``reduced''
H
emission or small
absorption. In the latter case, the absorption is much smaller than the
typical photospheric absorption for the same spectral type. The ``reduced''
H![]() absorption might result from line veiling caused by the
chromospheric activity. These stars are classified as cluster members.
absorption might result from line veiling caused by the
chromospheric activity. These stars are classified as cluster members.
![\begin{figure}
\par\includegraphics[width=16.6cm,clip]{12810f1.ps}
\end{figure}](/articles/aa/full_html/2010/02/aa12810-09/img23.png)
|
Figure 1: Some examples of VIMOS spectra. |
| Open with DEXTER | |
3.3 Signature of mass accretion
To distinguish between chromospheric and accretion origin of the H![]() emission, White & Basri (2003) suggest a different threshold in EW for different
spectral types. Barrado y Navascués & Martín (2003) have defined an empirical criterion based
on the saturation limit of the chromospheric activity. Another tool of
investigation is the width of H
emission, White & Basri (2003) suggest a different threshold in EW for different
spectral types. Barrado y Navascués & Martín (2003) have defined an empirical criterion based
on the saturation limit of the chromospheric activity. Another tool of
investigation is the width of H![]() at 10% (H
at 10% (H
![]() )
of the
line peak (Jayawardhana et al. 2006; Flaherty & Muzerolle 2008; Natta et al. 2004; White & Basri 2003). As shown in Fig. 7 of
White & Basri (2003), accreting objects have a systematically larger value of
H
)
of the
line peak (Jayawardhana et al. 2006; Flaherty & Muzerolle 2008; Natta et al. 2004; White & Basri 2003). As shown in Fig. 7 of
White & Basri (2003), accreting objects have a systematically larger value of
H
![]() compared to non-accreting objects. Stars with
H
compared to non-accreting objects. Stars with
H
![]() > 270 kms-1 are accreting material from a circumstellar
disk. This criterion is valid down to a mass accretion rate of
> 270 kms-1 are accreting material from a circumstellar
disk. This criterion is valid down to a mass accretion rate of
![]()
![]() (Natta et al. 2004). The actual limit on a detectable
accretion rate depends on the stellar mass and age. As a conservative value
we adopt 10-11
(Natta et al. 2004). The actual limit on a detectable
accretion rate depends on the stellar mass and age. As a conservative value
we adopt 10-11
![]() .
In this work we used both the EW [H
.
In this work we used both the EW [H![]() ]
and
H
]
and
H
![]() criterion to distinguish between accretion and
chromospheric activity. This method is dependable to find a signature of
accretion whenever EW [H
criterion to distinguish between accretion and
chromospheric activity. This method is dependable to find a signature of
accretion whenever EW [H![]() ]
and H
]
and H
![]() are above or close
to the thresholds (Jayawardhana et al. 2006). However, stars with values lower than the
cutoff values may still be accreting at a low rate (
<10-11
are above or close
to the thresholds (Jayawardhana et al. 2006). However, stars with values lower than the
cutoff values may still be accreting at a low rate (
<10-11
![]() )
and
cannot be distinguished from pure chromospheric activity.
)
and
cannot be distinguished from pure chromospheric activity.
![\begin{figure}
\par\includegraphics[width=8.8cm,angle=90,clip]{12810f2.ps}
\end{figure}](/articles/aa/full_html/2010/02/aa12810-09/img25.png)
|
Figure 2:
EW [H |
| Open with DEXTER | |
The spectral resolution of VIMOS is enough to measure the widening of
the H![]() line due to accetion. At 6563 Å the minimum velocity
resolvable with VIMOS is 140 kms-1.
We measured the EW and the 10% width of the H
line due to accetion. At 6563 Å the minimum velocity
resolvable with VIMOS is 140 kms-1.
We measured the EW and the 10% width of the H![]() emission. The
spectral continuum was computed using two spectral windows at both sides of
the H
emission. The
spectral continuum was computed using two spectral windows at both sides of
the H![]() line. The continuum level in correspondence to the emission
line was interpolated using a first order polynomial. The spectra were then
continuum-normalized and subtracted. H
line. The continuum level in correspondence to the emission
line was interpolated using a first order polynomial. The spectra were then
continuum-normalized and subtracted. H
![]() was measured as the
width of the H
was measured as the
width of the H![]() line at the height corresponding to 10% of the
line peak. In the case of a narrow emission line and a low signal-to-noise
spectrum, the 10% level might be confused with the neighbor-continuum
fluctuations. To avoid this, the result was visually inspected. The major
source of uncertainty for the measurements of EW [H
line at the height corresponding to 10% of the
line peak. In the case of a narrow emission line and a low signal-to-noise
spectrum, the 10% level might be confused with the neighbor-continuum
fluctuations. To avoid this, the result was visually inspected. The major
source of uncertainty for the measurements of EW [H![]() ]
and
H
]
and
H
![]() is the determination of the underlying spectral
continuum. The errors in H
is the determination of the underlying spectral
continuum. The errors in H![]() EW and H
EW and H
![]() were computed
by taking the continuum error into account. For most of the spectra the
signal-to-noise ratio close to the H
were computed
by taking the continuum error into account. For most of the spectra the
signal-to-noise ratio close to the H![]() line is >10-20. This
translates into a precision of
line is >10-20. This
translates into a precision of ![]() 0.1 Å and 5 kms-1 for the
equivalent width and H
0.1 Å and 5 kms-1 for the
equivalent width and H
![]() ,
respectively. A further contribution
of uncertainty is given by the instrument's spectral precision. We
determined this by computing the full width half maximum and standard
deviation for a number of arc lines in the proximity of the H
,
respectively. A further contribution
of uncertainty is given by the instrument's spectral precision. We
determined this by computing the full width half maximum and standard
deviation for a number of arc lines in the proximity of the H![]() line. The standard deviation is on the order of 5-7 kms-1. We therefore
assume 0.2 Å and 10 kms-1 as a (conservative) lower limit to the
uncertainty of EW [H
line. The standard deviation is on the order of 5-7 kms-1. We therefore
assume 0.2 Å and 10 kms-1 as a (conservative) lower limit to the
uncertainty of EW [H![]() ]
and H
]
and H
![]() ,
respectively.
,
respectively.
4 Result
None of the stars in regions older than 10 Myr in our survey (ASCC 58,
Collinder 65, NGC 2353 and NGC 6664) shows evidence of ongoing accretion
(Table 2). Results for the youngest (<10 Myr) regions are
described below. In Fig. 2 we plot EW [H![]() ]
versus
H
]
versus
H
![]() for three different spectral ranges. Vertical and
horizontal dashed lines represent the thresholds for accreting stars. The
different symbols refer to different clusters: dots -
for three different spectral ranges. Vertical and
horizontal dashed lines represent the thresholds for accreting stars. The
different symbols refer to different clusters: dots - ![]() Ori,
triangles - NGC 6531, stars - NGC 6231.
Ori,
triangles - NGC 6531, stars - NGC 6231.
As shown in Fig. 2 there are a number of sources with EW
[H![]() ]
below the accretion threshold but with H
]
below the accretion threshold but with H
![]() > 270 kms-1. If the line broadening is caused by mass accretion at a rate
>10-11
> 270 kms-1. If the line broadening is caused by mass accretion at a rate
>10-11
![]() ,
we would expect to measure a large EW as well. Besides
accretion, stellar binarity and fast rotation might also be responsible
for the line broadening. In order to decipher the nature of these sources we
also investigated the presence of other emission lines which are
associated with mass accretion (e.g. He I 5876 Å, 6678 Å; e.g. Beristain et al. 2001; Herczeg & Hillenbrand 2008). In the presence of these accretion
diagnostics, we can safely state that the star is accreting.
,
we would expect to measure a large EW as well. Besides
accretion, stellar binarity and fast rotation might also be responsible
for the line broadening. In order to decipher the nature of these sources we
also investigated the presence of other emission lines which are
associated with mass accretion (e.g. He I 5876 Å, 6678 Å; e.g. Beristain et al. 2001; Herczeg & Hillenbrand 2008). In the presence of these accretion
diagnostics, we can safely state that the star is accreting.
Table 2:
Adopted age, spectral type range,
![]() and
and
![]() (when
available) in Figs. 3 and 4.
(when
available) in Figs. 3 and 4.
 Ori
Ori
Ten out of the 216 sources with spectra taken with VIMOS are classified as
members of the ![]() Ori cluster. All of them show emission in the
H
Ori cluster. All of them show emission in the
H![]() line as well as presence of Li. Two out of ten objects are clearly
accreting stars according to the method mentioned above. A further object
(
line as well as presence of Li. Two out of ten objects are clearly
accreting stars according to the method mentioned above. A further object
(![]() Ori # 1: RA = 84.584154, Dec = -2.633792, Sp. Type M5) has a
broad H
Ori # 1: RA = 84.584154, Dec = -2.633792, Sp. Type M5) has a
broad H
![]() (350 kms-1) but H
(350 kms-1) but H![]() EW value (15 Å) below
the accreting threshold. The presence of He emission lines (5876 Å
EW value (15 Å) below
the accreting threshold. The presence of He emission lines (5876 Å
![]() ,
6678 Å
,
6678 Å
![]() )
suggests the presence of hot gas in the
vicinity of the star and hence is a signature of ongoing accretion
(Beristain et al. 2001). The fraction of accreting objects in
)
suggests the presence of hot gas in the
vicinity of the star and hence is a signature of ongoing accretion
(Beristain et al. 2001). The fraction of accreting objects in ![]() Ori
derived here is 3/10 or 30%
Ori
derived here is 3/10 or 30% ![]() 17%
17%![]() . This agrees with the previous
result of Zapatero Osorio et al. (2002, 30-40%), Barrado y Navascués & Martín (2003, 27
. This agrees with the previous
result of Zapatero Osorio et al. (2002, 30-40%), Barrado y Navascués & Martín (2003, 27
![\begin{figure}
\par\includegraphics[width=8.5cm,clip]{12810f3.ps} \vspace*{-2mm}
\end{figure}](/articles/aa/full_html/2010/02/aa12810-09/img32.png)
|
Figure 3: Accreting stars-frequency as a function of age. New data (based on the VIMOS survey) are shown as (red) dots, literature data as (green) squares. Colored version is available in the electronic form. |
| Open with DEXTER | |
![\begin{figure}
\par\includegraphics[width=8.5cm,clip]{12810f4.ps}
\end{figure}](/articles/aa/full_html/2010/02/aa12810-09/img33.png)
|
Figure 4:
|
| Open with DEXTER | |
NGC 6231
Out of 573 sources in the region of NGC 6231 we identified 78
objects as cluster members. The majority of these sources have a spectral
type in the range of K0-M5 (there are three sources of an earlier
spectral type) and show both H![]() emission and strong Li
absorption. Eleven out of 78 objects (all late K type) were identified
based only on the presence of Li. Each of these spectra was compared with a
standard star of an equal spectral type. All these spectra show either a
tiny (EW
emission and strong Li
absorption. Eleven out of 78 objects (all late K type) were identified
based only on the presence of Li. Each of these spectra was compared with a
standard star of an equal spectral type. All these spectra show either a
tiny (EW ![]() 0.1 Å) H
0.1 Å) H![]() emission or small absoption. In the
latter case, the absoption is much smaller than the typical photospheric
absorption for the same spectral type. Three other objects have no
H
emission or small absoption. In the
latter case, the absoption is much smaller than the typical photospheric
absorption for the same spectral type. Three other objects have no
H![]() ,
and the presence of the Li 6707.8 absorption is not
clear. Seven out of the 75 K0-M5 sources in NGC 6231 are consistent with
ongoing mass accretion with both diagnostics. Two more sources have EW
[H
,
and the presence of the Li 6707.8 absorption is not
clear. Seven out of the 75 K0-M5 sources in NGC 6231 are consistent with
ongoing mass accretion with both diagnostics. Two more sources have EW
[H![]() ]
close to the accretion threshold, but large (>270 kms-1)
H
]
close to the accretion threshold, but large (>270 kms-1)
H
![]() (panel K0-K5 in Fig. 2). Many stars with
a spectral type in the range of K6-M2.5 have large H
(panel K0-K5 in Fig. 2). Many stars with
a spectral type in the range of K6-M2.5 have large H
![]() but
small EW [H
but
small EW [H![]() ]. We inspected all of them and found two objects with a
spectral type K7 showing He I 5876 Å in emission (
]. We inspected all of them and found two objects with a
spectral type K7 showing He I 5876 Å in emission (
![]() Å, -0.6 Å
respectively). The evidence of large H
Å, -0.6 Å
respectively). The evidence of large H
![]() together with the He I
emission is most likely due to ongoing mass accretion, and these two stars
are classified as accreting stars. We estimate a fraction of accreting stars
in NGC 6231 of 11/75 or 15 (
together with the He I
emission is most likely due to ongoing mass accretion, and these two stars
are classified as accreting stars. We estimate a fraction of accreting stars
in NGC 6231 of 11/75 or 15 (![]() 5%). We warn the reader that this might
be a lower limit to the actual fraction of accreting stars; further
investigation is needed to disentagle the nature (accretion vs
binarity/rapid rotation) of the systems with large H
5%). We warn the reader that this might
be a lower limit to the actual fraction of accreting stars; further
investigation is needed to disentagle the nature (accretion vs
binarity/rapid rotation) of the systems with large H
![]() (>300 kms-1) but low EW [H
(>300 kms-1) but low EW [H![]() ].
].
NGC 6531
We identified 26 cluster members in NGC 6531 based on the presence of
H![]() emission and presence of Li. 13 other sources show presence
of Li 6708 Å, but have H
emission and presence of Li. 13 other sources show presence
of Li 6708 Å, but have H![]() in absorption. As in the case of NGC
6231, these might be cluster members with no or a reduced chromospheric
activity. We measured the EW of Li 6708 Å of these 13 sources and
compared them with the typical EW of the 26 stars in NGC 6531 showing also
H
in absorption. As in the case of NGC
6231, these might be cluster members with no or a reduced chromospheric
activity. We measured the EW of Li 6708 Å of these 13 sources and
compared them with the typical EW of the 26 stars in NGC 6531 showing also
H![]() emission (0.2 Å < EW Li < 0.6 Å). Ten of the 13 sources
have similar EW and are likely cluster members. The remaining three sources
have EW between 0.1-0.2 Å. Moreover, these are characterized by strong
absorption lines at 5778, 5796, 6284, 6614 Å, which are produced by
diffuse interstellar absorption bands (DIBs). These are probably located in
the background of the cluster and are classified as non-members. Out of the
36 identified members, three objects show broad and strong H
emission (0.2 Å < EW Li < 0.6 Å). Ten of the 13 sources
have similar EW and are likely cluster members. The remaining three sources
have EW between 0.1-0.2 Å. Moreover, these are characterized by strong
absorption lines at 5778, 5796, 6284, 6614 Å, which are produced by
diffuse interstellar absorption bands (DIBs). These are probably located in
the background of the cluster and are classified as non-members. Out of the
36 identified members, three objects show broad and strong H![]() emission consistent with mass accretion. One further object is classified as
an uncertain accreting star. The fraction of accreting stars is then 8
emission consistent with mass accretion. One further object is classified as
an uncertain accreting star. The fraction of accreting stars is then 8 ![]() 5%. Given the large H
5%. Given the large H
![]() (>300 kms-1) of two objects in the
spectral range of M3-M5, the fraction of accreting stars computed here
might be a lower limit. Follow-up observations are needed for these two
sources.
(>300 kms-1) of two objects in the
spectral range of M3-M5, the fraction of accreting stars computed here
might be a lower limit. Follow-up observations are needed for these two
sources.
5 Discussion
The fraction of accreting stars (
![]() )
for each cluster is listed in Table 2 and plotted in Fig. 3 together with literature
data.
)
for each cluster is listed in Table 2 and plotted in Fig. 3 together with literature
data.
The aim of this paper is to trace the evolution of mass accretion with
time. A critical point is the age of the clusters. We adopted the most
recent age measurements (Table 2). For NGC 6231
Sana et al. (2007) find that the bulk of the CTTS has an age between 2-4 Myr,
although with a large age spread. The most recent study of ![]() Ori
suggests an age of 3 Myr (e.g. Caballero 2008). For NGC 6531
Park et al. (2001) measure an age of 7.5
Ori
suggests an age of 3 Myr (e.g. Caballero 2008). For NGC 6531
Park et al. (2001) measure an age of 7.5 ![]() 2 Myr in agreement with
Forbes (1996), who measure 8
2 Myr in agreement with
Forbes (1996), who measure 8 ![]() 3 Myr. For the remaining clusters we
adopt the age provided by WEBDA
3 Myr. For the remaining clusters we
adopt the age provided by WEBDA![]() . For
these clusters the age is estimated by fitting the zero-age-main-sequence
(ZAMS) to the brightest stars of the cluster. We take an accuracy of 30% as
a conservative assumption.
. For
these clusters the age is estimated by fitting the zero-age-main-sequence
(ZAMS) to the brightest stars of the cluster. We take an accuracy of 30% as
a conservative assumption.
In Fig. 3 the fraction of accreting stars as function
of cluster age is shown. The results obtained with VIMOS are shown as filled
circles. Measurements of
![]() exist in the literature for some
clusters. These are are shown as filled squares in Fig. 3 and
are listed in Table 2. We considered only determinations of
exist in the literature for some
clusters. These are are shown as filled squares in Fig. 3 and
are listed in Table 2. We considered only determinations of
![]() ,
using the method of White & Basri (2003) and/or Barrado y Navascués & Martín (2003). The
fraction of accreting stars may vary with spectral type. In the case of
Upper Sco Mohanty et al. (2005) e.g., found an increase of 7% (
,
using the method of White & Basri (2003) and/or Barrado y Navascués & Martín (2003). The
fraction of accreting stars may vary with spectral type. In the case of
Upper Sco Mohanty et al. (2005) e.g., found an increase of 7% (![]() 2%) for a
spectral type earlier than M4 to 20% (
2%) for a
spectral type earlier than M4 to 20% (![]() 10%) for later spectral
types. For the youngest regions,
10%) for later spectral
types. For the youngest regions, ![]() Oph, Taurus, Cha I and IC 348,
Mohanty et al. (2005) find no appreciable variation, within errors, in the
fraction of accreting sources between the two mass ranges. For consistency
with our survey we include here only the results for the spectral types
between K0-M5.
Oph, Taurus, Cha I and IC 348,
Mohanty et al. (2005) find no appreciable variation, within errors, in the
fraction of accreting sources between the two mass ranges. For consistency
with our survey we include here only the results for the spectral types
between K0-M5.
5.1 Evolution of f

The fraction of accreting stars decreases quickly with time within the first
10 Myr. There is a clear trend from the 1.5-2 Myr old regions (
![]() =
60%) down to the 10 Myr old clusters (mean
=
60%) down to the 10 Myr old clusters (mean
![]() = 2%). At the age of 5 Myr
the mean
= 2%). At the age of 5 Myr
the mean
![]() is with
is with ![]() 5% drastically lower than the 3 Myr old
regions of
5% drastically lower than the 3 Myr old
regions of ![]() Ori and NGC 6231 (average 24%). No
accreting stars are found beyond 10 Myr. This agrees well with previous
measurements of the mass accretion timescale by e.g. Mohanty et al. (2005) and Jayawardhana et al. (2006). There are some outliers. The
Ori and NGC 6231 (average 24%). No
accreting stars are found beyond 10 Myr. This agrees well with previous
measurements of the mass accretion timescale by e.g. Mohanty et al. (2005) and Jayawardhana et al. (2006). There are some outliers. The ![]() Cha cluster shows higher
frequency of accretors compared to clusters of an equal age
(e.g. Sicilia-Aguilar et al. 2009). Through this particular association a similar
behavior in the disk frequency is made apparent (from near-infrared
excess). Age and distance are unlikely to be wrong for this well-known
system. Moraux et al. (2007) suggest that most of the low-mass members of the
association have been dispersed by dynamical evolution. The current list of
members of
Cha cluster shows higher
frequency of accretors compared to clusters of an equal age
(e.g. Sicilia-Aguilar et al. 2009). Through this particular association a similar
behavior in the disk frequency is made apparent (from near-infrared
excess). Age and distance are unlikely to be wrong for this well-known
system. Moraux et al. (2007) suggest that most of the low-mass members of the
association have been dispersed by dynamical evolution. The current list of
members of ![]() Cha might be biased towards infrared-excess/H
Cha might be biased towards infrared-excess/H![]() emitting sources. Inversely the very young region of
emitting sources. Inversely the very young region of ![]() Oph lies below
the trend. The statistics in this region are limited by extinction, which may
obscure part of the stellar population (e.g. Mohanty et al. 2005). Moreover,
the result of Mohanty et al. (2005) might be contaminated by an older population
of stars; objects in the periphery of
Oph lies below
the trend. The statistics in this region are limited by extinction, which may
obscure part of the stellar population (e.g. Mohanty et al. 2005). Moreover,
the result of Mohanty et al. (2005) might be contaminated by an older population
of stars; objects in the periphery of ![]() Oph core appear older than
stars in the core itself (Wilking et al. 2005). In the following analysis we
will not include
Oph core appear older than
stars in the core itself (Wilking et al. 2005). In the following analysis we
will not include ![]() Oph and
Oph and ![]() Cha.
Cha.
NGC 6231 (2-4 Myr) also appears to have a low
![]() for its
age. Interestingly, this region hosts many O and B stars. External
photoevaporation (by means of the O, B stars) may accelerate the disk
dissipation.
for its
age. Interestingly, this region hosts many O and B stars. External
photoevaporation (by means of the O, B stars) may accelerate the disk
dissipation.
5.2 f
vs. f

In this section we compare the fraction of accreting stars to the
fraction of stars with near-to-mid infrared excess (
![]() ). The latter is
measured as the fraction of stars having infrared excess in the Spitzer/IRAC
[3.6] - [8.0] bands over the total fraction of stars in the cluster.
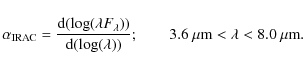
The definition of an excess source is based on the slope (
). The latter is
measured as the fraction of stars having infrared excess in the Spitzer/IRAC
[3.6] - [8.0] bands over the total fraction of stars in the cluster.
The definition of an excess source is based on the slope (![]() )
of the
infrared spectral energy distribution determined from the IRAC [3.6] - [8.0] bands (Lada et al. 2006)
)
of the
infrared spectral energy distribution determined from the IRAC [3.6] - [8.0] bands (Lada et al. 2006)
|
(2) |
Stars with
Interestingly enough, we find for some clusters a lower fractional value
of stars with evidence of ongoing accretion compared to stars with
near-to-mid infrared excess. For example among the 64 K0-M5 stars
identified by Flaherty & Muzerolle (2008) in NGC 2068/71, 39 (61%) of these show a
clear signature of mass accretion, while 45 (70%) stars have IRAC
excess. We note that two of the non-accreting stars in their sample are
identified by strong IRAC excess (ID 416, 843 in Flaherty & Muzerolle 2008),
while one transitional object (ID 281) is a strong accretor. Similarly,
for ![]() Ori we measure an
Ori we measure an
![]() = 30% while
= 30% while
![]() = 35%. This is
consistent with the result of Damjanov et al. (2007) in Chameleon I. They
found a small population of non-accreting objects bearing a dusty inner
disk.
= 35%. This is
consistent with the result of Damjanov et al. (2007) in Chameleon I. They
found a small population of non-accreting objects bearing a dusty inner
disk.
In Fig. 4 we plot
![]() vs.
vs.
![]() for the regions
where both quantities are known. Assuming an exponential decay we fit
for the regions
where both quantities are known. Assuming an exponential decay we fit
![]() and
and
![]() with the following function
with the following function
| (3) |
where C is a constant and it is normalized assuming
5.3 Inner disk dissipation and planet formation
Mass accretion and dust dispersion in the inner disk appear to have different
timescales. At an age of 5 Myr, 95% of the total stellar population
have stopped accreting material at a rate
![]()
![]() ,
while
,
while
![]() 20% of the disks still retain enough dust to produce detectable
infrared excess. In order to sustain the mass accretion at a rate larger
than 10-11
20% of the disks still retain enough dust to produce detectable
infrared excess. In order to sustain the mass accretion at a rate larger
than 10-11
![]() ,
a gas disk reservoir is required. This implies that
at an age of
,
a gas disk reservoir is required. This implies that
at an age of
![]() = 2.3 Myr most of the disk mass is drastically reduced
while at an age of 5 Myr only 5% of the disks have enough gas mass to keep
on accreting material onto the central star. Models of viscous evolution
(e.g. Hartmann et al. 1998) predict a steady decrease of the mass accretion
rate with time, and this might be an explanation for the bimodal evolution
of
= 2.3 Myr most of the disk mass is drastically reduced
while at an age of 5 Myr only 5% of the disks have enough gas mass to keep
on accreting material onto the central star. Models of viscous evolution
(e.g. Hartmann et al. 1998) predict a steady decrease of the mass accretion
rate with time, and this might be an explanation for the bimodal evolution
of
![]() and
and
![]() .
However, the timescale for viscous evolution to stop
accretion (>10 Myr) is much longer than our estimate of
.
However, the timescale for viscous evolution to stop
accretion (>10 Myr) is much longer than our estimate of
![]() (2.3 Myr). The efficiency of viscous evolution might be enhanced if
photoevaporation is also taken into account as first argued by
Clarke et al. (2001). Their so-called ``UV-switch'' model is very efficient in
stopping further accretion as the accretion rate drops below the
photoevaporation rate. The advantage of this is the shorter accretion
timescale. But this model also has a drawback, namely that disk dissipation
following the end of the accretion phase should occur on a viscous timescale
(105 yr). This is in contrast with the relatively high number of stars
still retaining their dusty disk (e.g. 20% at 5 Myr) after accretion
ceases.
(2.3 Myr). The efficiency of viscous evolution might be enhanced if
photoevaporation is also taken into account as first argued by
Clarke et al. (2001). Their so-called ``UV-switch'' model is very efficient in
stopping further accretion as the accretion rate drops below the
photoevaporation rate. The advantage of this is the shorter accretion
timescale. But this model also has a drawback, namely that disk dissipation
following the end of the accretion phase should occur on a viscous timescale
(105 yr). This is in contrast with the relatively high number of stars
still retaining their dusty disk (e.g. 20% at 5 Myr) after accretion
ceases.
Another possible explanation is that the accretion onto the central star is stopped by planet formation and migration in the inner disk. If a giant planet forms/migrates to the inner region of the disk, it may stop further accretion onto the star. In this respect, recent self-consistent numerical simulations of planet formation by for instance Thommes et al. (2008) are consistent with this scenario. In these simulations planetesimal formation occurs over a large range of disk radii. As soon as the cores of giant planets form, they migrate to small radii (<1 AU). This happens very fast, within 1-2 Myr. The disk surface density drops to zero, and so does the accretion onto the star, within the planet's orbit. Dust grains beyond the orbit of the planet might instead still absorb and re-emit the stellar light and produce the measured IRAC excess.
6 Conclusion
We presented an analysis of the evolution of the mass accretion in
PMSs in the spectral type range K0-M5. These are the main results: (1)
the fraction of stars with ongoing mass accretion decreases fast with time,
going from ![]() 60% at 1.5-2 Myr down to
60% at 1.5-2 Myr down to ![]() 2% at 10 Myr; (2) this
fraction is systematically lower than the fraction of stars showing
near-to-mid infrared excess; (3) mass accretion and dust dissipation in the
inner disk appear to have different characteristic timescales of 2.3 and 3 Myr
respectively; (4) within 5 Myr the mass accretion rate of 95% of the stellar
population drops below our detection limit of 10-11
2% at 10 Myr; (2) this
fraction is systematically lower than the fraction of stars showing
near-to-mid infrared excess; (3) mass accretion and dust dissipation in the
inner disk appear to have different characteristic timescales of 2.3 and 3 Myr
respectively; (4) within 5 Myr the mass accretion rate of 95% of the stellar
population drops below our detection limit of 10-11
![]() .
While viscous
evolution and photoevaporation might be unable to slow down accretion (and
leave a substantial dust mass) on such a short timescale, planet formation
and/or migration in the inner disk (few AU) might be a viable mechanism to
halt further accretion onto the central star.
.
While viscous
evolution and photoevaporation might be unable to slow down accretion (and
leave a substantial dust mass) on such a short timescale, planet formation
and/or migration in the inner disk (few AU) might be a viable mechanism to
halt further accretion onto the central star.
We thanks the ESO staff for performing the VIMOS observations in service mode. This research has made use of the SIMBAD database, operated at CDS, Strasbourg, France. We are grateful to the anonymous referee for his comments and suggestions.
References
- Alibert, Y., Mordasini, C., & Benz, W. 2004, A&A, 417, L25 [NASA ADS] [CrossRef] [EDP Sciences] [Google Scholar]
- Alibert, Y., Mordasini, C., Benz, W., & Winisdoerffer, C. 2005, A&A, 434, 343 [NASA ADS] [CrossRef] [EDP Sciences] [Google Scholar]
- Allen, L. E., & Strom, K. M. 1995, AJ, 109, 1379 [NASA ADS] [CrossRef] [Google Scholar]
- Barrado y Navascués, D., & Martín, E. L. 2003, AJ, 126, 2997 [NASA ADS] [CrossRef] [Google Scholar]
- Basri, G., Martin, E. L., & Bertout, C. 1991, A&A, 252, 625 [NASA ADS] [Google Scholar]
- Beristain, G., Edwards, S., & Kwan, J. 2001, ApJ, 551, 1037 [NASA ADS] [CrossRef] [Google Scholar]
- Boss, A. P. 1997, Science, 276, 1836 [NASA ADS] [CrossRef] [Google Scholar]
- Boss, A. P. 1998, ApJ, 503, 923 [NASA ADS] [CrossRef] [Google Scholar]
- Bouwman, J., Lawson, W. A., Dominik, C., et al. 2006, ApJ, 653, L57 [NASA ADS] [CrossRef] [Google Scholar]
- Briceño, C., Hartmann, L., Stauffer, J., & Martín, E. 1998, AJ, 115, 2074 [NASA ADS] [CrossRef] [Google Scholar]
- Briceño, C., Hartmann, L., Hernández, J., et al. 2007, ApJ, 661, 1119 [NASA ADS] [CrossRef] [Google Scholar]
- Caballero, J. A. 2008, MNRAS, 383, 375 [NASA ADS] [Google Scholar]
- Carpenter, J. M., Mamajek, E. E., Hillenbrand, L. A., & Meyer, M. R. 2006, ApJ, 651, L49 [NASA ADS] [CrossRef] [Google Scholar]
- Clarke, C. J., Gendrin, A., & Sotomayor, M. 2001, MNRAS, 328, 485 [NASA ADS] [CrossRef] [Google Scholar]
- Dahm, S. E., & Hillenbrand, L. A. 2007, AJ, 133, 2072 [NASA ADS] [CrossRef] [Google Scholar]
- Damjanov, I., Jayawardhana, R., Scholz, A., et al. 2007, ApJ, 670, 1337 [NASA ADS] [CrossRef] [Google Scholar]
- Durisen, R. H. E. A. 2007, in PPV, ed. B. Reipurth, D. Jewitt, & K. Keil, 607 [Google Scholar]
- Flaherty, K. M., & Muzerolle, J. 2008, AJ, 135, 966 [NASA ADS] [CrossRef] [Google Scholar]
- Forbes, D. 1996, AJ, 112, 1073 [NASA ADS] [CrossRef] [Google Scholar]
- Haisch, Jr., K. E., Lada, E. A., & Lada, C. J. 2001, ApJ, 553, L153 [NASA ADS] [CrossRef] [Google Scholar]
- Haisch, Jr., K. E., Jayawardhana, R., & Alves, J. 2005, ApJ, 627, L57 [NASA ADS] [CrossRef] [Google Scholar]
- Hartmann, L., Calvet, N., Gullbring, E., & D'Alessio, P. 1998, ApJ, 495, 385 [NASA ADS] [CrossRef] [Google Scholar]
- Hartmann, L., Megeath, S. T., Allen, L., et al. 2005, ApJ, 629, 881 [NASA ADS] [CrossRef] [Google Scholar]
- Henning, T. 2008, Phys. Scr., T 130, 014019 [Google Scholar]
- Herczeg, G. J., & Hillenbrand, L. A. 2008, ApJ, 681, 594 [NASA ADS] [CrossRef] [Google Scholar]
- Hernández, J., Hartmann, L., Megeath, T., et al. 2007, ApJ, 662, 1067 [NASA ADS] [CrossRef] [Google Scholar]
- Hillenbrand, L. A. 2008, Phys. Scr., T 130, 014024 [Google Scholar]
- Horne, K. 1986, PASP, 98, 609 [NASA ADS] [CrossRef] [EDP Sciences] [Google Scholar]
- Jayawardhana, R., Coffey, J., Scholz, A., Brandeker, A., & van Kerkwijk, M. H. 2006, ApJ, 648, 1206 [NASA ADS] [CrossRef] [Google Scholar]
- Jeffries, R. D., Oliveira, J. M., Naylor, T., Mayne, N. J., & Littlefair, S. P. 2007, MNRAS, 376, 580 [NASA ADS] [CrossRef] [Google Scholar]
- Kharchenko, N. V., Piskunov, A. E., Röser, S., Schilbach, E., & Scholz, R.-D. 2005, A&A, 438, 1163 [NASA ADS] [CrossRef] [EDP Sciences] [MathSciNet] [Google Scholar]
- Lada, C. J., Muench, A. A., Luhman, K. L., et al. 2006, AJ, 131, 1574 [NASA ADS] [CrossRef] [Google Scholar]
- LeFevre, O., Saisse, M., Mancini, D., et al. 2003, in SPIE Conf. Ser. 4841, ed. M. Iye, & A. F. M. Moorwood, 1670 [Google Scholar]
- Luhman, K. L., Allen, L. E., Allen, P. R., et al. 2008, ApJ, 675, 1375 [NASA ADS] [CrossRef] [Google Scholar]
- Mentuch, E., Brandeker, A., van Kerkwijk, M. H., Jayawardhana, R., & Hauschildt, P. H. 2008, ApJ, 689, 1127 [NASA ADS] [CrossRef] [Google Scholar]
- Mohanty, S., Jayawardhana, R., & Basri, G. 2005, ApJ, 626, 498 [NASA ADS] [CrossRef] [Google Scholar]
- Moraux, E., Lawson, W. A., & Clarke, C. 2007, A&A, 473, 163 [NASA ADS] [CrossRef] [EDP Sciences] [Google Scholar]
- Mordasini, C., Alibert, Y., Benz, W., & Naef, D. 2008, in ASPC Seri. 398, ed. D. Fischer, F. A. Rasio, S. E. Thorsett, & A. Wolszczan, 235 [Google Scholar]
- Natta, A., Testi, L., Muzerolle, J., et al. 2004, A&A, 424, 603 [NASA ADS] [CrossRef] [EDP Sciences] [Google Scholar]
- Oliveira, J. M., Jeffries, R. D., Devey, C. R., et al. 2003, MNRAS, 342, 651 [NASA ADS] [CrossRef] [Google Scholar]
- Oliveira, J. M., Jeffries, R. D., van Loon, J. T., & Rushton, M. T. 2006, MNRAS, 369, 272 [NASA ADS] [CrossRef] [Google Scholar]
- Park, B.-G., Sung, H., & Kang, Y. H. 2001, J. Korean Astron. Soc., 34, 149 [NASA ADS] [Google Scholar]
- Pollack, J. B., Hubickyj, O., Bodenheimer, P., et al. 1996, Icarus, 124, 62 [NASA ADS] [CrossRef] [Google Scholar]
- Sana, H., Rauw, G., Sung, H., Gosset, E., & Vreux, J.-M. 2007, MNRAS, 377, 945 [NASA ADS] [CrossRef] [Google Scholar]
- Schmidt, E. G. 1982, AJ, 87, 1197 [NASA ADS] [CrossRef] [Google Scholar]
- Sicilia-Aguilar, A., Hartmann, L. W., Hernández, J., Briceño, C., & Calvet, N. 2005, AJ, 130, 188 [NASA ADS] [CrossRef] [Google Scholar]
- Sicilia-Aguilar, A., Hartmann, L. W., Fürész, G., et al. 2006, AJ, 132, 2135 [NASA ADS] [CrossRef] [Google Scholar]
- Sicilia-Aguilar, A., Bouwman, J., Juhász, A., et al. 2009, ApJ, 701, 1188 [NASA ADS] [CrossRef] [Google Scholar]
- Thommes, E. W., Matsumura, S., & Rasio, F. A. 2008, Science, 321, 814 [NASA ADS] [CrossRef] [PubMed] [Google Scholar]
- White, R. J., & Basri, G. 2003, ApJ, 582, 1109 [NASA ADS] [CrossRef] [Google Scholar]
- Wilking, B. A., Meyer, M. R., Robinson, J. G., & Greene, T. P. 2005, AJ, 130, 1733 [NASA ADS] [CrossRef] [Google Scholar]
- Winston, E., Megeath, S. T., Wolk, S. J., et al. 2009, AJ, 137, 4777 [NASA ADS] [CrossRef] [Google Scholar]
- Zapatero Osorio, M. R., Béjar, V. J. S., Pavlenko, Y., et al. 2002, A&A, 384, 937 [NASA ADS] [CrossRef] [EDP Sciences] [Google Scholar]
- Zuckerman, B., & Song, I. 2004, ARA&A, 42, 685 [NASA ADS] [CrossRef] [MathSciNet] [Google Scholar]
Footnotes
- ...
![[*]](/icons/foot_motif.png)
- Based on observations collected at the European Southern Observatory, Paranal, Chile (Proposal ID: 078.C-0282; 081.C-0208).
- ... VIMOS
- http://www.eso.org/sci/facilities/paranal/instruments/vimos/
- ...%
- Computed as
 .
.
- ... WEBDA
- http://www.univie.ac.at/webda/, operated at the Institute for Astronomy of the University of Vienna.
All Tables
Table 1: Regions observed with VIMOS.
Table 2:
Adopted age, spectral type range,
![]() and
and
![]() (when
available) in Figs. 3 and 4.
(when
available) in Figs. 3 and 4.
All Figures
|
|
Figure 1: Some examples of VIMOS spectra. |
| Open with DEXTER | |
| In the text | |
|
|
Figure 2:
EW [H |
| Open with DEXTER | |
| In the text | |
|
|
Figure 3: Accreting stars-frequency as a function of age. New data (based on the VIMOS survey) are shown as (red) dots, literature data as (green) squares. Colored version is available in the electronic form. |
| Open with DEXTER | |
| In the text | |
|
|
Figure 4:
|
| Open with DEXTER | |
| In the text | |
Copyright ESO 2010
Current usage metrics show cumulative count of Article Views (full-text article views including HTML views, PDF and ePub downloads, according to the available data) and Abstracts Views on Vision4Press platform.
Data correspond to usage on the plateform after 2015. The current usage metrics is available 48-96 hours after online publication and is updated daily on week days.
Initial download of the metrics may take a while.