| Issue |
A&A
Volume 510, February 2010
|
|
|---|---|---|
| Article Number | A85 | |
| Number of page(s) | 9 | |
| Section | Interstellar and circumstellar matter | |
| DOI | https://doi.org/10.1051/0004-6361/200810820 | |
| Published online | 16 February 2010 | |
The abundance of HNCO and its use as a diagnostic of environment
D. M. Tideswell1 - G. A. Fuller1 - T. J. Millar2 - A. J. Markwick1
1 - Jodrell Bank Centre for Astrophysics, Alan Turing Building, School
of Physics and Astronomy, The University of Manchester, Oxford Road,
Manchester M13 9PL, UK
2 - Astrophysics Research Centre, School of Mathematics and Physics,
Queen's University Belfast, Belfast, BT7 1NN, UK
Received 18 August 2008 / Accepted 22 September 2009
Abstract
Aims. We aim to investigate the chemistry and gas
phase abundance of HNCO and the variation of the HNCO/CS abundance
ratio as a diagnostic of the physics and chemistry in regions of
massive star formation.
Methods. A numerical-chemical model has been
developed which self-consistently follows the chemical evolution of a
hot core. The model comprises of two distinct stages. The first stage
follows the isothermal, modified free-fall collapse of a molecular dark
cloud. This is immediately followed by an increase in temperature which
represents the switch on of a central massive star and the subsequent
evolution of the chemistry in a hot, dense gas cloud (the hot core).
During the collapse phase, gas species are allowed to accrete on to
grain surfaces where they can participate in further reactions. During
the hot core phase surface species thermally desorb back in to the
ambient gas and further chemical evolution takes place. For comparison,
the chemical network was also used to model a simple dark cloud and
photodissociation regions.
Results. Our investigation reveals that HNCO is
inefficiently formed when only gas-phase formation pathways are
considered in the chemical network with reaction rates consistent with
existing laboratory data. This is particularly true at low temperatures
but also in regions with temperatures up to ![]() 200 K. Using currently measured gas
phase reaction rates, obtaining the observed HNCO abundances requires
its formation on grain surfaces - similar to other ``hot core'' species
such as CH3OH. However our model shows that the
gas phase HNCO in hot cores is not a simple direct product of the
evaporation of grain mantles. We also show that the HNCO/CS abundance
ratio varies as a function of time in hot cores and can match the range
of values observed. This ratio is not unambiguously related to the
ambient UV field as been suggested - our results are inconsistent with
the hypothesis of Martín et al. (2008, ApJ, 678, 245). In
addition, our results show that this ratio is extremely sensitive to
the initial sulphur abundance. We find that the ratio grows
monotonically with time with an absolute value which scales
approximately linearly with the S abundance at early times.
200 K. Using currently measured gas
phase reaction rates, obtaining the observed HNCO abundances requires
its formation on grain surfaces - similar to other ``hot core'' species
such as CH3OH. However our model shows that the
gas phase HNCO in hot cores is not a simple direct product of the
evaporation of grain mantles. We also show that the HNCO/CS abundance
ratio varies as a function of time in hot cores and can match the range
of values observed. This ratio is not unambiguously related to the
ambient UV field as been suggested - our results are inconsistent with
the hypothesis of Martín et al. (2008, ApJ, 678, 245). In
addition, our results show that this ratio is extremely sensitive to
the initial sulphur abundance. We find that the ratio grows
monotonically with time with an absolute value which scales
approximately linearly with the S abundance at early times.
Key words: astrochemistry - stars: formation
1 Introduction
The molecule HNCO (isocyanic acid) was first detected in the
interstellar medium over 30 years ago (Snyder
& Buhl 1972) in the Sgr B2
molecular cloud complex where its distribution was found to be
spatially extended with relatively strong emission. Since its
discovery, HNCO has been subsequently observed in several other
molecular clouds, including the dark cloud TMC-1
(e.g. Goldsmith
et al. 1982; Brown 1981; Jackson et al. 1984). In
the survey of 18
molecular clouds conducted by Jackson
et al. (1984), HNCO emission was
detected in seven sources with an average excitation temperature of
12 K, suggesting that this molecule was tracing cold
gas. Jackson et al. (1984)
proposed that HNCO was a dense gas tracer due to
the coincidence of the emission with regions of high density
(
![]() ).
A larger survey of 81 molecular
clouds was conducted by Zinchenko
et al. (2000). They reported a 70%
detection rate with typical fractional abundances relative to the
total hydrogen number density,
).
A larger survey of 81 molecular
clouds was conducted by Zinchenko
et al. (2000). They reported a 70%
detection rate with typical fractional abundances relative to the
total hydrogen number density, ![]() ,
of
,
of ![]() 10-9
and
a wide range of rotational temperatures from 10 K to
500 K. Three of
the objects were mapped and showed the emission region to be compact
and centrally peaked.
10-9
and
a wide range of rotational temperatures from 10 K to
500 K. Three of
the objects were mapped and showed the emission region to be compact
and centrally peaked.
Isocyanic acid has also been detected in hot cores (HCs), the
sites of early
stage, high mass star-formation including G34.3+0.15 (MacDonald et al. 1996),
W3(H2O) (Helmich
& van Dishoeck 1997) and Sgr B2; in the N, M and
NW cores
(Nummelin et al. 2000).
A survey towards seven high-mass star forming regions by
Bisschop et al. (2007)
identified HNCO with fractional abundances relative to
![]() of between
of between ![]() and
and ![]() and
excitation temperatures from 64 K to 278 K. The
observations suggested that
HNCO can also trace much warmer gas - consistent with the findings of
Zinchenko et al. (2000)
and as such could be a potential indicator of star formation
activity.
and
excitation temperatures from 64 K to 278 K. The
observations suggested that
HNCO can also trace much warmer gas - consistent with the findings of
Zinchenko et al. (2000)
and as such could be a potential indicator of star formation
activity.
A recent multitransition study of 13 molecular clouds towards the Galactic Centre was conducted by Martín et al. (2008). The sources were selected to represent a range of physical conditions and included photodissociation regions (PDRs) along with HCs and giant molecular clouds. Martín et al. (2008) compared the CS abundance, a species used as a dense gas tracer and regarded as a tracer of star formation sites (Bronfman et al. 1996), to that of HNCO for each of the sources. They found that the ratio of the abundance of HNCO to that of CS (as traced by 13CS) was smaller for regions in which the FUV radiation is enhanced (PDRs), perhaps indicating that HNCO is more sensitive than CS to FUV photodissociation. The HNCO/CS ratio was systematically smaller in PDR-like regions by approximately two orders of magnitude than in the giant clouds. HCs were found to have intermediate values. It was therefore proposed that the HNCO/CS abundance ratio may provide a useful tool in distinguishing between shock and radiation (FUV) activity in molecular clouds. However, the Martín et al. (2008) survey only observed a limited sample towards the Galactic Centre and before the usefulness of this possible tracer can be established more complete surveys and a theoretical understanding of the processes involved are desirable.
Since the detection of HNCO there has been much speculation as to how this molecule forms but there have been few chemical models developed which incorporate an HNCO reaction network. Some authors have considered formation only in the gas phase (e.g. Iglesias 1977; Turner et al. 1999) whilst others have modelled the molecule's formation on grain surfaces (e.g. Garrod et al. 2008). Here we reconsider these processes and motivated by the observations of Martín et al. (2008), construct a model for a hot core including both gas phase and grain surface formation and destruction of HNCO. We set out to model both the HNCO abundance and the HNCO/CS ratio as a function of time for such a region. We also aim to explore the response of the gas-phase formation of HNCO to changing physical conditions. Besides modelling HNCO in hot cores, simple models of a dark cloud and PDRs are also presented for comparison.
2 Model descriptions
Our hot core model consists of two distinct stages. The first stage is the collapsing cloud (CC) phase which follows the isothermal collapse of a dark molecular cloud whilst the second stage follows the evolution at constant density and a specified temperature - this is the HC phase. Along with the CC and HC models simple dark cloud (DC) and PDR models were also produced. These models were similar to the HC models in that no collapse was included but different physical conditions were used. All the models described in this paper were single point models.
2.1 Physical model
The CC model begins at a time t = 0 with an
homogeneous dark molecular
cloud at a temperature, T and an initial total
hydrogen number
density of ![]() .
The total hydrogen number
density is defined as
.
The total hydrogen number
density is defined as ![]() and is equal to the cloud's density. It was assumed that the cloud
was shielded by a visual extinction,
and is equal to the cloud's density. It was assumed that the cloud
was shielded by a visual extinction, ![]() ,
of 15 magnitudes
and the standard Galactic UV radiation field and cosmic ray
ionisation
rates were adopted. These physical conditions were chosen to be
representative of a typical Galactic molecular cloud (e.g. Millar & Herbst 1990). The
cloud was then allowed to collapse
isothermally following the modified free-fall collapse formula
(see Spitzer 1978);
,
of 15 magnitudes
and the standard Galactic UV radiation field and cosmic ray
ionisation
rates were adopted. These physical conditions were chosen to be
representative of a typical Galactic molecular cloud (e.g. Millar & Herbst 1990). The
cloud was then allowed to collapse
isothermally following the modified free-fall collapse formula
(see Spitzer 1978);
![\begin{displaymath}
\frac{\textrm{d}n(t)}{\textrm{d}t} \!= \!B \left( \frac{n(t)...
...!-\! 1 \right] \right\}^{1/2}\textrm{cm}^{-3} \textrm{s}^{-1},
\end{displaymath}](/articles/aa/full_html/2010/02/aa10820-08/img12.png)
where B is the retardation factor and a value of 0.7 was adopted following Rawlings et al. (1992),
The collapse was halted once ![]() which occurs after approximately
which occurs after approximately ![]() years.
This density was chosen to be representative of a typical hot
core. As soon as this density was reached the model terminated and
this was considered to be the end of the CC stage. The final chemical
states of these collapse models were used as the initial chemistry of
the subsequent hot core phases. A summary of the physical parameters
adopted for the seven CC models used in this work is given in
Table 1.
years.
This density was chosen to be representative of a typical hot
core. As soon as this density was reached the model terminated and
this was considered to be the end of the CC stage. The final chemical
states of these collapse models were used as the initial chemistry of
the subsequent hot core phases. A summary of the physical parameters
adopted for the seven CC models used in this work is given in
Table 1.
Table 1: Summary of the seven collapsing cloud models.
The HC model represents the second stage of the overall
evolution. The HC was considered to be an homogeneous cloud at the
final density reached at the end of the collapse phase,
![]() ,
in which the
,
in which the
![]() was high
enough that the influence of external FUV
photons is negligible. For the duration of the HC model these
physical conditions remained fixed.
was high
enough that the influence of external FUV
photons is negligible. For the duration of the HC model these
physical conditions remained fixed.
A total of 10 HC models were produced. Models 1 through 4 all had the same physical conditions including a temperature of 200 K, meant to represent the heating by a newly formed central star. The four models differ in their chemical networks. On the other hand, models 5 to 10 all had the same chemistry but differing temperatures (the temperature of the initial the collapsing clouds for these models also differed). A summary of these models can be seen in Table 2
In order to follow chemistry on dust surfaces it was necessary
to
include dust grains in the models. By assuming a gas mass to dust mass
ratio of 100, the dust number density (relative to ![]() )
was
calculated to be
)
was
calculated to be ![]() .
A single population of
spherical dust grains was then assumed with each grain having a radius
of 10-5 cm. The total number of binding sites on
each grain was approximately 106 assuming a
surface density of
.
A single population of
spherical dust grains was then assumed with each grain having a radius
of 10-5 cm. The total number of binding sites on
each grain was approximately 106 assuming a
surface density of ![]() .
.
The DC and PDR models were modelled in a similar fashion to
the HC. The
physical conditions were kept constant in each case and no collapse was
included. The DC was modelled using a T=10 K,
![]() and an
and an ![]() ,
whilst the PDR model adopted
conditions representative of the Horsehead nebula (Habart et al. 2005); T=50 K,
,
whilst the PDR model adopted
conditions representative of the Horsehead nebula (Habart et al. 2005); T=50 K,
![]() ,
,
![]() and an
enhanced FUV radiation field equal to 60 times the
interstellar value as used
in all the other models. In order to mimic the effects of
self-shielding of H2 and CO, which is not
explicitly included in the code, the photodissociation rates for both
these species were set to zero in the PDR models. All the DC and PDR
models produced in this work are also summarised
in Table 2.
A range of PDR models were run to demonstrate the effect of different
aspects of the HNCO chemistry, different densities and different
initial chemical compositions, either atomic or evolved from a
collapsing cloud. A very dense PDR with an initially evolved chemistry
such as models PDR4 and PDR5 were explored to represent clumps exposed
to the UV radiation from a very nearby young massive star.
and an
enhanced FUV radiation field equal to 60 times the
interstellar value as used
in all the other models. In order to mimic the effects of
self-shielding of H2 and CO, which is not
explicitly included in the code, the photodissociation rates for both
these species were set to zero in the PDR models. All the DC and PDR
models produced in this work are also summarised
in Table 2.
A range of PDR models were run to demonstrate the effect of different
aspects of the HNCO chemistry, different densities and different
initial chemical compositions, either atomic or evolved from a
collapsing cloud. A very dense PDR with an initially evolved chemistry
such as models PDR4 and PDR5 were explored to represent clumps exposed
to the UV radiation from a very nearby young massive star.
Table 2: Summary of the dark cloud (DC), hot core (HC) and PDR models used to model the time dependent HNCO gas-phase abundance.
Table 3: Standard initial chemical abundances relative to the total hydrogen number density.
Table 4: Key reactions included in the chemical network relevant to the formation of HNCO.
2.2 Chemical model
For the CC and DC models, along with PDR1, PDR2 and PDR3, all
species
were initially present in their elemental (atomic) form. The only
exception was hydrogen which was assumed to be predominantly molecular
with only a small fraction present as atoms. These initial abundances
(relative to ![]() )
are given in Table 3.
For
the HC models, along with PDR4 and PDR5, an evolved initial chemistry
was used. The initial abundances at the start of these models used
the abundances taken from a CC model. All the HC models and PDR4 used
abundances taken from a CC at the final density,
)
are given in Table 3.
For
the HC models, along with PDR4 and PDR5, an evolved initial chemistry
was used. The initial abundances at the start of these models used
the abundances taken from a CC model. All the HC models and PDR4 used
abundances taken from a CC at the final density,
![]() cm-3,
whereas PDR5 used abundances from a CC
model at an earlier stage in the collapse. In this case the density
reached in the collapse was equal
cm-3,
whereas PDR5 used abundances from a CC
model at an earlier stage in the collapse. In this case the density
reached in the collapse was equal ![]() cm-3.
cm-3.
For all the models, once the chemistry had been initialised, the subsequent evolution of all species was followed via a chemical reaction network. This network included both reactions in the gas phase and on dust grain surfaces, along with the coupling mechanisms of accretion and thermal desorption only.
The gas-phase chemistry included all the reactions from the
latest UMIST
database for astrochemistry (UDfA![]() ),
Rate06
(Woodall et al. 2007).
For the grain-surface chemistry over 200 reactions were
included from Allen & Robinson
(1977), Hasegawa
et al. (1992) and Hasegawa
& Herbst (1993). Reactions
on the surface were treated using the modified rate equation method as
used by
Ruffle & Herbst (2000).
),
Rate06
(Woodall et al. 2007).
For the grain-surface chemistry over 200 reactions were
included from Allen & Robinson
(1977), Hasegawa
et al. (1992) and Hasegawa
& Herbst (1993). Reactions
on the surface were treated using the modified rate equation method as
used by
Ruffle & Herbst (2000).
In order to more completely model the HNCO gas-phase abundance some additional chemistry was included. Five surface reactions involving HNCO were taken from the expanded OSU gas-grain reaction network (Garrod et al. 2008) comprising of a single formation path (reaction b in Table 4) plus four destruction mechanisms. This surface chemistry was complemented by some gas phase reactions (also from Garrod et al. 2008) which followed the destruction of four new species (HNCHO, HNCOCHO, HNCONH and HNCOOH) formed from surface processing of HNCO. The destruction of HNCO in the gas phase was also included. This followed the treatment of Turner et al. (1999) and included the reactions between HNCO and the following species; H+, H3+, He+, C+, H3O+, CO+, HCO+, OCN+ and HNCO+. The rate coefficients for these reactions were taken from the ion-neutral reaction database compiled by Anicich (2004). The photodestruction of HNCO by FUV photons and cosmic ray induced photodissociation was also incorporated (Roberge et al. 1991; Gredel et al. 1989). Reactions with ions, particularly H3+ and He+ dominate the destruction of HNCO in both dark clouds and hot cores.
Two gas-phase formation reactions for
HNCO were added (reactions c and d in Table 4). The
first reaction (c) is a neutral-neutral reaction whilst the
second (d)
is the dissociative recombination of H2NCO+.
For reaction c
the rate coefficient is poorly known. Turner
et al. (1999) adopted a value
of 10-13 cm3 s-1
in their dark cloud model. However the
energy barrier for this reaction may be much larger than suggested by
this number and as such this reaction may only become significant in
regions much warmer than dark clouds. The rate coefficient for this
reaction has been measured but only at temperatures above
300 K (see
the NIST chemical kinetics database![]() ).
A fit to the
available data provides an expression for the temperature dependent
rate coefficient;
).
A fit to the
available data provides an expression for the temperature dependent
rate coefficient;
where T is the temperature. At 10 K this gives a considerably smaller value than that used by Turner et al. (1999). We used model DC1 to examine how the rate of reaction c affects the HNCO abundance - the model was run several times, each time using a different value for the rate coefficient ranging from 10-22 cm3 s-1 to 10-8 cm3 s-1 (increasing the value by two orders of magnitude each time). For all other models in which reaction c was included the rate was calculated using Eq. (2).
Three further reactions were added that form ``parent'' species needed for the formation of HNCO. Reactions e and f are ion-neutral reactions that are the first two reactions in a three stage process. The actual formation of HNCO in this reaction channel is via reaction d (Iglesias 1977). The rates of these reactions are calculated using the Langevin rate. The final reaction (g) is a charge exchange reaction between He+ and OCN which produces OCN+. This reaction represents a third, new, reaction channel between these two species since the UDfA already contains two reactions between He+and OCN. A rate coefficient of 10-9 cm3 s-1 was adopted for reaction g - representative of charge exchange reactions.
All models were allowed to evolve chemically for 107 years, except for the collapsing cloud models which were stopped once the final density was reached.
3 Results
3.1 Gas phase formation of HNCO in dark clouds
For the first part of our investigation, using DC1, we explored the
effect the rate coefficient for reaction c has on the
abundance of
HNCO in the gas phase. Figure 1 shows the HNCO
abundance
along with that of OCN for a range assumed rate coefficients for
reaction c. For a rate coefficient of 10-18 cm3 s-1and
above it is possible to achieve HNCO abundances within the
observed range of ![]() to
to ![]() (MacDonald
et al. 1996; Bisschop et al. 2007).
Equation (2)
implies that for the
(MacDonald
et al. 1996; Bisschop et al. 2007).
Equation (2)
implies that for the ![]() 4500 K
barrier which
laboratory data (NIST) infer for this reaction, temperatures above
277 K are required to reach this value of the rate coefficient
for
reaction c. Alternatively for this reaction to be effective at
a gas
temperature of 10 K, the barrier would have to be less than
4500 K
barrier which
laboratory data (NIST) infer for this reaction, temperatures above
277 K are required to reach this value of the rate coefficient
for
reaction c. Alternatively for this reaction to be effective at
a gas
temperature of 10 K, the barrier would have to be less than
![]() 165 K,
much lower than measurements indicate. In other words, at the
temperatures of dark molecular clouds these reactions do not occur.
165 K,
much lower than measurements indicate. In other words, at the
temperatures of dark molecular clouds these reactions do not occur.
![\begin{figure}
\par\includegraphics[width=8.5cm,clip]{10820f1a.ps}
\includegraphics[width=8.5cm,clip]{10820f1b.ps}
\end{figure}](/articles/aa/full_html/2010/02/aa10820-08/img37.png)
|
Figure 1:
Time dependent, gas phase relative abundances for HNCO (top)
and OCN (bottom) as a function of rate coefficient
for reaction c in a non-collapsing dark cloud (model DC1). All
other HNCO formation pathways are prohibited, both in the gas-phase and
on grain surfaces. Reaction g has rate coefficient of 0.0. The shaded
region defines the range of values for the observed HNCO abundance, |
| Open with DEXTER | |
Model DC2 illustrates how the other gas-phase formation route (via
reaction d) influences the HNCO abundance. Reaction c
was also
included in this model and the rate was varied as before.
Figure 2
shows the HNCO and OCN abundances along with those for
OCN+. A lower limit for the fractional HNCO
abundance (at steady
state) is effectively set at ![]() .
This corresponds to
the DC2 model with a rate cofficient of 0 for reaction c (the
solid
red line in Fig. 2).
In this model HNCO is
underabundant compared to observations by over 2 orders of
magnitude.
However, as seen for DC1, when the rate coefficient for
reaction c
increases, it is possible to achieve higher abundances. There is
however very little difference between DC1 and DC2 for those models
with non-zero rate coefficients for reaction c.
Figure 3
shows the gas-phase abundance for the key reactants/products involved
in the gas-phase production of HNCO (model DC3). This shows that
there is OCN in the gas-phase but due to the low temperature
this is not converted into HNCO. Instead, at low temperatures HNCO
formation through reaction d (via reactions e and f)
clearly
dominates.
.
This corresponds to
the DC2 model with a rate cofficient of 0 for reaction c (the
solid
red line in Fig. 2).
In this model HNCO is
underabundant compared to observations by over 2 orders of
magnitude.
However, as seen for DC1, when the rate coefficient for
reaction c
increases, it is possible to achieve higher abundances. There is
however very little difference between DC1 and DC2 for those models
with non-zero rate coefficients for reaction c.
Figure 3
shows the gas-phase abundance for the key reactants/products involved
in the gas-phase production of HNCO (model DC3). This shows that
there is OCN in the gas-phase but due to the low temperature
this is not converted into HNCO. Instead, at low temperatures HNCO
formation through reaction d (via reactions e and f)
clearly
dominates.
![\begin{figure}
\par\includegraphics[width=8cm,clip]{10820f2a.ps}
\includegraph...
...clip]{10820f2b.ps}
\includegraphics[width=8cm,clip]{10820f2c.ps}
\end{figure}](/articles/aa/full_html/2010/02/aa10820-08/img39.png)
|
Figure 2: Time dependent, gas phase relative abundances for HNCO ( top), OCN ( middle) and OCN+ ( bottom) as a function of rate coefficient for reaction c in a non-collapsing dark cloud (model DC2). All gas-phase HNCO formation pathways are allowed; grain-surface reactions are prohibited. Reaction g has rate coefficient of 0.0. The shaded region defines the range of values for the observed HNCO abundance |
| Open with DEXTER | |
![\begin{figure}
\par\includegraphics[width=8cm,clip]{10820f3.ps}
\end{figure}](/articles/aa/full_html/2010/02/aa10820-08/img40.png)
|
Figure 3: Time dependent, gas phase relative abundances for various species in a non-collapsing dark cloud using only reactions d, e and f to produce HNCO (model DC3). |
| Open with DEXTER | |
![\begin{figure}
\par\includegraphics[width=8cm,clip]{10820f4a.ps} \includegraphic...
...m,clip]{10820f4b.ps} \includegraphics[width=8cm,clip]{10820f4c.ps}
\end{figure}](/articles/aa/full_html/2010/02/aa10820-08/img41.png)
|
Figure 4:
Time dependent, gas phase relative abundances for HNCO ( top),
OCN ( middle) and OCN+ (
bottom) as a function of rate coefficient for
reaction c in a non-collapsing dark cloud
(model DC4). All gas-phase HNCO formation pathways are allowed
but grain-surface reactions are prohibited. Reaction g has
rate coefficient of |
| Open with DEXTER | |
3.2 HNCO in photodissociation regions
Figure 5
shows the results for our PDR models. The HNCO
abundances in PDR regions are even lower than those found in DC. For
the three
PDR models with an initially atomic chemistry (PDR1, PDR2 and PDR3) the
largest late time abundance of HNCO (10-17) is
produced in the models
with gas phase formation (PDR1 and PDR2), but these produce up to
9 orders of
magnitude less HNCO than in a DC model. In model PDR3, which
allows only surface reactions, HNCO is even less abundant, reaching a
maximum value of 10-20. The final two
PDR models are also presented in Fig. 5. Both models
follow a similar trend, that is the HNCO abundance is steadily
decreasing with time, reaching a plateau at later times. However, the
HNCO
abundance in PDR4 is initially larger by about two orders of magnitude
than in
PDR5, although they ultimately reach similar abundances of about
![]() .
.
![\begin{figure}
\par\includegraphics[width=8cm,clip]{10820f5.ps}
\end{figure}](/articles/aa/full_html/2010/02/aa10820-08/img43.png)
|
Figure 5:
Time dependent, relative gas phase abundance of HNCO for the five PDR
models. For comparison the observed value is between |
| Open with DEXTER | |
The warmer conditions in these PDR models, largely due to the
reduced optical depth
and enhanced radiation field resulting in the heating of dust grains,
lead to faster desorption meaning that once
formed HNCO is never on the grains for long (at the 50 K used
in these models
the surface lifetime is approximately 100 years) so surface
formation is
limited. Furthermore, HNCO is efficiently destroyed by both FUV and
cosmic
ray induced photodestruction reactions. At no time during the evolution
of
any of our PDR models does the HNCO abundance come close to
the ![]() 10-9observed
by Martín et al. (2008)
towards PDR regions. As a consequence of this
low HNCO abundance, the ratio of the abundance of HNCO to the CS
abundance in
these PDR models is also many orders of magnitude lower than seen by
Martín et al. (2008)
(Fig. 7).
The origin of the HNCO observed by
Martín et al. (2008)
apparently in PDRs is therefore unclear, although it may be related
to shielding of the molecular gas.
10-9observed
by Martín et al. (2008)
towards PDR regions. As a consequence of this
low HNCO abundance, the ratio of the abundance of HNCO to the CS
abundance in
these PDR models is also many orders of magnitude lower than seen by
Martín et al. (2008)
(Fig. 7).
The origin of the HNCO observed by
Martín et al. (2008)
apparently in PDRs is therefore unclear, although it may be related
to shielding of the molecular gas.
3.3 HNCO in hot cores
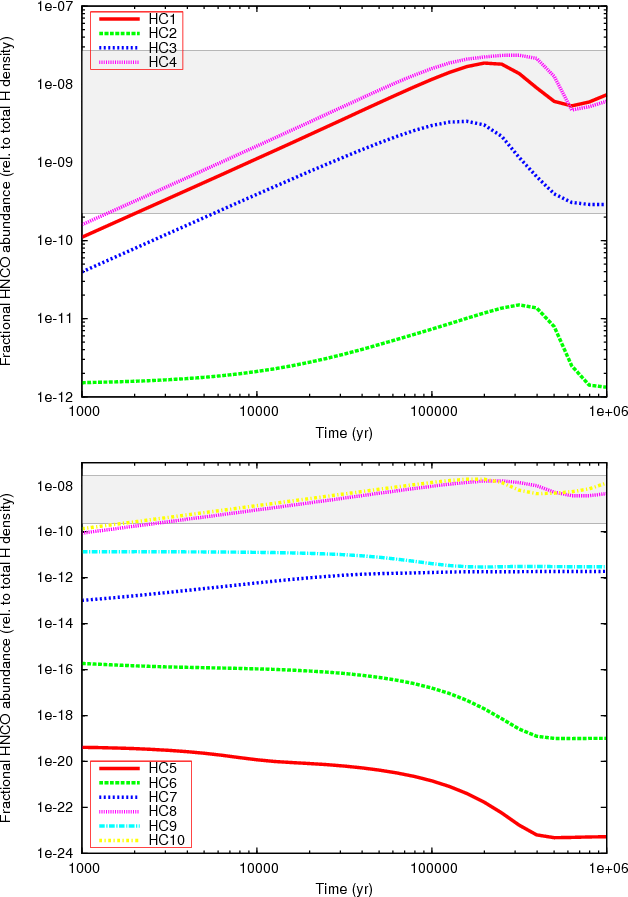
Figure 6 shows the HNCO gas-phase abundance as a function of time for all the hot core models 1 to 10. Only times between 1000 years to 1 Myr (since the HC's switch-on) are plotted as HCs are transient objects and are relatively short-lived phases of high-mass star formation lasting less than 1 Myr.
|
Figure 6: Relative HNCO gas-phase abundance as a function of time for hot core models (HC) 1-4 ( top) and 5-10 ( bottom). |
| Open with DEXTER | |
HC1 includes the complete reaction network described earlier. The
HNCO abundance for this model does reached observed levels. Beyond
![]() 104 yrs
values greater than 10-9 are seen and a peak of
104 yrs
values greater than 10-9 are seen and a peak of
![]()
![]() is
reached at around 0.2-0.3 Myr. For the
model with surface formation only (HC3) the lower observed limit for
HNCO is reached but only beyond 105 yr.
The HNCO abundance in HC4 (which differs from HC1 only in the elemental
sulphur abundance) is almost identical in behaviour as HC1. The major
differences are that higher abundances
are reached at slightly earlier times and the peak value of just over
is
reached at around 0.2-0.3 Myr. For the
model with surface formation only (HC3) the lower observed limit for
HNCO is reached but only beyond 105 yr.
The HNCO abundance in HC4 (which differs from HC1 only in the elemental
sulphur abundance) is almost identical in behaviour as HC1. The major
differences are that higher abundances
are reached at slightly earlier times and the peak value of just over
![]() remains for a further 0.1 Myr.
remains for a further 0.1 Myr.
The gas-phase formation only HC model (HC2) shows that the abundance for HNCO remains relatively flat and never exceeds a few 10-11, and even then only at HC ages greater than 0.3 Myr. As discussed above, this indicates that even the relatively high temperatures in hot cores, the gas-phase reactions by themselves are incapable of producing HNCO at observed levels.
The remaining HC models all had the same chemical networks (the full network with all reactions ``on''), it was only the initial and final temperatures that differed. In fact for the sake of comparison three of the models, HC5, HC7 and HC9, each had a constant temperature during the initial collapse and throughout subsequent constant density evolution. The first two models, HC5 and HC6, had the same post-collapse temperature (20 K), however HC6 used evolved abundances from a cloud collapsed at 10 K where as HC5 used abundances from a cloud at 20 K. HC5 never has a fractional HNCO abundance above 10-19, whilst HC6 never really exceeds 10-16. HC6 has consistently more HNCO throughout - due to a lower temperature collapse phase temperature. At lower temperatures the rate of thermal desoprtion is reduced such that the surface chemistry becomes more efficient. This means there is more NH, CO and OCN on grain surfaces - the key reactants for the surface formation of HNCO. For the models presented in this paper, the surface reaction between OCN and H is more important for the formation of HNCO than the reaction between CO and NH.
The next two models had post-collapse temperatures of 50 K. Again, the only difference being the collapse temperature (HC7 with T=50 K, HC8 with T=10 K). Both of these models have higher HNCO abundances compared to HC5 and HC6. Model HC8 is almost exactly the same as HC1, but HC7 has a relatively constant fractional abundance of around 10-12. Model HC9 had a collapse and post-collapse temperature of 100 K. In this model the abundance of HNCO is roughly constant. At early times abundances just greater than 10-11 are seen, falling slowly to just above 10-12 beyond 0.1 Myr. The final model, HC10, also has a post-collapse temperature of 100 K but the collapse temperature is 10 K. This has an almost identical abundance profile as HC8. These results indicate that in order to achieve HNCO gas-phase abundances similar to those observed, post-collapse temperatures greater than 50 K are required.
3.4 The abundance of CS
Our models can also be used to investigate the abundance of CS as function of time in hot cores (and PDRs). A detailed discussion of the important pathways for the evolution of sulphur-bearing species, including CS, is given in Millar & Herbst (1990). As mentioned above, CS is often used as a tracer of dense gas associated with star formation and Martín et al. (2008) suggested the use of the ratio of the abundance of HNCO to that of CS as measure of the importance of UV radiation in a region.
Figures 7
and 8
show the evolution of the abundance of CS
in our PDR and HC models respectively. All three PDR models which start
with
atomic compositions (PDR1, PDR2 and PDR3) show identical behaviour.
From its
initial value of ![]() the abundance of CS monotomically decreases
by a factor of >10 over the period covered by the
model. For PDR4 and PDR5
which start with evolved chemistries the CS abundance also
monotomically
decreases from a peak at early times, becoming approximately constant
at later
times. The highest abundance of CS in these models occurs are very
early times
in PDR5, where the peak abundance is
the abundance of CS monotomically decreases
by a factor of >10 over the period covered by the
model. For PDR4 and PDR5
which start with evolved chemistries the CS abundance also
monotomically
decreases from a peak at early times, becoming approximately constant
at later
times. The highest abundance of CS in these models occurs are very
early times
in PDR5, where the peak abundance is ![]() 10-9. In the HC models the
CS
abundance is initially relatively constant, rising to a peak after
about
105 yr before rapidly declining thereafter.
Comparing models HC1 and HC4,
which has a sulphur abundance ten times smaller that the other models,
shows
that the CS abundance throughout most the evolution of the HC scales
nearly
directly with the initial sulphur abundance.
10-9. In the HC models the
CS
abundance is initially relatively constant, rising to a peak after
about
105 yr before rapidly declining thereafter.
Comparing models HC1 and HC4,
which has a sulphur abundance ten times smaller that the other models,
shows
that the CS abundance throughout most the evolution of the HC scales
nearly
directly with the initial sulphur abundance.
![\begin{figure}
\par\includegraphics[width=8cm,clip]{10820f7.ps}
\end{figure}](/articles/aa/full_html/2010/02/aa10820-08/img47.png)
|
Figure 7: Time dependent, relative gas phase abundance of CS for the five PDR models. |
| Open with DEXTER | |
![\begin{figure}
\par\includegraphics[width=8cm,clip]{10820f8.ps}
\end{figure}](/articles/aa/full_html/2010/02/aa10820-08/img48.png)
|
Figure 8: Time dependent, relative gas phase abundance of CS for four hot core models (HC1-4). |
| Open with DEXTER | |
4 Discussion
Hot core models HC1, HC2 and HC3 demonstrate that gas phase reactions
alone
can not produce a high enough abundance of HNCO to match observations.
Reactions on the surfaces of grains are required. Of the models with
a complete HNCO chemistry only models HC1, 8 and 10 achieve observed
HNCO
abundances. (Model HC4 can also match the observed abundance, but only
differs
from HC1 in its initial sulphur adundance.) These models all have a low
collapse temperature combined with high post-collapse (hot core)
temperatures.
It appears that during the collapse phase cooler temperatures are
essential.
(A HC model identical to HC4, but with an inital collapse phase at
20 K, rather than 10 K, produces a peak HNCO
abundance of only ![]()
![]() ). The cold collapse
allows accretion on to the surface of grains and hence surface
production of
HNCO. However, during the hot core phase, high temperatures are needed
to
allow the desorption of the surface species back into the gas-phase.
The
models with constant temperatures across both stages 1 and 2
of the hot core
model are seemingly incapable of producing HNCO at observed levels.
). The cold collapse
allows accretion on to the surface of grains and hence surface
production of
HNCO. However, during the hot core phase, high temperatures are needed
to
allow the desorption of the surface species back into the gas-phase.
The
models with constant temperatures across both stages 1 and 2
of the hot core
model are seemingly incapable of producing HNCO at observed levels.
Interestingly, although grain surface reactions are clearly
the ultimate
source of the HNCO, the HNCO abundance does not follow the expected
time
dependent behaviour of a typical parent species ejected from grain
mantles.
In the log-log figures presented here the relative HNCO abundance is
seen to
linearly increase with time, reaching a peak value of ![]() 10-8,
consistent with the peak
observed values, after about
10-8,
consistent with the peak
observed values, after about ![]() years
(Fig. 6).
This
growth suggests that the gas phase HNCO is in fact a daughter product
from the
species ejected from the grain mantles.
years
(Fig. 6).
This
growth suggests that the gas phase HNCO is in fact a daughter product
from the
species ejected from the grain mantles.
Examining the grain mantle abundances shows that although it
is efficiently
formed, HNCO is also rapidly processed to more complex species. It is
the
destruction of these species after their ejection which produces the
gas phase
HNCO. In our models the HNCO is allowed to form several daughter
products
(HNCHO, HNCOCHO, HNCONH and HNCOOH) on grain surfaces during the
collapse
phase. Once the hot core stage is reached it is these species that are
ejected and subsequently destroyed in the gas-phase thus returning
HNCO. Such
a possibility has been previously suggested by Zinchenko
et al. (2000), although these
authors prefered the explanation that the HNCO they observed was formed
in the
gas phase in post-shock gas. If the HNCO in our models was not
destroyed on
the grains it would be returned to the gas-phase as soon as the
temperature is
increased to 200 K with a relative abundance of ![]()
![]() .
This
abundance is several orders of magnitude overabundant compared to
observations.
.
This
abundance is several orders of magnitude overabundant compared to
observations.
Based on its excitation temperature Bisschop et al. (2007) argue that HNCO is a ``first generation'' species ejected from grains. Our models indicate that this is not the case and suggest that this association of a molecular species with physical conditions on the basis of their excitation temperature alone can be misleading.
4.1 HNCO/CS abundance ratio
The HNCO/CS abundance ratio as a function of time is shown for the PDR
models
along with all the HC models in Fig. 9. The PDR models
never
reach values of the HNCO/CS abundance ratio >10-6,
orders of
magnitude smaller than observed. For model HC1 the ratio increases from
about
![]() at 103 years, peaking at
at 103 years, peaking at ![]() 3 around
3 around ![]() years.
Martín et al. (2008)
observed ratios for HNCO/13CS in the range
years.
Martín et al. (2008)
observed ratios for HNCO/13CS in the range ![]() 1 to
1 to ![]() 100.
Adopting a value of 77 for the abundance ratio to
C/13C (Wilson
& Rood 1994), this would imply HNCO/CS ratios of
100.
Adopting a value of 77 for the abundance ratio to
C/13C (Wilson
& Rood 1994), this would imply HNCO/CS ratios of ![]() 0.013 to
0.013 to
![]() 1.3. The
models span this ratio for times between approximately 104 years
to
1.3. The
models span this ratio for times between approximately 104 years
to ![]() years showing that
the time dependent evolution of the chemistry of hot cores alone can
produce the entire range of observed HNCO/CS
abundance ratios. Therefore, independent of its effect on the ratio, it
is clear that HNCO/CS is not a unique tracer of UV radiation.
years showing that
the time dependent evolution of the chemistry of hot cores alone can
produce the entire range of observed HNCO/CS
abundance ratios. Therefore, independent of its effect on the ratio, it
is clear that HNCO/CS is not a unique tracer of UV radiation.
As the figure also shows, the underlying sulphur abundance also has a direct effect on the absolute value of the HNCO to CS abundance ratio. When S is reduced by a factor of 10, for a given time less than about few times 105 years, the HNCO/CS ratio increases by a factor of 10. However for these times the evolution for different sulphur abundances is essentially independent of abundance. Overall the ratio monotonically increases with time up to a peak at a few times 105 years. This generally monotonic behaviour suggests that for a given sulphur abundance this ratio could act as a ``chemical clock'' to constrain the ages of sources.
![\begin{figure}
\par\includegraphics[width=8cm,clip]{10820f9a.ps}\par\includegrap...
...clip]{10820f9b.ps}\par\includegraphics[width=8cm,clip]{10820f9c.ps}
\end{figure}](/articles/aa/full_html/2010/02/aa10820-08/img54.png)
|
Figure 9: HNCO/CS abundance ratio as a function of time for PDR models ( top), hot core models 1-4 ( middle) and hot core models 5-10 ( bottom). The shaded region defines the upper and lower limit for the HNCO/CS ratio as found by Martín et al. (2008). |
| Open with DEXTER | |
5 Summary
Our model shows that gas phase reactions appear incapable of producing
HNCO in
sufficient quantities (even at the ![]() 200 K temperature of hot cores) to
match the observed abundance of this species. However the rate of a key
gas
phase reaction is uncertain and new laboratory determination of this
rate
coefficient is highly desirable. HNCO can be formed on icy surfaces by
a
variety of reactions. Despite the existence of these plausible
mechanisms
which can produce sufficient HNCO to match observations, laboratory
data is
again missing and should be obtained. Although it is produced on the
grain
surfaces in potentially large amounts, our models show that the gas
phase HNCO
is in fact a daughter product from the breakdown of more complex
species to
which the HNCO on the grains have been processed. This is contrary to
recent
speculation about the origin of this species (Bisschop
et al. 2007). The model
also shows that in PDRs HNCO can not be directly produced in sufficient
quantities to match observations. In hot cores in particular it seems
that surface chemistry during an earlier cold collapse phase followed
by gas-phase processing (in the post-collapse regime) is important in
the production of HNCO.
200 K temperature of hot cores) to
match the observed abundance of this species. However the rate of a key
gas
phase reaction is uncertain and new laboratory determination of this
rate
coefficient is highly desirable. HNCO can be formed on icy surfaces by
a
variety of reactions. Despite the existence of these plausible
mechanisms
which can produce sufficient HNCO to match observations, laboratory
data is
again missing and should be obtained. Although it is produced on the
grain
surfaces in potentially large amounts, our models show that the gas
phase HNCO
is in fact a daughter product from the breakdown of more complex
species to
which the HNCO on the grains have been processed. This is contrary to
recent
speculation about the origin of this species (Bisschop
et al. 2007). The model
also shows that in PDRs HNCO can not be directly produced in sufficient
quantities to match observations. In hot cores in particular it seems
that surface chemistry during an earlier cold collapse phase followed
by gas-phase processing (in the post-collapse regime) is important in
the production of HNCO.
The ratio of HNCO to CS evolves strongly
as a function of time while its absolute value is a sensitive function
of the
sulphur abundance. Whilst observations have suggested this ratio can be
used
to trace different physical conditions, our findings show that
metallicity,
choice of chemical network and hot core age can all also contribute to
this
value. Indeed, considering that HNCO contains three heavy elements one
may expect the abundance of HNCO to be highly sensitive to the
metallicity of a
region.
D.M.T. wishes to acknowledge the receipt of an STFC studentship. Astrophysics at the JBCA and QUB is supported by grants from the STFC. This work has also been supported by the European Communitys human potential programme under contract MCRTNCT-512302 (The Molecular Universe). The authors would like to thank Paul Woods for his excellent proof reading ability.
References
- Allen, M., & Robinson, G. W. 1977, ApJ, 212, 396 [NASA ADS] [CrossRef] [Google Scholar]
- Anicich, V. G. 2004, JPL Publication 03-19 [Google Scholar]
- Bisschop, S. E., Jørgensen, J. K., van Dishoeck, E. F., et al. 2007, A&A, 465, 913 [Google Scholar]
- Bronfman, L., Nyman, L. A., & May, J. 1996, A&AS, 115, 81 [Google Scholar]
- Brown, R. L. 1981, ApJ, 248, L119 [NASA ADS] [CrossRef] [Google Scholar]
- Garrod, R. T., Weaver, S. L. W., & Herbst, E. 2008, ApJ, 682, 283 [NASA ADS] [CrossRef] [Google Scholar]
- Goldsmith, P. F., Snell, R. L., Deguchi, S., Krotkov, R., & Linke, R. A. 1982, ApJ, 260, 147 [NASA ADS] [CrossRef] [Google Scholar]
- Gredel, R., Lepp, S., Dalgarno, A., et al. 1989, ApJ, 347, 289 [NASA ADS] [CrossRef] [Google Scholar]
- Habart, E., Abergel, A., Walmsley, C. M., Teyssier, D., & Pety, J. 2005, A&A, 437, 177 [Google Scholar]
- Hasegawa, T. I. & Herbst, E. 1993, MNRAS, 261, 83 [NASA ADS] [CrossRef] [Google Scholar]
- Hasegawa, T. I., Herbst, E., & Leung, C. M. 1992, ApJS, 82, 167 [NASA ADS] [CrossRef] [Google Scholar]
- Helmich, F. P., & van Dishoeck, E. F. 1997, A&AS, 124, 205 [Google Scholar]
- Iglesias, E. 1977, ApJ, 218, 697 [NASA ADS] [CrossRef] [Google Scholar]
- Jackson, J. M., Armstrong, J. T., & Barrett, A. H. 1984, ApJ, 280, 608 [NASA ADS] [CrossRef] [Google Scholar]
- MacDonald, G. H., Gibb, A. G., Habing, R. J., et al. 1996, A&AS, 119, 333 [Google Scholar]
- Martín, S., Requena-Torres, M. A., Martín-Pintado, J., et al. 2008, ApJ, 678, 245 [NASA ADS] [CrossRef] [Google Scholar]
- Millar, T. J., & Herbst, E. 1990, MNRAS, 242, 92 [NASA ADS] [Google Scholar]
- Nummelin, A., Bergman, P., Hjalmarson, Å., et al. 2000, ApJS, 128, 213 [NASA ADS] [CrossRef] [Google Scholar]
- Rawlings, J. M. C., Hartquist, T. W., Menten, K. M., et al. 1992, MNRAS, 255, 471 [NASA ADS] [CrossRef] [Google Scholar]
- Roberge, W. G., Jones, D., Lepp, S., et al. 1991, ApJS, 77, 287 [NASA ADS] [CrossRef] [Google Scholar]
- Ruffle, D. P., & Herbst, E. 2000, MNRAS, 319, 837 [NASA ADS] [CrossRef] [Google Scholar]
- Snyder, L. E., & Buhl, D. 1972, ApJ, 177, 619 [NASA ADS] [CrossRef] [Google Scholar]
- Spitzer, L. 1978, Physical processes in the interstellar medium, 2nd edn. (John Wiley and Sons) [Google Scholar]
- Turner, B. E., Terzieva, R., & Herbst, E. 1999, ApJ, 518, 699 [NASA ADS] [CrossRef] [Google Scholar]
- Wilson, T. L., & Rood, R. 1994, ARA&A, 32, 191 [Google Scholar]
- Woodall, J., Agúndez, M., Markwick-Kemper, A. J., et al. 2007, A&A, 466, 1197 [Google Scholar]
- Zinchenko, I., Henkel, C., & Mao, R. Q. 2000, A&A, 361, 1079 [Google Scholar]
Footnotes
- ... (UDfA
![[*]](/icons/foot_motif.png)
- UDfA; www.udfa.net
- ... database
- The NIST chemical kinetics database; http://kinetics.nist.gov/kinetics/index.jsp
All Tables
Table 1: Summary of the seven collapsing cloud models.
Table 2: Summary of the dark cloud (DC), hot core (HC) and PDR models used to model the time dependent HNCO gas-phase abundance.
Table 3: Standard initial chemical abundances relative to the total hydrogen number density.
Table 4: Key reactions included in the chemical network relevant to the formation of HNCO.
All Figures
|
|
Figure 1:
Time dependent, gas phase relative abundances for HNCO (top)
and OCN (bottom) as a function of rate coefficient
for reaction c in a non-collapsing dark cloud (model DC1). All
other HNCO formation pathways are prohibited, both in the gas-phase and
on grain surfaces. Reaction g has rate coefficient of 0.0. The shaded
region defines the range of values for the observed HNCO abundance, |
| Open with DEXTER | |
| In the text | |
|
|
Figure 2: Time dependent, gas phase relative abundances for HNCO ( top), OCN ( middle) and OCN+ ( bottom) as a function of rate coefficient for reaction c in a non-collapsing dark cloud (model DC2). All gas-phase HNCO formation pathways are allowed; grain-surface reactions are prohibited. Reaction g has rate coefficient of 0.0. The shaded region defines the range of values for the observed HNCO abundance |
| Open with DEXTER | |
| In the text | |
|
|
Figure 3: Time dependent, gas phase relative abundances for various species in a non-collapsing dark cloud using only reactions d, e and f to produce HNCO (model DC3). |
| Open with DEXTER | |
| In the text | |
|
|
Figure 4:
Time dependent, gas phase relative abundances for HNCO ( top),
OCN ( middle) and OCN+ (
bottom) as a function of rate coefficient for
reaction c in a non-collapsing dark cloud
(model DC4). All gas-phase HNCO formation pathways are allowed
but grain-surface reactions are prohibited. Reaction g has
rate coefficient of |
| Open with DEXTER | |
| In the text | |
|
|
Figure 5:
Time dependent, relative gas phase abundance of HNCO for the five PDR
models. For comparison the observed value is between |
| Open with DEXTER | |
| In the text | |
|
|
Figure 6: Relative HNCO gas-phase abundance as a function of time for hot core models (HC) 1-4 ( top) and 5-10 ( bottom). |
| Open with DEXTER | |
| In the text | |
|
|
Figure 7: Time dependent, relative gas phase abundance of CS for the five PDR models. |
| Open with DEXTER | |
| In the text | |
|
|
Figure 8: Time dependent, relative gas phase abundance of CS for four hot core models (HC1-4). |
| Open with DEXTER | |
| In the text | |
|
|
Figure 9: HNCO/CS abundance ratio as a function of time for PDR models ( top), hot core models 1-4 ( middle) and hot core models 5-10 ( bottom). The shaded region defines the upper and lower limit for the HNCO/CS ratio as found by Martín et al. (2008). |
| Open with DEXTER | |
| In the text | |
Copyright ESO 2010
Current usage metrics show cumulative count of Article Views (full-text article views including HTML views, PDF and ePub downloads, according to the available data) and Abstracts Views on Vision4Press platform.
Data correspond to usage on the plateform after 2015. The current usage metrics is available 48-96 hours after online publication and is updated daily on week days.
Initial download of the metrics may take a while.