| Issue |
A&A
Volume 509, January 2010
|
|
|---|---|---|
| Article Number | A6 | |
| Number of page(s) | 15 | |
| Section | Extragalactic astronomy | |
| DOI | https://doi.org/10.1051/0004-6361/200913290 | |
| Published online | 12 January 2010 | |
An optical spectroscopic survey of the 3CR sample of radio galaxies with z < 0.3
II. Spectroscopic classes and accretion modes in radio-loud AGN![[*]](/icons/foot_motif.png)
S. Buttiglione1 - A. Capetti2 - A. Celotti1 - D. J. Axon3,4 - M. Chiaberge5,6 - F. D. Macchetto5 - W. B. Sparks5
1 - SISSA-ISAS, via Beirut 2-4, 34151 Trieste, Italy
2 - INAF - Osservatorio Astronomico di Torino, Strada Osservatorio 20, 10025 Pino Torinese, Italy
3 - Department of Physics, Rochester Institute of Technology, 85 Lomb Memorial Drive, Rochester, NY 14623, USA
4 - School of Mathematical and Physical Sciences, University of Sussex, Falmer, Brighton BN1 9RH, UK
5 - Space Telescope Science Institute, 3700 San Martin Drive, Baltimore, MD 21218, USA
6 - INAF - Istituto di Radio Astronomia, via P. Gobetti 101, 40129 Bologna, Italy
Received 14 September 2009 / Accepted 29 October 2009
Abstract
In a previous paper we presented a homogeneous and 92% complete
optical spectral dataset of the 3CR radio sources with redshift
<0.3. Here we use the emission line measurements to explore the
spectroscopic properties of the sample. The 3CR sources show a
bimodal distribution of excitation index, a new spectroscopic indicator
that measures the relative intensity of low and high excitation lines.
This unveils the presence of two main sub-populations of radio-loud AGN
to which we refer to, following previous studies, as high and low
excitation galaxies (HEG and LEG, respectively). In addition to the two
main classes, we find one source with a spectrum typical of star
forming galaxies, and 3 objects of extremely low level of
excitation.
All broad-line objects are HEG from the point of view of their narrow
emission line ratios and all HEG are FR II radio-galaxies with
log L178 [erg s-1] ![]() 32.8. Conversely LEG cover the whole range of radio power encompassed by this 3CR subsample (30.7
32.8. Conversely LEG cover the whole range of radio power encompassed by this 3CR subsample (30.7 ![]() log L178
log L178 ![]() 35.4) and they are of both FR I and FR II type. The
brightest LEG are all FR II. HEG and LEG obey to two (quasi)
linear correlations between the optical line and extended radio
luminosities, with HEG being brighter than LEG in the
[O III] line by a factor of
35.4) and they are of both FR I and FR II type. The
brightest LEG are all FR II. HEG and LEG obey to two (quasi)
linear correlations between the optical line and extended radio
luminosities, with HEG being brighter than LEG in the
[O III] line by a factor of ![]() 10.
HEG and LEG are offset also in a plane that compares the black hole
mass and the ionizing nuclear luminosity.
However, although HEG are associated with higher nuclear luminosities,
we find LEG among the brightest radio sources of the sample and with a
clear FR II morphology, indistinguishable from those seen in
HEG. This suggests that LEG are not simply objects with a lower level
of accretion. We speculate that the differences between LEG and HEG are
related to a different mode of accretion: LEG are powered by hot gas,
while HEG require the presence of cold accreting material. The high
temperature of the accreting gas in LEG accounts for the lack of
``cold'' structures (i.e. molecular torus and broad line region),
for the reduced radiative output of the accretion disk, and for the
lower gas excitation.
10.
HEG and LEG are offset also in a plane that compares the black hole
mass and the ionizing nuclear luminosity.
However, although HEG are associated with higher nuclear luminosities,
we find LEG among the brightest radio sources of the sample and with a
clear FR II morphology, indistinguishable from those seen in
HEG. This suggests that LEG are not simply objects with a lower level
of accretion. We speculate that the differences between LEG and HEG are
related to a different mode of accretion: LEG are powered by hot gas,
while HEG require the presence of cold accreting material. The high
temperature of the accreting gas in LEG accounts for the lack of
``cold'' structures (i.e. molecular torus and broad line region),
for the reduced radiative output of the accretion disk, and for the
lower gas excitation.
Key words: galaxies: active - galaxies: jets - galaxies: elliptical and lenticular, cD
1 Introduction
Radio galaxies (RG) are an important class of extragalactic objects for many reasons. Studies of radio-loud AGN are the key to understand the processes leading to the ejection of material in relativistic jets and its connection with gas accretion onto the central black holes, the way in which different levels of accretion are related to the process of jets launching, the origin of the AGN onset, and its lifetime. But the intense nuclear activity can also influence the star formation history and the properties of the ISM and ICM, thus representing a fundamental ingredient for the evolution of their hosts and their large scale environment.
RG have been historically classified according to their radio morphology, following the Fanaroff & Riley (1974) criteria: a FR I source has bright jets rising from the nucleus, while a FR II has two bright hot spots far from it. They also noted that FR II are mostly found at high radio luminosities, while FR I are associated to weaker radio sources. The two FR classes also differ, at least statistically, from several other points of view, such as the environment (Zirbel 1997) and host luminosities (Govoni et al. 2000). However, it soon became apparent that the transition between the two classes is continuous and objects of intermediate radio structure do exist (e.g. Capetti et al. 1995). A class of hybrid double sources, with a FR I jet on one side and a FR II lobe on the other, was also unveiled by Gopal-Krishna & Wiita (2000). This supports explanations for the FR dichotomy based upon jet interaction with the external medium, arguing against interpretations based on intrinsic differences in the central engine. Furthermore, the multi-wavelength behavior of the nuclear emission in RG does not appear to be directly related to the differences between the two FR classes, but it is more closely linked to their spectroscopic nuclear properties (e.g. Chiaberge et al. 2002,2000).
Optical spectroscopic information can clearly play a major role in
gaining a better understanding of the properties of the central engines
of RG. Heckman (1980) and Baldwin et al. (1981)
proposed to use optical line ratios as diagnostic tools to classify
emission-line objects in general and AGN in
particular. They introduced diagnostic diagrams comparing selected
emission line ratios, able to distinguish H II regions ionized by
young stars from gas clouds ionized by nuclear activity. Moreover AGN
were separated into Seyferts and Low Ionization Nuclear Emission-line
Regions (LINERs, Heckman 1980) based on the relative ratios of the optical oxygen lines ([O I]![]() 6364, [O II]
6364, [O II]![]() 3727, and [O III]
3727, and [O III]![]() 5007). Subsequently Veilleux & Osterbrock (1987)
revised the definition of the diagnostic diagrams, using only ratios of
lines with small separation in wavelength, thus reducing the problems
related to reddening as well as to uncertainties on the flux
calibration of the spectra. They used the following line combinations:
[O III]/H
5007). Subsequently Veilleux & Osterbrock (1987)
revised the definition of the diagnostic diagrams, using only ratios of
lines with small separation in wavelength, thus reducing the problems
related to reddening as well as to uncertainties on the flux
calibration of the spectra. They used the following line combinations:
[O III]/H![]() as a function of [N II]
as a function of [N II]![]() 6583/H
6583/H![]() ,
[S II]
,
[S II]
![]() 6716, 6731/H
6716, 6731/H![]() ,
and [O I]/H
,
and [O I]/H![]() .
The separation between AGN and HII regions, initially introduced empirically, was calibrated theoretically by Kewley et al. (2001). More recently, Kewley et al. (2006a, hereafter K06) selected a sample of
.
The separation between AGN and HII regions, initially introduced empirically, was calibrated theoretically by Kewley et al. (2001). More recently, Kewley et al. (2006a, hereafter K06) selected a sample of
![]() emission
line galaxies from the SDSS, finding that Seyferts and LINERs form
separated branches on the diagnostic diagrams. They suggested that the
observed dichotomy corresponds to the presence of two sub-populations
of AGN associated with different accretion states.
emission
line galaxies from the SDSS, finding that Seyferts and LINERs form
separated branches on the diagnostic diagrams. They suggested that the
observed dichotomy corresponds to the presence of two sub-populations
of AGN associated with different accretion states.
An attempt to adopt a similar scheme for the optical classification focusing on radio-loud galaxies was made by Laing et al. (1994) on a sub-sample of 3CR radio-galaxies, selected imposing z < 0.88, V < 20, and 0h < RA < 13h. They put on firmer ground the original suggestion by Hine & Longair (1979)
that FR II sources can be distinguished into subclasses. They
proposed a separation into high excitation galaxies (HEG, defined as
galaxies with [O III]/H![]() > 0.2 and equivalent width (EW) of [O III] > 3 Å) and low excitation galaxies (LEG). Tadhunter et al. (1998)
found a similar result from an optical spectroscopic study of the
2 Jy sample, in which a sub-class of Weak-Line Radio Galaxies (the
sources with EW of [O III]) < 10 Å) stands out due to
a low
ratio between emission line and radio luminosities as well of
[O III]/[O II] line ratio.
> 0.2 and equivalent width (EW) of [O III] > 3 Å) and low excitation galaxies (LEG). Tadhunter et al. (1998)
found a similar result from an optical spectroscopic study of the
2 Jy sample, in which a sub-class of Weak-Line Radio Galaxies (the
sources with EW of [O III]) < 10 Å) stands out due to
a low
ratio between emission line and radio luminosities as well of
[O III]/[O II] line ratio.
Emission line luminosities show a broad connection with radio power, as verified by many studies
(e.g. Rawlings & Saunders 1991; Baum & Heckman 1989a,b; Rawlings et al. 1989). This relation holds also for compact steep spectrum (CSS) (Morganti et al. 1997) and GHz peaked spectrum (GPS) sources (Labiano 2008). Willott et al. (1999) demonstrated that the dominant effect is a strong positive correlation between
![]() vs.
vs.
![]() and
not to a common dependence of these quantities on
redshift. This relationship points to a common energy source for both
the optical line and the radio emission, and suggests the radio and
line luminosities of RG are determined, to first order, by the
properties of their central engines. Baum & Heckman (1989b) noticed that the large scatter (roughly one order of magnitude) in
and
not to a common dependence of these quantities on
redshift. This relationship points to a common energy source for both
the optical line and the radio emission, and suggests the radio and
line luminosities of RG are determined, to first order, by the
properties of their central engines. Baum & Heckman (1989b) noticed that the large scatter (roughly one order of magnitude) in
![]() for a given
for a given
![]() suggests that other factors do play a secondary role, such as the
environment. Another possibility is that the line and radio
luminosities may be independently correlated with a third parameter,
e.g. the amount of cold gas present on the kiloparsec scale.
A correlation between emission lines and core radio powers,
although weaker than that observed for
suggests that other factors do play a secondary role, such as the
environment. Another possibility is that the line and radio
luminosities may be independently correlated with a third parameter,
e.g. the amount of cold gas present on the kiloparsec scale.
A correlation between emission lines and core radio powers,
although weaker than that observed for
![]() and
and
![]() ,
is also found (e.g.
Rawlings & Saunders 1991; Baum & Heckman 1989b; Rawlings et al. 1989) suggesting that the total radio luminosity is separately correlated with the [O III] and the core radio power.
,
is also found (e.g.
Rawlings & Saunders 1991; Baum & Heckman 1989b; Rawlings et al. 1989) suggesting that the total radio luminosity is separately correlated with the [O III] and the core radio power.
Morganti et al. (1992) extended the line-radio connection towards lower radio luminosities considering sources from the B2 sample, predominantly FR I, noting a flattening in the correlation. This result is supported also by the analysis by Zirbel & Baum (1995), who also report that FR II sources produce about 5-30 times more emission line luminosity than FR I for the same total radio power (see also Wills et al. 2004; Tadhunter et al. 1998).
In addition to the diagnostics derived from the narrow lines, optical spectra also reveal the presence of prominent permitted broad lines in a significant fraction of RG. Unifying models for active galaxies ascribe the lack of broad lines to selective obscuration and differences of orientation between narrow and broad lined AGN (see Urry & Padovani 1995; Antonucci 1993).
However, despite the massive amount of spectroscopic data collected over the last decades for RG, there are still several key questions waiting for clear answers: are there indeed two (or more) distinct populations of RG? On which basis they can be separated? Which are the physical parameters setting the division? Which is the relationship between the optical and radio properties? When are broad emission lines observed? Which processes set the presence and detectability of broad lines and how do they fit in the unified models for active nuclei? How do the spectroscopic properties of radio-loud and radio-quiet AGN compare?
A necessary ingredient required to enable a detailed exploration of spectroscopic properties of radio-loud AGN is a dataset as homogeneous and complete as possible. This is one of the aims of the optical spectroscopic survey that we performed with the Telescopio Nazionale Galileo, presented in Buttiglione et al. (2009, hereafter Paper I).
We considered the 113 3CR sources at redshift <0.3, with an
effective coverage of the sub-sample of 92%
(i.e. 104 sources). For 18 sources the spectra are
available from the Sloan Digital Sky Survey (SDSS) database (York et al. 2000; Stoughton et al. 2002; Yip et al. 2004),
Data Release 4-6. For these sources the observations provide
uniform and uninterrupted coverage of the key spectroscopic optical
diagnostics ratios. The data quality is such that the H![]() line is detected in all but 3 galaxies and in the majority (
line is detected in all but 3 galaxies and in the majority (![]() %) of the objects all key emission lines (i.e. H
%) of the objects all key emission lines (i.e. H![]() ,
[O III]
,
[O III]
![]() 4959, 5007 Å, [O I]
4959, 5007 Å, [O I]
![]() 6300, 64 Å, H
6300, 64 Å, H![]() ,
[N II]
,
[N II]
![]() 6548, 84 Å, [S II]
6548, 84 Å, [S II]
![]() 6716, 31 Å) required to construct diagnostic diagrams are detected.
6716, 31 Å) required to construct diagnostic diagrams are detected.
The attractiveness of the 3CR catalog of radio sources as a basis for such a study is obvious, being one of the best studied sample of RG. Its selection criteria are unbiased with respect to optical properties and orientation, and it spans a relatively wide range in redshift and radio power. A vast suite of observations is available for this sample, from multi-band HST imaging to observations with Chandra, Spitzer and the VLA, that can be used to address the issues listed above in a multiwavelength approach.
The paper is organized as follows: in Sect. 2 we derive and explore the spectroscopic diagnostic diagrams for the 3CR sample of sources with
![]() .
In Sect. 3 we compare optical (line and host) luminosity and radio emission. Results are discussed in Sect. 4 and summarized in Sect. 5, where we also present our conclusions.
.
In Sect. 3 we compare optical (line and host) luminosity and radio emission. Results are discussed in Sect. 4 and summarized in Sect. 5, where we also present our conclusions.
Throughout, we adopted H0 = 71 km s-1 Mpc-1,
![]() and
and
![]() .
.
2 Spectroscopic classification of 3CR sources
![\begin{figure}
\par\includegraphics[angle=90,width=5.8cm,clip]{13290f1a.ps}\hspa...
...cludegraphics[angle=90,width=5.8cm,clip]{13290f1i.ps}
\vspace*{3mm}
\end{figure}](/articles/aa/full_html/2010/01/aa13290-09/img21.png)
|
Figure 1:
Diagnostic diagrams. Left column: 3CR sources with symbol sizes increasing with [O III] luminosity (log
|
| Open with DEXTER | |
2.1 Spectroscopic diagnostic diagrams
We used the emission lines intensities measured in Paper I![]() to explore the spectral properties of the 3CR sample taking advantage of the spectroscopic diagnostic diagrams (Kewley et al. 2006a). More specifically we constructed the diagrams that compare the [O III]
to explore the spectral properties of the 3CR sample taking advantage of the spectroscopic diagnostic diagrams (Kewley et al. 2006a). More specifically we constructed the diagrams that compare the [O III]![]() 5007/H
5007/H![]() ratio with [N II]
ratio with [N II]![]() 6583/H
6583/H![]() ,
[S II]
,
[S II]
![]() 6716, 6731/H
6716, 6731/H![]() and [O I]
and [O I]![]() 6364/H
6364/H![]() shown in Fig. 1. Ratios involving line upper limits are not considered.
shown in Fig. 1. Ratios involving line upper limits are not considered.
In the left hand panels of this figure, the 3CR sources are indicated by circles with sizes proportional to the [O III] luminosity, in the central panels the errors on the line ratios are shown and in the right panels the 3CR sources are compared with the SDSS emission line galaxies from K06. The solid lines divide sources into star-forming galaxies (lower left region of the diagram), Seyferts (top left region) and LINERs (bottom right region) according to K06.
In the first diagnostic diagram (first row) of Fig. 1, log [O III]/H![]() versus log [N II]/H
versus log [N II]/H![]() ,
all 3CR sources are located in the AGN region with only a few exceptions: one object (3C 198
,
all 3CR sources are located in the AGN region with only a few exceptions: one object (3C 198![]() )
falls among the star-forming galaxies. Two objects (3C 028 and
3C 314.1) are located in the composite region and, together with
3C 348, have extremely low [O III]/H
)
falls among the star-forming galaxies. Two objects (3C 028 and
3C 314.1) are located in the composite region and, together with
3C 348, have extremely low [O III]/H![]() ratio (
ratio (![]() ); however, they are well into the AGN region in the other two
diagrams. The location of the remaining sources appears to be related to their line luminosity. Powerful sources (
); however, they are well into the AGN region in the other two
diagrams. The location of the remaining sources appears to be related to their line luminosity. Powerful sources (
![]() erg s-1) are mostly found along a horizontal strip around log[O III]/H
erg s-1) are mostly found along a horizontal strip around log[O III]/H![]()
![]() 1. We also note that all 3CR galaxies in which we detected a broad H
1. We also note that all 3CR galaxies in which we detected a broad H![]() component belong to this sub-group. In contrast, fainter sources (
component belong to this sub-group. In contrast, fainter sources (
![]() erg s-1) are instead generally distributed in a region around log[O III]/H
erg s-1) are instead generally distributed in a region around log[O III]/H![]()
![]() 0.5.
The sample divides roughly equally into powerful and faint sources. The
horizontal spread is significantly broader for the bright galaxies as
they extend to lower values of the [N II]/H
0.5.
The sample divides roughly equally into powerful and faint sources. The
horizontal spread is significantly broader for the bright galaxies as
they extend to lower values of the [N II]/H![]() ratio.
ratio.
In the second and third diagnostic diagrams, log [O III]/H![]() versus log [S II]/H
versus log [S II]/H![]()
![]() and log [O I]/H
and log [O I]/H![]() ,
the sources show very similar distributions to that seen in the
previous diagram. In these cases, we also take advantage of the
separation into Seyfert and LINERs (i.e. into high and low
ionization galaxies) proposed by K06 and graphically represented by the
oblique solid
lines. All powerful 3CR are located above the separation.
Conversely, fainter sources straddle the Seyferts/LINERs divide. In
particular, considering the log [O I]/H
,
the sources show very similar distributions to that seen in the
previous diagram. In these cases, we also take advantage of the
separation into Seyfert and LINERs (i.e. into high and low
ionization galaxies) proposed by K06 and graphically represented by the
oblique solid
lines. All powerful 3CR are located above the separation.
Conversely, fainter sources straddle the Seyferts/LINERs divide. In
particular, considering the log [O I]/H![]() ratio, they cover a region elongated along the Seyferts/LINERs separation line.
ratio, they cover a region elongated along the Seyferts/LINERs separation line.
![\begin{figure}
\par\includegraphics[angle=90,width=8.5cm,clip]{13290f2.ps}
\end{figure}](/articles/aa/full_html/2010/01/aa13290-09/img25.png)
|
Figure 2:
log [O III]/H |
| Open with DEXTER | |
In the right column of Fig. 1 our data (circles) are compared with the SDSS data from K06 (contour lines): SDSS data are composed of ![]() 85 000 galaxies,
mainly radio quiet AGN (Seyferts, LINERs) and star-bursts galaxies.
As already mentioned most 3CR sources fall in the
AGN region, but several differences can be seen comparing 3CR and
SDSS AGN. First of all, a group of powerful 3CR sources cover
a region with low values of [N II]/H
85 000 galaxies,
mainly radio quiet AGN (Seyferts, LINERs) and star-bursts galaxies.
As already mentioned most 3CR sources fall in the
AGN region, but several differences can be seen comparing 3CR and
SDSS AGN. First of all, a group of powerful 3CR sources cover
a region with low values of [N II]/H![]() and [S II]/H
and [S II]/H![]() (top left of the diagrams): this group of sources seems to have no
corresponding sources among SDSS objects. In the [O I]/H
(top left of the diagrams): this group of sources seems to have no
corresponding sources among SDSS objects. In the [O I]/H![]() diagram,
3CR sources are mainly distributed along the edge of the region
covered by SDSS galaxies, both Seyfert and LINERs. In the other
two diagrams the situation is less extreme, but many 3CR sources
are located in areas of low AGN density.
diagram,
3CR sources are mainly distributed along the edge of the region
covered by SDSS galaxies, both Seyfert and LINERs. In the other
two diagrams the situation is less extreme, but many 3CR sources
are located in areas of low AGN density.
These differences are probably not so surprising, considering
the strong mismatch in line luminosity between the two samples. In
fact, the mean [O III] luminosity of the SDSS sample is
about 30 times lower than the 3CR sample. Indeed, the
majority of LINERs has luminosities in the range
![]() erg s-1, the SDSS Seyferts are mostly in the range
erg s-1, the SDSS Seyferts are mostly in the range
![]() erg s-1 while half of the 3CR sources have luminosities in excess of
erg s-1 while half of the 3CR sources have luminosities in excess of
![]() erg s-1. The luminosity mismatch is well visible in Fig. 2 where only sources with
erg s-1. The luminosity mismatch is well visible in Fig. 2 where only sources with
![]() erg s-1
are plotted: among the SDSS sources, LINERs are substantially
absent at these luminosities, and only a well
defined Seyfert ``finger'' is present. Conversely, this threshold
selects most 3CR galaxies, including those with low [O III]/H
erg s-1
are plotted: among the SDSS sources, LINERs are substantially
absent at these luminosities, and only a well
defined Seyfert ``finger'' is present. Conversely, this threshold
selects most 3CR galaxies, including those with low [O III]/H![]() ratios.
ratios.
An important consequence is that it is probably inappropriate to blindly apply the Seyferts/LINERs separation found by K06 to the 3CR sources. Similarly, we cannot guarantee that two sub-populations of radio-loud AGN exist based on the results found for (mostly) radio-quiet AGN of much lower activity level.
2.2 A new spectroscopic classification scheme
In addition to the points discussed in the previous section there are two further complications in the attempt to understand the spectroscopic properties of the 3CR radio-galaxies.
The first is related to the relatively large fraction of
SDSS galaxies whose location with respect to the curves separating
the various classes of emission line galaxies vary in the different
diagnostic diagrams, defined by K06 as ``ambiguous galaxies''. While
this does not represent a significant problem for the interpretation of
the properties of the SDSS sources, thanks to the extremely large
number of objects, this effect can have a strong impact due to the much
smaller size of the 3CR sample. We decided to go beyond this
complication by introducing new spectroscopic indicators. We estimate
for all narrow line objects the average of the low ionization
lines ratios, i.e. 1/3 (log [N II]/H![]() + log [S II]/H
+ log [S II]/H![]() + log [O I]/H
+ log [O I]/H![]() )
that we define as line ratios index (LRI) as well as the excitation index (EI), log [O III]/H
)
that we define as line ratios index (LRI) as well as the excitation index (EI), log [O III]/H![]() - LRI. These indices are clearly more stable than the single line ratios. In particular, the excitation index
represents the overall ratio of high and low excitation emission lines in each source.
- LRI. These indices are clearly more stable than the single line ratios. In particular, the excitation index
represents the overall ratio of high and low excitation emission lines in each source.
The second issue is the presence of a substantial group of
3CR galaxies with strong broad emission lines. In these objects,
the measurement of the narrow emission lines is less reliable due to
the presence of the strong nuclear continuum and to the complexity of
the profiles of the broad lines. In particular, as explained in
Paper I, we expect a general over-estimate of the H![]() line luminosity. For this reason we defer the discussion of broad lined objects to Sect. 2.3.
line luminosity. For this reason we defer the discussion of broad lined objects to Sect. 2.3.
![\begin{figure}
\par\includegraphics[angle=90,width=8.5cm,clip]{13290f3.ps}
\end{figure}](/articles/aa/full_html/2010/01/aa13290-09/img30.png)
|
Figure 3: Line ratios index (LRI, see text for its definition). The contour lines indicate the distribution of the SDSS emission line galaxies (K06). The circles indicate the 3CR sources (the symbol size is proportional to the [O III] luminosity, see Fig. 1). |
| Open with DEXTER | |
In Fig. 3 we show the position of the 3CR sources in a new diagnostic plane where we compare log [O III]/H![]() and LRI for the 59 narrow line objects for which we are able to
measure both values. The sources are distributed along the edges of the
distribution of the SDSS sources, similarly to the previous
diagnostic diagrams. This diagram shows two groups of AGN: one group
with -1
and LRI for the 59 narrow line objects for which we are able to
measure both values. The sources are distributed along the edges of the
distribution of the SDSS sources, similarly to the previous
diagnostic diagrams. This diagram shows two groups of AGN: one group
with -1 ![]() LRI
LRI ![]() 0 and log [O III]/H
0 and log [O III]/H![]()
![]() 1 and another one with -0.3
1 and another one with -0.3 ![]() LRI
LRI ![]() 0.1 and 0.2
0.1 and 0.2 ![]() log [O III]/H
log [O III]/H![]()
![]() 0.8.
0.8.
The presence of two populations of AGN is clearly seen in the
distribution of the values of the excitation index, shown in Fig. 4,
where two separate distributions appear. This result is the analog of
the two-horned histograms derived by K06 when slicing the density
distribution of SDSS sources. Using the KMM test for
bimodality (Ashman et al. 1994)![]() we estimated that the hypothesis of a single Gaussian distribution can
be rejected at a confidence level of 98%. The significance level
increases to 99.6% when the two galaxies with extremely low
[O III]/H
we estimated that the hypothesis of a single Gaussian distribution can
be rejected at a confidence level of 98%. The significance level
increases to 99.6% when the two galaxies with extremely low
[O III]/H![]() ratios
are excluded from the analysis. The estimated means of the two
populations are EI = 0.63 and EI = 1.40 for the low and high
excitation sources respectively, with a standard deviation
of 0.25. We also note that the average rate of correct
classification of a galaxy within a given group is larger
than 95%.
ratios
are excluded from the analysis. The estimated means of the two
populations are EI = 0.63 and EI = 1.40 for the low and high
excitation sources respectively, with a standard deviation
of 0.25. We also note that the average rate of correct
classification of a galaxy within a given group is larger
than 95%.
![\begin{figure}
\par\includegraphics[angle=90,width=8cm,clip]{13290f4.ps}
\end{figure}](/articles/aa/full_html/2010/01/aa13290-09/img31.png)
|
Figure 4: Histogram of the number of 3CR sources as function of the excitation index (see text) representing the overall ratio of high and low excitation emission lines. Graphically, it is a coordinate axis parallel to the anti-bisectrix of Fig. 3. |
| Open with DEXTER | |
![\begin{figure}
\par\includegraphics[angle=90,width=8cm,clip]{13290f5.ps}
\end{figure}](/articles/aa/full_html/2010/01/aa13290-09/img32.png)
|
Figure 5: Ratio of line and radio luminosities vs. excitation index. |
| Open with DEXTER | |
An additional distinction between objects of high and low excitation
index is their radio emission.
We will discuss the connection between radio and optical properties in
more detail later on, but it is useful to anticipate this result. In
Fig. 5 we compare the excitation index and
![]() ,
i.e. the ratio between their line and total radio
(at 178 MHz) luminosity. In this diagram, the two populations
of galaxies at high and low values of EI are separated in two groups
also from the point of view of the relative level of line emission with
respect to their radio luminosity.
,
i.e. the ratio between their line and total radio
(at 178 MHz) luminosity. In this diagram, the two populations
of galaxies at high and low values of EI are separated in two groups
also from the point of view of the relative level of line emission with
respect to their radio luminosity.
The median values of log (
![]() are -0.1 for the galaxies with EI
are -0.1 for the galaxies with EI ![]() 1 and -1.1 for lower excitation galaxies.
1 and -1.1 for lower excitation galaxies.
![\begin{figure}
\par\includegraphics[angle=90,width=8.6cm,clip]{13290f6a.epsi}\hspace*{3mm}
\includegraphics[angle=90,width=8.2cm,clip]{13290f6b.ps}
\end{figure}](/articles/aa/full_html/2010/01/aa13290-09/img35.png)
|
Figure 6:
Left panel: LRI vs. log [O III]/H |
| Open with DEXTER | |
![\begin{figure}
\par\includegraphics[angle=90,width=17cm,clip]{13290f7.epsi}
\end{figure}](/articles/aa/full_html/2010/01/aa13290-09/img36.png)
|
Figure 7: Diagnostic diagrams for
3CR sources after the classification into
HEG (blue circles) and LEG (red squares) made using the excitation
index. Crossed circles are broad line galaxies, green crosses are
extremely low [O III]/H |
| Open with DEXTER | |
We conclude that RG can be separated into two sub-populations based on
their spectroscopic properties. The threshold can be located at a value
of the excitation index of ![]() 0.95. This separation corresponds also to a difference related to
0.95. This separation corresponds also to a difference related to
![]() (the ratio between line and radio luminosity) of a full order of magnitude. Following the terminology introduced by Laing et al. (1994) we define these classes as low and high excitation galaxies, LEG and HEG respectively.
(the ratio between line and radio luminosity) of a full order of magnitude. Following the terminology introduced by Laing et al. (1994) we define these classes as low and high excitation galaxies, LEG and HEG respectively.
There are sources which remain unclassified using the EI index. We will introduce alternative ways to classify these sources in Sects. 2.4 and 3.
2.3 Spectroscopic properties of broad line objects
We now include the broad line objects in our analysis![]() . In Fig. 6 (where we compare the line ratios index
and the [O III]/H
. In Fig. 6 (where we compare the line ratios index
and the [O III]/H![]() ratio)
broad line objects (BLO), marked with crossed circles, are located in
the region populated by HEG, although generally closer to the
separation line between HEG and LEG. In fact, with respect to HEG, BLO
have a slightly lower average level of the [O III]/H
ratio)
broad line objects (BLO), marked with crossed circles, are located in
the region populated by HEG, although generally closer to the
separation line between HEG and LEG. In fact, with respect to HEG, BLO
have a slightly lower average level of the [O III]/H![]() ratio. As discussed above this can be due to a general overestimate of the H
ratio. As discussed above this can be due to a general overestimate of the H![]() intensity
in this class of objects. The distribution of excitation index of BLO
is compared with that of narrow line objects in Fig. 6,
right panel, and again it shows a close overlap with high excitation
galaxies. Although BLO show a larger dispersion in EI (0.44) than
HEG (0.24), the median EI of
the two classes differ by only
intensity
in this class of objects. The distribution of excitation index of BLO
is compared with that of narrow line objects in Fig. 6,
right panel, and again it shows a close overlap with high excitation
galaxies. Although BLO show a larger dispersion in EI (0.44) than
HEG (0.24), the median EI of
the two classes differ by only ![]() 0.1. Similarly, the
0.1. Similarly, the
![]() ratio of BLO is in the range
10-1-10, the same covered by HEG.
ratio of BLO is in the range
10-1-10, the same covered by HEG.
Based on these results, we conclude that BLO can be considered, from the point of view of their narrow lines intensity ratios and line over radio luminosities, as members of the HEG class.
Including the BLO into the HEG class, the KMM test for
bimodality still rejects the hypothesis of a single Gaussian
distribution at a confidence level of 96.7% (still excluding the
two galaxies with extremely low [O III]/H![]() ratios).
ratios).
2.4 HEG and LEG in the diagnostic diagrams
In Fig. 7 we report the
location of HEG (including broad line objects) and LEG in the standard
diagnostic spectroscopic diagrams. As expected, HEG correspond
generally to the objects with the highest values of [O III]/H![]() .
They also have, on average, lower values of all
ratios of low excitation lines with respect to H
.
They also have, on average, lower values of all
ratios of low excitation lines with respect to H![]() (i.e. they are located to the top-left of LINERs). The two classes
are completely separated in all diagrams with the exception of at most
two BLO that fall among the LEG. As already mentioned this is most
likely due to an overestimate of the H
(i.e. they are located to the top-left of LINERs). The two classes
are completely separated in all diagrams with the exception of at most
two BLO that fall among the LEG. As already mentioned this is most
likely due to an overestimate of the H![]() intensity
and we note that a decrease of its luminosity by 20% would be
sufficient to move them among the Seyferts.
intensity
and we note that a decrease of its luminosity by 20% would be
sufficient to move them among the Seyferts.
In some cases it is possible to derive a rather robust classification also of the 3CR sources for which not all the diagnostic lines could be measured. These objects are represented by the black triangles. For example, two such galaxies (namely 3C 381 and 3C 436) fall in the HEG regions, but they lack a measurement of the [S II] or the [O I] line, due to the presence of a telluric absorption band. Based on their location in two of the diagrams a classification as HEG appears secure. In 3C 284, only upper limits can be derived for the [S II] and [O I] fluxes; however, these limits confirm the location of this object in the HEG region. Similarly, we can give a LEG classification for two sources, 3C 078 and 3C 357, whose spectra do not cover the [S II] spectral region.
In addition, the sample comprises a single galaxy characterized by a star forming spectrum (3C 198) and the three galaxies of extremely low excitation (ELEG) discussed above, namely 3C 028, 3C 314.1, and 3C 348. The spectroscopic classification of the sample is reported in Table 1. In Table 2 we provide the classification for each object.
More generally, due to the relatively narrow stripe covered by the
3CR sources in the diagnostic diagrams (and also by the relatively
small number of objects), it is difficult to define a two-dimensional
representation for the locus of the separation between LEG and HEG,
such as those provided by K06. As already mentioned, HEG and LEG are
optimally separated on the basis of a one-dimensional threshold in the
excitation index at EI ![]() 0.95. However, when not all the required emission lines can be
measured, considering the individual diagrams we note that LEG are
located approximately at
0.95. However, when not all the required emission lines can be
measured, considering the individual diagrams we note that LEG are
located approximately at
![\begin{eqnarray*}&& \log \; [{\rm O~III}]/{\rm H}\beta - \log \; [{\rm N~II}]/{\...
...~III}]/{\rm H}\beta - \log \; [{\rm O~I}]/{\rm H}\alpha \la 1.4.
\end{eqnarray*}](/articles/aa/full_html/2010/01/aa13290-09/img38.png)
Table 1: Spectral classification breakdown.
3 On the line-radio relationship
3.1 Emission lines vs. radio luminosity
In Fig. 8, top panel, we
compare the [O III] line luminosity with the total radio
luminosity at 178 MHz. HEG are located in general at higher line
luminosity with respect to LEG of similar radio luminosity. This
reflects their higher value of the
![]() ratio already discussed in Sect. 2.2.
ratio already discussed in Sect. 2.2.
Table 2: Multiwavelength data and spectroscopic classification.
There are two notable exceptions to this trend, namely 3C 084 and
3C 371. They are spectroscopically classified as LEG, but show an
excess of a factor of ![]() 50
in line emission with respect to the sources of this class of similar
radio power. Intriguingly, these are the two sources with the highest
core dominance of the sample, with ratios
50
in line emission with respect to the sources of this class of similar
radio power. Intriguingly, these are the two sources with the highest
core dominance of the sample, with ratios
![]() /L178
of 0.69 and 0.33 respectively. This implies that, by
considering only their genuine extended radio emission, they would be
stronger outliers, reaching ratios of line to radio emission even
higher than observed in HEG.
/L178
of 0.69 and 0.33 respectively. This implies that, by
considering only their genuine extended radio emission, they would be
stronger outliers, reaching ratios of line to radio emission even
higher than observed in HEG.
While HEG are only found at radio luminosities larger than log L178 [erg/s] ![]() 32.8, LEG cover the whole range of radio power covered by the subsample of 3CR sources with z < 0.3, almost five orders of magnitude from log L178
32.8, LEG cover the whole range of radio power covered by the subsample of 3CR sources with z < 0.3, almost five orders of magnitude from log L178 ![]() 30.7 to log L178
30.7 to log L178 ![]() 35.4.
35.4.
There is a clear trend for increasing line luminosity with radio
power, as already found and discussed by several authors and as reported in
the introduction. However, we are now in the position of considering
separately the sub-populations of HEG and LEG. More quantitatively, we find
that HEG obey a linear correlation in the form:
![\begin{eqnarray*}\log \; L_{\rm [O~III]} = 1.15 ~ \log \; L_{178} + 2.96.
\end{eqnarray*}](/articles/aa/full_html/2010/01/aa13290-09/img41.png)
The error in the slope is 0.11, while the rms around the correlation is 0.43 dex. We tested the possible influence of redshift in driving this correlation (both quantities depend on z2) estimating the partial rank coefficient, finding
![\begin{eqnarray*}\log \; L_{\rm [O~III]} = 0.99 ~ \log \; L_{178} + 7.65.
\end{eqnarray*}](/articles/aa/full_html/2010/01/aa13290-09/img43.png)
The error in the slope is 0.09 and the rms around the correlation is 0.50 dex. The partial rank coefficient is
The relations derived for HEG and LEG differ by a factor of ![]() 10
in the common range of radio power. The slopes of the line-radio
luminosity correlations of HEG and LEG are instead consistent within
the errors.
10
in the common range of radio power. The slopes of the line-radio
luminosity correlations of HEG and LEG are instead consistent within
the errors.
Considering instead the H![]() line, we find rather similar results, as shown in Fig. 8, middle panel. The form of the correlations are:
line, we find rather similar results, as shown in Fig. 8, middle panel. The form of the correlations are:
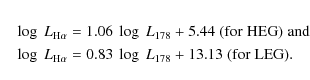
The main difference is the smaller offset between the two populations, reduced to a factor of
Finally, correlations are found also between radio core power and line luminosity (Fig. 8, bottom panel) with
![\begin{eqnarray*}&& \log \; L_{\rm [O~III]} = 0.75 ~ P_{\rm core} + 18.71 \; ({\...
...\rm [O~III]} = 1.01 ~ P_{\rm core} + 9.28 \; ({\rm for \; LEG}).
\end{eqnarray*}](/articles/aa/full_html/2010/01/aa13290-09/img46.png)
The separation in terms of ratio between line and radio luminosity provides us with a further element to associate spectroscopically unclassified sources with the HEG and LEG sub-populations. For example, the narrow Balmer lines of two BLO, 3C 111 and 3C 445, could not be measured, due to the prominence of the broad component. Nonetheless, they are located at log L178
Conversely, the nature of the relatively large population of
unclassified sources remains ambiguous. In general, they show values
(or upper limits) of the
![]() ratios
significantly smaller than predicted by the line-radio correlation
defined by HEG. However, a LEG classification is not granted
since we cannot exclude that they are part of the ELEG
population, as they lack a measurement of the [O III]/H
ratios
significantly smaller than predicted by the line-radio correlation
defined by HEG. However, a LEG classification is not granted
since we cannot exclude that they are part of the ELEG
population, as they lack a measurement of the [O III]/H![]() ratio. While the H
ratio. While the H![]() flux
is never available, in a few cases the [O III] line can be
measured leading to a ratio log [O III]/H
flux
is never available, in a few cases the [O III] line can be
measured leading to a ratio log [O III]/H![]() >
0.1, inconsistent with a ELEG classification. This is the
case of 3C 173.1, 3C 326, and 3C 430
which may then be considered as LEG.
>
0.1, inconsistent with a ELEG classification. This is the
case of 3C 173.1, 3C 326, and 3C 430
which may then be considered as LEG.
3.2 Spectroscopic classes vs. radio morphology
We now examine the relationship between the spectroscopic classes and the radio morphological FR type. In Table 2 we report our own classification of the 3CR radio-sources based on the analysis of the best radio maps available in the literature. We adopted rather strict criteria for the inclusion of a given object into one of the FR morphological type, preferring a larger number of undefined sources with respect to a less secure identification. In particular, we include a radio source into the FR II group only when clear hot spots are visible in the radio maps, and considered as FR I only sources with a well defined twin-jets structure.
All sources of the HEG spectroscopic class belong to the
FR II type, with only two exceptions. The first is
3C 433 that shows a peculiar radio morphology. The South radio
lobe has the presence of a well defined hot-spot, while the northern
radio jets bends dramatically toward the West,
forming a rather diffuse lobe (Black et al. 1992). The second is 3C 93.1, a Compact Steep Spectrum source (Akujor et al. 1991) too compact (
![]() in size) to show any structure. As already noted, all HEG are found in radio-sources with log
in size) to show any structure. As already noted, all HEG are found in radio-sources with log
![]() .
.
![\begin{figure}
\par\includegraphics[angle=90,width=8.6cm,clip]{13290f8a.epsi}\pa...
...epsi}\par\includegraphics[angle=90,width=8.6cm,clip]{13290f8c.epsi}
\end{figure}](/articles/aa/full_html/2010/01/aa13290-09/img50.png)
|
Figure 8:
[O III] and H |
| Open with DEXTER | |
The situation for LEG is more complex. Of the 37 sources belonging to this spectroscopic class 16 are FR II, 12 are FR I, while the radio-morphology of the remaining 9 is not sufficiently well defined to include them in any FR group, such as, for example, 3C 317 (a core/halo source), 3C 371 (with a core/jet morphology), and the X-shaped 3C 315.
LEG with FR II morphology are associated with radio-sources with relatively large radio power, from log
![]() to log
to log
![]() ,
with just one exception (3C 088) of lower luminosity, while the FR I/LEG all have log
,
with just one exception (3C 088) of lower luminosity, while the FR I/LEG all have log
![]() .
We also stress that the excitation level of FR II/LEG (with a mean
value of EI = 0.66 and a spread of 0.15) does not differ from
the rest of the LEG population (for which the mean is
EI = 0.63). This indicates that radio
morphology does not affect the excitation levels.
.
We also stress that the excitation level of FR II/LEG (with a mean
value of EI = 0.66 and a spread of 0.15) does not differ from
the rest of the LEG population (for which the mean is
EI = 0.63). This indicates that radio
morphology does not affect the excitation levels.
For the objects not classified spectroscopically, we have 10 FRI, 4 FRII and 3 of uncertain FR type.
Conversely, by looking at the spectral classification of the different FR types, while there are FR II/HEG as well as FR II/LEG, all FR I for which we were able to derive a spectral type are LEG.
3.3 Broad emission lines and spectroscopic classes
Broad H![]() lines
are found in a sub-sample of 18 3CR sources. With the
possible exception of 3C 273, where no narrow lines can be
measured, all remaining sources are part of the HEG sub-population. The
broad emission line fluxes are linked by a linear relation to the
[O III] flux over 2.5 orders of magnitude, with an
average ratio
lines
are found in a sub-sample of 18 3CR sources. With the
possible exception of 3C 273, where no narrow lines can be
measured, all remaining sources are part of the HEG sub-population. The
broad emission line fluxes are linked by a linear relation to the
[O III] flux over 2.5 orders of magnitude, with an
average ratio
![]() ,
and a scatter of a factor of
,
and a scatter of a factor of ![]() 4 (see Fig. 9)
4 (see Fig. 9)![]() .
This is expected since both lines are essentially proportional to the
flux of ionizing photons. Differences in their relative intensities,
from object to object, are most likely due to changes in the relative
covering factor of the narrow and broad line regions.
.
This is expected since both lines are essentially proportional to the
flux of ionizing photons. Differences in their relative intensities,
from object to object, are most likely due to changes in the relative
covering factor of the narrow and broad line regions.
![\begin{figure}
\par\includegraphics[width=8cm,clip]{13290f9.ps}
\end{figure}](/articles/aa/full_html/2010/01/aa13290-09/img56.png)
|
Figure 9:
Comparison of the broad H |
| Open with DEXTER | |
Under the assumption that the flux of the H![]() broad component follows the relation with [O III] of Fig. 9
and with similar properties in terms of width and shape of the profile,
one would have expected to detect a BLR in the objects with
broad component follows the relation with [O III] of Fig. 9
and with similar properties in terms of width and shape of the profile,
one would have expected to detect a BLR in the objects with
![]()
![]() 10-15 erg s-1 cm-2, the lowest [O III] flux among BLO, i.e. in
10-15 erg s-1 cm-2, the lowest [O III] flux among BLO, i.e. in ![]() 75% of the sample. This indicates that for these galaxies the
75% of the sample. This indicates that for these galaxies the
![]() ratio
must be lower than in BLO. For HEG lacking of a BLR this can be
accounted for by selective absorption, i.e. to circumnuclear
obscuring material, as predicted by the unified models
(e.g. Urry & Padovani 1995). However, a
BLR is never observed in LEG. This is difficult to account in a simple
geometric scheme and it implies that BLR in LEG are intrinsically
fainter, relative to the narrow line emission, than in HEG.
ratio
must be lower than in BLO. For HEG lacking of a BLR this can be
accounted for by selective absorption, i.e. to circumnuclear
obscuring material, as predicted by the unified models
(e.g. Urry & Padovani 1995). However, a
BLR is never observed in LEG. This is difficult to account in a simple
geometric scheme and it implies that BLR in LEG are intrinsically
fainter, relative to the narrow line emission, than in HEG.
![\begin{figure}
\par\includegraphics[angle=90,width=8cm,clip]{13290f10.epsi}\includegraphics[angle=90,width=8cm,clip]{13290f11.epsi}
\end{figure}](/articles/aa/full_html/2010/01/aa13290-09/img60.png)
|
Figure 10: Comparison of the radio luminosity at 178 MHz versus the magnitude in H band of the host galaxy for the various sub-populations of 3CR sources. Left panel: 3CR sources divided into FR I (green diamonds) and FR II (pink stars); right panel: comparison between HEG (blue circles) and LEG (FR I = crossed red squares, LEG FR II = filled red squares, LEG of uncertain FR type = empty red squares). The solid line marks the separation between FR I (below the line) and FR II (above the line) according to Ledlow & Owen (1996). |
| Open with DEXTER | |
3.4 Comparison with previous studies
We based our initial classification on the ratios of diagnostic
emission lines. Previous studies used instead a combination of line
ratios and equivalent widths (see the Introduction) that can be more
affected (in particular when only upper limits can be derived) by
the quality of the data
and by the contrast with the continuum emission. Similarly, we only
used ratios of lines with small wavelength separation, not affected by
the possible effects of internal reddening, that can be particularly
severe when considering e.g. the [O II]![]() 3727 line. Thus our procedure is expected to produce a rather robust method of spectral identification.
3727 line. Thus our procedure is expected to produce a rather robust method of spectral identification.
Nonetheless, our classifications are overall in good agreement with
those found in the literature on a object by object basis. For example,
comparing our results with those of Willott et al. (1999)![]() for the 3CRR sources we found 52 objects in common. Leaving
aside 2 objects of the newly introduced class of ELEG, and
3 objects that we consider as unclassified (2 reported as
LEG, namely 3C 035 and 3C 319, 1 as HEG, 3C 438)
the identification in the various classes coincides with only
3 exceptions for the remaining 47 radio-galaxies. These are:
3C 388, a LEG from our analysis (with an excitation index of
EI = 0.62) against the previous HEG identification, and
two galaxies, 3C 079 and 3C 223, where we do not see a broad
line component
for the 3CRR sources we found 52 objects in common. Leaving
aside 2 objects of the newly introduced class of ELEG, and
3 objects that we consider as unclassified (2 reported as
LEG, namely 3C 035 and 3C 319, 1 as HEG, 3C 438)
the identification in the various classes coincides with only
3 exceptions for the remaining 47 radio-galaxies. These are:
3C 388, a LEG from our analysis (with an excitation index of
EI = 0.62) against the previous HEG identification, and
two galaxies, 3C 079 and 3C 223, where we do not see a broad
line component![]() , contrasting with their suggested membership in the class of Weak Quasars.
, contrasting with their suggested membership in the class of Weak Quasars.
3.5 The radio-host galaxy luminosity plane for FR I, FR II, LEG, and HEG
Ledlow & Owen (1996) compared the optical R band
magnitude of the host galaxies with the total radio emission at
1.4 GHz. They found that sources locate in different areas of the
plot depending on their radio morphology: as already known from
the pioneering study of Fanaroff & Riley (1974) FR II sources have higher radio powers than FR I sources and they separate at a luminosity of
![]()
![]() 1025 W Hz-1 at 178 MHz. The novel result of Ledlow & Owen (1996) consists in the fact that the FR I/II division shows a dependence on
1025 W Hz-1 at 178 MHz. The novel result of Ledlow & Owen (1996) consists in the fact that the FR I/II division shows a dependence on
![]() .
FR I sources hosted by the more luminous galaxies can have
radio powers higher than the average
FR I/FR II separation.
The separation between FR I and FR II is rather sharp over
the whole range of radio power.
.
FR I sources hosted by the more luminous galaxies can have
radio powers higher than the average
FR I/FR II separation.
The separation between FR I and FR II is rather sharp over
the whole range of radio power.
In Fig. 10 (left panel) we plotted the 3CR sources in the plane radio luminosity (at 178 MHz) versus the magnitude in H band of the host galaxy (reported in Table 2). We selected the H band since it provides the most complete coverage (![]() 85%) for the 3CR sample by using measurements from the 2MASS (Skrutskie et al. 2006) or, when this is not
available, from HST images (Donzelli et al. 2007). For the BLO we also corrected the host luminosity for the contribution of their bright IR nuclei, measured by Baldi et al. (2009). In order to compare our results with those of Ledlow & Owen (1996) we used the color correction from Mannucci et al. (2001), R - H = 2.5, and scaled the 1.4 GHz data to 178 MHz adopting a radio spectrum in the form
85%) for the 3CR sample by using measurements from the 2MASS (Skrutskie et al. 2006) or, when this is not
available, from HST images (Donzelli et al. 2007). For the BLO we also corrected the host luminosity for the contribution of their bright IR nuclei, measured by Baldi et al. (2009). In order to compare our results with those of Ledlow & Owen (1996) we used the color correction from Mannucci et al. (2001), R - H = 2.5, and scaled the 1.4 GHz data to 178 MHz adopting a radio spectrum in the form
![]() .
.
The relative scarcity of FR I sources in the 3CR sample prevents us from exploring in detail the host magnitude-dependent separation between the FR classes. However, the FR location for our sample is consistent with the separation introduced by Ledlow & Owen (1996). We also checked that this result holds using radio luminosities at 1.4 GHz as well as host magnitude in other bands (i.e. V band). In line with their results we find a few exceptions, associated with FR I sources of extremely high radio powers in very massive hosts.
In the right panel we introduced the optical spectroscopic
classification, separating the 3CR sources into HEG and LEG. For
the LEG class we further consider the FR type. HEG and
LEG/FR II sources are well mixed above the
FR I/FR II separation, having the same median in terms
of radio power, and only a small offset in the median host magnitude,
with LEG ![]() 0.3 mag brighter. As originally suggested by Ghisellini & Celotti (2001, hereafter GC01)
the radio - host galaxy luminosity plane can be translated into a
jet-power vs. black hole mass diagram. The substantial
superposition between HEG and LEG indicates that also the distribution
of the estimated black hole masses and jet power for the two classes
are similar.
0.3 mag brighter. As originally suggested by Ghisellini & Celotti (2001, hereafter GC01)
the radio - host galaxy luminosity plane can be translated into a
jet-power vs. black hole mass diagram. The substantial
superposition between HEG and LEG indicates that also the distribution
of the estimated black hole masses and jet power for the two classes
are similar.
GC01 also noted that the line luminosity can be used as indicator of the ionizing luminosity,
![]() ,
that they estimated from the radio power (see e.g. Willott et al. 1999). We can now derive this quantity directly from the [O III] luminosity as
,
that they estimated from the radio power (see e.g. Willott et al. 1999). We can now derive this quantity directly from the [O III] luminosity as![]()
![\begin{eqnarray*}{\rm log} ~L_{{\rm ion}} \sim {\rm log} ~L_{\rm {[O~III]}} + 2.83.
\end{eqnarray*}](/articles/aa/full_html/2010/01/aa13290-09/img69.png)
We also derived the black hole mass from the host luminosity using the correlation of Marconi & Hunt (2003)
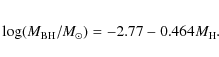
In Fig. 11 we show the
![\begin{figure}
\par\includegraphics[angle=90,width=8cm,clip]{13290f12.epsi}
\end{figure}](/articles/aa/full_html/2010/01/aa13290-09/img80.png)
|
Figure 11:
Comparison of [O III] line luminosity (in erg s-1) and H band host magnitude for 3CR sources. Symbols are as in the right panel of Fig. 10,
i.e. HEG = blue circles, LEG = red squares (filled for
FR II, crossed for FR I, empty for uncertain FR type.
The right axis reports the ionizing luminosity (in erg s-1) while the upper axis reports the estimated black hole mass in solar units. The solid and dashed lines correspond to
|
| Open with DEXTER | |
Marchesini et al. (2004) found that the bolometric luminosity for radio-loud AGN has a bimodal distribution, related to a different level of
![]() for LEG and FR I with respect to BLO and radio-loud QSO, while,
restricting only to RG, the evidence for bimodality was marginal.
We find a similar marginal result (
for LEG and FR I with respect to BLO and radio-loud QSO, while,
restricting only to RG, the evidence for bimodality was marginal.
We find a similar marginal result (
![]() )
considering the ionizing luminosity or
the
)
considering the ionizing luminosity or
the
![]() /
/
![]() ratio.
ratio.
4 Discussion
4.1 On the origin of the spectroscopic sub-populations in radio-loud AGN
The main result derived from the spectroscopic properties of the 3CR sources is the presence of two dominant populations of galaxies, HEG and LEG, separated on the basis of the ratio between the intensity of high and low excitation emission lines. This finding confirms the original suggestion by Laing et al. (1994).
HEG and LEG differ also from the point of view of other properties: 1) we find prominent broad lines in ![]() 30% of HEG, but not in LEG; 2) HEG are brighter than LEG in the [O III] line by a factor of
30% of HEG, but not in LEG; 2) HEG are brighter than LEG in the [O III] line by a factor of ![]() 10 at the same total radio luminosity; 3) the two classes are well offset in a plane that
compares their ionizing luminosity and black hole mass; 4) the luminosity of the nuclear sources in LEG is on average
10 at the same total radio luminosity; 3) the two classes are well offset in a plane that
compares their ionizing luminosity and black hole mass; 4) the luminosity of the nuclear sources in LEG is on average ![]() 30 times
fainter than in HEG (considering only HEG with broad lines, where the
nucleus is not affected by obscuration) at both optical and infrared
wavelengths (Chiaberge et al. 2002; Baldi et al. 2009)
at a given radio core power; 5) HEG hosts are bluer than
those of LEG, an indication that star formation is commonly associated
with HEG while it rarely seen in LEG (Smolcic 2009; Baldi & Capetti 2008).
30 times
fainter than in HEG (considering only HEG with broad lines, where the
nucleus is not affected by obscuration) at both optical and infrared
wavelengths (Chiaberge et al. 2002; Baldi et al. 2009)
at a given radio core power; 5) HEG hosts are bluer than
those of LEG, an indication that star formation is commonly associated
with HEG while it rarely seen in LEG (Smolcic 2009; Baldi & Capetti 2008).
Conversely, the distribution of black hole masses for the two classes
is not largely different. Actually, the overall black hole mass
distribution of these RG is rather narrow, with the vast majority of
the objects confined in the range 8.5 ![]() log
log
![]() /
/![]()
![]() 9.5 (see also Marchesini et al. 2004).
Thus, HEG nuclei are associated with a higher rate of radiative
emission with respect to LEG, not only in absolute values, but also in
terms of fraction of the
Eddington level.
9.5 (see also Marchesini et al. 2004).
Thus, HEG nuclei are associated with a higher rate of radiative
emission with respect to LEG, not only in absolute values, but also in
terms of fraction of the
Eddington level.
GC01 suggested that the transition from FR I to FR II can be associated with a threshold in the accretion rate that corresponds to a hange in the properties of the accretion disk, from ``standard'' to low radiative efficiency (hereafter RIAF). Nagao et al. (2002) argued that the differences in terms of emission line ratios between high and low excitation sources can be ascribed to a change in the Spectral Energy Distribution of the active nucleus, due to such a transition. In low efficiency disks, the emerging spectrum is presumably harder than for a radiatively efficient disk. This favors the emission of lower excitation lines, produced in the region of partially ionized gas, excited by the higher energy photons. This is consistent with the observed spectroscopic differences between HEG and LEG. Additional support for this conclusion is provided if we consider radio-quiet AGN. The photoionization models derived by K06 indicate that Seyferts require a higher ionization parameter than LINERs, but the optical line ratios of the more powerful objects of this latter class are better reproduced assuming also a harder nuclear continuum.
Nevertheless, the location of the various classes in the
![]() plane
is not straightforward to interpret in this scenario. In fact, we lack
of clear indications on how to convert the ionizing luminosity into
accretion rate for the (putative) RIAF disks. The separation between
FR I/LEG and FR II/HEG is sufficiently large (a factor
of 100-1000 in
plane
is not straightforward to interpret in this scenario. In fact, we lack
of clear indications on how to convert the ionizing luminosity into
accretion rate for the (putative) RIAF disks. The separation between
FR I/LEG and FR II/HEG is sufficiently large (a factor
of 100-1000 in
![]() /
/
![]() )
that one can probably infer that the latter class has not only a higher
ionizing luminosity but also a higher accretion rate. Conversely, the
brightest LEG overlap with FR II/HEG; in the case they were
associated with RIAF, the superposition in terms of accretion rate
would become even larger, due to their lower radiative efficiency.
)
that one can probably infer that the latter class has not only a higher
ionizing luminosity but also a higher accretion rate. Conversely, the
brightest LEG overlap with FR II/HEG; in the case they were
associated with RIAF, the superposition in terms of accretion rate
would become even larger, due to their lower radiative efficiency.
Furthermore, LEG span the whole range of radio power covered by the subsample of 3CR sources with z < 0.3
and, actually, the brightest radio source of our
sample (3C 123) is a LEG. Despite our rather strict
criteria for the definition of the FR type, we found a substantial
fraction (16 out of 37) of LEG with a
FR II morphology. Moreover the radio core power of LEG is
similar to that measured in HEG; restricting to the range of extended
radio power 33 < log L178 < 34.5, where we have the bulk of the FR II population, the median core dominance is log
![]() /L178 = -2.69
/L178 = -2.69 ![]() 0.13 in LEG and log
0.13 in LEG and log
![]() /L178 = -2.99
/L178 = -2.99 ![]() 0.14 in HEG. HEG and LEG/FR II are thus essentially indistinguishable from the point of view of
their radio properties, suggesting that the two classes share the same range also in terms of jet power.
0.14 in HEG. HEG and LEG/FR II are thus essentially indistinguishable from the point of view of
their radio properties, suggesting that the two classes share the same range also in terms of jet power.
If the change in the spectral and nuclear properties from LEG to HEG are associated with a threshold in the accretion rate, the similarity of the radio properties of the two sub-populations requires a process of jet launching essentially decoupled from the level of accretion. This is the case, for example, in the Blandford & Znajek (1977) process where jets are shaped by the magnetic field and the black hole spin and not univocally by the accretion mechanism.
Focusing purely on those galaxies with FR II morphology, an alternative possibility is that the link between HEG and LEG is related to variability can be excluded. In fact, in response to a decrease in the accretion rate, the luminosity of the optical nucleus, of the BLR, and of the NLR, as well as its excitation level, will decline, possibly causing a change from a HEG to a LEG. However, this contrasts with the requirement that the radio core emission must remain essentially unaltered while this component reacts on very short timescales to changes of the central activity.
Based on the substantial difficulties in accounting for the
similarities and differences between LEG and HEG based on different or
time-varying accretion rates, we here propose a different
interpretation for the origin of the spectroscopic sub-populations of
radio-loud AGN. We speculate that the separation between LEG and HEG is
not due to a different rate of accretion but, instead, to a different mode
of accretion. In this scenario, HEG are powered by accretion of cold
gas, e.g. provided by a recent merger with a gas rich galaxy (e.g.
Baldi & Capetti 2008). Cold gas,
approaching the central regions of the galaxy, forms the various
structures commonly seen in these
AGN, such as a molecular torus, a Broad Line Region, and a standard,
geometrically thin, accretion disk. Conversely, LEG accrete hot
material, provided by the ample reservoir of their X-ray emitting
gaseous coronae. This process has been shown to be able to account for
the nuclear activity of FR I radio-galaxies (Allen et al. 2006; Balmaverde et al. 2008) extending up to a radio power of log
![]() .
The temperature of the accreting gas is typically around 1 keV,
.
The temperature of the accreting gas is typically around 1 keV,
![]() K.
This prevents the formation of the ``cold'' structures, in particular
of a molecular torus, but also of the clouds of the BLR, whose ionized
portion has a temperature of
K.
This prevents the formation of the ``cold'' structures, in particular
of a molecular torus, but also of the clouds of the BLR, whose ionized
portion has a temperature of
![]() K,
unless the in-flowing gas is able to cool dramatically on its way to
the center of the galaxy. Indeed BLR are not seen in LEG and they also
do not generally show the high level of absorption in the X-ray band
expected if their nuclei were seen through an obscuring torus
(e.g. Hardcastle et al. 2009).
K,
unless the in-flowing gas is able to cool dramatically on its way to
the center of the galaxy. Indeed BLR are not seen in LEG and they also
do not generally show the high level of absorption in the X-ray band
expected if their nuclei were seen through an obscuring torus
(e.g. Hardcastle et al. 2009).
Moreover, the properties of the accretion disk are likely to be substantially altered due to the high initial temperature of the gas. From a geometrical point of view, a ``cold'', standard accretion disk is flattened by rotation, while it remains geometrically thick for higher temperatures. While the radiative emission in a standard disk is dominated by UV and soft X-ray photons, a hotter disk emits most of the radiation at higher energies. The higher temperature in case of hot accretion corresponds also to a lower radiative efficiency due to the reduced gas cooling at these temperatures (but see Dumont 1992, for the effects of high density on the gas cooling function). At a given accretion rate, the number of ionizing photons is then reduced, due to the combination of higher average photon energy and lower overall emission. The emitted spectrum is harder and it produces lines of lower excitation, as discussed above. This effect can produce the spectral separation between LEG and HEG similarly to RIAF.
Furthermore, Capetti et al. (2005) showed that the non-thermal cores in FR I produce a sufficient flux of high energy photons to account for the ionization of their NLR. The radio and optical luminosities of the nuclei of FR I and FR II/LEG are linked by a common linear correlation (Chiaberge et al. 2002) and, as shown by Fig. 8, this applies also to radio cores and line luminosity. It is then possible that the dominant source of ionizing photons in LEG must be ascribed to non-thermal emission, associated with the base of their jets, rather then with their accretion disks.
The accretion rate in FR II/LEG can be estimated by
extrapolating the scaling relation between jet and accretion power
derived for low luminosity FR I/LEG to the objects of highest
luminosity of this class. Balmaverde et al. (2008) estimated that the accretion rate needed to power a radio source with
![]() erg s-1 is
erg s-1 is
![]() erg s-1. This requires
erg s-1. This requires
![]() erg s-1 for the most powerful LEG, corresponding to a fraction
erg s-1 for the most powerful LEG, corresponding to a fraction
![]() of the Eddington rate for a 10
of the Eddington rate for a 10
![]() black hole. These hot flows at high accretion rate can be probably associated with the optically thin, geometrically thick
solutions (e.g. Abramowicz et al. 1995) that can reach, for a viscosity parameter
black hole. These hot flows at high accretion rate can be probably associated with the optically thin, geometrically thick
solutions (e.g. Abramowicz et al. 1995) that can reach, for a viscosity parameter
![]() ,
a rate of the order of the Eddington one.
,
a rate of the order of the Eddington one.
The mechanism of jet launching, likely to be determined by the disk structure in the region closer to the black hole, might not be sensitive to the gas history, but only to the final accretion rate. Provided that this reaches comparable high levels in HEG and LEG, radio structures of similar morphology and power can be formed in the two sub-classes.
4.2 Radio-loud vs. radio-quiet (SDSS) AGN
The separation between HEG and LEG is reminiscent of that found by
K06 for the SDSS sources, mostly radio-quiet AGN. However, we find
a significant number of LEG located above the line marking the
transition between LINERs and Seyferts. The location of LEG shows an
upward
scatter with respect to the ``finger'' of highest LINERs density by ![]() 0.2 dex in the [O III]/H
0.2 dex in the [O III]/H![]() ratio.
As already noted there is a substantial mismatch in luminosity
between the 3CR and the SDSS sources. Our data are not sufficient
to conclude whether this is due to a genuine difference between the
(mostly) radio-quiet AGN of the SDSS and the radio-loud AGN of the
3CR sample (due e.g. to a contribution of jets emission to
the line excitation) or simply to a luminosity difference.
ratio.
As already noted there is a substantial mismatch in luminosity
between the 3CR and the SDSS sources. Our data are not sufficient
to conclude whether this is due to a genuine difference between the
(mostly) radio-quiet AGN of the SDSS and the radio-loud AGN of the
3CR sample (due e.g. to a contribution of jets emission to
the line excitation) or simply to a luminosity difference.
Similarly, we noted that the 3CR sources are concentrated along the edges of the SDSS density distribution. The first possibility to account for the location of SDSS and 3CR sources is again a general difference in the spectroscopic behavior between radio-quiet and radio-loud AGN. Alternatively, the location of the SDSS sources could be due to the contamination of star forming regions. In this scenario, this results in a large spread in the line ratios, depending on the relative contribution of the line emission produced by the active nucleus and by star formation. The sources would be then distributed along a mixing region (possibly the ``fingers'' seen in Figs. 1 and 2), ranging from a ``pure'' AGN to a star forming spectrum. In the case of 3CR sources, the higher line luminosity is likely to be indication of a dominant AGN contribution, also considering the general weakness of star formation in their early type host with respect to later types.
The analysis of radio-loud AGN of lower luminosity can be used to test these alternative hypothesis.
5 Summary and conclusions
We used measurements of emission lines for a 92% complete survey of the 3CR sample of radio-galaxies with z < 0.3 to explore their spectroscopic properties. The different steps used to classify the 3CR sources in the various sub-populations can be summarized as follows:

- Excitation index diagram: we first considered a new spectroscopic indicator,
the excitation index, defined as EI = log [O III]/H
 - 1/3 (log [N II]/H
 + log [S II]/H + log [O I]/H)
and representing the relative intensity of high and low excitation
lines. The presence of a bimodal distribution of EI allows us to define
two main spectroscopic classes, LEG and HEG, with LEG being sources
with EI
+ log [S II]/H + log [O I]/H)
and representing the relative intensity of high and low excitation
lines. The presence of a bimodal distribution of EI allows us to define
two main spectroscopic classes, LEG and HEG, with LEG being sources
with EI  0.95. The drawback of this definition is that it requires the measurements of all 6 diagnostic lines.
-
- Diagnostic diagrams: the close correspondence between
the excitation index and the location in the 3 ``standard''
diagnostic diagrams enabled us to define a class membership in a less
ideal situation, i.e. when in addition to H,
H
and [O III], only one or two lines among [S II],
[O I] or [N II] can be measured, defining as LEG all
sources for which:
![\begin{eqnarray*}&&\log~[{\rm O~III}]/{\rm H\beta} - \log ~ [{\rm N~II}]/{\rm H\...
...m O~III}]/{\rm H\beta} - \log~[{\rm O~I}]/{\rm H\alpha} \la 1.4.
\end{eqnarray*}](/articles/aa/full_html/2010/01/aa13290-09/img95.png)
-
- Optical line-radio correlation. We also used the
![$L_{\rm [OIII]}$](/articles/aa/full_html/2010/01/aa13290-09/img1.png) vs.
vs.
 correlation
to extend the classification for objects with the only requirement of a
[O III] line measurement. This is due to the rather well
defined separation in line emission, at fixed radio power, between HEG
and LEG. In particular we found
correlation
to extend the classification for objects with the only requirement of a
[O III] line measurement. This is due to the rather well
defined separation in line emission, at fixed radio power, between HEG
and LEG. In particular we found
![\begin{eqnarray*}&& -1 \la {\rm log} ({L_{\rm [O~III]}}/\nu L_{178}) \la ~~ 0.5~...
...\rm log} ({L_{\rm [O~III]}}/\nu L_{178}) \la -0.5~{\rm for~LEG}.
\end{eqnarray*}](/articles/aa/full_html/2010/01/aa13290-09/img97.png)
The ELEG are particularly intriguing, being well offset from the rest of 3CR sample in all diagnostic diagrams. They are also characterized by very low values of the ratio between [O III] and radio luminosity as well as of core dominance. We defer to a forthcoming paper a more detailed analysis of these sources.
The dual population of HEG and LEG is reminiscent of the
Seyfert and LINERs subclasses found in the SDSS emission line
galaxies. Indeed, at zero-th order, the spectroscopic properties of
radio-loud AGN of the 3CR and the (mostly) radio-quiet AGN of the SDSS
are rather similar. However, looking at finer details, the separation
between LEG and HEG shows an upward scatter by ![]() 0.2 dex in the [O III]/H
0.2 dex in the [O III]/H![]() ratio
with respect to the transition from LINER to Seyfert. Furthermore, the
3CR sources are concentrated along the edges of the
SDSS density distribution in the spectroscopic diagnostic
diagrams. Both results could be related to the substantial mismatch in
luminosity between the two samples, the 3CR being brighter by an
average factor of 30 in emission line than the SDSS sources.
However, we cannot exclude that the location of SDSS and
3CR source is an indication of a genuine difference in the
spectroscopic behavior of radio-quiet and radio-loud AGN. The analysis
of radio-loud AGN of lower luminosity can be used to test these
alternative hypothesis.
ratio
with respect to the transition from LINER to Seyfert. Furthermore, the
3CR sources are concentrated along the edges of the
SDSS density distribution in the spectroscopic diagnostic
diagrams. Both results could be related to the substantial mismatch in
luminosity between the two samples, the 3CR being brighter by an
average factor of 30 in emission line than the SDSS sources.
However, we cannot exclude that the location of SDSS and
3CR source is an indication of a genuine difference in the
spectroscopic behavior of radio-quiet and radio-loud AGN. The analysis
of radio-loud AGN of lower luminosity can be used to test these
alternative hypothesis.
Let us now summarize the similarities and differences between
the two main spectroscopic classes of RG. All broad-line objects
are HEG from the point of view of their narrow emission line ratios,
but no LEG shows broad line in its spectrum. While all HEG are
associated with FR II radio-galaxies, LEG are of both
FR I and FR II type. HEG are only found in relatively
bright
radio sources, log
![]() .
Instead LEG cover the whole range of radio power (30.7
.
Instead LEG cover the whole range of radio power (30.7 ![]() log L178
log L178 ![]() 35.4), the brightest of them being FR II. HEG and LEG obey to two linear
correlations between line and radio emission, with a slope consistent with unity and a rms
35.4), the brightest of them being FR II. HEG and LEG obey to two linear
correlations between line and radio emission, with a slope consistent with unity and a rms ![]() 0.5 dex. HEG are brighter than LEG by a factor of
0.5 dex. HEG are brighter than LEG by a factor of ![]() in [O III] line.
in [O III] line.
Conversely, the substantial superposition of the host galaxy
luminosity of the two classes suggests that the distribution of their
black hole masses is not strongly different, with the vast majority of
the objects confined in the range 8.5 ![]() log
log
![]() /
/![]()
![]() 9.5. Considering
only the LEG with a FR II morphology, a further similarity
with HEG emerges from the analysis of their radio structure.
LEG/FR II extend over the same range of radio power of HEG and
have the same level of radio core dominance. The fact that the radio
properties of LEG/FR II and HEG are essentially indistinguishable
is an indication that the two classes share the same range of
jet power.
9.5. Considering
only the LEG with a FR II morphology, a further similarity
with HEG emerges from the analysis of their radio structure.
LEG/FR II extend over the same range of radio power of HEG and
have the same level of radio core dominance. The fact that the radio
properties of LEG/FR II and HEG are essentially indistinguishable
is an indication that the two classes share the same range of
jet power.
While the differences in terms of line intensities and line ratios (as well as in optical and IR nuclear luminosities) can be interpreted in a framework in which LEG are associated with a lower accretion rate than HEG, the similarity of the radio properties of the two sub-populations (having established that they do not differ in terms of black hole mass) would require that the process of jet launching is essentially decoupled from the level of accretion. This is the case, for example, of the Blandford-Znajek process that envisages jets powered by the extraction of rotational energy from a spinning black hole.
We instead speculated that the separation between LEG and HEG is due to a different mode of accretion: while HEG are powered by cold gas, LEG accrete hot gas, a mechanism that has been already demonstrated to be able to account for the activity of FR I radio-galaxies. The high initial temperature of the in-flowing gas in LEG prevents the formation of the various ``cold'' AGN structures, such as molecular tori and Broad Line Regions, seen in HEG but not in LEG. The radiative output of a ``hot'' accretion disk is reduced with respect to a standard geometrically thin disk, at a given accretion rate, due to the lower cooling at these temperatures and it will be emitted mostly at high energies. The harder spectrum and the lower number of ionizing photons gives rise to emission lines of lower luminosity and excitation, producing the spectral separation in lines properties between LEG and HEG. Since the mechanism of jet launching operates in the innermost regions of the accretion flow, it is likely that the memory of the initial gas conditions are effectively canceled and that the jet power is sensitive only to the final accretion rate.
The attractiveness of this scheme is that it can reproduce simultaneously, by only varying the initial temperature of the accreting gas, the various differences between LEG and HEG. Clearly this hypothesis must be analyzed in greater detail, exploring the properties of the proposed hot accretion flows combined to a high accretion rate. In particular a crucial requirement is that the coronal accreting gas must be able to remain hot during the inflow. The proposed scenario can also be tested and constrained using the limits on the nuclear LEG emission in the various observing bands. It is also of great interest to establish whether LEG can be found in objects of at most moderate redshift (and, consequently, power) such as those considered here, or, conversely, can be associated even with radio galaxies of the highest luminosity.
Summarizing, we found that the radio-galaxies in the 3CR sample are composed by two main populations, separated on the basis of their emission line properties. However, this does not correspond simply to a difference in their radio properties. We propose a scenario in which the two classes are associated with a different mode of accretion, set by the initial temperature of the inflowing gas.
AcknowledgementsS.B. and A.Ce. acknowledge the Italian MIUR for financial support. This publication makes use of data products from the Two Micron All Sky Survey, which is a joint project of the University of Massachusetts and the Infrared Processing and Analysis Center/California Institute of Technology, funded by the National Aeronautics and Space Administration and the National Science Foundation.
References
- Abramowicz, M. A., Chen, X., Kato, S., Lasota, J.-P., & Regev, O. 1995, ApJ, 438, L37 [NASA ADS] [CrossRef] [Google Scholar]
- Akujor, C. E., Spencer, R. E., Zhang, F. J., et al. 1991, MNRAS, 250, 215 [NASA ADS] [CrossRef] [Google Scholar]
- Allen, S. W., Dunn, R. J. H., Fabian, A. C., Taylor, G. B., & Reynolds, C. S. 2006, MNRAS, 372, 21 [NASA ADS] [CrossRef] [Google Scholar]
- Antonucci, R. 1993, ARA&A, 31, 473 [Google Scholar]
- Antonucci, R. R. J. 1984, ApJ, 278, 499 [NASA ADS] [CrossRef] [Google Scholar]
- Ashman, K. M., Bird, C. M., & Zepf, S. E. 1994, AJ, 108, 2348 [NASA ADS] [CrossRef] [Google Scholar]
- Baldi, R., Chiaberge, M., Capetti, A., Macchetto, F., & Sparks, W. 2009, ApJ, submitted [Google Scholar]
- Baldi, R. D., & Capetti, A. 2008, A&A, 489, 989 [Google Scholar]
- Baldwin, J. A., Phillips, M. M., & Terlevich, R. 1981, PASP, 93, 5 [NASA ADS] [CrossRef] [EDP Sciences] [Google Scholar]
- Balmaverde, B., Baldi, R. D., & Capetti, A. 2008, A&A, 486, 119 [Google Scholar]
- Baum, S. A., & Heckman, T. 1989a, ApJ, 336, 681 [NASA ADS] [CrossRef] [Google Scholar]
- Baum, S. A., & Heckman, T. 1989b, ApJ, 336, 702 [NASA ADS] [CrossRef] [Google Scholar]
- Black, A. R. S., Baum, S. A., Leahy, J. P., et al. 1992, MNRAS, 256, 186 [NASA ADS] [Google Scholar]
- Blandford, R. D., & Znajek, R. L. 1977, MNRAS, 179, 433 [NASA ADS] [CrossRef] [Google Scholar]
- Buttiglione, S., Capetti, A., Celotti, A., et al. 2009, A&A, 495, 1033 [Google Scholar]
- Capetti, A., Fanti, R., & Parma, P. 1995, A&A, 300, 643 [Google Scholar]
- Capetti, A., Verdoes Kleijn, G. A., & Chiaberge, M. 2005, A&A, 439, 935 [Google Scholar]
- Chiaberge, M., Capetti, A., & Celotti, A. 2000, A&A, 355, 873 [Google Scholar]
- Chiaberge, M., Capetti, A., & Celotti, A. 2002, A&A, 394, 791 [Google Scholar]
- Donzelli, C. J., Chiaberge, M., Macchetto, F. D., et al. 2007, ApJ, 667, 780 [NASA ADS] [CrossRef] [Google Scholar]
- Dumont, A. M. 1992, A&A, 254, 454 [Google Scholar]
- Fanaroff, B. L., & Riley, J. M. 1974, MNRAS, 167, 31P [Google Scholar]
- Ghisellini, G., & Celotti, A. 2001, A&A, 379, L1 (GC01) [Google Scholar]
- Gopal-Krishna, & Wiita, P. J. 2000, A&A, 363, 507 [Google Scholar]
- Govoni, F., Falomo, R., Fasano, G., & Scarpa, R. 2000, A&A, 353, 507 [Google Scholar]
- Hardcastle, M. J., Evans, D. A., & Croston, J. H. 2009, MNRAS, 396, 1929 [NASA ADS] [CrossRef] [Google Scholar]
- Heckman, T. M. 1980, A&A, 87, 152 [Google Scholar]
- Hine, R. G., & Longair, M. S. 1979, MNRAS, 188, 111 [NASA ADS] [Google Scholar]
- Kewley, L. J., Dopita, M. A., Sutherland, R. S., Heisler, C. A., & Trevena, J. 2001, ApJ, 556, 121 [Google Scholar]
- Kewley, L. J., Groves, B., Kauffmann, G., & Heckman, T. 2006a, MNRAS, 372, 961 [NASA ADS] [CrossRef] [Google Scholar]
- Kewley, L. J., Groves, B., Kauffmann, G., & Heckman, T. 2006b, MNRAS, 372, 961 (K06) [NASA ADS] [CrossRef] [Google Scholar]
- Labiano, A. 2008, A&A, 488, L59 [Google Scholar]
- Laing, R. A., Jenkins, C. R., Wall, J. V., & Unger, S. W. 1994, in The Physics of Active Galaxies, ed. G. V. Bicknell, M. A. Dopita, & P. J. Quinn, ASP Conf. Ser., 54, 201 [Google Scholar]
- Ledlow, M. J., & Owen, F. N. 1996, AJ, 112, 9 [NASA ADS] [CrossRef] [Google Scholar]
- Mannucci, F., Basile, F., Poggianti, B. M., et al. 2001, MNRAS, 326, 745 [NASA ADS] [CrossRef] [Google Scholar]
- Marchesini, D., Celotti, A., & Ferrarese, L. 2004, MNRAS, 351, 733 [CrossRef] [Google Scholar]
- Marconi, A., & Hunt, L. K. 2003, ApJ, 589, L21 [NASA ADS] [CrossRef] [Google Scholar]
- Morganti, R., Ulrich, M.-H., & Tadhunter, C. N. 1992, MNRAS, 254, 546 [NASA ADS] [Google Scholar]
- Morganti, R., Tadhunter, C. N., Dickson, R., & Shaw, M. 1997, A&A, 326, 130 [Google Scholar]
- Nagao, T., Murayama, T., Shioya, Y., & Taniguchi, Y. 2002, ApJ, 567, 73 [NASA ADS] [CrossRef] [Google Scholar]
- Rawlings, S., & Saunders, R. 1991, Nature, 349, 138 [NASA ADS] [CrossRef] [Google Scholar]
- Rawlings, S., Saunders, R., Eales, S. A., & Mackay, C. D. 1989, MNRAS, 240, 701 [NASA ADS] [Google Scholar]
- Skrutskie, M. F., Cutri, R. M., Stiening, R., et al. 2006, AJ, 131, 1163 [NASA ADS] [CrossRef] [Google Scholar]
- Smolcic, V. 2009, ApJ, 699, L43 [NASA ADS] [CrossRef] [Google Scholar]
- Spinrad, H., Marr, J., Aguilar, L., & Djorgovski, S. 1985, PASP, 97, 932 [NASA ADS] [CrossRef] [Google Scholar]
- Stoughton, C., Lupton, R. H., Bernardi, M., et al. 2002, AJ, 123, 485 [NASA ADS] [CrossRef] [Google Scholar]
- Tadhunter, C. N., Morganti, R., Robinson, A., et al. 1998, MNRAS, 298, 1035 [NASA ADS] [CrossRef] [Google Scholar]
- Urry, C. M., & Padovani, P. 1995, PASP, 107, 803 [NASA ADS] [CrossRef] [Google Scholar]
- Veilleux, S., & Osterbrock, D. E. 1987, ApJS, 63, 295 [NASA ADS] [CrossRef] [Google Scholar]
- Willott, C. J., Rawlings, S., Blundell, K. M., & Lacy, M. 1999, MNRAS, 309, 1017 [NASA ADS] [CrossRef] [Google Scholar]
- Wills, K. A., Morganti, R., Tadhunter, C. N., Robinson, T. G., & Villar-Martin, M. 2004, MNRAS, 347, 771 [NASA ADS] [CrossRef] [Google Scholar]
- Yip, C. W., Connolly, A. J., Vanden Berk, D. E., et al. 2004, AJ, 128, 2603 [NASA ADS] [CrossRef] [Google Scholar]
- York, D. G., Adelman, J., Anderson, Jr., J. E., et al. 2000, AJ, 120, 1579 [Google Scholar]
- Young, S., Hough, J. H., Axon, D. J., Fabian, A. C., & Ward, M. J. 1998, MNRAS, 294, 478 [NASA ADS] [CrossRef] [Google Scholar]
- Zirbel, E. L. 1997, ApJ, 476, 489 [NASA ADS] [CrossRef] [Google Scholar]
- Zirbel, E. L., & Baum, S. A. 1995, ApJ, 448, 521 [NASA ADS] [CrossRef] [Google Scholar]
Footnotes
- ... AGN
- Based on observations made with the Italian Telescopio Nazionale Galileo operated on the island of La Palma by the Centro Galileo Galilei of INAF (Istituto Nazionale di Astrofisica) at the Spanish Observatorio del Roque del los Muchachos of the Instituto de Astrofísica de Canarias.
- ... Paper I
- We removed 3C 270 from the list of observed objects since the SDSS fiber was not positioned on the galaxy's nucleus (Christian Leipski, private communication).
- ... (3C 198
- The source is not present in the middle diagram because the [S II] lines are not covered by its SDSS spectrum.
- ...
- For 3 sources (namely 3C 028, 3C 035, and
3C 066B) we could only measure the [S II]
 6716 line.
We estimated the total [S II] flux adopting equal
intensities in the two lines and increased the line error to consider
this approximation.
6716 line.
We estimated the total [S II] flux adopting equal
intensities in the two lines and increased the line error to consider
this approximation.
- ...(Ashman et al. 1994)
- Available at cas.umkc.edu/physics/ashman/blake.html
- ... analysis
- We exclude 3C 234 from the sub-sample of Broad
Lined Objects since for this source Antonucci
(1984) reports a high level of polarization (
 )
for the broad emission line and continuum, at odds with the usually low
level of polarization of Broad Line radio-galaxies. He interpreted this
result as due to scattering of an otherwise hidden nucleus, at least in
the optical band (Young et al.
1998). The observed broad line in this object represents only
the small fraction of the intrinsic BLR emission that is
reflected into our line of sight.
)
for the broad emission line and continuum, at odds with the usually low
level of polarization of Broad Line radio-galaxies. He interpreted this
result as due to scattering of an otherwise hidden nucleus, at least in
the optical band (Young et al.
1998). The observed broad line in this object represents only
the small fraction of the intrinsic BLR emission that is
reflected into our line of sight.
- ...)
- The only outlier from this trend is 3C 234, already discussed previously, and in which the observed broad lines are due to scattered light.
- ...Willott et al. (1999)
- Available at http://www.science.uottawa.ca/ cwillott/3crr/3crr.html
- ... component
- We estimated a limit to their broad H flux of 1.6
 10-15 and 1.8
 for
3C 079 and 3C 223 respectively. Given their
[O III] fluxes, these limits correspond to a factor
of 200-300 lower than the mean value
for
3C 079 and 3C 223 respectively. Given their
[O III] fluxes, these limits correspond to a factor
of 200-300 lower than the mean value
 =
8
=
8
![$F_{\rm[O~III]}$](/articles/aa/full_html/2010/01/aa13290-09/img55.png) reported in Sect. 3.3
(see also Fig. 9).
reported in Sect. 3.3
(see also Fig. 9).
- ... as
- Following Rawlings
& Saunders (1991) the ionizing radiation is related
to the NLR total
luminosity as

 C
C
 ,
where C is the covering factor of the NLR,
for which we assume a value of 0.01.
is derived as
,
where C is the covering factor of the NLR,
for which we assume a value of 0.01.
is derived as
![$L_{\rm NLR} = 3 \cdot (3 L_{\rm [O~II]} + 1.5 L_{\rm [O~III]})$](/articles/aa/full_html/2010/01/aa13290-09/img67.png) and
and ![$L_{\rm [O~III]} = 4 L_{\rm [O~II]}$](/articles/aa/full_html/2010/01/aa13290-09/img68.png) .
.
All Tables
Table 1: Spectral classification breakdown.
Table 2: Multiwavelength data and spectroscopic classification.
All Figures
|
|
Figure 1:
Diagnostic diagrams. Left column: 3CR sources with symbol sizes increasing with [O III] luminosity (log
|
| Open with DEXTER | |
| In the text | |
|
|
Figure 2:
log [O III]/H |
| Open with DEXTER | |
| In the text | |
|
|
Figure 3: Line ratios index (LRI, see text for its definition). The contour lines indicate the distribution of the SDSS emission line galaxies (K06). The circles indicate the 3CR sources (the symbol size is proportional to the [O III] luminosity, see Fig. 1). |
| Open with DEXTER | |
| In the text | |
|
|
Figure 4: Histogram of the number of 3CR sources as function of the excitation index (see text) representing the overall ratio of high and low excitation emission lines. Graphically, it is a coordinate axis parallel to the anti-bisectrix of Fig. 3. |
| Open with DEXTER | |
| In the text | |
|
|
Figure 5: Ratio of line and radio luminosities vs. excitation index. |
| Open with DEXTER | |
| In the text | |
|
|
Figure 6:
Left panel: LRI vs. log [O III]/H |
| Open with DEXTER | |
| In the text | |
|
|
Figure 7: Diagnostic diagrams for
3CR sources after the classification into
HEG (blue circles) and LEG (red squares) made using the excitation
index. Crossed circles are broad line galaxies, green crosses are
extremely low [O III]/H |
| Open with DEXTER | |
| In the text | |
|
|
Figure 8:
[O III] and H |
| Open with DEXTER | |
| In the text | |
|
|
Figure 9:
Comparison of the broad H |
| Open with DEXTER | |
| In the text | |
|
|
Figure 10: Comparison of the radio luminosity at 178 MHz versus the magnitude in H band of the host galaxy for the various sub-populations of 3CR sources. Left panel: 3CR sources divided into FR I (green diamonds) and FR II (pink stars); right panel: comparison between HEG (blue circles) and LEG (FR I = crossed red squares, LEG FR II = filled red squares, LEG of uncertain FR type = empty red squares). The solid line marks the separation between FR I (below the line) and FR II (above the line) according to Ledlow & Owen (1996). |
| Open with DEXTER | |
| In the text | |
|
|
Figure 11:
Comparison of [O III] line luminosity (in erg s-1) and H band host magnitude for 3CR sources. Symbols are as in the right panel of Fig. 10,
i.e. HEG = blue circles, LEG = red squares (filled for
FR II, crossed for FR I, empty for uncertain FR type.
The right axis reports the ionizing luminosity (in erg s-1) while the upper axis reports the estimated black hole mass in solar units. The solid and dashed lines correspond to
|
| Open with DEXTER | |
| In the text | |
Copyright ESO 2010
Current usage metrics show cumulative count of Article Views (full-text article views including HTML views, PDF and ePub downloads, according to the available data) and Abstracts Views on Vision4Press platform.
Data correspond to usage on the plateform after 2015. The current usage metrics is available 48-96 hours after online publication and is updated daily on week days.
Initial download of the metrics may take a while.