| Issue |
A&A
Volume 509, January 2010
|
|
|---|---|---|
| Article Number | A38 | |
| Number of page(s) | 5 | |
| Section | Extragalactic astronomy | |
| DOI | https://doi.org/10.1051/0004-6361/200912943 | |
| Published online | 14 January 2010 | |
Comparison between the luminosity functions of X-ray and [OIII] selected AGN
I. Georgantopoulos - A. Akylas
Institute of Astronomy & Astrophysics, National Observatory of Athens, Palaia Penteli, 15236, Athens, Greece
Received 21 July 2009 / Accepted 23 October 2009
Abstract
We investigate claims according to which the X-ray selection of AGN is not as efficient
compared to that based on [OIII] selection because of the effects of X-ray absorption.
We construct the predicted X-ray luminosity function both for all Seyferts as well as separately
for Seyfert-1 and Seyfert-2 type galaxies, by combining the optical AGN [OIII] luminosity functions
computed in SDSS with the corresponding
![]() relations.
These relations are derived from XMM-Newton observations of all Seyfert galaxies
in the Palomar spectroscopic sample of nearby galaxies after a correction for X-ray absorption and optical reddening.
We compare the predicted X-ray luminosity functions with those actually observed in the local Universe by
HEAO-1, RXTE as well as INTEGRAL. The last luminosity function is obtained in the 17-60 keV
region and thus is not affected by absorption even in the case of Compton-thick sources.
In the common luminosity regions, the optically and X-ray selected Seyfert galaxies show reasonable agreement.
We thus find no evidence that the [OIII] selection provides a more robust tracer of powerful AGN compared
to the X-ray. Still, the optical selection probes less luminous Seyferts compared to the current X-ray surveys.
These low luminosity levels, are populated by a large number of X-ray unobscured Seyfert-2 galaxies.
relations.
These relations are derived from XMM-Newton observations of all Seyfert galaxies
in the Palomar spectroscopic sample of nearby galaxies after a correction for X-ray absorption and optical reddening.
We compare the predicted X-ray luminosity functions with those actually observed in the local Universe by
HEAO-1, RXTE as well as INTEGRAL. The last luminosity function is obtained in the 17-60 keV
region and thus is not affected by absorption even in the case of Compton-thick sources.
In the common luminosity regions, the optically and X-ray selected Seyfert galaxies show reasonable agreement.
We thus find no evidence that the [OIII] selection provides a more robust tracer of powerful AGN compared
to the X-ray. Still, the optical selection probes less luminous Seyferts compared to the current X-ray surveys.
These low luminosity levels, are populated by a large number of X-ray unobscured Seyfert-2 galaxies.
Key words: X-rays: general - X-rays: diffuse background - X-rays: galaxies
1 Introduction
Since the detection of the nearby AGN 3C 273 in X-rays by UHURU (Kellogg et al. 1971), X-ray observations have been considered to be the primary tool for selecting AGN. Recently, the deepest ever observations in the Chandra Deep Field North and South (Alexander et al. 2003; Giaconni et al. 2002; Luo et al. 2008) have resolved 80-90% of the extragalactic X-ray light, the X-ray background, in the 2-10 keV band. These observations reveal a sky density of about 5000 sources per square degree (Bauer et al. 2004), the vast majority of which are AGN (for a review see Brandt & Hasinger 2005). These surveys made it possible to derive the luminosity function and probed with good accuracy the accretion history of the Universe (Ueda et al. 2003; La Franca et al. 2005; Barger et al. 2005).In the local Universe, the X-ray luminosity function has been determined from the wide-angle surveys
of RXTE and HEAO-1. Sazonov & Revnitsev (2004) derived the luminosity function for bright AGN,
detected at fluxes >
![]()
![]() in the 3-20 keV band, in the RXTE slew survey.
Shinozaki et al. (2006) derived the luminosity function of AGN using the all-sky HEAO-1 in the 2-10 keV band.
Even these hard X-ray surveys may be missing a number of extremely obscured AGN. In the case of
Compton-thick AGN, at column densities
>1024
in the 3-20 keV band, in the RXTE slew survey.
Shinozaki et al. (2006) derived the luminosity function of AGN using the all-sky HEAO-1 in the 2-10 keV band.
Even these hard X-ray surveys may be missing a number of extremely obscured AGN. In the case of
Compton-thick AGN, at column densities
>1024
![]() (equivalent to
(equivalent to
![]() using the Galactic dust-to-gas ratio), a
large fraction of the intrinsic flux will be absorbed.
The SWIFT (Gehrels et al. 2004) and the INTEGRAL missions (Winkler et al. 2003), which carry ultra-hard X-ray
detectors (>15 keV) albeit with limited imaging capabilities
probed energies which are immune to X-ray obscuration up to column
densities of 1025
using the Galactic dust-to-gas ratio), a
large fraction of the intrinsic flux will be absorbed.
The SWIFT (Gehrels et al. 2004) and the INTEGRAL missions (Winkler et al. 2003), which carry ultra-hard X-ray
detectors (>15 keV) albeit with limited imaging capabilities
probed energies which are immune to X-ray obscuration up to column
densities of 1025
![]() .
These missions helped
towards further constraining the number density of such heavily absorbed sources
at very bright fluxes,
.
These missions helped
towards further constraining the number density of such heavily absorbed sources
at very bright fluxes,
![]()
![]() in the local Universe, z<0.1(Beckmann et al. 2006; Bassani et al. 2006;
Winter et al. 2008; Winter et al. 2009).
The luminosity function in these energies has been calculated by Sazonov et al. (2007),
Paltani et al. (2008) and Tueller et al. (2009).
It appears that the fraction of Compton-thick sources is small, and thus
the RXTE and HEAO-1 luminosity functions are little affected.
in the local Universe, z<0.1(Beckmann et al. 2006; Bassani et al. 2006;
Winter et al. 2008; Winter et al. 2009).
The luminosity function in these energies has been calculated by Sazonov et al. (2007),
Paltani et al. (2008) and Tueller et al. (2009).
It appears that the fraction of Compton-thick sources is small, and thus
the RXTE and HEAO-1 luminosity functions are little affected.
Table 1: LogX-ray vs. Log[OIII] luminosity relation in optically selected AGN.
In the optical, QSOs have been traditionally selected using colours (Schmidt & Green 1983; Marshall et al. 1987; Boyle et al. 2000). The advent of the 2dF (Croom et al. 2004) and the SDSS (York et al. 2000) surveys have generated vast samples of QSOs providing a leap forward in the study of their luminosity function. The derived sky density of QSOs (few hundred per square degree) is at least an order of magnitude lower than the one derived from X-ray surveys. This is because the colour selection of AGN requires that the nuclear optical luminosity is much higher than that of the host galaxy for the AGN to be detected (typically MB<-23). Therefore the optical selection based on colours is biased against low luminosity AGN in contrast to the X-ray selection.
The limitations of colour optical selection techniques can be circumvented
by selecting AGN via their emission lines. Such methods
can extend the optical luminosity function
to low luminosities. Ho et al. (1997) carried out a spectroscopic survey of about
500 nearby galaxies selected from the revised Shapley-Ames catalogue (Sandage & Tammann 1981).
They identified Seyfert emission-line characteristics in 52 galaxies.
Ulvestad & Ho (2001) calculated the optical B-band luminosity function from their sample
extending the AGN luminosity function to
![]() (see also Georgantopoulos et al. 1999).
A limitation in the above works is that the B-band is strongly affected by the host galaxy light.
Hao et al. (2005a) extended these results significantly,
using the SDSS survey to select a sample of about 3000 AGN
in the redshift range 0<z<0.15. Hao et al. (2005b) derive the Ha and [OIII]
(see also Georgantopoulos et al. 1999).
A limitation in the above works is that the B-band is strongly affected by the host galaxy light.
Hao et al. (2005a) extended these results significantly,
using the SDSS survey to select a sample of about 3000 AGN
in the redshift range 0<z<0.15. Hao et al. (2005b) derive the Ha and [OIII]
![]() luminosity function separately for Seyfert-1 and Seyfert-2 galaxies.
The [OIII] line is considered a much better proxy of the nuclear power as compared to the B-band luminosity,
although in the case of strong star-forming emission some contamination of the [OIII] emission is expected.
luminosity function separately for Seyfert-1 and Seyfert-2 galaxies.
The [OIII] line is considered a much better proxy of the nuclear power as compared to the B-band luminosity,
although in the case of strong star-forming emission some contamination of the [OIII] emission is expected.
The question which arises is whether the optical emission lines or the X-ray selection methods
are more efficient
for finding low-luminosity AGN. This can be addressed by comparing the X-ray and optical AGN luminosity
functions. Heckman et al. (2005) addressed this issue by converting the
optical [OIII] Seyfert (combined type 1 and type 2) luminosity function of Hao et al. (2005b)
to X-ray wavelengths using the
relation between X-ray and [OIII] luminosity. Comparison with the RXTE X-ray luminosity function reveals
that the latter lies consistently below the optical one. As these authors have
intentionally neglected the X-ray absorption, they conclude that the mismatch between the two
luminosity functions can be more naturally attributed to absorption in X-ray wavelengths.
The overall conclusion from this work is that the optical [OIII] emission may provide a
more efficient method for picking AGN.
In this paper we attempt to further address this issue and to understand the
reason for the disagreement found by Heckman et al. (2005).
We derive the X-ray luminosity function again from the [OIII] luminosity function of
Hao et al. by combining it with the
![]() relation derived from
XMM-Newton observations (Akylas & Georgantopoulos 2009) of all the Seyferts in
the Ho et al. sample. Our analysis involves the following improvements:
relation derived from
XMM-Newton observations (Akylas & Georgantopoulos 2009) of all the Seyferts in
the Ho et al. sample. Our analysis involves the following improvements:
- the available XMM-Newton spectra allow the correction of the X-ray absorption;
- we produce individually the luminosity function of Seyfert-1 and Seyfert-2 galaxies;
- we obtain the X-ray luminosity function from the bi-variate optical/X-ray
luminosity function taking fully into consideration the
![$L_{\rm X}-L_{\rm [OIII]}$](/articles/aa/full_html/2010/01/aa12943-09/img1.png) relation and its
dispersion.
relation and its
dispersion.
2 The relation between X-ray and [OIII] luminosity
We explore the relation between the X-ray and [OIII] luminosity for the
optically selected Seyfert galaxies in the
Palomar spectroscopic survey of nearby galaxies
(Ho et al. 1995). This survey has taken
high quality spectra of 486 bright (
BT < 12.5 mag), northern
(
![]() )
galaxies selected from the Revised Shapley-
Ames Catalogue of Bright Galaxies (RSAC, Sandage &
Tammann 1979) and produced a comprehensive and homogeneous
catalogue of nearby Seyfert galaxies.
Akylas & Georgantopoulos (2009) present XMM-Newton X-ray spectra
for all sources with a reliable Seyfert classification.
There are 38 sources in the sample, of which 30 are classified
as type-2 and eight as type-1.
We correct the X-ray luminosities for absorption using
the observed column densities given in that paper.
There are five Seyfert-2 galaxies which do not show
absorption in their individual spectra. However, their
stacked spectrum shows evidence for absorption.
We choose to discard these galaxies from further analysis
as we cannot correct accurately for their absorbed luminosity.
We further discard two objects as they either have an uncertain [OIII] flux
or their AGN classification has been questioned (see Akylas & Georgantopoulos 2009).
This leaves us with a sample of 23 Seyfert-2 galaxies.
A large number (12) of these show no intrinsic absorption,
but still their
)
galaxies selected from the Revised Shapley-
Ames Catalogue of Bright Galaxies (RSAC, Sandage &
Tammann 1979) and produced a comprehensive and homogeneous
catalogue of nearby Seyfert galaxies.
Akylas & Georgantopoulos (2009) present XMM-Newton X-ray spectra
for all sources with a reliable Seyfert classification.
There are 38 sources in the sample, of which 30 are classified
as type-2 and eight as type-1.
We correct the X-ray luminosities for absorption using
the observed column densities given in that paper.
There are five Seyfert-2 galaxies which do not show
absorption in their individual spectra. However, their
stacked spectrum shows evidence for absorption.
We choose to discard these galaxies from further analysis
as we cannot correct accurately for their absorbed luminosity.
We further discard two objects as they either have an uncertain [OIII] flux
or their AGN classification has been questioned (see Akylas & Georgantopoulos 2009).
This leaves us with a sample of 23 Seyfert-2 galaxies.
A large number (12) of these show no intrinsic absorption,
but still their
![]() ratio is substantially lower than
that of the absorbed Seyfert-2.
Hereafter, we call this sub-sample the ``X-ray weak'' Seyfert-2 sample,
while the remaining Seyfert-2 galaxies form the ``X-ray luminous'' sample.
All eleven objects in the latter sample have very high obscuring column densities (>1023
ratio is substantially lower than
that of the absorbed Seyfert-2.
Hereafter, we call this sub-sample the ``X-ray weak'' Seyfert-2 sample,
while the remaining Seyfert-2 galaxies form the ``X-ray luminous'' sample.
All eleven objects in the latter sample have very high obscuring column densities (>1023
![]() )
with the exception of NGC 4395, which has
)
with the exception of NGC 4395, which has
![]()
![]() .
As we have only a limited number of Seyfert-1 galaxies, we
expand our sample using the 20 Seyfert-1
galaxies in the optically selected sample of Heckman et al., which is compiled from the literature
(Whittle 1992; Xu et al. 1999).
The X-ray luminosity of the Seyfert-1 sample of Heckman et al. (2005) is not corrected for
absorption as the column densities in these sources are expected to be negligible.
The [OIII] fluxes have also not been corrected for reddening.
.
As we have only a limited number of Seyfert-1 galaxies, we
expand our sample using the 20 Seyfert-1
galaxies in the optically selected sample of Heckman et al., which is compiled from the literature
(Whittle 1992; Xu et al. 1999).
The X-ray luminosity of the Seyfert-1 sample of Heckman et al. (2005) is not corrected for
absorption as the column densities in these sources are expected to be negligible.
The [OIII] fluxes have also not been corrected for reddening.
We fit a linear model to the
![]() relation assuming no errors
in
relation assuming no errors
in ![]() .
The least square fits are given in Table 1.
The
.
The least square fits are given in Table 1.
The
![]() relation separately for type-1 and type-2 sources is shown in Fig. 1.
The best fit slope is below unity in all cases. This implies that the most luminous AGN
have relatively little X-ray emission.
Panessa et al. (2006) have also derived the
relation separately for type-1 and type-2 sources is shown in Fig. 1.
The best fit slope is below unity in all cases. This implies that the most luminous AGN
have relatively little X-ray emission.
Panessa et al. (2006) have also derived the
![]() relation
using a sample of 47 optically selected nearby AGN.
These authors find a steeper than linear
relation with a slope of
relation
using a sample of 47 optically selected nearby AGN.
These authors find a steeper than linear
relation with a slope of
![]() .
Their derived slopes for the type-1 and type-2 slopes are
.
Their derived slopes for the type-1 and type-2 slopes are
![]() and
and
![]() respectively.
However, the comparison with their sample may not be straightforward as it
includes LINERS and transient objects.
respectively.
However, the comparison with their sample may not be straightforward as it
includes LINERS and transient objects.
![\begin{figure}
\par\includegraphics[height=7.cm,clip]{12943f1a.ps}\par\includegraphics[height=7.cm,clip]{12943f1b.ps}
\vspace*{2mm}
\end{figure}](/articles/aa/full_html/2010/01/aa12943-09/img38.png)
|
Figure 1: Upper panel. Seyfert-1: open squares and open triangles denote sources from the samples of Ho et al. (sample B) and Heckman et al. (sample C) respectively. Filled triangles denote the data from the sample of Sazonov & Revnivtsev (2004). The solid line is the best fit result to the joint Heckman + Ho sample (sample A). Lower panel. Seyfert-2: the open triangles refer to the ``X-ray weak'' (unabsorbed) Seyfert-2 (sample F), while the open squares refer to the X-ray luminous Seyfert-2s (sample E). The filled triangles denote the X-ray selected sample of Sazonov & Revnivtsev (2004). The solid line denotes the fit to the X-ray luminous Seyfert-2 (sample E). |
| Open with DEXTER | |
Finally, as a comparison, we quote the
![]() relation for the X-ray selected
RXTE sample of Sazonov & Revnivtsev (2004).
This sample comprises 76 Seyferts detected in the 3-20 keV band down to a flux limit
of
relation for the X-ray selected
RXTE sample of Sazonov & Revnivtsev (2004).
This sample comprises 76 Seyferts detected in the 3-20 keV band down to a flux limit
of ![]() 10-11 erg cm-2s-1.
The [OIII] luminosities have been compiled by Heckman et al. (2005) for this sample.
The X-ray luminosities have been converted to the 2-10 keV band using a photon index
of
10-11 erg cm-2s-1.
The [OIII] luminosities have been compiled by Heckman et al. (2005) for this sample.
The X-ray luminosities have been converted to the 2-10 keV band using a photon index
of
![]() (Sazonov et al. 2008) with no correction for absorption.
The least square fits are given in Table 2.
Interestingly, the Seyfert-1 follow a linear relation, while the Seyfert-2 have a slope
well below unity. The differences in the
(Sazonov et al. 2008) with no correction for absorption.
The least square fits are given in Table 2.
Interestingly, the Seyfert-1 follow a linear relation, while the Seyfert-2 have a slope
well below unity. The differences in the
![]() relation between the
various samples certainly reflects the uncertainties involved
in the determination of the predicted X-ray luminosity function.
relation between the
various samples certainly reflects the uncertainties involved
in the determination of the predicted X-ray luminosity function.
Table 2: Log X-ray vs. Log [OIII] luminosity relation in RXTE X-ray selected AGN.
3 Comparison between the X-ray and the optical luminosity function
3.1 The [OIII] luminosity function
Hao et al. (2005a) have obtained an AGN sample using spectroscopic SDSS data. They are using a low redshift sample (z<0.33) complete down to r=17.77 mag over 11513.2 The predicted X-ray luminosity function
Having a relation between the X-ray and the optical luminosity, as well as a functional form for the optical luminosity function, we can construct the bi-variate optical/X-ray luminosity function (e.g. Georgantopoulos et al. 1999). This is given by the convolution of the optical luminosity function with a probability function which defines the value of the X-ray luminosity at a given optical luminosity. Then the X-ray luminosity function is the integral of the bi-variate luminosity function over optical luminosity.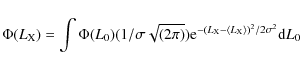
|
(1) |
where
- Seyfert-1. We use the optical Seyfert-1 luminosity function of Hao et al.
in combination with the
![\begin{figure}
\par\includegraphics[height=6cm,clip]{12943f2a.eps}
\includegrap...
...m]{12943f2b.eps}\par\includegraphics[height=6cm,clip]{12943f2c.eps}
\end{figure}](/articles/aa/full_html/2010/01/aa12943-09/img59.png)
|
Figure 2:
Upper panel. Seyfert-1: the black points denote the HEAO-1
X-ray luminosity function of Shinozaki et al. (2006); the black (short-dash) line denotes the RXTE
luminosity function of Sazonov & Revnitsev (2004); the blue (solid) line and green (long-dash) lines correspond to the predicted X-ray
luminosity function for
|
| Open with DEXTER | |
3.3 Comparison with the observed X-ray luminosity function
The X-ray luminosity has been derived in the local Universe using the RXTE slew survey data (Sazonov & Revnivtsev 2004). The authors of this survey, construct a sample of 76 non-blazar AGN, with luminosityIn Fig. 2 we compare our predicted luminosity function with the
X-ray luminosity functions described above.
The total predicted luminosity function (Sy1+2) agrees quite well both with the
luminosity function of Shinozaki et al. (2006) and of Sazonov et al. (2004).
As a comparison, we also plot the luminosity function of Ueda et al. (2003)
at z=0 as well as the INTEGRAL luminosity function derived by Sazonov et al. (2007)
in the 17-60 keV band. For the conversion to the 2-10 keV band luminosity
we assumed a slope of
![]() (Sazonov et al. 2008).
It is instructive to examine the relative fraction of Seyfert-1 and Seyfert-2
in the optical samples compared with the one in the X-ray selected samples.
In the latter, there is a preponderance of Seyfert-1
(about 3.3:1 in RXTE).
In contrast, integration of the optical luminosity functions of Seyfert-1 and Seyfert-2
shows that the two populations have approximately the same density. Only in the brighter regime
(
(Sazonov et al. 2008).
It is instructive to examine the relative fraction of Seyfert-1 and Seyfert-2
in the optical samples compared with the one in the X-ray selected samples.
In the latter, there is a preponderance of Seyfert-1
(about 3.3:1 in RXTE).
In contrast, integration of the optical luminosity functions of Seyfert-1 and Seyfert-2
shows that the two populations have approximately the same density. Only in the brighter regime
(
![]() ), where there is an overlap with the X-ray luminosity function,
the number of Seyfert-1 is 2.5 times higher than that of Seyfert-2 (rather more in line with
the X-ray selected samples).
), where there is an overlap with the X-ray luminosity function,
the number of Seyfert-1 is 2.5 times higher than that of Seyfert-2 (rather more in line with
the X-ray selected samples).
In a next step, we compare the luminosity functions for type-1 and 2 Seyferts separately.
We have to bear in mind that the optical luminosity function
(and thus the predicted X-ray luminosity function)
is based on optical line classification, while the observed X-ray luminosity function
is based on X-ray spectroscopy. Nevertheless, as we saw above,
the correspondence between optical and X-ray classification is reasonably good.
The predicted Seyfert-1 luminosity function is somewhat higher than
the observed one in the case of the
![]() relation (sample A).
When we use the
relation (sample A).
When we use the
![]() relation obtained from sample C instead
the agreement is better.
In the case of the Seyfert-2 sample the agreement between the
optical and X-ray luminosity function is quite reasonable.
In the Seyfert-2 samples it is possible that a low
relation obtained from sample C instead
the agreement is better.
In the case of the Seyfert-2 sample the agreement between the
optical and X-ray luminosity function is quite reasonable.
In the Seyfert-2 samples it is possible that a low
![]() ratio may be suggestive of
excess absorption above what is directly seen in the X-ray spectra
(e.g. Melendez et al. 2008; LaMassa et al. 2009). This may indeed hold true
in some of the ``X-ray weak'' Seyfert-2 (sample F).
However, this does not appear to be the case among the
``luminous'' Seyfert-2 (sample E) that we are using for the derivation
of the Seyfert-2 luminosity function. All these Seyferts show
large obscuring columns, and thus the correction to the
intrinsic luminosity has been straightfoward.
ratio may be suggestive of
excess absorption above what is directly seen in the X-ray spectra
(e.g. Melendez et al. 2008; LaMassa et al. 2009). This may indeed hold true
in some of the ``X-ray weak'' Seyfert-2 (sample F).
However, this does not appear to be the case among the
``luminous'' Seyfert-2 (sample E) that we are using for the derivation
of the Seyfert-2 luminosity function. All these Seyferts show
large obscuring columns, and thus the correction to the
intrinsic luminosity has been straightfoward.
4 Discussion and summary
We derived the predicted X-ray luminosity function for Seyfert galaxies in the local Universe
by combining the optical SDSS [OIII] Seyfert luminosity functions with the corresponding
![]() relation.
These relations have been derived using the XMM-Newton observations
(Akylas & Georgantopoulos 2009) of the local, optically selected AGN sample of Ho et al. (1997).
This sample covers a comparable luminosity range with the SDSS Seyfert sample.
We have corrected the X-ray luminosity for the effects of absorption.
Our analysis above shows that the predicted X-ray luminosity function
is in reasonable agreement with the observed X-ray Seyfert luminosity functions
obtained in the 2-10 keV and 2-20 keV bands by HEAO-1 and RXTE respectively.
Most importantly, it is in agreement with the ultra-hard 17-60 keV INTEGRAL
luminosity function (Sazonov et al. 2007).
As the INTEGRAL luminosity function is practically immune to X-ray absorption,
this suggests that absorption played only a small role
in the optical/X-ray luminosity function discrepancy reported by Heckman et al. (2005).
This is also independently supported by the XMM-Newton observations of the
Palomar optically selected Seyfert sample (Akylas & Georgantopoulos 2009).
The fraction of Compton-thick AGN in this optically selected sample is small.
relation.
These relations have been derived using the XMM-Newton observations
(Akylas & Georgantopoulos 2009) of the local, optically selected AGN sample of Ho et al. (1997).
This sample covers a comparable luminosity range with the SDSS Seyfert sample.
We have corrected the X-ray luminosity for the effects of absorption.
Our analysis above shows that the predicted X-ray luminosity function
is in reasonable agreement with the observed X-ray Seyfert luminosity functions
obtained in the 2-10 keV and 2-20 keV bands by HEAO-1 and RXTE respectively.
Most importantly, it is in agreement with the ultra-hard 17-60 keV INTEGRAL
luminosity function (Sazonov et al. 2007).
As the INTEGRAL luminosity function is practically immune to X-ray absorption,
this suggests that absorption played only a small role
in the optical/X-ray luminosity function discrepancy reported by Heckman et al. (2005).
This is also independently supported by the XMM-Newton observations of the
Palomar optically selected Seyfert sample (Akylas & Georgantopoulos 2009).
The fraction of Compton-thick AGN in this optically selected sample is small.
In addition we separately examined, the Seyfert-1 and Seyfert-2 luminosity function. The Seyfert-1 luminosity function is in rough agreement with or even somewhat above the observed X-ray luminosity function. The predicted Seyfert-2 luminosity function agrees quite well with the optical luminosity function again disfavouring the absorption hypothesis. Indeed, if absorption were the problem, then our predicted luminosity function, which takes X-ray absorption into account, would be well above that of RXTE.
Having addressed this matter, we need to understand why
Heckman et al. (2005) found that the RXTE X-ray luminosity function
lies below the optical one by about a factor of three.
The comparison was based on the fact that the two luminosity functions have the same slope.
However, this is true only
for the bright part of the X-ray luminosity function
(i.e. for
![]()
![]() or equivalently
or equivalently
![]() erg s-1). Using
erg s-1). Using
![]() ,
the corresponding optical
luminosities must be greater than
,
the corresponding optical
luminosities must be greater than
![]() .
Since the upper end of the optical luminosity function of Hao et al. (2005b)
is
.
Since the upper end of the optical luminosity function of Hao et al. (2005b)
is ![]()
![]() ,
the overlap is very limited (see Fig. 5 in Heckman et al.),
and thus the comparison is not quite robust. Moreover, the effect of the dispersion
plays a critical role, as shown here.
,
the overlap is very limited (see Fig. 5 in Heckman et al.),
and thus the comparison is not quite robust. Moreover, the effect of the dispersion
plays a critical role, as shown here.
Although the densities of the [OIII] and the X-ray selected AGN are comparable,
this does not mean that these methods favour the selection of the same objects.
The optical selection favours X-ray weak Seyfert-2 (see Fig. 1).
It has been proposed (see Ho 2008, for a review) that a large number of
sources at low luminosities appear as Seyfert-2 possibly
because no broad-line-region is formed at
low accretion rates (Nicastro 2000) or low luminosities
(Elitzur & Shlosman 2006). If the above models hold true,
these ``naked'' Seyfert-2 galaxies should present no hidden broad lines
in spectropolarimetric observations (e.g. Tran 2003).
Interestingly, Spinoglio et al. (2009) find that the ratio of the X-ray to
12 ![]() luminosity,
luminosity,
![]() ,
is much lower in the Seyfert-2 with no hidden broad-line-region,
suggesting that these are weak X-ray emitters.
There is however one caveat in these ``naked'' X-ray weak
Seyfert-2 interpretation. The [OIII] (or the mid-IR) luminosity
is believed to be a good proxy of the ionizing nuclear
luminosity and thus to the X-ray luminosity.
But in these Seyfert-2 sources the
,
is much lower in the Seyfert-2 with no hidden broad-line-region,
suggesting that these are weak X-ray emitters.
There is however one caveat in these ``naked'' X-ray weak
Seyfert-2 interpretation. The [OIII] (or the mid-IR) luminosity
is believed to be a good proxy of the ionizing nuclear
luminosity and thus to the X-ray luminosity.
But in these Seyfert-2 sources the
![]() ratio
is low, implying that only the X-ray luminosity is weak.
One explanation could be that star-formation is
contributing a large part of the [OIII] emission.
ratio
is low, implying that only the X-ray luminosity is weak.
One explanation could be that star-formation is
contributing a large part of the [OIII] emission.
The future missions NUSTAR and ASTRO-H, having superb imaging
capabilities (![]() 1 arcmin) at ultra-hard energies (10-70 keV),
will provide the opportunity to obtain the least unbiased
AGN samples, reaching flux levels of at least two orders of magnitude fainter
than SWIFT and INTEGRAL.
1 arcmin) at ultra-hard energies (10-70 keV),
will provide the opportunity to obtain the least unbiased
AGN samples, reaching flux levels of at least two orders of magnitude fainter
than SWIFT and INTEGRAL.
References
- Akylas, A., & Georgantopoulos, I. 2009, A&A, 500, 999 [Google Scholar]
- Alexander, D. M., Bauer, F. E., Brandt, W. N., et al. 2003, AJ, 126, 539 [NASA ADS] [CrossRef] [Google Scholar]
- Barger, A. J., Cowie, L. L., Capak, P., et al. 2003, AJ, 126, 632 [NASA ADS] [CrossRef] [Google Scholar]
- Barger, A. J., Cowie, L. L., Mushotzky, R. F., et al. 2005, AJ, 129, 578 [NASA ADS] [CrossRef] [Google Scholar]
- Bassani, L., Molina, M., Malizia, A., et al. 2006, ApJ, 636, L65 [NASA ADS] [CrossRef] [Google Scholar]
- Bauer, F. E., Alexander, D. M., Brandt, W. N., et al. 2004, AJ, 128, 2048 [NASA ADS] [CrossRef] [Google Scholar]
- Beckmann, V., Gehrels, N., Shrader, C. R., & Soldi, S. 2006, ApJ, 638, 642 [NASA ADS] [CrossRef] [Google Scholar]
- Boyle, B. J., Shanks, T., Croom, S. M., et al. 2000, MNRAS, 317, 1014 [NASA ADS] [CrossRef] [Google Scholar]
- Brandt W. N., & Hasinger, G. 2005, ARA&A, 43, 827 [Google Scholar]
- Cappi, M., Panessa, F., Bassani, L., et al. 2006, A&A, 446, 459 [Google Scholar]
- Comastri, A. 2004, ASSL, 308, 245 [Google Scholar]
- Croom, S. M., Smith, R. J., Boyle, B. J., et al. 2004, MNRAS, 349, 1397 [NASA ADS] [CrossRef] [Google Scholar]
- Elitzur, M., & Shlosman, I. 2006, ApJ, 648, L101 [NASA ADS] [CrossRef] [Google Scholar]
- Giacconi, R., Zirm, A., Wang, J., et al. 2002, ApJS, 139, 369 [NASA ADS] [CrossRef] [Google Scholar]
- Gilli, R., Comastri, A., & Hasinger, G. 2007, A&A, 463, 79 [Google Scholar]
- Hao, L., Strauss, M. A., Tremonti, C. A., et al. 2005a, AJ, 129, 1783 [NASA ADS] [CrossRef] [Google Scholar]
- Hao, L., Strauss, M. A., Fan, X., et al. 2005b, AJ, 129, 1795 [NASA ADS] [CrossRef] [Google Scholar]
- Heckman, T. M., Ptak, A., Hornschemeier, A., & Kauffmann, G. 2005, ApJ, 634, 161 [NASA ADS] [CrossRef] [Google Scholar]
- Ho, L. C. 2008, ARA&A, 46, 475 [Google Scholar]
- Kauffmann, G., Heckman, T. M., Tremonti, C., et al. 2003, MNRAS, 346, 1055 [Google Scholar]
- Kellogg, E., Gursky, H., Leong, C., et al. 1971, ApJ, 165, L49 [NASA ADS] [CrossRef] [Google Scholar]
- La Franca, F., Fiore, F., Comastri, A., et al. 2005, A&A, 635, 864 [Google Scholar]
- LaMassa, S., Heckman, T. M., Ptak, A. A., et al. 2009 [arXiv:0909.3044] [Google Scholar]
- Luo, B., Bauer, F. E., Brandt, W. N., et al. 2008, ApJS, 179, 19 [NASA ADS] [CrossRef] [Google Scholar]
- Marshall, H. 1987, AJ, 94, 628 [NASA ADS] [CrossRef] [Google Scholar]
- Matt, G., Fabian, A. C., Guainazzi, M., et al. 2000, MNRAS, 318, 173 [NASA ADS] [CrossRef] [Google Scholar]
- Melendez, M., Kraemer, S. B., Armentrout, B. K., et al. 2008, ApJ, 682, 94 [NASA ADS] [CrossRef] [Google Scholar]
- Nicastro, F. 2000, ApJ, 530, L65 [NASA ADS] [CrossRef] [PubMed] [Google Scholar]
- Paltani, S., Walter, R., McHardy, I. M., et al. 2008, A&A, 485, 707 [Google Scholar]
- Risaliti, G., Maiolino, R., & Salvati, M. 1999, ApJ, 522, 157 [NASA ADS] [CrossRef] [Google Scholar]
- Sandage, A. R., & Tammann, G. A. 1981, A revised Shapley-Ames catalog of Bright Galaxies, Carnegie Inst. Washington [Google Scholar]
- Sazonov, S. Y., & Revnivtsev, M. G. 2004, A&A, 423, 469 [Google Scholar]
- Sazonov, S., Revnivtsev, M., Krivonos, R., Churazov, E., & Sunyaev, R. 2007, A&A, 462, 57 [Google Scholar]
- Sazonov, S., Krivonos, R., Revnivtsev, M., Churazov, E., & Sunyaev, R. 2008, A&A, 482, 517 [Google Scholar]
- Schmidt, M., & Green, R. F. 1983, ApJ, 269, 352 [NASA ADS] [CrossRef] [Google Scholar]
- Shinozaki, K., Miyaji, T., Ishisaki, Y., Ueda, Y., & Ogasaka, Y. 2006, AJ, 131, 2843 [NASA ADS] [CrossRef] [Google Scholar]
- Spinoglio et al. 2009 [arXiv:0901.1212] [Google Scholar]
- Tran, H. D. 2003, ApJ, 583, 632 [NASA ADS] [CrossRef] [Google Scholar]
- Treister, E., Urry, C. M., & Virani, S. 2009, ApJ, 696, 110 [NASA ADS] [CrossRef] [Google Scholar]
- Tueller, J., Mushotzky, R. F., Barthelmy, S., et al. 2009, ApJ, 681, 113 [Google Scholar]
- Ueda, Y., Akiyama, M., Ohta, K., & Miyaji, T. 2003, ApJ, 598, 886 [NASA ADS] [CrossRef] [Google Scholar]
- Ulvestad, J. S., & Ho, L. C. 2001, ApJ, 558, 561 [NASA ADS] [CrossRef] [Google Scholar]
- Werner, M. W., Roellig, T. L., & Low, F. J. 2004, ApJS, 154, 1 [Google Scholar]
- Whittle, M. 1992, ApJS, 79, 49 [NASA ADS] [CrossRef] [Google Scholar]
- Winkler, C., Courvoisier, T. J.-L., Di Cocco, G., et al. 2003, A&A, 411, L1 [Google Scholar]
- Winter, L. M., Mushotzky, R. F., Tueller, J., & Markwardt, C. 2008, ApJ, 674, 686 [NASA ADS] [CrossRef] [Google Scholar]
- Winter, L. M., Mushotzky, R. F., Reynolds, C. S., & Tueller, J. 2009, ApJ, 690, 1322 [NASA ADS] [CrossRef] [Google Scholar]
- Wolf, C., Wisotzki, L., Borch, A., et al. 2003, A&A, 408, 499 [Google Scholar]
- Xu, C., Livio, M., & Baum, S. 1999, AJ, 118, 1169 [NASA ADS] [CrossRef] [Google Scholar]
- York, D. G., Adelman, J., & Anderson, J. E. 2000, AJ, 120, 1579 [Google Scholar]
All Tables
Table 1: LogX-ray vs. Log[OIII] luminosity relation in optically selected AGN.
Table 2: Log X-ray vs. Log [OIII] luminosity relation in RXTE X-ray selected AGN.
All Figures
|
|
Figure 1: Upper panel. Seyfert-1: open squares and open triangles denote sources from the samples of Ho et al. (sample B) and Heckman et al. (sample C) respectively. Filled triangles denote the data from the sample of Sazonov & Revnivtsev (2004). The solid line is the best fit result to the joint Heckman + Ho sample (sample A). Lower panel. Seyfert-2: the open triangles refer to the ``X-ray weak'' (unabsorbed) Seyfert-2 (sample F), while the open squares refer to the X-ray luminous Seyfert-2s (sample E). The filled triangles denote the X-ray selected sample of Sazonov & Revnivtsev (2004). The solid line denotes the fit to the X-ray luminous Seyfert-2 (sample E). |
| Open with DEXTER | |
| In the text | |
|
|
Figure 2:
Upper panel. Seyfert-1: the black points denote the HEAO-1
X-ray luminosity function of Shinozaki et al. (2006); the black (short-dash) line denotes the RXTE
luminosity function of Sazonov & Revnitsev (2004); the blue (solid) line and green (long-dash) lines correspond to the predicted X-ray
luminosity function for
|
| Open with DEXTER | |
| In the text | |
Copyright ESO 2010
Current usage metrics show cumulative count of Article Views (full-text article views including HTML views, PDF and ePub downloads, according to the available data) and Abstracts Views on Vision4Press platform.
Data correspond to usage on the plateform after 2015. The current usage metrics is available 48-96 hours after online publication and is updated daily on week days.
Initial download of the metrics may take a while.