| Issue |
A&A
Volume 509, January 2010
|
|
|---|---|---|
| Article Number | A2 | |
| Number of page(s) | 5 | |
| Section | Stellar structure and evolution | |
| DOI | https://doi.org/10.1051/0004-6361/200912796 | |
| Published online | 12 January 2010 | |
Wide band observations of the X-ray burster GS 1826-238
M. Cocchi1 - R. Farinelli2 - A. Paizis3 - L. Titarchuk2,4,5,6
1 - INAF, Istituto di Astrofisica Spaziale e Fisica Cosmica sez. di Roma,
via Fosso del Cavaliere, 100, 00133 Roma, Italy
2 -
Dipartimento di Fisica, Universitá di Ferrara, Italy
3 -
INAF, Istituto di Astrofisica Spaziale e Fisica Cosmica, sez. di Milano, Italy
4 -
Center for Earth Observing and Space Research, George Mason University, Fairfax, VA, USA
5 -
High Energy Space Environment Branch, US Naval Reserch Laboratory, Washington, DC, USA
6 -
Gravitational Astrophysics Laboratory, NASA Goddard Space Flight Center, Greenbelt, MD, USA
Received 30 June 2009 / Accepted 19 November 2009
Abstract
Context. GS 1826-238 is a well-studied
X-ray bursting neutron star in a low mass binary system. Thermal
Comptonisation by a hot electron cloud (
![]() keV)
is a widely accepted mechanism accounting for its high energy emission,
while the nature of most of its soft X-ray output is not completely
understood. A further low energy component is typically needed to model
the observed spectra: pure blackbody and Comptonisation-modified
blackbody radiation by a lower temperature (a few keV) electron
plasma were suggested to explain the low energy data.
keV)
is a widely accepted mechanism accounting for its high energy emission,
while the nature of most of its soft X-ray output is not completely
understood. A further low energy component is typically needed to model
the observed spectra: pure blackbody and Comptonisation-modified
blackbody radiation by a lower temperature (a few keV) electron
plasma were suggested to explain the low energy data.
Aims. In order to better characterise the nature of the low
energy emission and the bolometric output of the source, the steady
emission of GS 1826-238 is studied by means of
sensitive, broad band (X to soft Gamma-rays) measurements obtained by
the INTEGRAL observatory.
Methods. In this data analysis, the newly developed, up-to-date Comptonisation model COMPTB is
applied for the first time to study effectively the low-hard state
variability of a low-luminosity neutron star in a low-mass X-ray binary
system. Three joint ISGRI/JEM-X data sets (two from observations
performed in 2003 and one from 2006) were analysed.
Results. We confirm that the 3-200 keV emission of
GS 1826-238 is characterised by Comptonisation of
soft seed photons by a hot electron plasma. A single spectral component
is sufficient to model the observed spectra. At lower energies, no
direct blackbody emission is observed and there is no need to postulate
a low temperature Compton region. Compared to the 2003 measurements,
the plasma temperature decreased from ![]() 20 to
20 to ![]() 14 keV in 2006, together with the seed photons temperature. The source intensity was also found to be
14 keV in 2006, together with the seed photons temperature. The source intensity was also found to be ![]()
![]() lower in 2006, whilst the average recurrence frequency of the X-ray
bursts significantly increased. Possible explanations for this apparent
deviation from the typical limit-cycle behaviour of this burster are
discussed.
lower in 2006, whilst the average recurrence frequency of the X-ray
bursts significantly increased. Possible explanations for this apparent
deviation from the typical limit-cycle behaviour of this burster are
discussed.
Key words: X-rays: general - X-rays: binaries - X-rays: individuals: GS 1826-238
1 Introduction
The persistent X-ray source GS 1826-238 was discovered during a manoeuvre of the Ginga satellite in 1988 (Makino et al. 1988).
Early band-limited observations of this object were performed by TTM (in 't Zand 1992), and ROSAT (Barret et al. 1995) at low energies and by CGRO-OSSE (Strickman et al. 1996), in the hard X-rays.
An optical counterpart in a low inclination system and with a likely orbital period of 2.1 h was reported (Homer et al. 1998).
The detection of type I X-ray bursts (Ubertini et al. 1997) by BeppoSAX ultimately
established that the source is a neutron
star (NS) in a low mass binary system (LMXB). X-ray bursts were found to
recur every few hours in a quasi-periodical fashion (Ubertini et al. 1999). What
makes this burster unique among its class is the remarkable stability of the
recurrence over a time-scale of several years (Cocchi et al. 2001). Bursting behaviour
is clearly related to the persistent emission (Cornelisse et al. 2003), the event
frequency increasing with the measured X-ray flux. RXTE data permitted more accurate studies of the burst recurrence properties (see e.g. Galloway et al. 2004), and a possible 611 Hz oscillation in the burst decay was also reported (Thompson et al. 2005).
The lack of evidence for photospheric radius expansion during the bursts
(in 't Zand et al. 1999) and general considerations on the optical counterpart (LMXB,
short orbital period) limit the value of the distance to the source in the
![]() 4-9 kpc range (Barret et al. 2000).
4-9 kpc range (Barret et al. 2000).
The history of sensitive, wide band measurements of the steady emission of GS 1826-238
includes results from BeppoSAX (Del Sordo et al. 1999; in 't Zand et al. 1999), RXTE (Barret et al. 2000), RXTE plus Chandra (Thompson et al. 2005), and RXTE
plus XMM (Thompson et al. 2008). Since the BeppoSAX era, the source is always
detected in a hard (low) spectral state, its high energy emission extending
well in excess of 100 keV. A simple, empirical, exponentially-cutoff power law
model with
![]() keV yields acceptable fits to the high energy data
(e.g. Del Sordo et al. 1999) but whenever more physical models are considered, the
spectra are generally well described by a Comptonisation scenario, where soft
seed photons are up-scattered to high energies by a hot electron plasma
(
keV yields acceptable fits to the high energy data
(e.g. Del Sordo et al. 1999) but whenever more physical models are considered, the
spectra are generally well described by a Comptonisation scenario, where soft
seed photons are up-scattered to high energies by a hot electron plasma
(
![]() keV). Along with Comptonisation, either a low energy
blackbody (BB) spectral component (in 't Zand et al. 1999) or a low-temperature Compton
component (Thompson et al. 2005) are included to fit the data. The detection of a
keV). Along with Comptonisation, either a low energy
blackbody (BB) spectral component (in 't Zand et al. 1999) or a low-temperature Compton
component (Thompson et al. 2005) are included to fit the data. The detection of a ![]() 6 keV iron line was reported by Barret et al. (2000),
who also included reflection to fit their data.
Evidence for transient soft blackbody emission, possibly related to
irregularities in the time behaviour of the X-ray bursts, has recently
reported by Thompson et al. (2008).
6 keV iron line was reported by Barret et al. (2000),
who also included reflection to fit their data.
Evidence for transient soft blackbody emission, possibly related to
irregularities in the time behaviour of the X-ray bursts, has recently
reported by Thompson et al. (2008).
We present wide band spectral analysis of GS 1826-238 performed by INTEGRAL data. In the next section, observation and data analysis details will be given. In Sect. 3 we present and discuss our results along with our best fit models, while the implications of these results and their relation to the current knowledge of this peculiar X-ray source are debated in Sect. 4.
Table 1: Observation log.
2 Observations and data analysis
The public database![]() of INTEGRAL (Winkler et al. 2003)
includes a big set of useful pointings of GS 1826-238, thanks to
the observing policy of the telescope which includes periodic scans of
the Galactic plane and the Galactic bulge region
(GS 1826-238 is only
of INTEGRAL (Winkler et al. 2003)
includes a big set of useful pointings of GS 1826-238, thanks to
the observing policy of the telescope which includes periodic scans of
the Galactic plane and the Galactic bulge region
(GS 1826-238 is only ![]() 10 degrees from SgrA*).
10 degrees from SgrA*).
Detailed analysis of the whole INTEGRAL GS 1826-238 public database, focused on the source long term monitoring, is to be presented elsewhere (Cocchi et al., in prep.). The present work, focused on wide band spectroscopy of the persistent emission, relies on data obtained by the imaging detectors JEM-X (Lund et al. 2003) and IBIS/ISGRI (Lebrun et al. 2003, hereafter ISGRI), which operate in the 2-30 keV and 17-300 keV passbands, respectively.
Being the source variable, though always observed in a low-hard spectral state, homogeneous data sets are needed: this means that one has to choose simultaneuos JEM-X+ISGRI pointings of sufficient length to get good statistics and as close in time as possible. Due to the different field of view of the two detectors and the typical dithering observing pattern of INTEGRAL, JEM-X live time is considerably less than the ISGRI one.
Taking into account the above limitations, we selected three data sets, the
first one belonging to the satellite
revolutions 061-064 (visibility window of Spring 2003), the second one to the
revolutions 119-122 (Autumn 2003), and the third one to revolution 495 (Autumn 2006).
Together, the three sets account for 104.6 ks and 391.2 ks live time (JEM-X and ISGRI, respectively).
Analysis of RXTE/ASM monitoring data of GS 1826-238 obtained in the same epochs
of our INTEGRAL observations indicate that the 2-10 keV source intensity significantly varied from 2003 to 2006, being ![]() 40 mCrab in 2003 and only
40 mCrab in 2003 and only ![]() 25 mCrab in Autumn 2006 (see Table 1). This is confirmed with higher accuracy and on a wider energy band by the present measurements (see Sect. 3).
25 mCrab in Autumn 2006 (see Table 1). This is confirmed with higher accuracy and on a wider energy band by the present measurements (see Sect. 3).
In order to avoid possible low-energy spectral contamination from the X-ray burst emission,
the time intervals of the observed bursts, each event typically lasting ![]() 100 s in JEM-X data, were removed from the good time of the data sets.
Details about the analysed data sets such as live time, number of bursts
detected and inferred average burst periodicities, are summarised in Table 1.
100 s in JEM-X data, were removed from the good time of the data sets.
Details about the analysed data sets such as live time, number of bursts
detected and inferred average burst periodicities, are summarised in Table 1.
JEM-X data were reduced and extracted by the standard INTEGRAL off-line analysis (OSA) pipeline![]() release 7.0.
Presence of systematic effects at the lowest energies suggested a discarding
of the spectral bins in the 2-3 keV range.
ISGRI data were reduced by the standard OSA 6.0 pipeline, while spectral extraction was performed by a dedicated
software based on cross correlation, which is freely available to the community
release 7.0.
Presence of systematic effects at the lowest energies suggested a discarding
of the spectral bins in the 2-3 keV range.
ISGRI data were reduced by the standard OSA 6.0 pipeline, while spectral extraction was performed by a dedicated
software based on cross correlation, which is freely available to the community![]() .
The effectiveness and the limitations of the software in terms of calibration
and systematics have already been discussed elsewhere (Mineo et al. 2006; Segreto & Ferrigno 2006).
Finally, the joint JEM-X/ISGRI spectra were analysed and best-fitted by the standard software tools of the XSPEC package
.
The effectiveness and the limitations of the software in terms of calibration
and systematics have already been discussed elsewhere (Mineo et al. 2006; Segreto & Ferrigno 2006).
Finally, the joint JEM-X/ISGRI spectra were analysed and best-fitted by the standard software tools of the XSPEC package![]() , version 12.
, version 12.
Due to cross calibration uncertainties between the two instruments, whose effects are expected to vary with the observation epoch2, a constant normalisation factor was included in each fit. We kept ISGRI as a reference, allowing the JEM-X constant to vary. No systematics, accounting for possible instrumental miscalibration, had to be included for both JEM-X and ISGRI.
Our data cannot constrain the low energy absorption along the line of sight, so the ![]() value, modeled by Wisconsin absorber in XSPEC , was kept fixed to
value, modeled by Wisconsin absorber in XSPEC , was kept fixed to
![]() ,
which is the best determined value from recent joint XMM-RXTE measurements (Thompson et al. 2008).
Slightly different values,
,
which is the best determined value from recent joint XMM-RXTE measurements (Thompson et al. 2008).
Slightly different values,
![]() and
and
![]() were determined respectively by previous ROSAT and BeppoSAX measurements (in 't Zand et al. 1999; Barret et al. 1995). All the values are of the same order of magnitude of the interpolated one (Dickey & Lockman 1990) that can be derived by NH, a widely used ftool
were determined respectively by previous ROSAT and BeppoSAX measurements (in 't Zand et al. 1999; Barret et al. 1995). All the values are of the same order of magnitude of the interpolated one (Dickey & Lockman 1990) that can be derived by NH, a widely used ftool![]() .
We already verified that these slight differences in the
.
We already verified that these slight differences in the ![]() value do not affect the parameters of our best fits and the possible undetection of further soft components (see Sect. 3).
value do not affect the parameters of our best fits and the possible undetection of further soft components (see Sect. 3).
3 Spectroscopic results
Table 2: Spectroscopic results.
Our wide band INTEGRAL spectra of GS 1826-238 can be satisfactorily fit in a first approximation by a simple, empirical, exponentially cutoff power-law model, XSPEC 's CUTOFFPL (see Table 2). The power-law photon index isFrom a less empirical, more physical point of view, a single high energy cutoff power law is a clear indication of a single Compton region at work. This is (at least partially) in agreement with most of the previous results, but not with those obtained by Thompson et al. (2005) (see also Thompson et al. 2008), who included a second, distinct Compton component with a different geometry and electron temperature to fit their joint Chandra /RXTE data: in our case, as CUTOFFPL is an acceptable model, there is a clear indication that the data themselves do not require the use of too many free parameters to explain the observed emission from GS 1826-238.
Taking all this into account, we tried to fit the data with a single thermal Compton component. The recently
developed thermal plus bulk Comptonisation model (Farinelli et al. 2008), COMPTB, included in the standard XSPEC distribution![]() , is presently
the most up-to-date Comptonisation model in a diffusion regime (such approximation holds well for NS-LMXBs).
COMPTB is a general model including, in a self-consistent way, the seed
photons emission together with the Comptonised emission, whether the latter is
either purely thermal (as in the well-known model COMPTT), or mixed dynamical (bulk Comptonisation) plus thermal.
As a detailed description of the model is given in Farinelli et al. (2008),
we here only point out that the free parameters of COMPTB are the blackbody seed photon
and the electron temperatures (
, is presently
the most up-to-date Comptonisation model in a diffusion regime (such approximation holds well for NS-LMXBs).
COMPTB is a general model including, in a self-consistent way, the seed
photons emission together with the Comptonised emission, whether the latter is
either purely thermal (as in the well-known model COMPTT), or mixed dynamical (bulk Comptonisation) plus thermal.
As a detailed description of the model is given in Farinelli et al. (2008),
we here only point out that the free parameters of COMPTB are the blackbody seed photon
and the electron temperatures (
![]() and
and
![]() ,
respectively), the Comptonisation
index
,
respectively), the Comptonisation
index ![]() ,
the bulk parameter
,
the bulk parameter ![]() ,
the covering factor log(A) and the
normalisation.
,
the covering factor log(A) and the
normalisation.
As already mentioned above, the spectrum of GS 1826- 238 is well described by a
simple function ( CUTOFFPL), which mimics unsaturated Comptonisation for static
plasma and no blackbody-like peak is observed at low energies:
the case of the seed blackbody radiation dominated by the Compton emission is modeled by COMPTB with a high value of the covering factor, i.e. ![]() .
Moreover, GS 1826-238 being a low luminosity (a few % Eddington) NS-LMXB in a
low (hard) state, the detection of a bulk emission is unlikely (Paizis et al. 2006, see also Sect. 4.1).
These two particular cases are well reproduced in our fits: when allowed to
vary, both the
.
Moreover, GS 1826-238 being a low luminosity (a few % Eddington) NS-LMXB in a
low (hard) state, the detection of a bulk emission is unlikely (Paizis et al. 2006, see also Sect. 4.1).
These two particular cases are well reproduced in our fits: when allowed to
vary, both the ![]() and the
and the ![]() parameters are eventually pegged by
the fitting procedure to their hard limits corresponding to total
coverage (
parameters are eventually pegged by
the fitting procedure to their hard limits corresponding to total
coverage (![]() )
and no bulk emission (
)
and no bulk emission (![]() ), thus reproducing a simple thermal Comptonisation spectrum without direct emergence of the underlying seed photons.
We then fixed
), thus reproducing a simple thermal Comptonisation spectrum without direct emergence of the underlying seed photons.
We then fixed ![]() and
and ![]() to the above limit values in all the fits, leaving only
to the above limit values in all the fits, leaving only
![]() ,
,
![]() and
and ![]() as
variable parameters.
In this particular case, the dimension of the free-parameter space is
identical to that of the well consolidated and widely adopted COMPTT model (Titarchuk 1994), and the two models are substantially equivalent.
as
variable parameters.
In this particular case, the dimension of the free-parameter space is
identical to that of the well consolidated and widely adopted COMPTT model (Titarchuk 1994), and the two models are substantially equivalent.
The results of our COMPTB fits are reported in Table 2 for each of the three different observation periods.
Spectra and residuals to the best fits are also shown in Fig. 1 for two selected observations.
A single COMPTB component with
![]() in the range 15-20 keV effectively describes the shape of the
spectra. Though the source persisted in its low-hard state,
significantly different best fit values were obtained for both electron
plasma and soft seed photon temperatures in the 2003 and 2006
observations. The 2006 data set required lower temperatures and a lower
value of the index
in the range 15-20 keV effectively describes the shape of the
spectra. Though the source persisted in its low-hard state,
significantly different best fit values were obtained for both electron
plasma and soft seed photon temperatures in the 2003 and 2006
observations. The 2006 data set required lower temperatures and a lower
value of the index
![]() ,
indicating an increased efficiency of the Compton upscattering. The
2-200 keV intensity also dropped by
,
indicating an increased efficiency of the Compton upscattering. The
2-200 keV intensity also dropped by ![]()
![]() with respect to 2003.
We carefully verified that the different values of the main spectral
parameters in 2006 are not biased by a probable long term variation of the
JEM-X/ISGRI normalisation constant: in fact consistent
with respect to 2003.
We carefully verified that the different values of the main spectral
parameters in 2006 are not biased by a probable long term variation of the
JEM-X/ISGRI normalisation constant: in fact consistent
![]() values are
obtained even when forcing the 2003 cross-calibration in the 2006 data set,
and vice versa. Moreover, considering only ISGRI data for the fits does
not alter the main parameter values. Finally, the RXTE /ASM data
independently confirm in a narrower passband the drop in the flux (see
Table 1).
values are
obtained even when forcing the 2003 cross-calibration in the 2006 data set,
and vice versa. Moreover, considering only ISGRI data for the fits does
not alter the main parameter values. Finally, the RXTE /ASM data
independently confirm in a narrower passband the drop in the flux (see
Table 1).
Best-fit excesses above ![]() 75 keV are observed in the 2006 data set (see
lower panel of Fig. 1) and partly in the Autumn 2003 one. But they are not detected
in Spring 2003 and moreover their significance is poor. So we regard such
residuals as random fluctuations.
75 keV are observed in the 2006 data set (see
lower panel of Fig. 1) and partly in the Autumn 2003 one. But they are not detected
in Spring 2003 and moreover their significance is poor. So we regard such
residuals as random fluctuations.
![\begin{figure}
\par\includegraphics[angle=90,width=12cm,clip]{12796fg1.ps}
\end{figure}](/articles/aa/full_html/2010/01/aa12796-09/img74.png)
|
Figure 1: The INTEGRAL spectrum of GS 1826-238 as observed in Autumn 2003 (brighter spectrum) and Autumn 2006. Simple crosses and dotted crosses are used for ISGRI and JEM-X, respectively. Residuals to the best COMPTB fits are shown in the lower panels for the 2003 (above) and 2006 data (below). |
| Open with DEXTER | |
Interesting additional physical information can be extracted from the best-fit parameters of COMPTB; for example, the cloud optical depth ![]() can be derived by the Eqs. (17)-(24) in Titarchuk & Lyubarskij (1995). The
can be derived by the Eqs. (17)-(24) in Titarchuk & Lyubarskij (1995). The ![]() values, assuming a spherical geometry, are included in Table 2.
For a direct comparison, the results obtained replacing COMPTB with the more popular model COMPTT (spherical geometry assumed) are also reported in Table 2. As expected, the main COMPTT parameter values are in good agreement with the COMPTB ones.
values, assuming a spherical geometry, are included in Table 2.
For a direct comparison, the results obtained replacing COMPTB with the more popular model COMPTT (spherical geometry assumed) are also reported in Table 2. As expected, the main COMPTT parameter values are in good agreement with the COMPTB ones.
Moreover, the order of magnitude of the radius of the (assumed)
spherical region emitting the blackbody seed photons can be estimated:
as the normalisation in COMPTB is defined as
![]() ,
where L39 is the seed photon spectrum luminosity (in units of 1039 erg
,
where L39 is the seed photon spectrum luminosity (in units of 1039 erg
![]() )
and D10 is the source distance (in units of 10 kpc),
one can derive applying the Stefan-Boltzmann law the emitting region radius as
)
and D10 is the source distance (in units of 10 kpc),
one can derive applying the Stefan-Boltzmann law the emitting region radius as
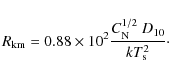
We obtain for the three observational data sets the values
The X-ray energy amplification caused by the Compton scattering can
also be determined by computing the Compton Amplification Factor (CAF), defined as the ratio of the Comptonised bolometric energy flux to that of the blackbody seed radiation.
The obtained values of the parameter for each observation of GS 1826-238 are also listed in Table 2. Increased Compton efficiency, as already testified by the correspondingly decreasing value of the ![]() index, is observed in 2006.
index, is observed in 2006.
4 Discussion
4.1 GS 1826-238 in a unifying framework
We applied a recently developed model for Compton upscattering, COMPTB, to study the low-hard state variability of GS 1826-238 . As Paizis et al. (2006) demonstrated, general Comptonisation models including bulk emission are very effective in modeling the variety of NS-LMXBs spectral states and the state transitions in individual sources. This is obtained, in a natural way, by smooth changes in the relative importance of bulk over thermal Comptonisation. In this scenario having the interplay of bulk and thermal Compton emission as unifying parameter, a low-hard state is expected to originate at low accretion rates, where the coronal Compton cooling is far from being efficient, thus leaving out a hot screen which extends radially and spherically, thus shielding the NS surface and allowing the direct accretion disk emission to be cooler. Bulk motion Comptonisation can still occur in this case, as the NS gravity is not balanced by the radiation pressure, but the effect is expected to be weak and probably washed in the hot screen with negligible effects for a distant observer.
The present results confirm the above picture for the case of
GS 1826-238 , as pure thermal upscattering completely
accounts for the source emission. The relative extension of the Compton
cloud determines whether it is possible to observe a fraction of the
seed photons' population originating from the NS surface and/or from
the inner accretion disk. In our spectra the soft blackbody seed
photons are not directly detected, given the inferred
![]() ,
and no further soft components are needed to fit the data.
,
and no further soft components are needed to fit the data.
4.2 Wide band spectroscopy: extra spectral components and variability
Undetection of additional soft components in the INTEGRAL data is in
agreement with the results obtained by Strickman
et al. (1996) and Barret et al. (2000)
for the same source, but not with those of in't Zand et al. (1999) and Del Sordo et al. (1999),
who proposed an extra blackbody (
![]() of
of ![]() 3 keV and
3 keV and ![]() 1 keV, respectively), in addition to a thermally Comptonised component (or a Compton-like, in the case of Del Sordo et al. 1999), to fit the BeppoSAX data.
Our upper limits for a further blackbody-like component were calculated,
assuming a typical colour temperature of 1 keV and a distance of 7 kpc. We
obtained blackbody emitting regions with radii R<1.0 km and R <0.7 km for
the 2003 and 2006 data sets, respectively (90% confidence).
1 keV, respectively), in addition to a thermally Comptonised component (or a Compton-like, in the case of Del Sordo et al. 1999), to fit the BeppoSAX data.
Our upper limits for a further blackbody-like component were calculated,
assuming a typical colour temperature of 1 keV and a distance of 7 kpc. We
obtained blackbody emitting regions with radii R<1.0 km and R <0.7 km for
the 2003 and 2006 data sets, respectively (90% confidence).
Applying a PEXRAV model to our data as in Barret et al. (2000) does not improve the fits. The simple cutoff power law is reproduced, but the reflection parameter is pegged to zero. This is expected, as CUTOFFPL always yields acceptable fits and there is no need for further hypotheses.
For GS 1826-238, Thompson et al. (2005)
and (2008) proposed a model with two distinct Comptonising regions, one with disk geometry and a high (![]() 20 keV) temperature, the other of spherical shape and
a lower (
20 keV) temperature, the other of spherical shape and
a lower (![]() 6 keV)
temperature. The two separate regions had different opacities and seed
photons populations.
This two-cloud model actually fits our data, with values very close to
those obtained by the above authors, but this is not very surprising
because it has many free parameters.
As a matter of fact, our data do not need too many free parameters
because a
simple cutoff powerlaw provides a satisfactory fit. Moreover, a single
powerlaw
is an indication of a single Comptonising region at work. In Thompson et al. (2005), much simpler models (e.g. CUTOFFPL) yielded acceptable fits to
their data as well; interestingly, all the fits had very low (
6 keV)
temperature. The two separate regions had different opacities and seed
photons populations.
This two-cloud model actually fits our data, with values very close to
those obtained by the above authors, but this is not very surprising
because it has many free parameters.
As a matter of fact, our data do not need too many free parameters
because a
simple cutoff powerlaw provides a satisfactory fit. Moreover, a single
powerlaw
is an indication of a single Comptonising region at work. In Thompson et al. (2005), much simpler models (e.g. CUTOFFPL) yielded acceptable fits to
their data as well; interestingly, all the fits had very low (![]() 0.7-0.8)
reduced chisquared, probably indicating systematic effects at work, such as error overestimation or missed rebinning.
0.7-0.8)
reduced chisquared, probably indicating systematic effects at work, such as error overestimation or missed rebinning.
It must be stressed that the presence of a second, softer, spectral component cannot be completely ruled out by the present INTEGRAL data.
But its actual need should be justified by the overall X-ray spectral
shape obtained including the lowest energy range (E< 2-3 keV), which is not covered by JEM-X.
This is likely, as both the BeppoSAX and Chandra already published spectra start well below 1 keV.
Nevertheless, both the previously reported ![]() 3 keV blackbody-like
component (in 't Zand et al. 1999) and the
3 keV blackbody-like
component (in 't Zand et al. 1999) and the ![]() 5 keV Comptonised emission (Thompson et al. 2005) are well inside the INTEGRAL passband and should be unambiguously constrained. This is not the case.
5 keV Comptonised emission (Thompson et al. 2005) are well inside the INTEGRAL passband and should be unambiguously constrained. This is not the case.
The present analysis shows clear evidence for intensity and spectral variability of GS 1826-238 (even though almost unexpected, given the peculiar long time-scale regularity of its bursting behaviour, which is suggestive of a stable, smooth accretion). In particular, significantly lower plasma temperatures and 2-200 keV luminosity are observed in 2006 compared with 2003.
A comparison of our results with previously reported wide band observations of GS 1826-238 is shown in Fig. 2. While at least approximately the canonical low-state spectral hardening with source dropping luminosity is well reproduced by our 2003 data, the unusually low electron plasma temperature of 2006 coupled with relatively low luminosity seems to contradict this consolidated scenario. Together with the probably erratic presence of blackbody-like emission at lower energies (see also below), the overall picture of GS 1826-238 is suggestive of the emergence of possible sub-states within its low-hard state. In such a spectral state, different observational characteristics could be attributed to differences in the configuration of the accreting system, with the size and geometry of the Compton cloud likely playing a pivotal role.
![\begin{figure}
\par\includegraphics[width=9cm,clip]{12796fg2.ps}
\end{figure}](/articles/aa/full_html/2010/01/aa12796-09/img81.png)
|
Figure 2: Comparison of wide band spectra of GS 1826-238 obtained by different observations: our INTEGRAL spectra, as in Fig. 1 (simple lines); RXTE (Barret et al. 2000, dashed line); Chandra+ RXTE (Thompson et al. 2005, dash-dotted); BeppoSAX (in 't Zand et al. 1999, dots). The Fe lines, even when detected, are not included. |
| Open with DEXTER | |
4.3 X-ray bursts timing irregularities
Taking into account the observed decrease of the X-ray bursts' wait times
together with lower measured intensity (see Table 1), our November 2006 data
show a clear deviation from the typical limit-cycle X-ray bursting behaviour
of GS 1826-238. Burst wait times ![]() are generally anticorrelated with very good approximation to the
source intensity
are generally anticorrelated with very good approximation to the
source intensity ![]() by the simpleformula
by the simpleformula
![]() (see Galloway et al. 2004).
If one were to consider the measured 2-200 keV flux as an indication of the
actual accretion rate as well as the burst fuel accumulation rate, a deviation
of
(see Galloway et al. 2004).
If one were to consider the measured 2-200 keV flux as an indication of the
actual accretion rate as well as the burst fuel accumulation rate, a deviation
of ![]()
![]() from the limit-cycle rule would be obtained with respect to e.g. the 2003 INTEGRAL data.
Similar anomalies were already observed in the April 2003 RXTE data
(Thompson et al. 2008).
These results indicate that spectral measurements which do
not include the very soft X-rays are unreliable tools to extrapolate
the bolometric luminosity, which can be widely underestimated. In fact
Thompson et al. (2008) reported of a simultaneous XMM-observed
transient blackbody-like spectral component. This very soft (a few
tenths of keV) component accounted for the missing flux, allowing
for a better estimate of the bolometric luminosity and so of the true
accretion rate.
Our INTEGRAL results can also be explained in the same
natural way, leaving out early burst ignition and/or anisotropy
considerations. But a further very soft component similar to the one
reported by Thompson et al. (2008) would then remain undetected,
being outside of the JEM-X passband.
Nevertheless, our 2006 data show a significant decrease of both the
Compton cloud electron and the seed photon temperatures, which is
possibly related to an overall bolometric spectral variation of
GS 1826-238 .
from the limit-cycle rule would be obtained with respect to e.g. the 2003 INTEGRAL data.
Similar anomalies were already observed in the April 2003 RXTE data
(Thompson et al. 2008).
These results indicate that spectral measurements which do
not include the very soft X-rays are unreliable tools to extrapolate
the bolometric luminosity, which can be widely underestimated. In fact
Thompson et al. (2008) reported of a simultaneous XMM-observed
transient blackbody-like spectral component. This very soft (a few
tenths of keV) component accounted for the missing flux, allowing
for a better estimate of the bolometric luminosity and so of the true
accretion rate.
Our INTEGRAL results can also be explained in the same
natural way, leaving out early burst ignition and/or anisotropy
considerations. But a further very soft component similar to the one
reported by Thompson et al. (2008) would then remain undetected,
being outside of the JEM-X passband.
Nevertheless, our 2006 data show a significant decrease of both the
Compton cloud electron and the seed photon temperatures, which is
possibly related to an overall bolometric spectral variation of
GS 1826-238 .
The above reported erratic variability of the source, in terms of both transient soft components and/or Comptonisation parameters, deserves to be studied in detail to be better understood and implies the need for further accurate wide band (from very soft X-rays up to soft Gamma-rays) monitoring programs of GS 1826-238 and other similar X-ray bursters.
This work has been supported by the grant from the INAF PRIN 2007 Bulk motion Comptonization models in X-ray Binaries: from phenomenology to physics, PI M. Cocchi. A.P. acknowledges the Italian Space Agency financial and programmatic support via contract I/008/07/0. The authors thank C. Ferrigno and A. Segreto for useful suggestions and tips.
References
- Barret, D., Motch, C., & Pietsch, W. 1995, A&A, 305, 526 [Google Scholar]
- Barret, D., Olive, J. F., Boirin, L., et al. 2000, ApJ, 533, 329 [NASA ADS] [CrossRef] [Google Scholar]
- Cocchi, M., Bazzano, A., Natalucci, L., et al. 2001, Adv. Space Res., 28, 375 [NASA ADS] [CrossRef] [Google Scholar]
- Cornelisse, R., in 't Zand, J. J. M., Verbunt, F., et al. 2003, A&A, 405, 1033 [Google Scholar]
- Del Sordo, S., Frontera, F., Pian, E., et al. 1999, Astrophys. Lett. Comm., 38, 125 [NASA ADS] [Google Scholar]
- Dickey, J., & Lockman, F. 1990, ARA&A, 28, 215 [Google Scholar]
- Farinelli, R., Titarchuk, L., Paizis, A., & Frontera, F. 2008, ApJ, 680, 602 [NASA ADS] [CrossRef] [Google Scholar]
- Galloway, D. K., Cummings, A., Kuulkers, E., et al. 2004, ApJ, 601, 466 [NASA ADS] [CrossRef] [Google Scholar]
- Homer, L., Charles, P. A., & O'Donoghue, D. 1998, MNRAS, 298, 497 [NASA ADS] [CrossRef] [Google Scholar]
- Lebrun, F., Leray, J. P., Lavocat, P., et al. 2003, A&A, 411, L141 [Google Scholar]
- Lund, N., Budtz-Jørgensen, C., Westergaard, N. J., et al. 2003, A&A, 411, L231 [Google Scholar]
- Makino, R., et al. 1988, IAU Circ., 4653 [Google Scholar]
- Mineo, T., Ferrigno, C., Foschini, L., et al. 2006, A&A, 450, 617 [Google Scholar]
- Paizis, A., Farinelli, R., Titarchuk, L., et al. 2006, A&A, 459, 187 [Google Scholar]
- Segreto, A., & Ferrigno, C. 2006, in Proc. of the 6th INTEGRAL Workshop The Obscured Universe, Moscow on 2-8 July 2006, ed. S. Grebenev, R. Sunyaev, & C. Winkler, 633 [Google Scholar]
- Strickman, M., Skibo, J., Purcell, W., Barret, D., & Motch, C. 1996, A&AS, 120, 217 [Google Scholar]
- Thompson, T. W. J., Rothschild, R. E., Tomsick, J. A., & Marshall, H. L. 2005, ApJ, 634, 1261 [NASA ADS] [CrossRef] [Google Scholar]
- Thompson, T. W. J., Galloway, D. K., Rothschild, R. E., & Homer, L. 2008, ApJ, 681, 506 [NASA ADS] [CrossRef] [Google Scholar]
- Titarchuk, L. 1994, ApJ, 434, 570 [NASA ADS] [CrossRef] [Google Scholar]
- Titarchuk, L., & Lyubarskij, Y. 1995, ApJ, 450, 876 [NASA ADS] [CrossRef] [Google Scholar]
- Ubertini, P., Bazzano, A., Cocchi, M., et al. 1997, IAU circ. 6611 [Google Scholar]
- Ubertini, P., Bazzano, A., Cocchi, M., et al. 1999, ApJ, 514, L27 [NASA ADS] [CrossRef] [Google Scholar]
- Winkler, C., Courvoisier, T. J.-L., Di Cocco, G., et al. 2003, A&A, 411, L1 [Google Scholar]
- in 't Zand, J. J. M. 1992, Ph.D. Thesis, University of Utrecht [Google Scholar]
- in 't Zand, J. J. M., Heise, J., Kuulkers, E., et al. 1999, A&A, 347, 891 [Google Scholar]
Footnotes
- ... database
![[*]](/icons/foot_motif.png)
- http://isdc.unige.ch/index.cgi?Data+info
- ... pipeline
- http://isdc.unige.ch/index.cgi?Soft+info
- ... community
- http://www.ifc.inaf.it/ ferrigno/INTEGRALsoftware.html
- ... XSPEC package
- http://heasarc.nasa.gov/docs/xanadu/xspec/index.html
- ... ftool
- http://heasarc.nasa.gov/docs/software/ftools/ftools_menu.html
- ... XSPEC distribution
- http://heasarc.nasa.gov/docs/xanadu/xspec/newmodels.html
All Tables
Table 1: Observation log.
Table 2: Spectroscopic results.
All Figures
|
|
Figure 1: The INTEGRAL spectrum of GS 1826-238 as observed in Autumn 2003 (brighter spectrum) and Autumn 2006. Simple crosses and dotted crosses are used for ISGRI and JEM-X, respectively. Residuals to the best COMPTB fits are shown in the lower panels for the 2003 (above) and 2006 data (below). |
| Open with DEXTER | |
| In the text | |
|
|
Figure 2: Comparison of wide band spectra of GS 1826-238 obtained by different observations: our INTEGRAL spectra, as in Fig. 1 (simple lines); RXTE (Barret et al. 2000, dashed line); Chandra+ RXTE (Thompson et al. 2005, dash-dotted); BeppoSAX (in 't Zand et al. 1999, dots). The Fe lines, even when detected, are not included. |
| Open with DEXTER | |
| In the text | |
Copyright ESO 2010
Current usage metrics show cumulative count of Article Views (full-text article views including HTML views, PDF and ePub downloads, according to the available data) and Abstracts Views on Vision4Press platform.
Data correspond to usage on the plateform after 2015. The current usage metrics is available 48-96 hours after online publication and is updated daily on week days.
Initial download of the metrics may take a while.