| Issue |
A&A
Volume 509, January 2010
|
|
|---|---|---|
| Article Number | A106 | |
| Number of page(s) | 20 | |
| Section | Extragalactic astronomy | |
| DOI | https://doi.org/10.1051/0004-6361/200912311 | |
| Published online | 28 January 2010 | |
Long-term variability of the optical spectra of NGC 4151
II.
Evolution of the broad H and H
and H emission-line profiles
A. I. Shapovalova1 - L.C. Popovic2,3 - A. N. Burenkov1 - V. H. Chavushyan4 - D. Ilic3,5 - A. Kovacevic3,5 - N. G. Bochkarev6 - J. León-Tavares4,7
1 - Special Astrophysical Observatory of the Russian AS,
Nizhnij Arkhyz, Karachaevo-Cherkesia 369167, Russia
2 -
Astronomical Observatory, Volgina 7, 11160 Belgrade 74, Serbia
3 -
Isaac Newton Institute of Chile, Yugoslavia Branch
4 -
Instituto Nacional de Astrofísica, Óptica y
Electrónica, Apartado Postal 51, CP 72000, Puebla, México
5 -
Department of Astronomy, Faculty of Mathematics, University
of Belgrade, Studentski trg 16, 11000 Belgrade, Serbia
6 - Sternberg Astronomical
Institute, Moscow, Russia
7 - Metsähovi Radio Observatory, Helsinki University of
Technology TKK, Metsähovintie 114, 02540 Kylmälä, Finland
Received 9 April 2009 / Accepted 10 October 2009
Abstract
Aims. We present the results of a long-term monitoring (11 years, between 1996 and 2006) of H![]() and H
and H![]() line variations of the active galactic nucleus of NGC 4151.
line variations of the active galactic nucleus of NGC 4151.
Methods. High quality spectra (S/N>50 and ![]() Å) of H
Å) of H![]() and H
and H![]() were investigated. During monitoring period, we analyzed line profile variations. Comparing the line profiles of H
were investigated. During monitoring period, we analyzed line profile variations. Comparing the line profiles of H![]() and H
and H![]() ,
we studied different details (bumps, absorbtion features) in the line profiles. The variations in the different H
,
we studied different details (bumps, absorbtion features) in the line profiles. The variations in the different H![]() and H
and H![]() line profile segments were investigated. We also analyzed the Balmer decrement for entire lines and for line segments.
line profile segments were investigated. We also analyzed the Balmer decrement for entire lines and for line segments.
Results. We found that the line profiles varied strongly during
the monitoring period, and exhibited blue and red asymmetries. This is
indicative of a complex BLR geometry inside NGC 4151 with, at
least, three kinematically distinct regions: one that contributes to
the blue line wing, one to the line core and one to the red line wing.
The variation may be caused by an accelerating outflow originating very
close to the black hole, where the red part may come from a region
closer to the black hole than the blue part, which originates in the
region with the highest outflow velocities.
Conclusions. Taking into account that the BLR of NGC 4151
has a complex geometry (probably affected by an outflow) and that a
portion of the broad line emission does not seem to be produced
entirely by photoionization, one may ask whether the study of the BLR
using reverberation mapping would be worthwhile for this galaxy.
Key words: galaxies: active - galaxies: individual: NGC 4151
1 Introduction
In spite of many papers being devoted to the physical properties (physics and geometry, see e.g., Sulentic et al. 2000) of the broad line region (BLR) in active galactic nuclei (AGN), the true nature of the BLR is not well known. The broad emission lines, and their shapes and intensities can provide much information about the BLR geometry and physics. In the first instance, the change in the line profiles and intensities could be used to investigate the BLR nature. It is often assumed that variations in line profiles on long timescales are caused by the dynamic evolution of the BLR gas, and on short timescales by reverberation effects (Sergeev et al. 2001). In a number of papers, it has been shown that individual segments in the line profiles change independently, on both long and short timescales (e.g., Wanders & Peterson 1996; Kollatschny & Dietrich 1997; Newman et al. 1997; Sergeev et al. 1999). The broad line shapes may also provide information about the kinematics and structure of the BLR (see Popovic et al. 2004).One of the most famous and well studied Seyfert galaxies is NGC 4151
(see e.g. Ulrich 2000; Sergeev et al. 2001; Lyuty 2005, Shapovalova
et al. 2008 - Paper I, and reference therein). This galaxy, and its
nucleus, has been studied extensively at all wavelengths. The
reverberation investigation indicates a small BLR size in the center
of NGC 4151 (see e.g. Peterson & Cota 1988: ![]() l.d.; Clavel
et al. 1990:
l.d.; Clavel
et al. 1990: ![]() l.d.; Maoz et al. 1991:
l.d.; Maoz et al. 1991: ![]() l.d.; Bentz et al. 2006:
6.6+1.1-0.8 l.d.).
l.d.; Bentz et al. 2006:
6.6+1.1-0.8 l.d.).
Spectra of NGC 4151 show a P Cygni Balmer and He I absorption with
an outflow velocity ranging between -500
![]() and -2000
and -2000
![]() ,
which varies with the nuclear flux
(Anderson & Kraft 1969; Anderson 1974; Sergeev et al. 2001;
Hutchings et al. 2002). This material is moving outward along the
line of sight, and may be anywhere beyond
,
which varies with the nuclear flux
(Anderson & Kraft 1969; Anderson 1974; Sergeev et al. 2001;
Hutchings et al. 2002). This material is moving outward along the
line of sight, and may be anywhere beyond ![]() 15 light-days
(Ulrich & Horne 1996). An outflow is also seen in higher velocity
emission-line clouds close to the nucleus (Hutchings et al. 1999),
such as multiply shifted absorption lines in C IV and other
UV resonance lines (Weymann et al. 1997; Crenshaw et al.
2000), while
warm absorbers are detected in X-ray data (e.g., Schurch & Warwick
2002).
15 light-days
(Ulrich & Horne 1996). An outflow is also seen in higher velocity
emission-line clouds close to the nucleus (Hutchings et al. 1999),
such as multiply shifted absorption lines in C IV and other
UV resonance lines (Weymann et al. 1997; Crenshaw et al.
2000), while
warm absorbers are detected in X-ray data (e.g., Schurch & Warwick
2002).
Some authors assumed that variable absorption is responsible, at least partially, for the observed continuum variability of AGN (Collin-Souffrin et al. 1996; Boller et al. 1997; Brandt et al. 1999; Abrassart & Czerny 2000; Risaliti et al. 2002). Czerny et al. (2003) considered that most variations are intrinsic to the source, although variable absorption cannot be quite excluded.
The nucleus of NGC 4151 also emits in the radio range. The radio image detects a 0.2 pc two-sided base to the well-known arcsecond radio jet (Ulvestad et al. 2005). The apparent speeds of the jet components relative to the radio AGN are less than 0.050c and less than 0.028c, at nuclear distances of 0.16 and 6.8 pc, respectively. These represent the lowest speed limits yet found in a Seyfert galaxy and are indicative of non-relativistic jet motions, possibly due to thermal plasma, on a scale only an order of magnitude larger than the BLR (Ulvestad et al. 2005).
The observed evolution of the line profiles of the Balmer lines of NGC 4151 was studied by Sergeev et al. (2001) in 1988-1998 and was modeled well within the framework of the two-component model, where two variable components with fixed line profiles (double-peaked and single-peaked) were used.
Although the AGN of NGC 4151 has been well observed and discussed, there are several outstanding questions about the BLR kinematics (disk, jets, or more complex BLR) and dimensions of the innermost region. On the other hand, as mentioned above, multiwavelength observations indicate that both an accretion disk (with a high inclination) and outflow emission (absorption) are present. Consequently, further investigations of the NGC 4151 nucleus are needed to constrain the kinematics, dimensions, and geometry of its BLR.
This work proceeds Paper I and aims to study the variations in both the integrated profiles of the broad emission lines and segments along the line profiles, during the (11-year) period of monitoring of NGC 4151.
The paper is organized as follows: in Sect. 2, observations and data
reduction are presented. In Sect. 3, we study the averaged spectral
line profiles (over years, months, and Periods I-III, see Paper I)
of H![]() and H
and H![]() ,
their line asymmetries and their FWHM
variations, light curves of different line segments, and the
line-segment to line-segment flux and continuum-line-segment
relations. In Sect. 4, we analyze the Balmer decrements. The results
are discussed in Sect. 6 and in Sect. 7 we outline our conclusions.
,
their line asymmetries and their FWHM
variations, light curves of different line segments, and the
line-segment to line-segment flux and continuum-line-segment
relations. In Sect. 4, we analyze the Balmer decrements. The results
are discussed in Sect. 6 and in Sect. 7 we outline our conclusions.
2 Observations and data reduction
Optical spectra of NGC 4151 were taken with the 6-m and 1-m
telescopes of SAO, Russia (1996-2006), with the 2.1-m telescope of
the Guillermo Haro Astrophysical Observatory (GHAO) at Cananea,
Sonora, México (1998-2006), and with the 2.1-m telescope of the
Observatorio Astronómico Nacinal at San Pedro Martir (OAN-SMP),
Baja California, México (2005-2006). They were obtained with a
long-slit spectrograph equipped with CCDs. The typical wavelength
range was 4000-7500 Å, the spectral resolution was R=5-15 Å, and the S/N ratio was >50 in the continuum near H![]() and
H
and
H![]() .
In total, 180 blue and 137 red spectra were taken during
220 nights.
.
In total, 180 blue and 137 red spectra were taken during
220 nights.
Spectrophotometric standard stars were observed each night. The
spectrophotometric data reduction was carried out with either
software developed at the SAO RAS by Vlasyuk (1993), or IRAF for the
spectra observed in México. The image reduction process included
bias subtraction, flat-field corrections, cosmic ray removal, 2D
wavelength linearization, sky spectrum subtraction, addition of the
spectra for every night, and relative flux calibration based on
standard star observations. Spectra were scaled to the constant flux
F
![]() .
More details about observations
and data reduction are given in Paper I and are not repeated here.
.
More details about observations
and data reduction are given in Paper I and are not repeated here.
The observed fluxes of the emission lines were corrected for
position angle (PA), seeing, and aperture effects (see Paper I). The
mean error (uncertainty) in our integral flux determinations for
H![]() and H
and H![]() and for the continuum is <3%. To study the
broad components of emission lines and the main BLR characteristics,
we removed from the spectra the narrow components of these lines and
the forbidden lines. For this purpose, we construct spectral
templates using the blue and red spectra in the minimum activity
state (May 12, 2005). Both the broad and narrow components of H
and for the continuum is <3%. To study the
broad components of emission lines and the main BLR characteristics,
we removed from the spectra the narrow components of these lines and
the forbidden lines. For this purpose, we construct spectral
templates using the blue and red spectra in the minimum activity
state (May 12, 2005). Both the broad and narrow components of H![]() and H
and H![]() ,
were fitted with Gaussians (see Fig. 1).
The template spectrum contains the following lines: for H
,
were fitted with Gaussians (see Fig. 1).
The template spectrum contains the following lines: for H![]() ,
the
narrow component of H
,
the
narrow component of H![]() and [O III]
and [O III]
![]() 4959, 5007; and for H
4959, 5007; and for H![]() the narrow component of H
the narrow component of H![]() ,
[N II]
,
[N II]
![]() 6548, 6584,
[O I]
6548, 6584,
[O I]
![]() 6300, 6364,
[S II]
6300, 6364,
[S II]
![]() 6717, 6731. We then scaled the blue
and red spectra according to our scaling scheme (see the appendix of
Shapovalova et al. 2004), using the template spectrum as reference.
The template spectrum and any observed spectrum are thus matched in
wavelength, brought to the same resolution, and the template
spectrum is then subtracted from the observed one. More details can
be found in Paper I and Shapovalova et al. (2004).
6717, 6731. We then scaled the blue
and red spectra according to our scaling scheme (see the appendix of
Shapovalova et al. 2004), using the template spectrum as reference.
The template spectrum and any observed spectrum are thus matched in
wavelength, brought to the same resolution, and the template
spectrum is then subtracted from the observed one. More details can
be found in Paper I and Shapovalova et al. (2004).
![\begin{figure}
\par\includegraphics[angle=-90,width=8.5cm,clip]{12311f01a.ps}\pa...
...e*{2mm}
\includegraphics[angle=-90,width=8.5cm,clip]{12311f01b.ps}
\end{figure}](/articles/aa/full_html/2010/01/aa12311-09/img28.png)
|
Figure 1:
The decomposition of H |
| Open with DEXTER | |
3 Line profile variations
To investigate the broad line profile variations, we use the most
intense broad lines in the observed spectral range, i.e., H![]() and H
and H![]() ,
only from spectra of spectral resolution
,
only from spectra of spectral resolution ![]()
![]() .
In Paper I, we defined 3 characteristic time periods (I: 1996-1999,
II: 2000-2001, and III: 2002-2006) during which the line profiles
of these lines were similar. Average values and rms profiles of both
lines were obtained during these periods.
.
In Paper I, we defined 3 characteristic time periods (I: 1996-1999,
II: 2000-2001, and III: 2002-2006) during which the line profiles
of these lines were similar. Average values and rms profiles of both
lines were obtained during these periods.
Here we recall some of the most important results of Paper I. In the
first period (I, 1996-1999,
![]() ), when the
lines were most intense, a highly variable blue component was
observed, which exhibited two peaks or shoulders at
), when the
lines were most intense, a highly variable blue component was
observed, which exhibited two peaks or shoulders at ![]()
![]() and
and ![]()
![]() in the rms
H
in the rms
H![]() profiles and, to a lesser degree, in
H
profiles and, to a lesser degree, in
H![]()
![]() . In the second
period (II, 2000-2001,
. In the second
period (II, 2000-2001,
![]() ), the broad lines
were much fainter, the feature at
), the broad lines
were much fainter, the feature at ![]()
![]() was disappearing from the blue part of the rms profiles of both
lines, and only the shoulder at
was disappearing from the blue part of the rms profiles of both
lines, and only the shoulder at ![]()
![]() was
present. A faint shoulder at
was
present. A faint shoulder at ![]()
![]() was
present in the red part of rms line profiles (see Fig. 6 in Paper I). In the third period (III, 2002-2006,
was
present in the red part of rms line profiles (see Fig. 6 in Paper I). In the third period (III, 2002-2006,
![]() ),
a red feature (bump, shoulder) at
),
a red feature (bump, shoulder) at ![]()
![]() was clearly seen in the red part of both the mean and the rms line
profiles (see Fig. 7 in Paper I). In this paper, we study the
variations in the broad line profiles in more detail.
was clearly seen in the red part of both the mean and the rms line
profiles (see Fig. 7 in Paper I). In this paper, we study the
variations in the broad line profiles in more detail.
3.1 Monthly- and yearly-averaged profiles of the broad H
and Hlines
![\begin{figure}
\par\includegraphics[width=6.5cm,clip]{12311f02a.ps}\hspace*{2mm}
\includegraphics[width=6.5cm,clip]{12311f02b.ps}
\vspace*{2mm}
\end{figure}](/articles/aa/full_html/2010/01/aa12311-09/img37.png)
|
Figure 2:
The monthly-averaged profiles of the H |
| Open with DEXTER | |
![\begin{figure}\par\includegraphics[width=6.7cm,clip]{12311f02c.ps}\hspace*{2mm}
\includegraphics[width=6.5cm,clip]{12311f02d.ps}
\vspace*{2mm}
\end{figure}](/articles/aa/full_html/2010/01/aa12311-09/img38.png)
|
Figure 2: continued. |
| Open with DEXTER | |
![\begin{figure}
\par\includegraphics[width=7cm,clip]{12311f03a.ps}\hspace*{4mm}
\includegraphics[width=7cm,clip]{12311f03b.ps}
\end{figure}](/articles/aa/full_html/2010/01/aa12311-09/img39.png)
|
Figure 3:
The yearly-averaged profiles (solid line) and their rms
(dashed line) of the H |
| Open with DEXTER | |
A rapid inspection of spectra shows that the broad line profiles
vary negligibly within a one-month interval. On the other hand, in
this time-interval, a slight variation in the broad line flux is
evident (usually around ![]() 5-10%, except in some cases when it
is up to 30%). Therefore we constructed the monthly-averaged
line profiles (see Fig. 2)
of H
5-10%, except in some cases when it
is up to 30%). Therefore we constructed the monthly-averaged
line profiles (see Fig. 2)
of H![]() and H
and H![]() .
.
The broad H![]() and H
and H![]() line profiles did not vary
significantly within a one-year period (or even during several
years), while the broad line fluxes sometimes varied by factors
line profiles did not vary
significantly within a one-year period (or even during several
years), while the broad line fluxes sometimes varied by factors
![]() 2-2.5 even within one year. The smallest flux variations
(factors
2-2.5 even within one year. The smallest flux variations
(factors ![]() 1.1-1.3) were observed in 1996-1998 (during the line
flux maximum). The largest line flux variations were observed in 2000-2001 and 2005 (factors
1.1-1.3) were observed in 1996-1998 (during the line
flux maximum). The largest line flux variations were observed in 2000-2001 and 2005 (factors ![]() 1.7-2.5), during the minimum of
activity.
1.7-2.5), during the minimum of
activity.
As mentioned in Paper I, specific line profiles are observed during
the three periods, but a more detailed inspection of the line
profiles shows that slight changes can also be seen between the
yearly-averaged profiles (see Fig. 3). We note here that in
the central part of the H![]() profiles one can often see
considerable residuals (e.g., in 2001 in the form of peaks) because
of poor subtraction of the bright narrow components of H
profiles one can often see
considerable residuals (e.g., in 2001 in the form of peaks) because
of poor subtraction of the bright narrow components of H![]() and
[N II]
and
[N II]
![]() 6548, 6584 (at
6548, 6584 (at
![]() and
and ![]()
![]() ). Therefore,
we cannot conclude anything about the presence of absorption in the
central part of H
). Therefore,
we cannot conclude anything about the presence of absorption in the
central part of H![]() .
But, in the H
.
But, in the H![]() profiles (in the
central part, at
profiles (in the
central part, at
![]() ;
;
![]()
![]() )
an absorption, especially strong from
June 1999 to the end of 2000 (see Fig. 2), was detected. We
note here that Hutchings et al. (2002) also found absorbtion at
)
an absorption, especially strong from
June 1999 to the end of 2000 (see Fig. 2), was detected. We
note here that Hutchings et al. (2002) also found absorbtion at
![]() in the H
in the H![]() line.
line.
We now note some noticeable features in monthly-averaged line profiles:
- 1.
- in 1996-2001, a blue peak (bump) in H
and a shoulder in
H
were clearly seen at

 (Fig. 2). However, in 2002-2004, the blue wing of both lines
became steeper than the red one and it did not contain any
noticeable features;
(Fig. 2). However, in 2002-2004, the blue wing of both lines
became steeper than the red one and it did not contain any
noticeable features;
- 2.
- in 2005 (May-June), when the nucleus of NGC 4151 was
experiencing its minimum of activity, the line profiles had a
double-peak structure with two distinct peaks (bumps) at radial
velocities of (
 in H
and
in H
and
 in H
(see Fig. 2; 2005_05 and 2005_06). In principle, the two-peak
structure in the H profiles is also seen in the spectra of
1999-2001: at
in H
(see Fig. 2; 2005_05 and 2005_06). In principle, the two-peak
structure in the H profiles is also seen in the spectra of
1999-2001: at
 the blue and
 the red peak. However, in
this case the blue peak may be caused by a broad absorption line at
the radial velocity (
the red peak. However, in
this case the blue peak may be caused by a broad absorption line at
the radial velocity (
 );
);
- 3.
- in 2006, the line profiles changed dramatically - the blue wing
became flatter than in previous periods, while the red wing was very
steep without any feature at
 ;
;
- 4.
- In 2002, a distinct peak (bump) appeared in the red wing of the
H
and H
lines at the radial velocity
 .
The radial velocity of the red peak
decreases: in 2002-2003, it corresponds to
.
The radial velocity of the red peak
decreases: in 2002-2003, it corresponds to
 and in 2006 to
 .
This effect
is clearly seen in Fig. 4, especially in the Hline profile. Table 1 provides the obtained radial
velocities of red peak measured in the H
and Hprofiles for which the peak was clearly seen. Radial velocities of
the H
and H
red peak, measured over the same period,
are similar (the differences are within the errorbars of
measurements). The mean radial velocity of the red peak decreased by
.
This effect
is clearly seen in Fig. 4, especially in the Hline profile. Table 1 provides the obtained radial
velocities of red peak measured in the H
and Hprofiles for which the peak was clearly seen. Radial velocities of
the H
and H
red peak, measured over the same period,
are similar (the differences are within the errorbars of
measurements). The mean radial velocity of the red peak decreased by
 from 2002 to 2006 (Table 1).
It is unclear whether the red peak is shifting along the line
profile or it disappears and again appears as a new red peak at
another velocity.
from 2002 to 2006 (Table 1).
It is unclear whether the red peak is shifting along the line
profile or it disappears and again appears as a new red peak at
another velocity.
3.2 The absorption and emission features in H
and H
line profiles
As mentioned above (Sect. 3.1), the H![]() and H
and H![]() line
profiles have both absorption and emission features, and
distinguishing between these features is very difficult. The
question is are the ``bumps'' an intrinsic property of the broad
H
line
profiles have both absorption and emission features, and
distinguishing between these features is very difficult. The
question is are the ``bumps'' an intrinsic property of the broad
H![]() and H
and H![]() lines or do they just strengthen the
absorption features? Furthermore, an open question what is the
origin of these features, i.e., is there an intrinsic mechanism in
the BLR that creates these ``bumps''? We should mention here that in
the central part of both lines, the residuals of the narrow
components can affect these relatively weak absorption/emission
features.
lines or do they just strengthen the
absorption features? Furthermore, an open question what is the
origin of these features, i.e., is there an intrinsic mechanism in
the BLR that creates these ``bumps''? We should mention here that in
the central part of both lines, the residuals of the narrow
components can affect these relatively weak absorption/emission
features.
To study it, the residuals between some H![]() broad lines with
prominent (noticeable) bumps from in particular two successive
months were obtained. An example of these residuals are presented in
Fig. 5.
The noticeable
residual bumps (without an absorption-like feature) at Vrfrom (-2000)
broad lines with
prominent (noticeable) bumps from in particular two successive
months were obtained. An example of these residuals are presented in
Fig. 5.
The noticeable
residual bumps (without an absorption-like feature) at Vrfrom (-2000)
![]() to (-1000)
to (-1000)
![]() in 1999-2001, and at Vr from 3500
in 1999-2001, and at Vr from 3500
![]() to 2500
to 2500
![]() in 2002-2006 are seen well. It seems that the
absorption changes slowly and during several next months remains
constant. Therefore, this absorption disappears in profile residuals
(see Fig. 5). Consequently, it seems that emission bumps
observed in the H
in 2002-2006 are seen well. It seems that the
absorption changes slowly and during several next months remains
constant. Therefore, this absorption disappears in profile residuals
(see Fig. 5). Consequently, it seems that emission bumps
observed in the H![]() and H
and H![]() line profiles (seen in the
residuals in Fig. 5) are mostly an intrinsic property of
the broad emission-line profile.
line profiles (seen in the
residuals in Fig. 5) are mostly an intrinsic property of
the broad emission-line profile.
The strong absorption features are also present in 1996-2001
H![]() spectra. In this period, we observed the dip and broad
absorption at radial velocity that changes from
spectra. In this period, we observed the dip and broad
absorption at radial velocity that changes from ![]() -1000 km s-1 in
1996-1998 to
-1000 km s-1 in
1996-1998 to ![]() -400 km s-1 in 1999-2000 (see Fig. 2).
This velocity corresponds to the
minimum of the absorption band, but its blue edge extends to higher
velocities (
-400 km s-1 in 1999-2000 (see Fig. 2).
This velocity corresponds to the
minimum of the absorption band, but its blue edge extends to higher
velocities (![]() -1800 km s-1 in 1998 and
-1800 km s-1 in 1998 and ![]() -1170 in 1999-2000).
Figure 6 shows some observed individual spectra and
their broad component where the blue absorption is well resolved.
The blue-shifted absorption probably originates from outflowing
material.
-1170 in 1999-2000).
Figure 6 shows some observed individual spectra and
their broad component where the blue absorption is well resolved.
The blue-shifted absorption probably originates from outflowing
material.
It is interesting to note that the higher radial velocity (![]() -1000 km s-1, observed in 1996-1998) appears at a higher continuum
flux level, while the smaller velocity (
-1000 km s-1, observed in 1996-1998) appears at a higher continuum
flux level, while the smaller velocity (![]() -400 km s-1) was
measured when the continuum flux had decreased 3-6 times, i.e., we
confirm the results reported by Hutchings et al. (2002), who found
the same trend that the outflow velocity increases with the
continuum flux.
-400 km s-1) was
measured when the continuum flux had decreased 3-6 times, i.e., we
confirm the results reported by Hutchings et al. (2002), who found
the same trend that the outflow velocity increases with the
continuum flux.
Table 1:
The peak shifts in the red wing of the H![]() and
H
and
H![]() lines.
lines.
![\begin{figure}
\par\includegraphics[width=7cm,clip]{12311f04.ps}
\end{figure}](/articles/aa/full_html/2010/01/aa12311-09/img61.png)
|
Figure 4:
Some examples of monthly-averaged profiles of the
H |
| Open with DEXTER | |
3.3 Asymmetry of the broad H
and H
line profiles
We measured the full width at half maximum (FWHM) of the broad lines
from their monthly-averaged profiles and determined the asymmetry (A) as a ratio of the red to blue parts of FWHM, i.e.,
![]() /
/
![]() ,
where
,
where
![]() and W
and W
![]() are
the red and blue half-widths at maximal intensity (see Fig. 7)
with respect to the
position of the narrow component of H
are
the red and blue half-widths at maximal intensity (see Fig. 7)
with respect to the
position of the narrow component of H![]() and H
and H![]() .
As we
mentioned above, there are residuals at the center of the H
.
As we
mentioned above, there are residuals at the center of the H![]() and H
and H![]() lines due to residuals from the subtraction of narrow
components, which can affect the FWHM and A measurements. Therefore,
we first smoothed the line profiles, to avoid artificial peaks from
the residuals (see Fig. 7), before measuring the FWHM and
asymmetry. The two independent measurements of FWHM and A were
performed. We determined the averaged continuum and its dispersion
for each month and the averaged Julian date from the spectra, which
were used to construct the monthly-averaged profiles. The
measurements of the FWHM, asymmetry, and continuum during the entire
period of monitoring (1996-2006) are presented in Table 2
and in Fig. 8. In Table 2, we give average values of the FWHM and A from two
independent measurements and their dispersions.
lines due to residuals from the subtraction of narrow
components, which can affect the FWHM and A measurements. Therefore,
we first smoothed the line profiles, to avoid artificial peaks from
the residuals (see Fig. 7), before measuring the FWHM and
asymmetry. The two independent measurements of FWHM and A were
performed. We determined the averaged continuum and its dispersion
for each month and the averaged Julian date from the spectra, which
were used to construct the monthly-averaged profiles. The
measurements of the FWHM, asymmetry, and continuum during the entire
period of monitoring (1996-2006) are presented in Table 2
and in Fig. 8. In Table 2, we give average values of the FWHM and A from two
independent measurements and their dispersions.
The FWHM of H![]() was almost always larger than that of H
was almost always larger than that of H![]() (see upper panel of Fig. 8). The asymmetry of both lines
(middle panel of Fig. 8) gradually increased between 1996
and 2006 and it slightly anticorrelates with the variations in the
continuum (bottom panel in Fig. 8). The largest values of
the FWHM and an outstanding red asymmetry of both lines (A>1.2)
was observed in 2002-2006. We calculated average values of the FWHM
and A each year, as well as for the whole monitoring period (they
are given in Table 2). FWHMs and asymmetries obtained in
this work from measurements of the monthly-average profiles are
similar to the results given in Paper I and difference between them
are within the error bars. As one can see from Table 2, the
FWHM of both lines varied rather considerably from year to year
(
(see upper panel of Fig. 8). The asymmetry of both lines
(middle panel of Fig. 8) gradually increased between 1996
and 2006 and it slightly anticorrelates with the variations in the
continuum (bottom panel in Fig. 8). The largest values of
the FWHM and an outstanding red asymmetry of both lines (A>1.2)
was observed in 2002-2006. We calculated average values of the FWHM
and A each year, as well as for the whole monitoring period (they
are given in Table 2). FWHMs and asymmetries obtained in
this work from measurements of the monthly-average profiles are
similar to the results given in Paper I and difference between them
are within the error bars. As one can see from Table 2, the
FWHM of both lines varied rather considerably from year to year
(
![]() ). These lines were
at their narrowest in 2000-2001 (
). These lines were
at their narrowest in 2000-2001 (
![]() )
and their broadest in 2005 (
)
and their broadest in 2005 (![]()
![]() )
(see Table 2). At the same time, the H
)
(see Table 2). At the same time, the H![]() FWHM was
always broader than H
FWHM was
always broader than H![]() by on average
by on average ![]()
![]() .
The asymmetry varied in different ways: in 1996-1997, the
blue asymmetry was observed in H
.
The asymmetry varied in different ways: in 1996-1997, the
blue asymmetry was observed in H![]() (
(![]() )
when the
continuum flux was at its maximum; in 1998-2000, H
)
when the
continuum flux was at its maximum; in 1998-2000, H![]() was
almost symmetric, and from 2001 to 2006 the red asymmetry appeared
(A>1.2). In 1996-2001, a blue symmetry (
was
almost symmetric, and from 2001 to 2006 the red asymmetry appeared
(A>1.2). In 1996-2001, a blue symmetry (![]() )
was observed
in H
)
was observed
in H![]() ,
and in 2002-2006 a red asymmetry (A>1.2) was
observed.
,
and in 2002-2006 a red asymmetry (A>1.2) was
observed.
We also tried to identify correlations of both the FWHM and A with
the continuum flux, and found that the FWHM practically does not
correlate with the continuum level (
![]() ). In the case of
the asymmetry A, there is an indication of anticorrelation, but it
should also be interpreted with caution since there is a large
scatter of points in the A versus continuum flux plane, especially
in the case of low continuum fluxes
). In the case of
the asymmetry A, there is an indication of anticorrelation, but it
should also be interpreted with caution since there is a large
scatter of points in the A versus continuum flux plane, especially
in the case of low continuum fluxes
![]() when the measured
asymmetry reaches its highest values. We note that a photoinoization
model predicts that the Balmer lines should be broader in the lower
continuum states and narrower in the higher continuum states (see
Korista & Goad 2004), since, because of the greater response of the
line cores, one can expect that Balmer lines become narrower in
higher continuum states. As one can see from Table 2, there
is no trend for FWHM to be significantly narrower in the high
continuum state.
when the measured
asymmetry reaches its highest values. We note that a photoinoization
model predicts that the Balmer lines should be broader in the lower
continuum states and narrower in the higher continuum states (see
Korista & Goad 2004), since, because of the greater response of the
line cores, one can expect that Balmer lines become narrower in
higher continuum states. As one can see from Table 2, there
is no trend for FWHM to be significantly narrower in the high
continuum state.
3.4 Light curves of different line segments
In Paper I, we obtained light curves of the integrated flux in lines
and continuum. To study the BLR in more detail, we start in this
paper by assuming that a portion of the broad line profile can
respond to variations in the continuum in different ways. Therefore,
we divided the line profiles into 11 identical profile segments,
each of width ![]() 1000
1000
![]() (see Table 3).
(see Table 3).
The observational uncertainties were determined for each segment of
the H![]() and H
and H![]() light curves. In evaluating the
uncertainties, we account for errors due to: the position angle
correction, seeing correction procedure, and aperture correction.
The methods for evaluating these uncertainties (errorbars) are given
in Paper I. The effect of the subtraction of the template spectrum
(or the narrow components) was studied by comparing the flux of
pairs of spectra obtained in the time interval from 0 to 2 days. In
Table 4,
we presented the
yearly-averaged uncertainties (in percent) for each segment of
H
light curves. In evaluating the
uncertainties, we account for errors due to: the position angle
correction, seeing correction procedure, and aperture correction.
The methods for evaluating these uncertainties (errorbars) are given
in Paper I. The effect of the subtraction of the template spectrum
(or the narrow components) was studied by comparing the flux of
pairs of spectra obtained in the time interval from 0 to 2 days. In
Table 4,
we presented the
yearly-averaged uncertainties (in percent) for each segment of
H![]() and H
and H![]() and mean values for all segments and
corresponding mean-year flux. To determine the errorbars, we used 44 pairs of H
and mean values for all segments and
corresponding mean-year flux. To determine the errorbars, we used 44 pairs of H![]() and 68 pairs of H
and 68 pairs of H![]() .
As one can see from
Table 4, for the far wings (segments
.
As one can see from
Table 4, for the far wings (segments ![]() 5) the errorbars
are greater (
5) the errorbars
are greater (![]() 10%) in H
10%) in H![]() than in H
than in H![]() (
(![]() 6%).
But when comparing the errorbars in the far red and blue wings of each lines, we
find that the errorbars are similar. Larger errorbars can also be
seen in the central part of the H
6%).
But when comparing the errorbars in the far red and blue wings of each lines, we
find that the errorbars are similar. Larger errorbars can also be
seen in the central part of the H![]() due to the narrow line
subtraction. Figure 9
shows
the distributions of the errorbars as a function of the line flux
for segments
due to the narrow line
subtraction. Figure 9
shows
the distributions of the errorbars as a function of the line flux
for segments
![]() ,
ha0, and
,
ha0, and
![]() .
It can be seen that in the
case of ha0 and ha+1, there is a slight anticorrelation with flux
and two points, corresponding to very low flux
(
.
It can be seen that in the
case of ha0 and ha+1, there is a slight anticorrelation with flux
and two points, corresponding to very low flux
(
![]() in 2005), have the
highest errorbar of (40-70)%.
in 2005), have the
highest errorbar of (40-70)%.
We constructed light curves for each segment of the H![]() and
H
and
H![]() lines. Figure 10 presents light curves of profile
segments in approximately identical velocity intervals in the blue
and red line wings (segments from 1 to 5, where a higher number
corresponds to a higher velocity, see Table 3) and for the
central part (0 in Table 3 or H
lines. Figure 10 presents light curves of profile
segments in approximately identical velocity intervals in the blue
and red line wings (segments from 1 to 5, where a higher number
corresponds to a higher velocity, see Table 3) and for the
central part (0 in Table 3 or H![]() _c, H
_c, H![]() _c in
Fig. 10, corresponding to the interval
_c in
Fig. 10, corresponding to the interval ![]()
![]()
![]() ). To compare the segment variation with the
continuum, we plot (as a solid line) the continuum flux variation in
the central part (see Fig. 10).
). To compare the segment variation with the
continuum, we plot (as a solid line) the continuum flux variation in
the central part (see Fig. 10).
![\begin{figure}
\par\includegraphics[width=7.5cm,clip]{12311f05a.ps}\hspace*{4mm}
\includegraphics[width=7.5cm,clip]{12311f05b.ps}
\end{figure}](/articles/aa/full_html/2010/01/aa12311-09/img78.png)
|
Figure 5:
The H |
| Open with DEXTER | |
![\begin{figure}
\par\includegraphics[width=8.8cm,clip]{12311f06.ps}
\end{figure}](/articles/aa/full_html/2010/01/aa12311-09/img79.png)
|
Figure 6:
The absorption seen in years 1996, 1998, 1999, and 2000
( from top to bottom). The H |
| Open with DEXTER | |
In 1996-1997, the blue segments 2 and 3 were slightly brighter than
the red ones, while the segments 1, 4, and 5 were similar to the red
ones. In 1998-2001, the blue segments 4 and 5 (3500-5500
![]() ,
which are the regions the closest to the BH) and the
segment 3 (in 2002-2006) of both lines were essentially fainter
than the red ones. In 1998-2004, the blue segments 1 and 2 (500-3500 km s-1) were close to the corresponding red ones or
slightly fainter (see Fig. 10).
,
which are the regions the closest to the BH) and the
segment 3 (in 2002-2006) of both lines were essentially fainter
than the red ones. In 1998-2004, the blue segments 1 and 2 (500-3500 km s-1) were close to the corresponding red ones or
slightly fainter (see Fig. 10).
3.5 The line-segment to line-segment flux and continuum-line-segment relations
The line-segment to line-segment flux and continuum-line-segment
relations for the H![]() and H
and H![]() lines are practically
identical, therefore here we present only results for the H
lines are practically
identical, therefore here we present only results for the H![]() line. First, we search for relations between the H
line. First, we search for relations between the H![]() segments
that are symmetric with respect to the center (i.e., segments -1,
and 1, -2 and 2, ... -5 and 5). In Fig. 11, we present the
response of symmetrical segments of H
segments
that are symmetric with respect to the center (i.e., segments -1,
and 1, -2 and 2, ... -5 and 5). In Fig. 11, we present the
response of symmetrical segments of H![]() to each other for the
three periods given in Paper I. As can be seen from Fig. 11, the symmetric segments are quite strongly correlated,
with some notable exceptions: a) weaker response of the red to the
blue wing in the II and III period and b) the apparent bifurcation
in the Ha2/Ha-2 and Ha3/Ha-3 plots. This appears to be associated
with Period III, related to the appearance of the 3000 km s-1 ``red
bump''. This also implies that lines are probably formed in a
multi-component BLR and that the geometry of the BLR changed during
the monitoring period.
to each other for the
three periods given in Paper I. As can be seen from Fig. 11, the symmetric segments are quite strongly correlated,
with some notable exceptions: a) weaker response of the red to the
blue wing in the II and III period and b) the apparent bifurcation
in the Ha2/Ha-2 and Ha3/Ha-3 plots. This appears to be associated
with Period III, related to the appearance of the 3000 km s-1 ``red
bump''. This also implies that lines are probably formed in a
multi-component BLR and that the geometry of the BLR changed during
the monitoring period.
Additionally, in Fig. 12 we present the response of
different H![]() segments to the continuum flux. As can be seen,
the response differ: in the far wings, the response to the continuum
is almost linear for the red wing (segments 4 and 5) and for a
fraction of the blue wing (segment -4), but for the far blue wing
(-5500 to -4500
segments to the continuum flux. As can be seen,
the response differ: in the far wings, the response to the continuum
is almost linear for the red wing (segments 4 and 5) and for a
fraction of the blue wing (segment -4), but for the far blue wing
(-5500 to -4500
![]() ), there is practically no
response for
), there is practically no
response for
![]() .
For higher continuum fluxes, the far blue
wing has a higher flux, but it also seems that there is no linear
relation between the line wing and the continuum flux. On the other
hand, the central segments (from -3500 to 3500
.
For higher continuum fluxes, the far blue
wing has a higher flux, but it also seems that there is no linear
relation between the line wing and the continuum flux. On the other
hand, the central segments (from -3500 to 3500
![]() )
have a response to the continuum similar to that of the
H
)
have a response to the continuum similar to that of the
H![]() and H
and H![]() total line fluxes (see Paper I) - a linear
response for the low continuum flux (
total line fluxes (see Paper I) - a linear
response for the low continuum flux (
![]() )
and no linear response for the
high continuum flux (
)
and no linear response for the
high continuum flux (
![]() ). The linear response indicates that this
part of the line (red wings and central segments at the low
continuum flux) originates in the part of the BLR ionized by the AGN
source, while the blue and partly central part of the line could
partly originate in a substructure outside this BLR (and probably
not photoionized). We note here that the photoionization in the case
of a mix of a thin (fully ionized) and thick (ionization-bounded)
clouds can explain the observed non-linear response of emission
lines to the continuum in variable as seen in the central parts of
broad lines (see Shields et al. 1995), i.e., in the case of the
optically thick BLR the detailed photoionization models show that
the response of the Balmer lines declines as the continuum flux
increases (see Goad et al. 2004; Korista & Goad 2004). In our case,
we found that the flux in the wings (except the far blue wing) has
an almost linear response to the continuum flux, while the central
parts have a non-linear response to the higher continuum flux. The
response to the continuum flux of the far blue wing (-5) and far red
wing (+5) is also very different, which may be indicative of
different physical conditions in subregions or across the BLR.
). The linear response indicates that this
part of the line (red wings and central segments at the low
continuum flux) originates in the part of the BLR ionized by the AGN
source, while the blue and partly central part of the line could
partly originate in a substructure outside this BLR (and probably
not photoionized). We note here that the photoionization in the case
of a mix of a thin (fully ionized) and thick (ionization-bounded)
clouds can explain the observed non-linear response of emission
lines to the continuum in variable as seen in the central parts of
broad lines (see Shields et al. 1995), i.e., in the case of the
optically thick BLR the detailed photoionization models show that
the response of the Balmer lines declines as the continuum flux
increases (see Goad et al. 2004; Korista & Goad 2004). In our case,
we found that the flux in the wings (except the far blue wing) has
an almost linear response to the continuum flux, while the central
parts have a non-linear response to the higher continuum flux. The
response to the continuum flux of the far blue wing (-5) and far red
wing (+5) is also very different, which may be indicative of
different physical conditions in subregions or across the BLR.
In Fig. 13,
the flux of
different H![]() segments as a function of the flux of the
central segment (H
segments as a function of the flux of the
central segment (H![]() 0) are presented. It can be seen that
there are different relations between different H
0) are presented. It can be seen that
there are different relations between different H![]() segments
and H
segments
and H![]() 0: for segments close to the center (H
0: for segments close to the center (H![]() -1,
H
-1,
H![]() -2, H
-2, H![]() 1, and H
1, and H![]() 2) the relation is almost
linear, indicating that the core of the line originates in the same
substructures (Fig. 13); segments in the H
2) the relation is almost
linear, indicating that the core of the line originates in the same
substructures (Fig. 13); segments in the H![]() wings
(the near blue wing H
wings
(the near blue wing H![]() -3 and the red wing H
-3 and the red wing H![]() 3,
H
3,
H![]() 4, and H
4, and H![]() 5) also show a linear response to the
central segment (but the scatter of the points is larger than in the
previous case), which also indicates that a portion of the emission
in the center and in these segments originates in the same emission
region. In contrast, the far blue wing (H
5) also show a linear response to the
central segment (but the scatter of the points is larger than in the
previous case), which also indicates that a portion of the emission
in the center and in these segments originates in the same emission
region. In contrast, the far blue wing (H![]() -4 and H
-4 and H![]() -5)
responds weakly to the variation in the line center, especially
H
-5)
responds weakly to the variation in the line center, especially
H![]() -5, which exhibits practically independent variations with
respect to the central segment.
-5, which exhibits practically independent variations with
respect to the central segment.
![\begin{figure}
\par\includegraphics[width=14cm,clip]{12311f07.ps}
\end{figure}](/articles/aa/full_html/2010/01/aa12311-09/img82.png)
|
Figure 7: An example of the FWHM and asymmetry measurements. The observed spectra is denoted by the dashed line and the smoothed spectra by the solid line. |
| Open with DEXTER | |
![\begin{figure}
\par\includegraphics[width=8cm,clip]{12311f08.eps}
\end{figure}](/articles/aa/full_html/2010/01/aa12311-09/img85.png)
|
Figure 8:
Variations in the FWHM ( upper panel), asymmetry ( middle
panel) in H |
| Open with DEXTER | |
4 The Balmer decrement
4.1 Integral Balmer decrement
From monthly-averaged profiles of the broad HFigure 14 shows the behavior of the integrated BD (upper panel) and continuum flux at the wavelength 5100 Å (bottom panel). In 1999-2006, an anticorrelation between the changes of the integrated BD and continuum flux was observed, which was especially noticeable in 1999-2001.
Table 5 presents yearly-averaged values of the BD and continuum flux determined from monthly-averaged profiles for each year.
We found that in 1996-1998 the continuum flux was high and varied
within the limits given by
![]() ,
but the BD was practically unchanged. In Paper I, we already noted
the absence of correlation between the continuum flux and the
integrated flux of the broad lines for the above-mentioned flux
values. We also found (see Fig. 14) that the Balmer
decrement is systematically higher in 1999-2001.
,
but the BD was practically unchanged. In Paper I, we already noted
the absence of correlation between the continuum flux and the
integrated flux of the broad lines for the above-mentioned flux
values. We also found (see Fig. 14) that the Balmer
decrement is systematically higher in 1999-2001.
Table 2:
The FWHM and asymmetry of the H![]() and
H
and
H![]() broad emission lines in the period of 1996-2006.
broad emission lines in the period of 1996-2006.
Table 3:
The beginning and end radial velocities,
![]() and
and
![]() ,
in km s-1 for different segments of the line
profiles.
,
in km s-1 for different segments of the line
profiles.
Table 4:
The errors in measurements (e
![]() )
for all line segments (see Table 3) of H
)
for all line segments (see Table 3) of H![]() and
H
and
H![]() given in percent. For each segment, the mean-year flux is
also given in units
given in percent. For each segment, the mean-year flux is
also given in units
![]() .
.
Table 5 also provides the average data of the BD and continuum flux for the periods of 1996-1998, 1999, 2000-2001, and 2002-2006. It is evident that in the period of 1996-1998 the BD did not vary within the error bars in spite of strong variations in the continuum. Radical changes (the increase in the BD) started in 1999.
The BD reached its maximum in 2000-2001. In 2002-2006, the average values of the BD then coincided with those of 1996-1998. Thus, it can be concluded with confidence that from 1999 to 2001 we observed an obvious increase in the BD.
4.2 Balmer decrement of different profile segments
From monthly-averaged profiles of H![]() and H
and H![]() ,
we
determined the BD for the segments of Table 3. Figure 15
shows the BD variation
in a 2D plane (year-Vr), and Fig. 16 indicates the
changes in the BD of different segments of the profiles during the
whole monitoring period.
,
we
determined the BD for the segments of Table 3. Figure 15
shows the BD variation
in a 2D plane (year-Vr), and Fig. 16 indicates the
changes in the BD of different segments of the profiles during the
whole monitoring period.
It can be seen from Figs. 15 and 16 that in
2000-2001 (
![]() )
the values of the BD in different
segments were always on average noticeably larger than in the other
years, and the blue wing had always on average a noticeably larger
BD than the red one. In 1996-1998, BDs of the blue and red wings
practically coincided, and in 2002-2006, they either coincided or
the BD of the blue wing was slightly larger.
During the entire monitoring period, the value of the BD along the
line profile in central segments (in segments 0,
)
the values of the BD in different
segments were always on average noticeably larger than in the other
years, and the blue wing had always on average a noticeably larger
BD than the red one. In 1996-1998, BDs of the blue and red wings
practically coincided, and in 2002-2006, they either coincided or
the BD of the blue wing was slightly larger.
During the entire monitoring period, the value of the BD along the
line profile in central segments (in segments 0,![]() 1 corresponding
to the velocity range from
1 corresponding
to the velocity range from
![]() to 1500
to 1500
![]() )
were considerably larger (by
)
were considerably larger (by ![]() 1.5) on
average than at the periphery (segments from
1.5) on
average than at the periphery (segments from ![]() 2 to
2 to ![]() 5
corresponding to the velocity range from (
5
corresponding to the velocity range from (
![]() )
to (+5500)-(+1500)
)
to (+5500)-(+1500)
![]() )).
)).
4.2.1 Balmer decrement variations as a function of the radial velocity
As an illustration of the variation in the Balmer decrement with the radial velocity during the monitoring period, we show in Fig. 17 the BD as a function of the radial velocity. Since the BD versus velocity remains the same throughout a year, we provide a few examples only for monthly-averaged spectra for each year of the monitoring period.
On the other hand, the behavior of the Balmer decrement as a
function of the radial velocity differs between different years. As
a rule, in 1996-1998 the maximum of the BD occurred at ![]()
![]() ,
while the BD slowly decreased in the velocity
range from 0 to 1000
,
while the BD slowly decreased in the velocity
range from 0 to 1000
![]() ,
and sharply decreased in
the region >
,
and sharply decreased in
the region >![]()
![]() ,
usually more strongly in
the region of negative velocity. We recall here the results
obtained from the photoionization model of Korista & Goad (2004)
where they found velocity-dependent variations in the Balmer
decrement. They found that the Balmer decrement is steeper in the
line core than in line wings, as we obtained in some cases (see Fig. 17), but it is interesting that in all periods this peak is
offset from the central part to the blue side and also that there
are several cases where the Balmer decrement is steeper in the
wings. On the other hand, if the velocity field is dominated by a
central massive object, one can expect to observe a symmetrical BD
in the blue and red part of velocity field (Korista & Goad 2004).
In our case, we obtained different asymmetrical shapes of the BD
versus velocity field. The BD seems to have a systematic change in
behavior starting around 2002 - i.e., corresponding to period III,
when the ``red bump'' appears, showing two maxima in the BD versus
velocity field. This may indicate that the velocity field of the BLR
is not dominated by a central massive black hole, i.e., that it
favors some kind of stream of the emitting material such as e.g.,
outflow or inflow.
,
usually more strongly in
the region of negative velocity. We recall here the results
obtained from the photoionization model of Korista & Goad (2004)
where they found velocity-dependent variations in the Balmer
decrement. They found that the Balmer decrement is steeper in the
line core than in line wings, as we obtained in some cases (see Fig. 17), but it is interesting that in all periods this peak is
offset from the central part to the blue side and also that there
are several cases where the Balmer decrement is steeper in the
wings. On the other hand, if the velocity field is dominated by a
central massive object, one can expect to observe a symmetrical BD
in the blue and red part of velocity field (Korista & Goad 2004).
In our case, we obtained different asymmetrical shapes of the BD
versus velocity field. The BD seems to have a systematic change in
behavior starting around 2002 - i.e., corresponding to period III,
when the ``red bump'' appears, showing two maxima in the BD versus
velocity field. This may indicate that the velocity field of the BLR
is not dominated by a central massive black hole, i.e., that it
favors some kind of stream of the emitting material such as e.g.,
outflow or inflow.
![\begin{figure}
\par\includegraphics[width=8.8cm,clip]{12311f09.eps}
\end{figure}](/articles/aa/full_html/2010/01/aa12311-09/img100.png)
|
Figure 9:
The flux error measurements (in percent of part line flux)
against flux for -5, -1, 0, 1, 5 segments of the H |
| Open with DEXTER | |
![\begin{figure}
\par\includegraphics[width=8.8cm]{12311f10a.eps}\par\vspace*{2mm}
\includegraphics[width=8.8cm]{12311f10b.eps}
\end{figure}](/articles/aa/full_html/2010/01/aa12311-09/img102.png)
|
Figure 10:
Light curves of the different H |
| Open with DEXTER | |
In 1999-2001, the maximum values of the BD ![]() (6-8) were
observed in the velocity region
(6-8) were
observed in the velocity region ![]()
![]() ,
while
a steeper decrease in the BD was more often observed in the region
of the positive velocity. The change in the BD relative to the
radial velocity in 2002-2006 differed strongly from those
in 1996-2001. In these years, 2 peaks (bumps) were observed in the
BD
distribution: one at radial velocities from -2000 to -1000
with
larger values of the BD, and a second at
,
while
a steeper decrease in the BD was more often observed in the region
of the positive velocity. The change in the BD relative to the
radial velocity in 2002-2006 differed strongly from those
in 1996-2001. In these years, 2 peaks (bumps) were observed in the
BD
distribution: one at radial velocities from -2000 to -1000
with
larger values of the BD, and a second at
![]() with somewhat smaller (by
with somewhat smaller (by ![]() (0.5-1.0)) values of the BD.
(0.5-1.0)) values of the BD.
4.3 Balmer decrement and helium line ratio
To probe the physical conditions of the BLR, we studied the flux
ratio of He II ![]() 4686 and HeI
4686 and HeI ![]() 5876 broad lines. From
all the available spectra, we selected only 21 spectra where the
broad helium lines could be precisely measured, and where the two
helium lines were observed during the same night. In the case of
minimum activity, we note the broad component of the He II
5876 broad lines. From
all the available spectra, we selected only 21 spectra where the
broad helium lines could be precisely measured, and where the two
helium lines were observed during the same night. In the case of
minimum activity, we note the broad component of the He II ![]() 4686 line could not be detected at all.
4686 line could not be detected at all.
We use the helium lines He II ![]() 4686 and He I
4686 and He I ![]() 5876,
since these two lines originates from two different ionization
stages and, thus, are very sensitive to changes in the electron
temperature and density of the emitting region (Griem 1997).
5876,
since these two lines originates from two different ionization
stages and, thus, are very sensitive to changes in the electron
temperature and density of the emitting region (Griem 1997).
In Fig. 18, we indicate the HeII/HeI versus continuum flux
(first panel), BD versus HeII/HeI (second panel), and He II/H![]() versus continuum flux (third panel). As can be seen from Fig. 18 (first panel), there is a good correlation between the
continuum flux and the helium line ratio (the correlation
coefficient r=0.81), which indicates that these lines probably
originate in the region photoionized by the continuum source. On the
other hand, the Balmer decrement decreases as the ratio of the two
helium lines increases (the anti-correlation is a bit weaker here,
the correlation coefficient being r=0.75), indicating that as the
ionization becomes stronger, the BD decreases (Fig. 18,
second panel).
versus continuum flux (third panel). As can be seen from Fig. 18 (first panel), there is a good correlation between the
continuum flux and the helium line ratio (the correlation
coefficient r=0.81), which indicates that these lines probably
originate in the region photoionized by the continuum source. On the
other hand, the Balmer decrement decreases as the ratio of the two
helium lines increases (the anti-correlation is a bit weaker here,
the correlation coefficient being r=0.75), indicating that as the
ionization becomes stronger, the BD decreases (Fig. 18,
second panel).
![\begin{figure}
\par\mbox{\includegraphics[width=5.8cm,clip]{12311f11a.ps}\hspace...
...
\includegraphics[width=7.8cm,clip]{12311f11d.ps}\hspace*{3.1cm}}
\end{figure}](/articles/aa/full_html/2010/01/aa12311-09/img105.png)
|
Figure 11:
The segment to segment response, where the first period
(Period I, 1996-1999) is denoted with open circles, the second
period (Period II, 2000-2001) with full ones, and the third period
(Period III, 2002-2006) with open triangles (Paper I). The flux is
given in
|
| Open with DEXTER | |
There is some connection between the helium and Balmer lines (Fig. 18, left), but the physical properties of the emitting
regions of these lines differ probably. One explanation of this
correlation may be that part of the Balmer lines originate in the
same region as He I and He II lines. Since the ratio of He II/ He I
is sensitive to changes in temperature and electron density, in the
case of a higher He II/ He I ratio, the ionization is higher and the
population at a higher level in hydrogen has a higher probability,
consequently the ratio of H![]() /H
/H![]() is smaller than in the
case of a lower He II/ He I ratio.
is smaller than in the
case of a lower He II/ He I ratio.
![\begin{figure}
\par\includegraphics[width=6cm,clip]{12311f12a.ps}\hspace*{4mm}
\...
...6cm,clip]{12311f12k.ps}\hspace*{4mm}\hspace*{5.6cm}\vspace*{6mm}
\end{figure}](/articles/aa/full_html/2010/01/aa12311-09/img107.png)
|
Figure 12:
The flux of different segments of the line as a function of
the continuum flux. The line flux is given in
|
| Open with DEXTER | |
![\begin{figure}
\par\includegraphics[width=5.2cm,clip]{12311f13a.ps}\hspace*{4mm}...
...7mm}\includegraphics[width=5cm,clip]{12311f13j.ps}\hspace*{12cm}
\end{figure}](/articles/aa/full_html/2010/01/aa12311-09/img108.png)
|
Figure 13:
The flux of different H |
| Open with DEXTER | |
5 Summary of the results
We have investigated different aspects of broad H![]() and
H
and
H![]() line variations (shapes, ratios, widths, and asymmetries),
so in this section we summarize our results.
line variations (shapes, ratios, widths, and asymmetries),
so in this section we summarize our results.
5.1 Summary of the line profile variations
Table 5: Yearly-averaged and period-averaged variations in the integral Balmer decrement (BD) and continuum fluxes.
We summarize here the main results of the line profile variations in NGC 4151:
- i)
- the line profile of H
and H
varied during the
monitoring period, exhibiting both blue (1996-1999) and red
(2002-2006) asymmetry. We observe bumps (shelves or an additional
emission) in the blue region in 1996-1997 at
 and
,
in 1998-99 at
and
,
in 1998-99 at
 ,
and in 2000-2001 at -2000 and -500
,
and in 2000-2001 at -2000 and -500
 already. However, in 2002-2004 these details disappeared in the
blue wing of both lines. It became steeper than the red one and did
not contain any noticeable features. In 2002, a distinct bump
appeared in the red wing of both lines at
already. However, in 2002-2004 these details disappeared in the
blue wing of both lines. It became steeper than the red one and did
not contain any noticeable features. In 2002, a distinct bump
appeared in the red wing of both lines at
 .
The radial velocity of a bump in the red wing changed from
in 2002 to
in 2006.
The appearance of the blue and red bumps was possibly related to a
jet component;
.
The radial velocity of a bump in the red wing changed from
in 2002 to
in 2006.
The appearance of the blue and red bumps was possibly related to a
jet component;
- ii)
- in 2005 (May-June), when the nucleus of NGC 4151 experienced its
minimum activity state, the line profiles had a double-peaked
structure with two distinct peaks (bumps) at radial velocities of
-2586, +2027
in H
and -1306, +2339
in H;
- iii)
- in 1996-2001, we observed a broad deep absorption line in
H
at a radial velocity that took values from
 to
to
 ;
;
- iv)
- the FWHM is not correlated with the continuum flux, while the
asymmetry tends to anti-correlate with it (coefficient correlation
 ). The FWHM and asymmetry in H
are greater than in
H,
which may be caused by H
originating closer to the
SMBH, thus explaining its larger widths;
). The FWHM and asymmetry in H
are greater than in
H,
which may be caused by H
originating closer to the
SMBH, thus explaining its larger widths;
- v)
- we divided the line profiles into 11 identical segments, each of
width 1000
and investigated the correlations
between segments and continuum flux and between segments and
segments flux. We found that the far red wings (from 3500 to 5500
)
and central (at
 )
segments for the continuum flux
)
segments for the continuum flux
 respond to the continuum almost linearly,
and that these segments probably originate in the part of the BLR
ionized by the AGN source;
respond to the continuum almost linearly,
and that these segments probably originate in the part of the BLR
ionized by the AGN source;
- vi)
- the central (

 )
segments for
)
segments for
 do not show
any linear relation with continuum flux. In periods of high
activity, these line segments probably partly originate in
substructures that are not photoioninized by the AGN continuum;
do not show
any linear relation with continuum flux. In periods of high
activity, these line segments probably partly originate in
substructures that are not photoioninized by the AGN continuum;
- vii)
- the far blue wing (from -5500 to -4500) seems to originate in
a separate region, so it does not respond to the continuum flux
variation as well as to the variation of the other line segments,
except in the case of high line flux, where it responds to the far
red wing (see Fig. 12). This may indicate that the far blue
wing is emitted by a distinct region that is not photoionized, and
also that the emission is highly blueshifted (as e.g., an outflow
with velocities >3500
);
- viii)
- the far red wing is very sensitive to the continuum flux variation, and thus probably originates in a region closest to the center, i.e., this part of the line seems to be purely photoionized by the AGN source.
![\begin{figure}
\par\includegraphics[width=8cm,clip]{12311f14.ps}
\end{figure}](/articles/aa/full_html/2010/01/aa12311-09/img119.png)
|
Figure 14:
Variations in the integrated Balmer decrement
|
| Open with DEXTER | |
5.2 Summary of the BD variations
![\begin{figure}
\par\includegraphics[width=15cm,clip]{12311f15.ps}
\end{figure}](/articles/aa/full_html/2010/01/aa12311-09/img120.png)
|
Figure 15:
The variations in the Balmer decrement for different parts
of the broad emission lines. The flux is given in
|
| Open with DEXTER | |
During the monitoring period, the Balmer decrement
(
![]() H
H![]() )/F(H
)/F(H![]() )) varied from 2 to 8. It is also
interesting that BDs differ along line profiles. In 1996-1998,
there was no significant correlation between the BD and the
continuum flux (the continuum flux was
)) varied from 2 to 8. It is also
interesting that BDs differ along line profiles. In 1996-1998,
there was no significant correlation between the BD and the
continuum flux (the continuum flux was
![]() ). In 1999-2001, maximal
variations in the BD were observed, especially in the blue part of
lines. The maximal value of the BD along the line profiles strongly
differed: in 1996-2001, the BD reached its maximum at
). In 1999-2001, maximal
variations in the BD were observed, especially in the blue part of
lines. The maximal value of the BD along the line profiles strongly
differed: in 1996-2001, the BD reached its maximum at
![]()
![]() and in 2002-2006 the BD had 2 peaks - at
velocities from -2000 to -1000 and at
and in 2002-2006 the BD had 2 peaks - at
velocities from -2000 to -1000 and at
![]() for somewhat smaller (by
for somewhat smaller (by ![]() (0.5-1)) values of the BD. In the last
case, it is possible that the second bump (the fainter one) is
caused by the interaction between the receding sub-parsec jet and
environment.
(0.5-1)) values of the BD. In the last
case, it is possible that the second bump (the fainter one) is
caused by the interaction between the receding sub-parsec jet and
environment.
The different values of the BD observed during the monitoring period (as well as different values of the BD along the profiles) are also indicative of a multicomponent origin of the broad lines. These different ratios may be caused by absorption, but also by different physical conditions in different parts of the BLR.
6 Discussion
It is interesting to compare our results with those found in the UV
and X rays. Crenshaw & Kraemer (2007) found a width of 1170 km s-1 (FWHM) for the UV emission lines significantly smaller than
our results for the Balmer lines (
![]() km s-1,
around 5-6 times smaller). This can be interpreted as the
existence of an intermediate component between the broad and narrow
(emission) line regions (see e.g., Popovic et al. 2009). In the
same paper, they found evidence that the UV emission lines originate
in the same gas responsible for most of the UV and X-ray absorption.
The absorption can be seen in outflow at a distance of 0.1 pc from
the central nucleus. It is also interesting that Crenshaw & Kraemer
(2007) favor a magnetocentrifugal acceleration (e.g., in an
accretion disk wind) over those that rely on radiation or thermal
expansion as the principal driving mechanism of the mass outflow.
Obscuration should play an important role, but we found that while
absorption can clearly be detected in the H
km s-1,
around 5-6 times smaller). This can be interpreted as the
existence of an intermediate component between the broad and narrow
(emission) line regions (see e.g., Popovic et al. 2009). In the
same paper, they found evidence that the UV emission lines originate
in the same gas responsible for most of the UV and X-ray absorption.
The absorption can be seen in outflow at a distance of 0.1 pc from
the central nucleus. It is also interesting that Crenshaw & Kraemer
(2007) favor a magnetocentrifugal acceleration (e.g., in an
accretion disk wind) over those that rely on radiation or thermal
expansion as the principal driving mechanism of the mass outflow.
Obscuration should play an important role, but we found that while
absorption can clearly be detected in the H![]() line, the
H
line, the
H![]() line displays a small amount of absorption (see Figs. 2 and 3). Absorption in the H
line displays a small amount of absorption (see Figs. 2 and 3). Absorption in the H![]() line was
previously reported by Hutchings et al. (2002), therefore
obscuration of the optical continuum should be present in NGC 4151.
The location of the obscuring material was estimated by Puccetti et al. (2007). They analyzed the X-ray variability of the nucleus. They
found that the location of the obscuring matter is within
line was
previously reported by Hutchings et al. (2002), therefore
obscuration of the optical continuum should be present in NGC 4151.
The location of the obscuring material was estimated by Puccetti et al. (2007). They analyzed the X-ray variability of the nucleus. They
found that the location of the obscuring matter is within
![]() Schwarzschild radii of the central X-ray source
and suggested that absorption variability plays a crucial role in
the observed flux variability of NGC 4151.
Schwarzschild radii of the central X-ray source
and suggested that absorption variability plays a crucial role in
the observed flux variability of NGC 4151.
![\begin{figure}
\par\includegraphics[width=7cm,clip]{12311f16.eps}
\end{figure}](/articles/aa/full_html/2010/01/aa12311-09/img126.png)
|
Figure 16:
Variations in the BD of different segments of the line
profiles and in the continuum flux ( bottom panel) in 1996-2006. The
BD of segments in the blue wing (numbers from -5 to -1 from Table 3) are denoted with plus (+), in red wing (numbers from
+5 to +1 from Table 3) with crosses ( |
| Open with DEXTER | |
![\begin{figure}
\par\includegraphics[width=4.5cm,clip]{12311f17a.ps}\hspace*{4mm}...
...m}
\includegraphics[width=4.5cm,clip]{12311f17p.ps}\hspace*{4.9mm}\end{figure}](/articles/aa/full_html/2010/01/aa12311-09/img127.png)
|
Figure 17:
Variations in the Balmer decrement
|
| Open with DEXTER | |
| Figure 18:
Left: the variation of the ratio of the helium He II
|
|
| Open with DEXTER | |
We discuss some possible formation scenarios for the BLR. As we
mentioned above, the outflow is probably induced by the
magnetocentrifugal acceleration, and starts very close to the black
hole. If we adopt a black hole mass of around
![]() (obtained from stellar dynamical measurements, see Onken et al. 2008, which is in agreement with Bentz et al. 2006), the
acceleration (and line emission) starts at
(obtained from stellar dynamical measurements, see Onken et al. 2008, which is in agreement with Bentz et al. 2006), the
acceleration (and line emission) starts at ![]() 10-4 pc from
the black hole and the outflow emits until reaching a distance of
10-4 pc from
the black hole and the outflow emits until reaching a distance of
![]() 0.01 pc, taking into account the absorption velocities (e.g.
Hutchings et al. 2002) of around -1000 km s-1,
0.01 pc, taking into account the absorption velocities (e.g.
Hutchings et al. 2002) of around -1000 km s-1,
As mentioned above, the broad H![]() and H
and H![]() lines show
different widths and asymmetries during the monitoring period,
indicating a complex structure of the BLR. We also found that the
line profiles of H
lines show
different widths and asymmetries during the monitoring period,
indicating a complex structure of the BLR. We also found that the
line profiles of H![]() and H
and H![]() could be different at the
same epoch. Therefore, one should consider a multi-component origin
of these lines.
could be different at the
same epoch. Therefore, one should consider a multi-component origin
of these lines.
To propose a BLR model, one should take into account that: a) there is an absorption component in the blue part of lines that indicate that some kind of outflow may start in the BLR (see Sect. 3.2). Crenshaw & Kraemer (2007) also reported a mass outflow from the nucleus of NGC 4151, but they confirmed the observed outflow in the intermediate line region (ILR); b) the flux in the far red wing correlates well with the continuum flux, indicating that it originates in an emission region very close to the continuum source, i.e., to the central black hole; c) the flux of the far blue wing does not correlate with the continuum, which may be indicative of some kind of shock contribution to the Balmer line.
All of these results indicate that an outflow probably exists in the BLR. In this case, complex line profiles (with different features) can be expected because of changes in the outflowing structure, as is often seen in the narrow lines observed in the jet-induced shocks (see e.g., Whittle & Wilson 2004). Of course, we cannot exclude there being some contribution of different regions to the composite line profile, as e.g., there can be also contribution of the ILR which may be with an outflow geometry. In a forthcoming paper, we propose to compare the observational results with those predicted by various models of the kinematics and structure of the BLR (e.g., a bi-conical outflow, an accelerating outflow (wind), a Keplerian disk, jets, etc.).
We note that the line profiles change during the monitoring period,
especially after 2002, when the ``red bump'' appears. After that, the
asymmetry of both lines (see Table 2) and BD exhibit different
behaviors than in the period 1996-2002. In the III period, the
line profiles of H![]() and H
and H![]() very much changed in shape
from double-peaked profiles (see Figs. 1 and 2) to quite
asymmetrical profiles (as observed in 2006).
very much changed in shape
from double-peaked profiles (see Figs. 1 and 2) to quite
asymmetrical profiles (as observed in 2006).
The integrated Balmer decrement reached a maximum in 1999-2001 (see
Fig. 14). The BD changes shape from 2002, showing two peaks
in its BD versus velocity field profile. This is probably connected
to strong inhomogeneities in the distribution of the absorbing
material during different periods of monitoring. Since the line
flux in H![]() and H
and H![]() at low fluxes (<
at low fluxes (<
![]() )
correlates well with that of the
continuum (Paper 1), we infer that the change in the integrated
Balmer decrement during 1999-2001 is also caused, at least
partially, by changes in the continuum flux. Indeed, when the
ionization parameter decreases for a constant density plasma, an
increase in F(H
)
correlates well with that of the
continuum (Paper 1), we infer that the change in the integrated
Balmer decrement during 1999-2001 is also caused, at least
partially, by changes in the continuum flux. Indeed, when the
ionization parameter decreases for a constant density plasma, an
increase in F(H![]() )/F(H
)/F(H![]() )
intensity ratio is expected
(see for instance Wills et al. 1985). This is because of the
decrease in the excitation state of the ionized gas, since when the
temperature of the ionized zone gets smaller, the population of the
upper levels with respect to the lower decreases. In 1996-1998, BDs
did not correlate with continuum, i.e., the main cause of BD
variations is not related to the active nucleus and the shock
initiated emission is probably dominant. We detected that the FWHM
of lines does not correlate with the continuum. This confirms our
assumption that broad lines can form in several (three) different
subsystems or that the emission is affected by an outflow that
produces shock-initiated emission.
)
intensity ratio is expected
(see for instance Wills et al. 1985). This is because of the
decrease in the excitation state of the ionized gas, since when the
temperature of the ionized zone gets smaller, the population of the
upper levels with respect to the lower decreases. In 1996-1998, BDs
did not correlate with continuum, i.e., the main cause of BD
variations is not related to the active nucleus and the shock
initiated emission is probably dominant. We detected that the FWHM
of lines does not correlate with the continuum. This confirms our
assumption that broad lines can form in several (three) different
subsystems or that the emission is affected by an outflow that
produces shock-initiated emission.
7 Conclusions
This work is intended to proceed Paper I (Shapovalova et al. 2008)
and has entailed a detailed analysis of the broad H![]() and
H
and
H![]() line profile variations during the 11-year period of
monitoring (1996-2006). From this study (Sect. 3), it follows that
the BLR in NGC 4151 is complex, and that broad emission lines
represent the sums of components formed in different subsystems:
line profile variations during the 11-year period of
monitoring (1996-2006). From this study (Sect. 3), it follows that
the BLR in NGC 4151 is complex, and that broad emission lines
represent the sums of components formed in different subsystems:
- 1.
- The first component is photoionized by the AGN continuum (far red
line wings,
 and
and
 and
central (at
and
central (at  )
segments for continuum
flux
)
segments for continuum
flux
 ).
This region is the closest to the SMBH.
).
This region is the closest to the SMBH.
- 2.
- The second component varies independently of changes in the AGN
continuum (far blue line wings,
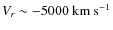 ;
;
 ). It is possibly generated by shocks
initiated by an outflow.
). It is possibly generated by shocks
initiated by an outflow.
- 3.
- The third component, where the central parts of lines (
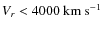 )
are formed, in high fluxes
)
are formed, in high fluxes
 is also independent of the
AGN continuum (possibly, outflow and jet).
is also independent of the
AGN continuum (possibly, outflow and jet).
Authors would like to thank Suzy Collin for her suggestions how to improve this paper. Also, we thank the anonymous referee for very useful comments. This work was supported by INTAS (grant N96-0328), RFBR (grants N97-02-17625 N00-02-16272, N03-02-17123 and 06-02-16843, 09-02-01136), State program ``Astronomy'' (Russia), CONACYT research grant 39560-F and 54480 (México) and the Ministry of Science and Technological Development of Republic of Serbia through the project Astrophysical Spectroscopy of Extragalactic Objects (146002).
References
- Abrassart, A., & Czerny, B. 2000, A&A, 356, 475 [Google Scholar]
- Anderson, K. S. 1974, ApJ, 189, 195 [NASA ADS] [CrossRef] [Google Scholar]
- Anderson, K. S., & Kraft, R. P. 1969, ApJ, 158, 859 [NASA ADS] [CrossRef] [Google Scholar]
- Bentz, M. C., Denney, K. D., Cackett, E. M., et al. 2006, ApJ, 651, 775 [NASA ADS] [CrossRef] [Google Scholar]
- Boller, Th., Brandt, W. N., & Fabian, A. C. 1997, MNRAS, 289, 393 [NASA ADS] [CrossRef] [Google Scholar]
- Brandt, W. N., Boller, Th., Fabian, A. C., & Ruszkowski, M. 1999, MNRAS, 303, L53 [NASA ADS] [CrossRef] [Google Scholar]
- Clavel, J., Boksenberg, A., Bromage, G. E., et al. 1990, MNRAS, 246, 668 [NASA ADS] [Google Scholar]
- Collin-Souffrin, S., Czerny, B., Dumont, A.-M., & Zycki, P. T. 1996, A&A, 314, 393 [Google Scholar]
- Crenshaw, D. M., & Kraemer, S. B. 2007, ApJ, AJ, 659, 250 [Google Scholar]
- Crenshaw, D. M., Kraemer, S. B., Hutchings, J. B., et al. 2000, AJ, 120, 1731 [NASA ADS] [CrossRef] [Google Scholar]
- Czerny, B., Doroshenko, V. T., Nikolajuk, M., et al. 2003, MNRAS, 342, 1222 [NASA ADS] [CrossRef] [Google Scholar]
- Griem, H. R. 1997, Principles of plasma spectroscopy (Cambridge: Cambridge University Press) [Google Scholar]
- Goad, M. R., Korista, K. T., & Knigge, C. 2004, MNRAS, 352, 277 [NASA ADS] [CrossRef] [Google Scholar]
- Hutchings, J. B., Crenshaw, D. M., Danks, A. C., et al. 1999, AJ, 118, 2101 [NASA ADS] [CrossRef] [Google Scholar]
- Hutchings, J. B., Crenshaw, D. M., Kraemer, S. B., et al. 2002, AJ, 124, 2543 [NASA ADS] [CrossRef] [Google Scholar]
- Kollatschny, W., & Dietrich, M. 1997, A&A, 323, 5 [Google Scholar]
- Korista, K. T., & Goad, M. R. 2004, ApJ, 606, 749 [NASA ADS] [CrossRef] [Google Scholar]
- Lyuty, V. M. 2005, Pis'ma in Astron. Zh., 31, 723 (rus) [Google Scholar]
- Maoz, D., Netzer, H., Mazeh, T., et al. 1991, ApJ, 367, 493 [NASA ADS] [CrossRef] [Google Scholar]
- Newman, J. A., Eracleous, M., Filippenko, A. V., & Halpern, J. P. 1997, ApJ, 485, 570 [NASA ADS] [CrossRef] [Google Scholar]
- Onken, C. A., Valluri, M., Peterson, B. M., et al. 2007, ApJ, 670, 105 [NASA ADS] [CrossRef] [Google Scholar]
- Peterson, B. M., & Cota, S. A. 1988, ApJ, 330, 111 [NASA ADS] [CrossRef] [Google Scholar]
- Popovic, L.C., Mediavilla, E., Bon, E., & Ilic, D. 2004, A&A, 423, 909 [Google Scholar]
- Popovic, L.C., Smirnova, A. A., Kovacevic, J., Moiseev, A. V., & Afanasiev, V. L. 2009, AJ, 137, 3548 [NASA ADS] [CrossRef] [Google Scholar]
- Puccetti, S., Fiore, F., Risaliti, G., et al. 2007, MNRAS, 377, 607 [NASA ADS] [CrossRef] [Google Scholar]
- Risaliti, G., Elvis, M., & Nicastro, F. 2002, ApJ, 571, 234 [NASA ADS] [CrossRef] [Google Scholar]
- Schurch, N. J., & Warwick, R. S. 2002, MNRAS, 334, 811 [NASA ADS] [CrossRef] [Google Scholar]
- Sergeev, S. G., Pronik, V. I., Sergeeva, E. A., & Malkov, Yu. F. 1999, ApJS, 121, 159 [NASA ADS] [CrossRef] [Google Scholar]
- Sergeev, S. G., Pronik, V. I., & Sergeeva, E. A. 2001, ApJ, 554, 245 [NASA ADS] [CrossRef] [Google Scholar]
- Shapovalova, A. I., Doroshenko, V. T., Bochkarev, N. G., et al. 2004, A&A, 422, 925 [Google Scholar]
- Shields, J. C., Ferland, G. J., & Peterson, B. M. 1995, ApJ, 441, 507 [NASA ADS] [CrossRef] [Google Scholar]
- Sulentic, J. W., Marziani, P., & Dultzin-Hacyan, D. 2000, ARA&A, 38, 521 [Google Scholar]
- Shapovalova, A. I., Popovic, L. C, Collin, S., et al. 2008, A&A, 486, 99 [Google Scholar]
- Ulrich, M.-H. 2000, A&ARv, 10, 135 [Google Scholar]
- Ulrich, M.-H., & Horne, K. 1996, MNRAS, 283, 748 [NASA ADS] [CrossRef] [Google Scholar]
- Ulvestad, J. S., Wong, D. S., Taylor, G. B., Gallimore, J. F., & Mundell, C. G. 2005, AJ, 130, 936 [NASA ADS] [CrossRef] [Google Scholar]
- Vlasyak, V. V. 1993, Bull. Spec. Astrophys. Obs., 36, 107 [NASA ADS] [Google Scholar]
- Wanders, I., & Peterson, B. M. 1996, ApJ, 466, 174 [NASA ADS] [CrossRef] [Google Scholar]
- Waymann, R. J., Morris, S. L., Gray, M. E., & Hutchings, J. B. 1997, ApJ, 483, 717 [NASA ADS] [CrossRef] [Google Scholar]
- Whittle, M., & Wilson, A. 2004, AJ, 127, 606 [NASA ADS] [CrossRef] [Google Scholar]
- Wills, B. J., Netzer, H., & Wills, D. 1985, ApJ, 288, 94 [NASA ADS] [CrossRef] [Google Scholar]
Footnotes
- ...
![[*]](/icons/foot_motif.png)
- Here and after in the text the radial velocities
are given with respect to the corresponding narrow components of
H
or H,
i.e. it is accepted that Vr = 0 for
the narrow components of H
and H.
All Tables
Table 1:
The peak shifts in the red wing of the H![]() and
H
and
H![]() lines.
lines.
Table 2:
The FWHM and asymmetry of the H![]() and
H
and
H![]() broad emission lines in the period of 1996-2006.
broad emission lines in the period of 1996-2006.
Table 3:
The beginning and end radial velocities,
![]() and
and
![]() ,
in km s-1 for different segments of the line
profiles.
,
in km s-1 for different segments of the line
profiles.
Table 4:
The errors in measurements (e
![]() )
for all line segments (see Table 3) of H
)
for all line segments (see Table 3) of H![]() and
H
and
H![]() given in percent. For each segment, the mean-year flux is
also given in units
given in percent. For each segment, the mean-year flux is
also given in units
![]() .
.
Table 5: Yearly-averaged and period-averaged variations in the integral Balmer decrement (BD) and continuum fluxes.
All Figures
|
|
Figure 1:
The decomposition of H |
| Open with DEXTER | |
| In the text | |
|
|
Figure 2:
The monthly-averaged profiles of the H |
| Open with DEXTER | |
| In the text | |
|
|
Figure 2: continued. |
| Open with DEXTER | |
| In the text | |
|
|
Figure 3:
The yearly-averaged profiles (solid line) and their rms
(dashed line) of the H |
| Open with DEXTER | |
| In the text | |
|
|
Figure 4:
Some examples of monthly-averaged profiles of the
H |
| Open with DEXTER | |
| In the text | |
|
|
Figure 5:
The H |
| Open with DEXTER | |
| In the text | |
|
|
Figure 6:
The absorption seen in years 1996, 1998, 1999, and 2000
( from top to bottom). The H |
| Open with DEXTER | |
| In the text | |
|
|
Figure 7: An example of the FWHM and asymmetry measurements. The observed spectra is denoted by the dashed line and the smoothed spectra by the solid line. |
| Open with DEXTER | |
| In the text | |
|
|
Figure 8:
Variations in the FWHM ( upper panel), asymmetry ( middle
panel) in H |
| Open with DEXTER | |
| In the text | |
|
|
Figure 9:
The flux error measurements (in percent of part line flux)
against flux for -5, -1, 0, 1, 5 segments of the H |
| Open with DEXTER | |
| In the text | |
|
|
Figure 10:
Light curves of the different H |
| Open with DEXTER | |
| In the text | |
|
|
Figure 11:
The segment to segment response, where the first period
(Period I, 1996-1999) is denoted with open circles, the second
period (Period II, 2000-2001) with full ones, and the third period
(Period III, 2002-2006) with open triangles (Paper I). The flux is
given in
|
| Open with DEXTER | |
| In the text | |
|
|
Figure 12:
The flux of different segments of the line as a function of
the continuum flux. The line flux is given in
|
| Open with DEXTER | |
| In the text | |
|
|
Figure 13:
The flux of different H |
| Open with DEXTER | |
| In the text | |
|
|
Figure 14:
Variations in the integrated Balmer decrement
|
| Open with DEXTER | |
| In the text | |
|
|
Figure 15:
The variations in the Balmer decrement for different parts
of the broad emission lines. The flux is given in
|
| Open with DEXTER | |
| In the text | |
|
|
Figure 16:
Variations in the BD of different segments of the line
profiles and in the continuum flux ( bottom panel) in 1996-2006. The
BD of segments in the blue wing (numbers from -5 to -1 from Table 3) are denoted with plus (+), in red wing (numbers from
+5 to +1 from Table 3) with crosses ( |
| Open with DEXTER | |
| In the text | |
|
|
Figure 17:
Variations in the Balmer decrement
|
| Open with DEXTER | |
| In the text | |
| |
Figure 18:
Left: the variation of the ratio of the helium He II
|
| Open with DEXTER | |
| In the text | |
Copyright ESO 2010
Current usage metrics show cumulative count of Article Views (full-text article views including HTML views, PDF and ePub downloads, according to the available data) and Abstracts Views on Vision4Press platform.
Data correspond to usage on the plateform after 2015. The current usage metrics is available 48-96 hours after online publication and is updated daily on week days.
Initial download of the metrics may take a while.