| Issue |
A&A
Volume 508, Number 3, December IV 2009
|
|
|---|---|---|
| Page(s) | 1423 - 1427 | |
| Section | Stellar atmospheres | |
| DOI | https://doi.org/10.1051/0004-6361/200911830 | |
| Published online | 21 October 2009 | |
A&A 508, 1423-1427 (2009)
Optical linear polarization in ultra cool dwarfs
A tool to probe dust in the ultra cool dwarf atmospheres
R. Tata1 - E. L. Martín2,3,1 - S. Sengupta4,5 - N. Phan-Bao6,7 - M. R. Zapatero Osorio2,3 - H. Bouy3
1 - University of Central Florida, Department of Physics, Orlando,
32816-2385, USA
2 - Centro de Astrobioloíga (CAB-CSIC), Ctra. Ajalvir km 4, 28850
Torrejón de Ardoz, Madrid, Spain
3 - Instituto de Astrofísica de Canarias, 38205 La Laguna, Tenerife,
Spain
4 - Indian Institute of Astrophysics, Koramangala, Bangalore, 560034
India
5 - TIARA-ASIAA/National Tsing Hua University, Hsinchu, Taiwan
6 - Institute of Astronomy and Astrophysics, Academia Sinica, PO Box
23-141, Taipei 106, Taiwan, China
7 - Department of Physics, HCMIU, Vietnam National University
Administrative Building, Block 6, Linh Trung Ward, Thu Duc District,
HCM, Vietnam
Received 11 February 2009 / Accepted 13 October 2009
Abstract
Aims. Recent studies have detected linear
polarization in L dwarfs in the optical I band.
Theoretical models have been developed to explain this polarization.
These models predict higher polarization at shorter wavelengths. We
discuss the polarization in the R and I band
of 4 ultra cool dwarfs.
Methods. We report linear polarization measurements
of 4 ultra cool dwarfs in the R
and I bands using the Intermediate
dispersion Spectrograph and Imaging System (ISIS) mounted on the
4.2 m William Herschel Telescope (WHT).
Results. As predicted by theoretical models, we find
a higher degree of polarization in the R band
when compared to polarization in the I band
for 3/4 of these ultra cool dwarfs. This suggests that dust
scattering asymmetry is caused by oblateness . We also show how these
measurements fit the theoretical models. A case for variability of
linear polarization is found, which suggests the presence of randomly
distributed dust clouds. We also discuss one case for the presence of a
cold debris disk.
Key words: polarization - atmospheric effects - stars: low-mass, brown dwarfs
1 Introduction
A large number of ultra cool dwarfs have been detected in the last decade, and our understanding of these faint objects has kept improving. One of the challenging and fundamental aspects in the study of these objects is to understand the properties and distribution of condensate dust in the atmosphere. Observations of L dwarfs with effective temperatures of 1400-2200 K have led to the investigation of dust condensates in their atmospheres (Kirkpatrick et al. 1999; Tsuji et al. 1996). Because of complete gravitational settling, grains are expected to condense beyond the visible atmosphere for objects with effective temperatures below 1400 K (T-Dwarfs - Allard et al. 2001; Chabrier et al. 2000). At higher effective temperatures (1400-2200 K), grains can be present in the visible atmosphere because of incomplete gravitational settling (Burrows & Sharp 1999; Burrows et al. 2001; Ackerman & Marley 2001; Allard et al. 2001; Tsuji et al. 2004; Cooper et al. 2003; Helling et al. 2008). Recent discoveries of blue L dwarfs and L-T transition type dwarfs (as identified in ; Chiu et al. 2006; Tsuji & Nakajima 2003) have brought forth models which could explain this phenomenon (e.g. Burrows et al. 2006; ) by mechanisms which involve dust settling. It would be very important to validate these mechanisms.
Linear polarization could be a very useful tool in understanding the observationally poorly constrained dust properties in the atmospheres of L dwarfs. The possibility of detecting polarization at optical wavelengths from grains in the atmospheres of L dwarfs was first raised by Sengupta & Krishan (2001). Fast rotation of L dwarfs will induce the shape of their photosphere into the form of an oblate ellipsoid (Basri et al. 2000) and this nonsphericity will lead to the incomplete cancellation of the polarization from different areas of the stellar surface (Sengupta & Krishan 2001). This prediction was first confirmed by the detection of linear polarization at 768 nm from a few L dwarfs by Ménard et al. (2002). Recently, Zapatero Osorio et al. (2005) have reported R and I band detection of linear polarization from several L dwarfs. Since polarization in the optical is unlikely to be due to Zeeman splitting of atomic or molecular lines or by synchrotron radiation, the observed polarization can be explained by single dust scattering in a rotationally induced oblate atmosphere (Sengupta 2003; Sengupta & Kwok 2005) or it could be due to large and randomly distributed dust clouds (Ménard et al. 2002).
In this paper, we report polarization measurements of 3 L dwarfs (L0-L5) and one M9.5 dwarf with WHT/ISIS in both I and R bands. We also discuss our results comparing them with the recently published results of Goldman et al. (2009).
Our measurements show the general trend that polarization is higher in the R band than the one in the I band. This trend strongly supports the presence of dust in the atmosphere of L dwarfs as it is very unlikely that any other mechanisms (such as the presence of magnetic field) can explain this observation at optical wavelengths (Ménard et al. 2002). We also discuss how the theoretical models (see Sect. 3) successfully fit our measured data.
Table 1: Target list.
2 Target selection and observations
Four very nearby (7 pc -15 pc) ultra cool dwarfs were selected (SpT M9.5 - L5) as they are among the brightest and nearest ultra cool dwarfs with no known infrared excess and no evidence of multiplicity (see Table 1). These selection criteria ensure that the targets are bright enough sources in the R band to get high S/N and to avoid other than intrinsic sources of polarization such as circumstellar disks or multiplicity. For calibration, one polarized (Cyg OB2 A Whittet et al. 1992) and one unpolarized standard star were observed at two different times during the night. All the objects were observed in a way that they insured they were acquired at the same position on the detector (5 pixel box). This procedure minimized contamination caused by instrumental polarization within the detector and variations in the optical path.The polarimetric observations were obtained using the
Intermediate dispersion Spectrograph and Imaging System (ISIS) which is
mounted at the Cassegrain focus of the 4.2 m William Herschel
Telescope (located in La Palma, Canary Islands, Spain).
ISIS in polarization mode is a modulation polarimeter with a
double-beam analyzer (the calcite plate) and a rotating halfwave plate
modulator. ISIS is equipped with two detectors: a blue-sensitive EEV12
(
![]() pixels) and a
red-sensitive RED+ (
pixels) and a
red-sensitive RED+ (
![]() )
detector. In our program, we have used the RED+ detector.
)
detector. In our program, we have used the RED+ detector.
Images were obtained using Bessel R- and I-filters centered on 641 and 812 nm, respectively, on June 18, 2006 (UT Date). The night was photometric with stable average seeing of 1.0 arcsec.
The raw images were bias-subtracted and flat-fielded before
performing aperture photometry. The flat-field images were obtained
with the polarimeter optics.
Fluxes were obtained for 0.8, 1.0, 1.2, 1.5,
2.0 times the average FWHM for each
object. The best aperture was chosen to be 1.5 times FWHM
based on minimum photon contribution of nearby sources, variable sky
contribution, and maximum signal-to-noise ratio of the measurements.
The average FWHM of all images was
4.0 pixels which corresponds to 1.0 arcsec. We have
only one set of measurements for each object. Therefore, we have
estimated the uncertainty in the degree of polarization from various
apertures (a similar method was used by Zapatero
Osorio et al. (2005) for some of the objects).
There was no significant instrumental polarization found as the
unpolarized standard measured D(p)=0.086% ![]() 0.002.
0.002.
3 Theoretical modeling of polarization
Polarization is a measure of anisotropy in the radiation field and is
caused by either scattering or is due to the presence of magnetic
field. The state of the polarization of light is described by the
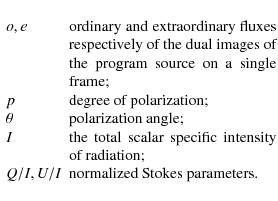
Stokes parameters, I, Q, U
and V.
The parameter I is the total scalar specific
intensity of radiation.
It is the complete flux of radiant energy inside the unit intervals of
frequency, time, solid angle, and area perpendicular to the flux.
This flux includes all radiation independently of polarization.
Polarization is described by the parameters Q, U,
V. These parameters
are proportional to the scalar specific intensity and have the same
dimension. Q and U represent
the linearly polarized component, and V represents
the circularly polarized component.
For linear polarization, V=0 and the degree of
polarization is given as
![]() .
If we consider axial symmetry, then U=0 and in that
case we define the degree of polarization p=-Q/I.
The sign convention
is such that if p>0, the light is polarized
perpendicular to the scattering
plane, and if p<0, the light is polarized
parallel to the scattering plane. For an unresolved stellar object, the
Stokes parameters are
integrated over the stellar disk.
.
If we consider axial symmetry, then U=0 and in that
case we define the degree of polarization p=-Q/I.
The sign convention
is such that if p>0, the light is polarized
perpendicular to the scattering
plane, and if p<0, the light is polarized
parallel to the scattering plane. For an unresolved stellar object, the
Stokes parameters are
integrated over the stellar disk.
From our obtained images, the degree of polarization and the
polarization angles are calculated using the following equations:
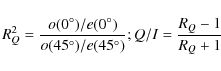
|
(1) |
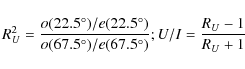
|
(2) |
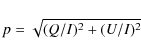
|
(3) |
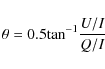
|
(4) |
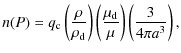
where
As pointed out by Ménard et al. (2002), the observed linear polarization in the optical cannot be due to magnetic field, and scattering remains the most viable mechanism for yielding the detected linear polarization. Polarimetric observation at the R and I bands by Zapatero Osorio et al. (2005) shows that polarization decreases significantly with the increase in wavelength, which strongly supports this argument (Sengupta & Kwok 2005). In the present investigation, we report detection of polarization at both R and I bands which shows the same wavelength dependency and hence strengthens the case for scattering polarization. If the dust density is low, then the single scattering approximation is reasonable for the region where the dust optical depth
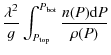
The simple theoretical model adopted here to explain the
observed polarization is
described in details in Sengupta
& Kwok (2005). At an edge-on view, the degree of
polarization
integrated over the stellar disk is given by:
![$\displaystyle \times \sum^{\infty}_{l=2}
\left\{\alpha^2(l,m)P_l^m(0)F_{l2}\!\int^1_{-1}\frac{P_l(\mu)}{[1+(A^2-1)\mu^2]^{1/2}}{\rm d}\mu
\right\}.$](/articles/aa/full_html/2009/48/aa11830-09/img17.png)
In the above expression, P is the total pressure (gas plus dust),
where
![\begin{displaymath}\alpha(l,m)=\left[\frac{(2l+1)(l-m)\!}{4\pi(l+m)\!}\right]^{1/2},
\end{displaymath}](/articles/aa/full_html/2009/48/aa11830-09/img25.png)
|
(7) |
and Pml is the associated Legendre function of the first kind. i1 and i2 are the scattering functions given by van de Hulst (1957).
The vertical dust distribution and the location of the cloud
base and deck in the atmosphere
are calculated based on the one dimensional heterogeneous cloud model
of Cooper et al. (2003).
This model assumes chemical equilibrium throughout the atmosphere and
uniform
density distribution across the surface of an object at each given
pressure
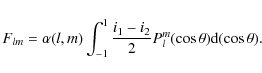
and temperature. The number density of cloud particles in this model is
given by
where
| (9) |
for heterogeneously condensing clouds. In the above equation,
Table 2: Polarization measurements.
A log-normal size distribution is adopted for the spherical grains (Ackerman & Marley 2001). The formation of dust makes it a prohibitive task to develop a fully consistent atmospheric model for ultra-cool dwarfs. This is mainly because of the fact that the presence of dust clouds affects the radiative equilibrium of the upper atmosphere and hence alters the T-P profile from that of a cloud-free atmosphere. On the other hand, the T-P profile dictates the position and the chemical equilibrium of condensates. Allard et al. (2001) presented atmospheric models for two of the limiting cases, e.g., one with inefficient gravitational settling wherein the dust is distributed according to chemical equilibrium predictions (AMES-dusty) and another with efficient gravitational settling in which situation dust has no effect on the thermal structure (AMES-cond). Tsuji et al. (2004) have proposed a Unified Cloudy Model (UCM) in which the segregation of dust from the gaseous mixture takes place in all the ultra-cool dwarfs and at about the same critical temperature. Ackerman & Marley (2001) treat the upward convective mixing of a gas, its condensation and the sedimentation of the condensate through the atmosphere of the object while Woitke & Helling (2004) consider an ensamble of dust grains falling downwards from the top of the atmosphere. A detailed comparison of different atmospheric models of L dwarfs is presented in Helling et al. (2008).
The oblateness of a rotating object has been discussed by Chandrasekhar (2003)
in the context of
polytropic gas configuration under hydrostatic equilibrium. For a slow
rotator,
the relationship for the oblateness f of a
stable
polytropic gas configuration under hydrostatic equilibrium is given by

where M is the total mass,
The effective temperature of the L dwarfs of different
spectral type is determined by adopting a sixth order polynomial fit
given by
Golimowski et al. (2004)
which is based on bolometric luminosities.
The ![]() calibration of Golimowski et al.
(2004) agrees well
in the interval L3-L8, but there are significant differences in earlier
types.
In our calculations for the degree of polarization, the effective
temperature
calibration of Golimowski et al.
(2004) agrees well
in the interval L3-L8, but there are significant differences in earlier
types.
In our calculations for the degree of polarization, the effective
temperature
![]() is used and hence the degree
of polarization should
be considered strictly as a function of
is used and hence the degree
of polarization should
be considered strictly as a function of
![]() rather than of spectral
type. The mass and radius
of the L dwarfs of different spectral types are estimated by adopting
the empirical
relationship given by Marley
et al. (1996).
rather than of spectral
type. The mass and radius
of the L dwarfs of different spectral types are estimated by adopting
the empirical
relationship given by Marley
et al. (1996).
4 Results
We find a trend (more data are required to confirm our theory) of
higher polarization in the R band when
compared
to the I band. This wavelength dependency
strongly supports the argument by Sengupta
& Kwok (2005) that the
polarization arises due to scattering and not because of magnetic
field. In dust scattering as described
by Mie theory, the amount of polarization depends on the ratio of the
grain radius to the
wavelength. For the same kind of dust species, the polarization usually
peaks when the ratio is
one. As a consequence, the increase in polarization with the decrease
in wavelength implies the
presence of sub-micron size grains in the photosphere of the
L dwarfs. We present our measurements in Table 2, and our model fit
in Fig. 1.
One of the L dwarfs from Zapatero
Osorio et al. (2005) (2MASSW J1507476-162738) shows
a
null polarization in our measurements in the I band,
whereas Zapatero Osorio
et al. (2005)
present a higher polarization (1.36![]()
![]() 0.30) for the same object. This
suggests variability in linear polarization which in turn suggests
atmospheric activities like dynamical variations of the cloud cover.
0.30) for the same object. This
suggests variability in linear polarization which in turn suggests
atmospheric activities like dynamical variations of the cloud cover.
![\begin{figure}
\par\includegraphics[width=8.5cm,clip]{11830figure1.eps}
\end{figure}](/articles/aa/full_html/2009/48/aa11830-09/img40.png)
|
Figure 1: Best model fit of the observed data. The solid lines represent the model with the polytropic index n=1.0 and dashed lines represent that with n=1.5. For other parameters see Table 3. |
| Open with DEXTER | |
We also find relatively high polarization in the L0 dwarf.
Additionally, from Schmidt
et al. (2007),
the H![]() equivalent width is the highest for the L0 dwarf among the objects from
our sample.
This could be an indirect evidence of a disk around this ultra cool
dwarf. We therefore searched the Spitzer public
archive
for mid-IR data. 2MASS J17312974+2721233 has been observed with IRAC
and IRS in the course of program 3136 (P.I. Cruz), and we
retrieved the pipeline processed data. We extracted the IRAC photometry
using standard PSF photometry procedures within the Interactive Data
Language. Uncertainties were estimated from the Poisson noise weighted
by the coverage maps of the mosaics. Table 4 gives a summary of
the photometry. Figure 2
shows the spectral energy distribution (SED) of the source and a L0
comparison object from the literature (2MASS J1204+3212,
Patten et al. 2006). 2MASS J17312974+2721233 does not show any
significant mid-IR excess up to 15
equivalent width is the highest for the L0 dwarf among the objects from
our sample.
This could be an indirect evidence of a disk around this ultra cool
dwarf. We therefore searched the Spitzer public
archive
for mid-IR data. 2MASS J17312974+2721233 has been observed with IRAC
and IRS in the course of program 3136 (P.I. Cruz), and we
retrieved the pipeline processed data. We extracted the IRAC photometry
using standard PSF photometry procedures within the Interactive Data
Language. Uncertainties were estimated from the Poisson noise weighted
by the coverage maps of the mosaics. Table 4 gives a summary of
the photometry. Figure 2
shows the spectral energy distribution (SED) of the source and a L0
comparison object from the literature (2MASS J1204+3212,
Patten et al. 2006). 2MASS J17312974+2721233 does not show any
significant mid-IR excess up to 15 ![]() m. The presence of a young circumstellar disc can
therefore be ruled out at a high level of confidence. In the current
state of the data, we cannot rule out the presence of a cold debris
disc, as it would produce an excess at longer wavelengths.
m. The presence of a young circumstellar disc can
therefore be ruled out at a high level of confidence. In the current
state of the data, we cannot rule out the presence of a cold debris
disc, as it would produce an excess at longer wavelengths.
![\begin{figure}
\par\includegraphics[width=9cm,clip]{11830sed.eps}
\end{figure}](/articles/aa/full_html/2009/48/aa11830-09/img41.png)
|
Figure 2:
Spectral energy distribution of 2MASS J17312974+2721233 (dots). V-band
photometry from the LSPM-North proper-motion catalog of nearby stars
(Lépine et al. 2005). J, H
and |
| Open with DEXTER | |
Table 3: Model fit.
For all the cases, the observed polarization profiles can be fitted with sub-micron size grains, and the mean size of grains that are required to fit the observation is consistent with the recent theoretical calculations of dust properties (Woitke & Helling 2004; Woitke & Helling 2003). Polarization measurements for one of the above three objects (2MASSW J1507476-162738) were also recently published Goldman et al. (2009). Our results are consistent with the Goldman et al. (2009) measurements within 1Table 4: IRAC photometry of 2MASS J17312974+2721233.
5 Conclusions
- 1.
- We report linear polarizaion measurements of 4 very nearby ultra cool dwarfs in the R and I bands.
- 2.
- We find that there is a trend (3 out of 4) of a higher degree of polarization at shorter wavelengths (R band) when compared to the I band as predicted by the theoretical models of Sengupta & Kwok (2005).
- 3.
- The L0 dwarf 2MASS J17312974+2721233 is interesting because of its relatively high polarization and requires follow-up studies.
- 4.
- We also fit theoretical models to predict the dust grain size and rotational velocities of three of the ultra cool dwarfs.
- 5.
- We find evidence for variability in the linear polarization for (2MASSW J1507476-162738). This suggests atmospheric activities like dynamical variations of the cloud cover in this object.
Acknowledgements
This work was partially funded by the Spanish MICINN under the Consolider-Ingenio 2010 Program grant CSD2006-00070: First Science with the GTC (http://www.iac.es/consolider-ingenio-gtc)
References
- Ackerman, A. S., & Marley, M. S. 2001, ApJ, 556, 872 [NASA ADS] [CrossRef]
- Allard, F., Hauschildt, P. H., Alexander, D. R., Tamanai, A., & Schweitzer, A. 2001, ApJ, 556, 357 [NASA ADS] [CrossRef]
- Bailer-Jones, C. A. L. 2004, A&A, 419, 703 [NASA ADS] [EDP Sciences] [CrossRef]
- Basri, G., Mohanty, S., Allard, F., et al. 2000, ApJ, 538, 363 [NASA ADS] [CrossRef]
- Berger, E., Rutledge, R. E., Reid, I. N., et al. 2005, ApJ, 627, 960 [NASA ADS] [CrossRef]
- Burrows, A., & Sharp, C. M. 1999, ApJ, 512, 843 [NASA ADS] [CrossRef]
- Burrows, A., Hubbard, W. B., Lunine, J. I., & Liebert, J. 2001, RvMP, 73, 719 [NASA ADS] [CrossRef]
- Burrows, A., Sudarsky, D., & Hubeny, I. 2006, ApJ, 640, 1063 [NASA ADS] [CrossRef]
- Chabrier, G., Baraffe, I., Allard, F., & Hauschildt, P. 2000, ApJ, 542, 464 [NASA ADS] [CrossRef]
- Chandrasekhar, S. 1933, MNRAS, 93, 539 [NASA ADS]
- Chiu, K., Fan, X., Leggett, S. K., et al. 2006, AJ, 131, 2722 [NASA ADS] [CrossRef]
- Cooper, C. S., Sudarsky, D., Milsom, J. A., Lunine, J. I., & Burrows, A. 2003, ApJ, 586, 1320 [NASA ADS] [CrossRef]
- Cruz, K. L., Reid, I. N., Liebert, J., Kirkpatrick, J. D., & Lowrance, P. J. 2003, AJ, 126, 2421 [NASA ADS] [CrossRef]
- Goldman, B., Pitann, J., Zapatero Osorio, M. R., et al. 2009, A&A, 502, 929 [NASA ADS] [EDP Sciences] [CrossRef]
- Golimowski, D. A., Leggett, S. K., Marley, M. S., et al. 2004, AJ, 127, 3516 [NASA ADS] [CrossRef]
- Helling, Ch. 2003, Rev. Mod. Astron. 16, 15
- Helling, Ch., Ackerman, A., Allard, F., et al. 2008, MNRAS, 391, 1854 [NASA ADS] [CrossRef]
- Hubbard, W. B. 1984, Planetary Interiors (New York: Van Nostrand Reinhold)
- Jameson, et al. 2007, AJ, 119, 339
- Kirkpatrick, J. D., Allard, F., Bida, T., et al. 1999, ApJ, 519, 834 [NASA ADS] [CrossRef]
- Knapp, G. R., Leggett, S. K., Fan, X., et al. 2004, AJ, 127, 3553 [NASA ADS] [CrossRef]
- Marley, M. S., Saumon, D., Guillot, T., et al. 1996, Science, 272, 1919 [NASA ADS] [CrossRef]
- Ménard, F., Delfosse, X., Monin, J.-L., et al. 2002, A&A, 396, L35 [NASA ADS] [EDP Sciences] [CrossRef]
- Patten, B. M., Stauffer, J. R., Burrows, A., et al. 2006, ApJ, 651, 502 [NASA ADS] [CrossRef]
- Reid, I. N., Kirkpatrick, J. D., Gizis, J. E. et al. 2000, AJ, 119, 369 [NASA ADS] [CrossRef]
- Reiners, A., & Basri, G. 2008, ApJ, 684, 1390 [NASA ADS] [CrossRef]
- Schmidt, S. J., Cruz, K. L., Bongiorno, B. J., Liebert, J., & Reid, I. N. 2007, AJ, 133, 2258 [NASA ADS] [CrossRef]
- Sengupta, S., & Krishan, V. 2001, ApJ, 561, L123 [NASA ADS] [CrossRef]
- Sengupta, S., & Krishan, V. 2003, ApJ, 585, L155 [NASA ADS] [CrossRef]
- Sengupta, S., & Kwok, S. 2005, ApJ, 625, 996 [NASA ADS] [CrossRef]
- Tsuji, T., & Nakajima, T. 2003, ApJ, 585, L151 [NASA ADS] [CrossRef]
- Tsuji, T., Ohnaka, K., Aoki, W., & Nakajima, T. 1996, A&A, 308, L29 [NASA ADS]
- Tsuji, T., Nakajima, T., & Yanagisawa, K. 2004, ApJ, 607, 511 [NASA ADS] [CrossRef]
- van de Hulst, H. C. 1957, Light Scattering by Small Particles (New York: Willey)
- Woitke, P., & Helling, Ch. 2003, A&A, 399, 297 [NASA ADS] [EDP Sciences] [CrossRef]
- Woitke, P., & Helling, Ch. 2004, A&A, 414, 335 [NASA ADS] [EDP Sciences] [CrossRef]
- Zapatero Osorio, M. R., Caballero, J. A., & Béjar, V. J. S. 2005, ApJ, 621, 445 [NASA ADS] [CrossRef]
All Tables
Table 1: Target list.
Table 2: Polarization measurements.
Table 3: Model fit.
Table 4: IRAC photometry of 2MASS J17312974+2721233.
All Figures
|
|
Figure 1: Best model fit of the observed data. The solid lines represent the model with the polytropic index n=1.0 and dashed lines represent that with n=1.5. For other parameters see Table 3. |
| Open with DEXTER | |
| In the text | |
|
|
Figure 2:
Spectral energy distribution of 2MASS J17312974+2721233 (dots). V-band
photometry from the LSPM-North proper-motion catalog of nearby stars
(Lépine et al. 2005). J, H
and |
| Open with DEXTER | |
| In the text | |
Copyright ESO 2009
Current usage metrics show cumulative count of Article Views (full-text article views including HTML views, PDF and ePub downloads, according to the available data) and Abstracts Views on Vision4Press platform.
Data correspond to usage on the plateform after 2015. The current usage metrics is available 48-96 hours after online publication and is updated daily on week days.
Initial download of the metrics may take a while.