| Issue |
A&A
Volume 508, Number 3, December IV 2009
|
|
|---|---|---|
| Page(s) | 1275 - 1278 | |
| Section | Extragalactic astronomy | |
| DOI | https://doi.org/10.1051/0004-6361/200810811 | |
| Published online | 27 October 2009 | |
A&A 508, 1275-1278 (2009)
Suzaku observation of IGR J16318-4848
L. Barragán1 - J. Wilms1 - K. Pottschmidt2,3 - M. A. Nowak4 - I. Kreykenbohm1 - R. Walter5 - J. A. Tomsick6
1 - Dr. Karl Remeis-Sternwarte and Erlangen Centre for Astroparticle
Physics, Friedrich-Alexander-Universität Erlangen-Nürnberg,
Sternwartstraße 7, 96049 Bamberg, Germany
2 - CRESST, University of Maryland Baltimore County, 1000 Hilltop
Circle, Baltimore, MD 21250, USA
3 - NASA Goddard Space Flight Center, Astrophysics Science Division,
Code 661, Greenbelt, MD 20771, USA
4 - MIT Kavli Institute for Astrophysics and Space Research, 77,
Massachusetts Avenue, 37-241, Cambridge, MA 02139, USA
5 - INTEGRAL Science Data Centre, Geneva Observatory, University of
Geneva, Chemin d'Écogia 16, 1290 Versoix, Switzerland
6 - Space Sciences Laboratory, University of California Berkeley, 7
Gauss
Way, Berkeley, CA 94720-7450, USA
Received 15 August 2008 / Accepted 19 October 2009
Abstract
We report on the first Suzaku observation of
IGR J16318-4848, the most extreme example of a new group of
highly absorbed X-ray binaries that have recently been discovered by
the International Gamma-Ray Astrophysics Laboratory (INTEGRAL).
The Suzaku observation was carried out between 2006
August 14 and 17, with a net exposure time of
97 ks.
The average X-ray spectrum of the source can be well described
(
![]() )
with a continuum model typical for neutron stars i.e., a strongly
absorbed power law continuum with a photon index of 0.676(42) and an
exponential cutoff at 20.5(6) keV. The absorbing column is
)
with a continuum model typical for neutron stars i.e., a strongly
absorbed power law continuum with a photon index of 0.676(42) and an
exponential cutoff at 20.5(6) keV. The absorbing column is
![]() .
Consistent with earlier work, strong fluorescent emission lines of Fe
.
Consistent with earlier work, strong fluorescent emission lines of Fe
![]() ,
Fe
,
Fe
![]() ,
and Ni
,
and Ni ![]() are observed. Despite the large
are observed. Despite the large ![]() ,
no Compton shoulder is seen in the lines, arguing for a non-spherical
and inhomogeneous absorber.
,
no Compton shoulder is seen in the lines, arguing for a non-spherical
and inhomogeneous absorber.
Seen at an average 5-60 keV absorbed flux of
![]() ,
the source exhibits significant variability on timescales
of hours.
,
the source exhibits significant variability on timescales
of hours.
Key words: stars: individual IGR J16318-4848 - binaries: general - X-rays: binaries
1 Introduction
IGR J16318-4848 was detected on 2003 Jan. 29 during
a
scan of the Galactic plane by the IBIS/ISGRI soft gamma-ray detector
onboard the International Gamma Ray Laboratory
(INTEGRAL, Courvoisier et al. 2003;
Walter
et al. 2003). The source
was the first and most extreme example of a number of highly absorbed
Galactic X-ray binaries discovered with INTEGRAL.
Due to the
strong absorption, which can exceed an equivalent hydrogen column of
![]() ,
these sources are extremely faint in the
soft X-rays and had not been detected by earlier missions
(Kuulkers
2005; Rodriguez
et al. 2003; Patel et al. 2004).
,
these sources are extremely faint in the
soft X-rays and had not been detected by earlier missions
(Kuulkers
2005; Rodriguez
et al. 2003; Patel et al. 2004).
Right after its discovery, a re-analysis of archival ASCA
data by Murakami et al.
(2003) revealed a highly photoabsorbed source
(
![]() )
coincident with
the position given by INTEGRAL. The data also
suggested an
iron emission line at 6.4 keV. These results were confirmed by
various subsequent studies
(e.g. Revnivtsev
et al. 2003; Schartel et al. 2003;
de Plaa
et al. 2003; Walter et al. 2003).
Matt & Guainazzi (2003)
detected intense Fe K
)
coincident with
the position given by INTEGRAL. The data also
suggested an
iron emission line at 6.4 keV. These results were confirmed by
various subsequent studies
(e.g. Revnivtsev
et al. 2003; Schartel et al. 2003;
de Plaa
et al. 2003; Walter et al. 2003).
Matt & Guainazzi (2003)
detected intense Fe K![]() ,
Fe K
,
Fe K![]() ,
and Ni
,
and Ni
![]() emission lines in
the spectrum. Based on the
interstellar absorption toward the system, which is two orders of
magnitude lower than the measured
emission lines in
the spectrum. Based on the
interstellar absorption toward the system, which is two orders of
magnitude lower than the measured ![]() ,
Revnivtsev (2003), Filliatre & Chaty (2004),
and
Lutovinov et al. (2005)
also suggested that much of the X-ray absorption
is intrinsic to the compact object.
,
Revnivtsev (2003), Filliatre & Chaty (2004),
and
Lutovinov et al. (2005)
also suggested that much of the X-ray absorption
is intrinsic to the compact object.
In an optical study of the system, Filliatre & Chaty (2004) proposed that IGR J16318-4848 is a High Mass X-ray Binary (HMXB) with an sgB[e] star as the mass donor surrounded by a dense and absorbing circumstellar material (see also Moon et al. 2007; Revnivtsev 2003). This dense stellar wind results in significant photoabsorption within the binary system. Based on the optical data, Filliatre & Chaty (2004) suggest a distance between 0.9 and 6.2 kpc for the system. A likely location for the source is in the Norma-Cygnus arm (Revnivtsev 2003; Walter et al. 2004), which would place it at a distance of 4.8 kpc (Filliatre & Chaty 2004).
In this Paper, we describe the results of follow-up observations of IGR J16318-4848 obtained with the Suzaku satellite, the instruments on which are uniquely suited to study Compton-thick absorption. In Sect. 2 we describe the data reduction. Section 3 is devoted to a presentation of the results of the spectral and temporal analysis. We discuss our results in Sect. 4.
2 Data analysis
We observed IGR J16318-4848 with Suzaku
from 2006
August 14 until 2006 August 17 for a total net
exposure of 97 ks
(Suzaku sequence number 401094010). We used the
standard
procedures to reduce the data from the X-Ray Imaging Spectrometer
(XIS, Koyama et al. 2007)
and the Hard X-Ray Detector (HXD, Takahashi
et al. 2007). For the XIS in particular we
barycentered the
data with aebarycen (version 2008-03-03) and then
extracted
source events, images, spectra, and lightcurves with
XSELECT v2.4. A
circular source extraction region of 3
![]() 23 radius was applied.
The background spectrum was extracted from a circular region having
the same area as the source extraction region. This process was done
for every XIS. Response matrices and ancillary response files were
generated using XISRMFGEN (version 2009-02-28) and XISSIMARFGEN
(version 2009-02-28), taking into account the hydrocarbon
contamination on the optical blocking filter (Ishisaki
et al. 2007). As
recommended by the Suzaku team, the spectra of the
three
front illuminated CCDs (XIS0, XIS2, and XIS3) were then combined with
addascaspec (version 1.30). Although the
XIS1 was operational
when the observation was made, it is not used in the present study due
to cross calibration issues.
23 radius was applied.
The background spectrum was extracted from a circular region having
the same area as the source extraction region. This process was done
for every XIS. Response matrices and ancillary response files were
generated using XISRMFGEN (version 2009-02-28) and XISSIMARFGEN
(version 2009-02-28), taking into account the hydrocarbon
contamination on the optical blocking filter (Ishisaki
et al. 2007). As
recommended by the Suzaku team, the spectra of the
three
front illuminated CCDs (XIS0, XIS2, and XIS3) were then combined with
addascaspec (version 1.30). Although the
XIS1 was operational
when the observation was made, it is not used in the present study due
to cross calibration issues.
To extract the HXD PIN spectrum, we again followed the
standard
procedure of barycentric correction, gti-filtered spectrum extraction
with XSELECT and dead-time correction with HXDDTCOR
(version 1.50).
The cosmic background was created with a model provided by the
Suzaku team using a flat response
(ae_hxd_pinflate2_20080129.rsp) and then combined with the internal
background model provided by the Suzaku team
(ae401094010_hxd_pinbgd.evt). The resulting combination is used for
the background subtraction. The response matrix used for the analysis
is the one proposed by the Suzaku team for the time
of our
observation, ae_hxd_pinxinome2_20080129.rsp. The count rates of
IGR J16318-4848 are
![]() for
the
combined XISs and
for
the
combined XISs and
![]() for
the HXD PIN diodes.
for
the HXD PIN diodes.
For the analysis with XSPEC (v.11.3.2ag; Arnaud 1996) we rebinned the spectrum to a minimum of 250 and 200 counts per bin for the XIS and the PIN, respectively. The uncertainties for all fits are quoted at the 90% level for a single parameter of interest. In order to account for flux cross calibration issues among the instruments, in all spectral fits a multiplicative constant was introduced.
3 Suzaku observation of IGR J16318-4848
3.1 Spectral analysis
|
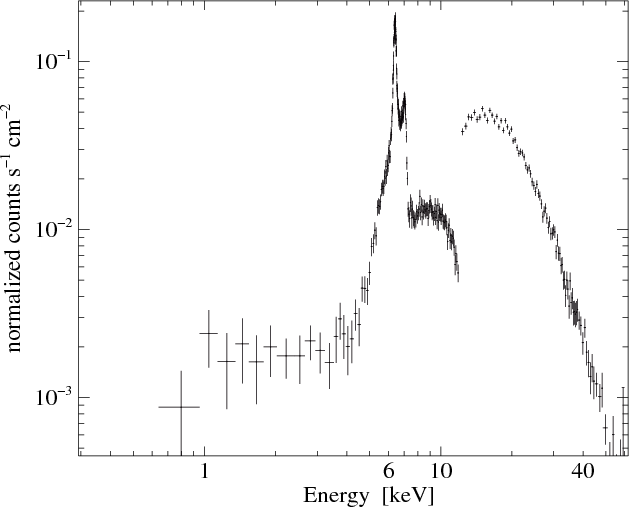
Figure 1: Spectrum of IGR J16318-4848 in the range 0.3-60 keV. |
| Open with DEXTER | |
Although we detected a soft excess in the spectrum below 5 keV
(Fig. 1),
we did not include it in the modeling because
it is most probably due to a serendipitous source at a distance
![]()
![]() from
IGR J16318-4848 (Matt & Guainazzi 2003; Ibarra
et al. 2007). The
presence of this source could not be confirmed here because of the
lower angular resolution of the XISs compared to XMM-Newton,
even when using an optimal attitude solution for Suzaku
by
measuring the attitude directly through following the location of
IGR J16318-4848 on the XIS chips.
from
IGR J16318-4848 (Matt & Guainazzi 2003; Ibarra
et al. 2007). The
presence of this source could not be confirmed here because of the
lower angular resolution of the XISs compared to XMM-Newton,
even when using an optimal attitude solution for Suzaku
by
measuring the attitude directly through following the location of
IGR J16318-4848 on the XIS chips.
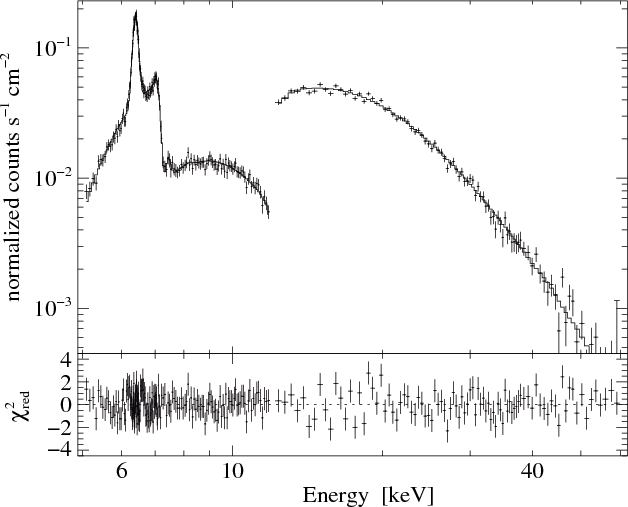
In order to describe the 5-60 keV broad-band spectrum
of the source
we fit the spectral continuum with an absorbed cutoff powerlaw, taking
also into account non-relativistic Compton scattering. Photoabsorption
was modeled with a revised version of the TBabs model
(Wilms
et al. 2006,2000), using the interstellar
medium abundances
summarized by Wilms et al.
(2000). This model describes the continuum
extremely well (Fig. 3).
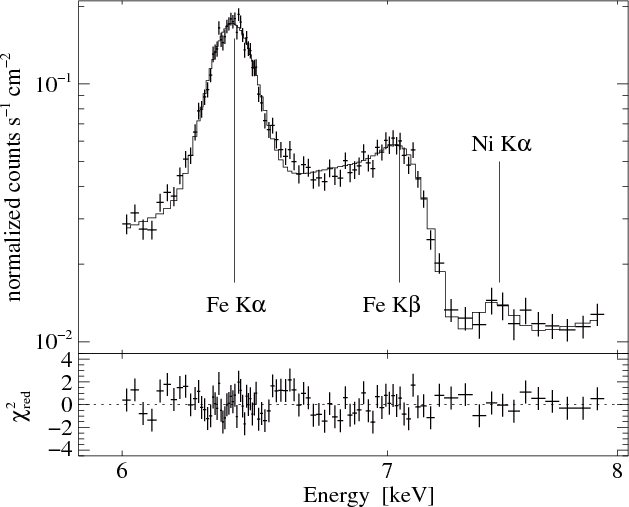
In addition to the continuum,
strong fluorescent emission lines from iron (Fe K![]() and
K
and
K![]() )
and nickel (Ni K
)
and nickel (Ni K![]() )
are introduced in the model
(within the absorber) to obtain a satisfactory description of the data
(Fig. 4).
We model these lines with Gaussians fixed to
a width of
)
are introduced in the model
(within the absorber) to obtain a satisfactory description of the data
(Fig. 4).
We model these lines with Gaussians fixed to
a width of ![]() eV
(i.e., we use lines narrow compared to the
resolution of the XIS). The Fe K
eV
(i.e., we use lines narrow compared to the
resolution of the XIS). The Fe K![]() line is modeled as
the
superposition of the Fe K
line is modeled as
the
superposition of the Fe K![]() and Fe K
and Fe K![]() lines,
with the
relative line normalizations held at the 2:1-ratio of the flourescence
yields of these lines and the Fe K
lines,
with the
relative line normalizations held at the 2:1-ratio of the flourescence
yields of these lines and the Fe K![]() line constrained to
be
13.2 eV below the Fe K
line constrained to
be
13.2 eV below the Fe K![]() line. We also modeled the Fe K
line. We also modeled the Fe K![]() line as the
combination of the Fe K
line as the
combination of the Fe K![]() and Fe K
and Fe K![]() lines
(the Fe K
lines
(the Fe K![]() energy being fixed to 16 eV below
Fe K
energy being fixed to 16 eV below
Fe K![]() ,
and its intensity to half the one of Fe K
,
and its intensity to half the one of Fe K![]() ).
This physically correct approach is to be preferred to modeling the
Fe K
).
This physically correct approach is to be preferred to modeling the
Fe K![]() and Fe K
and Fe K![]() lines
with a single Gaussian. We introduced
a multiplicative constant c to normalize the
HXD flux with
respect to the XIS one.
lines
with a single Gaussian. We introduced
a multiplicative constant c to normalize the
HXD flux with
respect to the XIS one.
The resulting model (Table 1) provides a
good
description of the data (
![]() ).
With
).
With
![]() the
column density is very high, as is to be expected for this kind of
source, and is in agreement with the previous observations
(e.g., Lutovinov
et al. 2005; Ibarra et al. 2007; Walter
et al. 2006). In contrast, the
photon index,
the
column density is very high, as is to be expected for this kind of
source, and is in agreement with the previous observations
(e.g., Lutovinov
et al. 2005; Ibarra et al. 2007; Walter
et al. 2006). In contrast, the
photon index,
![]() ,
is considerably harder
than in several earlier analyses (e.g., Walter
et al. 2004:
,
is considerably harder
than in several earlier analyses (e.g., Walter
et al. 2004:
![]() or Ibarra
et al. 2007:
or Ibarra
et al. 2007:
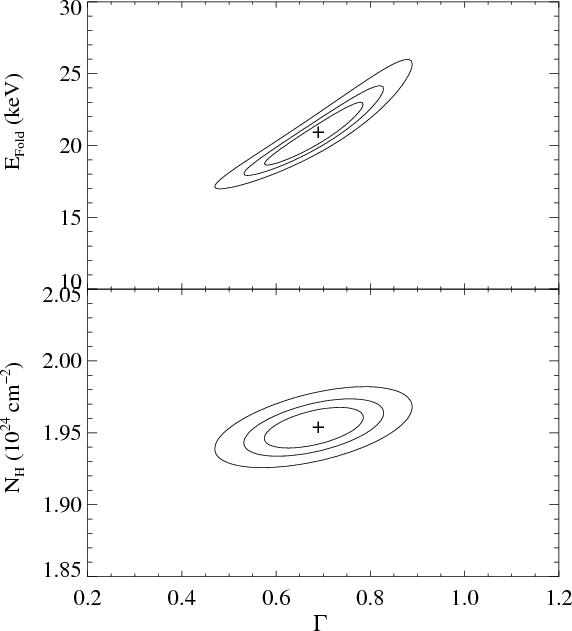
![]() -1.46). As shown by
the contour plots in Fig. 2, our
broad-band data allow
us to determine
-1.46). As shown by
the contour plots in Fig. 2, our
broad-band data allow
us to determine ![]() to a high precision. The photon index is not
correlated with
to a high precision. The photon index is not
correlated with ![]() ,
and there is only a slight dependency
between
,
and there is only a slight dependency
between ![]() and
and ![]() ,
which is much smaller than the
difference between the photon index found here and that found in
earlier observations.
,
which is much smaller than the
difference between the photon index found here and that found in
earlier observations.
Despite the large ![]() ,
which corresponds to a moderately
high Thomson optical depth of
,
which corresponds to a moderately
high Thomson optical depth of
![]() ,
no Compton
shoulder is apparent in the spectrum and all lines are well modeled
with narrow Gaussians (Fig. 4). In order to
determine
an upper limit for the flux in a putative Compton shoulder, following
Matt & Guainazzi (2003)
we model this feature by adding a moderately broad
(
,
no Compton
shoulder is apparent in the spectrum and all lines are well modeled
with narrow Gaussians (Fig. 4). In order to
determine
an upper limit for the flux in a putative Compton shoulder, following
Matt & Guainazzi (2003)
we model this feature by adding a moderately broad
(
![]() )
Gaussian at 6.3 keV to the model. The 90%
upper limit for the flux in the Compton shoulder is
)
Gaussian at 6.3 keV to the model. The 90%
upper limit for the flux in the Compton shoulder is
![]() ,
corresponding to a 90% upper limit of
34.6 eV for the equivalent width.
,
corresponding to a 90% upper limit of
34.6 eV for the equivalent width.
|
Figure 2: Confidence contours (68, 90, and 99 percent) of the column density and the folding energy as a function of the photon index. The cross mark indicates the best fit value. |
| Open with DEXTER | |
|
Figure 3: Broad band spectrum of IGR J16318-4848 together with the best fit model and its residuals. |
| Open with DEXTER | |
|
Figure 4:
Close-up of the Fe K |
| Open with DEXTER | |
Table 1: Best fit parameters obtained from modeling the joint XIS and HXD data in the 5-60 keV band.
|
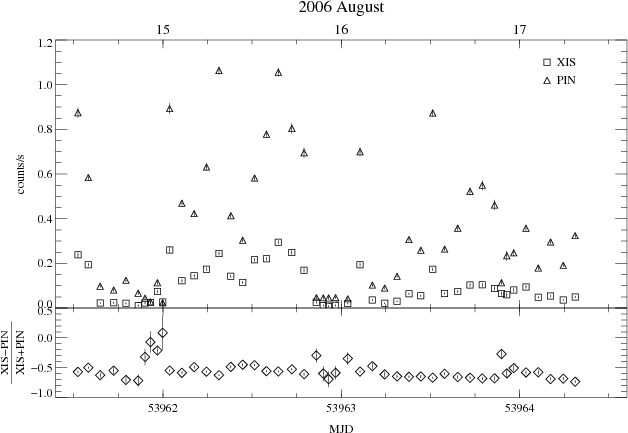
Figure 5: Top: lightcurve for the XIS (5-12 keV, squares) and the HXD PIN (12-60 keV, triangles). Bottom: hardness ratio as a function of time. |
| Open with DEXTER | |
Data from the three XIS and the HXD-PIN were used to obtain
lightcurves in the 5-12 keV and in the
12-60 keV band. To
study the evolution of the spectral hardness of the source, count
rates were determined at the resolution of the good time intervals of
the XIS0 detector, which cover approximately one Suzaku-orbit
each (![]() 90 min).
Figure 5
shows the
significant variability of IGR J16318-4848 on this resolution.
Throughout the observation, for XIS count rates above
0.1
90 min).
Figure 5
shows the
significant variability of IGR J16318-4848 on this resolution.
Throughout the observation, for XIS count rates above
0.1
![]() the
source shows no clear
dependence of the hardness ratio from the source count rate,
indicating that only slight changes in the spectral shape occur. At
even
lower count rates, the X-ray spectrum softens, but the signal to
noise in the X-ray spectrum is too low to allow us to quantify these
changes further.
the
source shows no clear
dependence of the hardness ratio from the source count rate,
indicating that only slight changes in the spectral shape occur. At
even
lower count rates, the X-ray spectrum softens, but the signal to
noise in the X-ray spectrum is too low to allow us to quantify these
changes further.
4 Summary and conclusions
We have presented first results from the analysis of a long Suzaku observation of IGR J16318-4848, the most extreme of the strongly absorbed ``INTEGRAL-sources''. As found in previous studies, the average spectrum of the source is consistent with a strongly absorbed exponentially cutoff power-law and strong flourescent line emission. In contrast to earlier studies, the power-law photon index was found to be considerably harder than before (The soft excess below 2 keV is probably due to a
serendipitous source
near IGR J16318-4848 (Ibarra
et al. 2007). The considerable
variability of the source can be explained as being due to variations
in ![]() .
.
As pointed out by Walter et al. (2004), the general spectral characteristics derived from the fit are typical for accreting neutron stars (e.g., Naik & Paul 2004; Hill et al. 2008). Note that this result does not mean that the neutron star nature of the compact object in IGR J16318-4848 is confirmed, which would require e.g. the detection of pulsations. A search for pulsations in the range between 1 s and 10 ks was negative, while shorter period pulsations are probably not detectable due to the smearing of pulsations by Compton scattering (Kuster et al. 2005).
Turning to the emission lines, we note that our fit requires a
slight
overabundance of iron with respect to the ISM values of
Wilms et al. (2000),
as one would expect for an evolved star.
Furthermore, the flux ratio of Fe and Ni also points
towards a Ni overabundance by a factor of ![]() 2.5 with
respect to Fe.
2.5 with
respect to Fe.
The ratio of the Fe K![]() and Fe K
and Fe K![]() line fluxes is given by
line fluxes is given by
![]() .
This flux ratio is formally slightly smaller than
that found in theoretical calculations for neutral gas phase Fe atoms
of Jacobs & Rozsnyai
(1986,
.
This flux ratio is formally slightly smaller than
that found in theoretical calculations for neutral gas phase Fe atoms
of Jacobs & Rozsnyai
(1986, ![]() ),
Kaastra & Mewe
(1993,
),
Kaastra & Mewe
(1993, ![]() ), or
Jankowski & Polasik
(1989,
), or
Jankowski & Polasik
(1989, ![]() ), and it is
also smaller than
the value of
), and it is
also smaller than
the value of ![]() found in experimental measurements performed in
solid Fe (e.g.,
found in experimental measurements performed in
solid Fe (e.g., ![]() found by Raj et al. 1998
and
Pawowski et al. 2002).
The difference between the different
theoretical calculations is due to certain approximations made in
solving the structure of the excited Fe ion after the K-shell
photoabsorption, while for the latter measurements
found by Raj et al. 1998
and
Pawowski et al. 2002).
The difference between the different
theoretical calculations is due to certain approximations made in
solving the structure of the excited Fe ion after the K-shell
photoabsorption, while for the latter measurements ![]() is affected
by internal absorption in the Fe crystal used to make the measurements
as well as by the dependence of the emission probability of the
photoelectron on orientation. The systematic uncertainty of
is affected
by internal absorption in the Fe crystal used to make the measurements
as well as by the dependence of the emission probability of the
photoelectron on orientation. The systematic uncertainty of ![]() in
theory and measurements is therefore probably as large as 0.02, which
would make our measurement consistent with neutral Fe. We note that
our value for
in
theory and measurements is therefore probably as large as 0.02, which
would make our measurement consistent with neutral Fe. We note that
our value for ![]() is significantly smaller than the
is significantly smaller than the
![]() found in the XMM-Newton EPIC-pn
analysis of Matt & Guainazzi
(2003, but see Walter
et al. 2003). These
authors speculated that this higher
found in the XMM-Newton EPIC-pn
analysis of Matt & Guainazzi
(2003, but see Walter
et al. 2003). These
authors speculated that this higher ![]() could be due to the
absorbing wind being moderately ionized. Given that the line ratio
(and also the line energy) found in the higher resolution
Suzaku data are consistent with neutral Fe,
we might be
seeing a change in the ionization structure of the wind between the
XMM-Newton and the Suzaku
observations.
Alternatively, the larger value for
could be due to the
absorbing wind being moderately ionized. Given that the line ratio
(and also the line energy) found in the higher resolution
Suzaku data are consistent with neutral Fe,
we might be
seeing a change in the ionization structure of the wind between the
XMM-Newton and the Suzaku
observations.
Alternatively, the larger value for ![]() may be due to systematic
effects in the XMM-Newton analysis: with Suzaku,
the
Fe K
may be due to systematic
effects in the XMM-Newton analysis: with Suzaku,
the
Fe K![]() line
and the Fe K edge are easier to separate and the
spectral continuum is better constrained in the present analysis than
with XMM-Newton, since spectral information is
available
above 9 keV.
line
and the Fe K edge are easier to separate and the
spectral continuum is better constrained in the present analysis than
with XMM-Newton, since spectral information is
available
above 9 keV.
Finally, despite the large column of the source, no
significant
evidence for the presence of a Compton shoulder is found in the
Suzaku spectrum, which is consistent with previous
results. This result is in contrast to the expectation for absorption
inan
homogeneous medium: as shown by Matt
(2002), with this assumption the equivalent width of the
Fe K![]() line
at the
line
at the ![]() of IGR J16318-484 should be much less than that
observed here, and a strong Compton shoulder should be present, in
line e.g. with the Compton shoulder observed by Watanabe et al. (2003)
in GX 301-2. As pointed out by e.g.
Walter
et al. (2006, 2003) and Ibarra
et al. (2007),
the
non-existence of the Compton shoulder could be due to a strongly
inhomogeneous absorbing medium. Since the strength of the shoulder is
strongly dependent on the assumed accretion geometry, further work
using self-consistent modeling of the absorption, fluorescent line
formation and Compton shoulder formation is required. We will present
such self-consistent analyses, as well as a more detailed study of the
variability of the source, in a future publication.
of IGR J16318-484 should be much less than that
observed here, and a strong Compton shoulder should be present, in
line e.g. with the Compton shoulder observed by Watanabe et al. (2003)
in GX 301-2. As pointed out by e.g.
Walter
et al. (2006, 2003) and Ibarra
et al. (2007),
the
non-existence of the Compton shoulder could be due to a strongly
inhomogeneous absorbing medium. Since the strength of the shoulder is
strongly dependent on the assumed accretion geometry, further work
using self-consistent modeling of the absorption, fluorescent line
formation and Compton shoulder formation is required. We will present
such self-consistent analyses, as well as a more detailed study of the
variability of the source, in a future publication.
We want acknowledge the anonymous referee for his/her comments that allowed us to improve this paper. This work was partially funded by the Bundesministerium für Wirtschaft und Technologie through the Deutsches Zentrum für Luft- und Raumfahrt contract 50 OR 0701 and by National Aeronautics and Space Administration grants NNX07AE65G and NNX06AI43G. This research has made use of data obtained from the Suzaku satellite, a collaborative mission between the space agencies of Japan (JAXA) and the USA (NASA).
References
- Anders, E., & Grevesse, N. 1989, GeCoA, 53, 197 [NASA ADS]
- Arnaud, K. A. 1996, in Astronomical Data Analysis Software and Systems V, ed. G. H. Jacoby, & J. Barnes, ASP Conf. Ser., 101, 17
- Courvoisier, T. J.-L., Walter, R., Rodriguez, J., Bouchet, L., & Lutovinov, A. A. 2003, IAUC, 8063
- de Plaa, J., den Hartog, P. R., Kaastra, J. S., et al. 2003, ATEL, 119
- Filliatre, P., & Chaty, S. 2004, ApJ, 616, 469 [NASA ADS] [CrossRef]
- Hill, A. B., Dean, A. J., Landi, R., et al. 2008, MNRAS, 179
- Ibarra, A., Matt, G., Guainazzi, M., et al. 2007, A&A, 465, 501 [NASA ADS] [EDP Sciences] [CrossRef]
- Ishisaki, Y., Maeda, Y., Fujimoto, R., et al. 2007, PASJ, 59, 113 [NASA ADS]
- Jacobs, V. L., & Rozsnyai, B. F. 1986, Phys. Rev. A, 34, 216 [NASA ADS] [CrossRef]
- Jankowski, K., & Polasik, M. 1989, J. Phys. B, 22, 2369 [NASA ADS] [CrossRef]
- Kaastra, J. S., & Mewe, R. 1993, A&AS, 97, 443 [NASA ADS]
- Koyama, K., Tsunemi, H., Dotani, T., et al. 2007, PASJ, 59, 23
- Kuster, M., Wilms, J., Staubert, R., et al. 2005, A&A, 443, 753 [NASA ADS] [EDP Sciences] [CrossRef]
- Kuulkers, E. 2005, in Interacting Binaries: Accretion, Evolution, and Outcomes, ed. L. Burderi, L. A. Antonelli, & F. D'Antona, AIP Conf. Ser., 797, 402
- Lutovinov, A., Revnivtsev, M., Gilfanov, M., et al. 2005, A&A, 444, 821 [NASA ADS] [EDP Sciences] [CrossRef]
- Matt, G. 2002, MNRAS, 337, 147 [NASA ADS] [CrossRef]
- Matt, G., & Guainazzi, M. 2003, MNRAS, 341, L13 [NASA ADS] [CrossRef]
- Moon, D.-S., Kaplan, D. L., Reach, W. T., et al. 2007, ApJ, 671, L53 [NASA ADS] [CrossRef]
- Murakami, H., Dotani, T., & Wijnands, R. 2003, IAUC, 8070
- Naik, S., & Paul, B. 2004, A&A, 418, 655 [NASA ADS] [EDP Sciences] [CrossRef]
- NASA & JAXA 2008, The Suzaku Data Reduction Guide, version 2, available online at http://heasarc.gsfc.nasa.gov/docs/suzaku/analysis/abc/abc.html (version retrieved 2008 June 25)
- Patel, S. K., Kouveliotou, C., Tennant, A., et al. 2004, ApJ, 602, L45 [NASA ADS] [CrossRef]
- Pawowski, F., Polasik, M., Raj, S., Padhi, H. C., & Basa, D. K. 2002, Nucl. Inst. and Meth. in Phys. Res. B, 195, 367 [NASA ADS] [CrossRef]
- Raj, S., Padhi, H. C., & Polasik, M. 1998, Nucl. Inst. Meth. Phys. Res. B, 145, 485 [NASA ADS] [CrossRef]
- Revnivtsev, M. G. 2003, Astron. Lett., 29, 644 [NASA ADS] [CrossRef]
- Revnivtsev, M. G., Sazonov, S. Y., Gilfanov, M. R., & Sunyaev, R. A. 2003, Astron. Lett., 29, 587 [NASA ADS] [CrossRef]
- Rodriguez, J., Tomsick, J. A., Foschini, L., et al. 2003, A&A, 407, L41 [NASA ADS] [EDP Sciences] [CrossRef]
- Schartel, N., Ehle, M., Breitfellner, M., et al. 2003, IAU Circ., 8072
- Takahashi, T., Abe, K., Endo, M., et al. 2007, PASJ, 59, 35
- Walter, R., Rodriguez, J., Foschini, L., et al. 2003, A&A, 411, L427 [NASA ADS] [EDP Sciences] [CrossRef]
- Walter, R., Courvoisier, T. J.-L., Foschini, L., et al. 2004, in 5th INTEGRAL Workshop on the INTEGRAL Universe, ed. V. Schoenfelder, G. Lichti, & C. Winkler, ESA SP-552 (Noordwijk: ESA Publications Division), 417
- Walter, R., Zurita Heras, J., Bassani, L., et al. 2006, A&A, 453, 133 [NASA ADS] [EDP Sciences] [CrossRef]
- Watanabe, S., Sako, M., Ishida, M., et al. 2003, ApJ, 597, L37 [NASA ADS] [CrossRef]
- Wilms, J., Allen, A., & McCray, R. 2000, ApJ, 542, 914 [NASA ADS] [CrossRef]
- Wilms, J., Juett, A., Schulz, N., & Nowak, M. 2006, BAAS 38, 376
All Tables
Table 1: Best fit parameters obtained from modeling the joint XIS and HXD data in the 5-60 keV band.
All Figures
|
|
Figure 1: Spectrum of IGR J16318-4848 in the range 0.3-60 keV. |
| Open with DEXTER | |
| In the text | |
|
|
Figure 2: Confidence contours (68, 90, and 99 percent) of the column density and the folding energy as a function of the photon index. The cross mark indicates the best fit value. |
| Open with DEXTER | |
| In the text | |
|
|
Figure 3: Broad band spectrum of IGR J16318-4848 together with the best fit model and its residuals. |
| Open with DEXTER | |
| In the text | |
|
|
Figure 4:
Close-up of the Fe K |
| Open with DEXTER | |
| In the text | |
|
|
Figure 5: Top: lightcurve for the XIS (5-12 keV, squares) and the HXD PIN (12-60 keV, triangles). Bottom: hardness ratio as a function of time. |
| Open with DEXTER | |
| In the text | |
Copyright ESO 2009
Current usage metrics show cumulative count of Article Views (full-text article views including HTML views, PDF and ePub downloads, according to the available data) and Abstracts Views on Vision4Press platform.
Data correspond to usage on the plateform after 2015. The current usage metrics is available 48-96 hours after online publication and is updated daily on week days.
Initial download of the metrics may take a while.