| Issue |
A&A
Volume 508, Number 2, December III 2009
|
|
|---|---|---|
| Page(s) | 717 - 724 | |
| Section | Interstellar and circumstellar matter | |
| DOI | https://doi.org/10.1051/0004-6361/200912890 | |
| Published online | 15 October 2009 | |
A&A 508, 717-724 (2009)
Chandra observation of Cepheus A: the diffuse emission of HH 168 resolved
P. C. Schneider - H. M. Günther - J. H. M. M. Schmitt
Hamburger Sternwarte, Gojenbergsweg 112, 21029 Hamburg, Germany
Received 14 July 2009 / Accepted 25 August 2009
Abstract
X-ray emission from massive stellar outflows has been detected in several cases. We present a Chandra
observation of HH 168 and show that the soft X-ray emission from a
plasma of 0.55 keV within HH 168 is diffuse. The X-ray
emission is observed on two different scales: Three individual, yet
extended, regions are embedded within a complex of low X-ray surface
brightness. Compared to the bow shock the emission is displaced against
the outflow direction. We show that there is no significant
contribution from young stellar objects (YSOs) and discuss several
shock scenarios that can produce the observed signatures. We establish
that the X-ray emission of HH 168 is excited by internal shocks in
contrast to simple models, which expect the bow shock to be the most
X-ray luminous.
Key words: stars: winds, outflows - X-rays: ISM - Herbig-Haro objects - ISM: jets and outflows - ISM: individual objects: HH 168
1 Introduction
Star formation is intimately linked to accretion and outflow phenomena. Early in the formation process, the collapsing proto-star is deeply embedded and therefore invisible, yet, powerful outflows emerge from these systems. At a later stage, the accretion proceeds from a disk. For low-mass stars, the magnetically-funneled infall model explains many observed phenomena successfully, but, even in their case, the jet and wind driving mechanism remains elusive. Current theories expect mass loss to be driven by magneto-centrifugal disk winds, possibly with a stellar contribution. The physical mechanism, which accelerates and collimates the outflow also remains elusive. Jets have been observed at all stages of star formation over a wide mass range in different wavelength regions. HH 2 (Pravdo et al. 2001) and HH 154 (Favata et al. 2006,2002; Bally et al. 2003) were the first massive, large-scale outflows discovered in X-rays. The latter object has already been observed twice, so that the proper motion of its X-ray emitting regions could be tracked. The proper motion of 500 km s-1 can explain the observed temperatures in terms of simple shock models of a thin gas ramming into the ambient medium. Examples of further evolved objects are the low-mass star DG Tau (Schneider & Schmitt 2008; Güdel et al. 2008b; Günther et al. 2009), where the X-ray emission from the jet is confined to the inner region of a few hundred AU and the intermediate mass Herbig Ae/Be star HD 163296 (Günther & Schmitt 2009; Swartz et al. 2005). Because of the low surface brightness of these jets and a lack of nearby young intermediate and high-mass stars, X-rays from their outflows have only been detected in very few cases.Most models of high-energy emission in outflowing material adopt some type of shock. The interface between the outflowing material and the ambient medium seems to be a plausible heating source but evidence of additional X-rays produced close to the star is increasing. Thus, a more complex scenario might be required to explain the observed phenomena. Internal working surfaces within the outflow might be responsible for the heating, but they require rapidly moving components within the flow so that the velocity difference still provides enough energy to produce X-rays.
In the case of DG Tau, such a high velocity component has not been detected in UV, optical or IR observations. However, when compared to the outflow's total mass-loss this speculative high velocity component would constitute only a very small fraction of the total mass-loss and energy and, therefore, might have escaped detection (Schneider & Schmitt 2008; Günther et al. 2009).
This paper deals with the Cep A West region, where the outflow HH 168 is located. The central region of the complex, which presumably contains the jet driving source, will be analysed in a forthcoming article (Schneider et al. 2009). In the next section, we will provide a brief overview of the Cep A region and in the subsequent two sections the observation and results are presented. We then discuss the properties of the emitting plasma before we investigate possible scenarios explaining the observed X-ray emission.
2 The Cepheus A high-mass star-forming region
Cepheus A is the second nearest high-mass star-forming region at a distance of ![]() 730 pc (Crawford & Barnes 1970; Johnson 1957, see Fig. 1
for an overview).
Three Herbig-Haro objects (HH 168, HH 169, and
HH 174) are located around the center of Cep A,
where several distinct radio sources have been found (named HW 1-9; Hughes & Wouterloot 1984, HW 8 and HW 9 were detected by subsequent observations).
Because of the strong absorption towards the center of Cep A (
730 pc (Crawford & Barnes 1970; Johnson 1957, see Fig. 1
for an overview).
Three Herbig-Haro objects (HH 168, HH 169, and
HH 174) are located around the center of Cep A,
where several distinct radio sources have been found (named HW 1-9; Hughes & Wouterloot 1984, HW 8 and HW 9 were detected by subsequent observations).
Because of the strong absorption towards the center of Cep A (
![]() mag) radio observations are the most suitable for imaging this region. In the IR wavelength range (e.g. 12.5
mag) radio observations are the most suitable for imaging this region. In the IR wavelength range (e.g. 12.5 ![]() m, Cunningham et al. 2009), none of the radio sources has been clearly detected and the region appears dark in Fig. 1.
m, Cunningham et al. 2009), none of the radio sources has been clearly detected and the region appears dark in Fig. 1.
For the HH 169 and HH 174 outflows, HW 2 is currently the most promising candidate for the driving source, while it is unclear which source drives the HH 168 outflow, the possibilities being HW 2 and HW 3c, as well as an isolated region of star formation located at the eastern end of HH 168 (e.g., Cunningham et al. 2009).
| Figure 1:
SDSS |
|
| Open with DEXTER | |
The Cep A region also contains multiple molecular outflows. The extent of the large-scale outflows is on the arcmin scale with typical velocities on the order of a few 10 km s-1. The multicomponent appearance of the outflow geometry can be interpreted in terms of dense condensations redirecting the outflow (Codella et al. 2003; Hiriart et al. 2004, and references therein), but multiple outflows or the evolution of a single outflow are also possible. The position angle of the northeast-southwest molecular outflow is consistent with the elongation of HW 2 at radio wavelengths. Observations of the gas dynamics, in particular of the H2 gas (Hiriart et al. 2004), show a clear velocity gradient within the western H2 structure (blueshifted at the eastern end and at approximately zero velocity at the western end).
The prominent HH object 168 is located west of the central sources of Cep A.
Its kinematic lifetime is on the order of several 1000 years.
The H![]() ,
[S II], and [O III] images observed by the Hubble Space Telescope (HST, Hartigan et al. 2000) show that in the region of HH 168 no single type of shock
can be responsible for the observed emission. In some of the bright regions, the location of H2 emission downstream of the H
,
[S II], and [O III] images observed by the Hubble Space Telescope (HST, Hartigan et al. 2000) show that in the region of HH 168 no single type of shock
can be responsible for the observed emission. In some of the bright regions, the location of H2 emission downstream of the H![]() emission is indicative of a shock-type that heats the material in front of the shock slowly without dissociating the H2 molecules.
emission is indicative of a shock-type that heats the material in front of the shock slowly without dissociating the H2 molecules.
Radio emission has also been observed from a few regions within the HH object (Hughes & Moriarty-Schieven 1990). The radio brightest one is designated HW-object (without any number) by Hartigan & Lada (1985) and is located at the eastern end of HH 168. Four (or even five) small emitting regions have been resolved within this object (Rodríguez et al. 2005), all of them being time-variable on timescales of years. Furthermore, they have large proper motions (arguing against a stellar origin) increasing from east to west from 120 km s-1 to 280 km s-1. The motion of these objects is directed westward which is approximately consistent with the direction of HH 168 itself.
Rodríguez et al. (2005) proposed that the luminosity changes of the individual sources might be caused by holes in a stream flowing around condensations and exciting the radio emission. These authors estimated an outflow speed of about 900 km s-1, which still accelerates the radio-emitting objects. The spectral indices of these radio emitting objects within the HW object differ, pointing to different production mechanisms of the radio emission although simultaneous observations, as needed for time-variable sources, have not been carried out. One object seems to bare an ultra-compact, optically thick core, while another is consistent with shocked gas emission (Garay et al. 1996).
In this region, Hartigan et al. (2000) observed nine, approximately point-like, H![]() emission components, which they related to young T Tauri stars, but Cunningham et al. (2009) found no point-like sources in their infrared images in this region, even though their sensitivity should be sufficient.
emission components, which they related to young T Tauri stars, but Cunningham et al. (2009) found no point-like sources in their infrared images in this region, even though their sensitivity should be sufficient.
Using H![]() images of HH 168, Lenzen (1988) measured the proper motions of individual knots ranging from 100 to 210 km s-1 (the HW-object in total has a velocity of 110 km s-1).
Raines et al. (2000) measured the HW object in [Fe II] 1.644
images of HH 168, Lenzen (1988) measured the proper motions of individual knots ranging from 100 to 210 km s-1 (the HW-object in total has a velocity of 110 km s-1).
Raines et al. (2000) measured the HW object in [Fe II] 1.644 ![]() m and found an object moving with a space-velocity of
m and found an object moving with a space-velocity of ![]() 850 km s-1, while the bulk of the [Fe II] emitting material moves only with 400 km s-1.
The H
850 km s-1, while the bulk of the [Fe II] emitting material moves only with 400 km s-1.
The H![]() lines of the HW object, as well as the nearby knot E, extend from zero to -400 km s-1 (Hartigan et al. 1986).
lines of the HW object, as well as the nearby knot E, extend from zero to -400 km s-1 (Hartigan et al. 1986).
Cunningham et al. (2009) proposed that the bright H2 emission within HH 168 is caused by high-velocity material encountering already decelerated material, thus forming shocks (shock speeds possibly reaching 400 km s-1). These authors further propose that the HW object is produced by two colliding winds, one producing the HH 168 object that is driven by a source close to HW 3c and the outflow of HW 2 that drives the eastern HH object.
In summary, there is no consensus about the nature of the observed objects in the literature. However, the large proper motion of some of those objects is sufficient for the production of X-rays by shocks.
The region of Cep A was observed with XMM-Newton by Pravdo & Tsuboi (2005)
for 44 ks. They detected very soft diffuse X-ray emission at the
position of HH 168 and constrained the total luminosity and
temperature of the region. Due to the limited spatial resolution, they
could not identify the precise location of the soft X-ray source(s).
The diffuse X-ray emission HH 168 shows a temperature of
![]() K absorbed by a column density of
K absorbed by a column density of
![]() cm-2.
cm-2.
3 Observation and data processing
The Cep A region was observed on 8 April 2008 for 80 ks with ACIS-I (ObsID: 8898). We used CIAO 4.1.2 to analyse the data, following closely the science threads published at the CIAO websiteFor both, detection and spectral analysis, an estimate of the
background is needed.
The background for the X-ray emission related to HH 168 was
estimated from two regions. The smaller one is a nearby ellipse of
approximately the size of HH 168 (a=30
![]() ,
b=16
,
b=16
![]() )
containing 557 events in the full energy range (30 photons in the
0.3-1.5 keV range, i.e., the range in which shock-induced X-rays
are expected). The second region is more than seven times larger (60
)
containing 557 events in the full energy range (30 photons in the
0.3-1.5 keV range, i.e., the range in which shock-induced X-rays
are expected). The second region is more than seven times larger (60
![]() radius)
and is located further off-axis to ensure that it is source-free, e.g.,
that no source is visible in the 2MASS images nor identified by any of
the CIAO source-detection algorithms in that region); it contains 261
photons in the 0.3-1.5 keV range. Both background estimates agree
approximately in terms of their predicted count levels (
radius)
and is located further off-axis to ensure that it is source-free, e.g.,
that no source is visible in the 2MASS images nor identified by any of
the CIAO source-detection algorithms in that region); it contains 261
photons in the 0.3-1.5 keV range. Both background estimates agree
approximately in terms of their predicted count levels (
![]() cts/pixel for the large area, and
cts/pixel for the large area, and
![]() cts/pixel
for the smaller one, in the 0.3-1.5 keV energy range). We use the
average of both values to determine the estimated background.
Their full range median energies coincide to within about 100 eV.
cts/pixel
for the smaller one, in the 0.3-1.5 keV energy range). We use the
average of both values to determine the estimated background.
Their full range median energies coincide to within about 100 eV.
The spectral analysis was carried using XSPEC (Arnaud 1996) assuming an absorbed optically thin plasma emission model (APEC, Smith et al. 2001). We adopt ![]() errors throughout the paper.
errors throughout the paper.
4 Results
Figure 2 shows an overview of the HH 168 region in soft X-rays. In soft X-rays, vtpdetect of the Chandra CIAO 4 tools finds an extended source in the HH 168 region. We indicate the excess region by the green ellipse in Fig. 2, which approximately coincides with the lowest X-ray contour (red). In this region, there is an excess of![\begin{figure}
\par\includegraphics[width=9cm,clip]{12890fg2.eps}
\vspace*{3mm}
\end{figure}](/articles/aa/full_html/2009/47/aa12890-09/img14.png)
|
Figure 2:
The region around HH 168 in soft X-rays (energies between
0.3 keV and 1.5 keV). Single pixels show individual photon
positions. The blue contour is the H |
| Open with DEXTER | |
Within HH 168, approximately between the HW object and
knot E, a hard, point-like X-ray source containing 10 photons is
present (J(2000) = 22:56:07.8 +62:01:51.3). It can be
characterised by a median energy of 2.6 keV and no X-ray photons
below 1.5 keV. The estimated unabsorbed X-ray luminosity is
![]() erg/s assuming a plasma temperature of 1.4 keV and an absorbing column density of
erg/s assuming a plasma temperature of 1.4 keV and an absorbing column density of
![]() cm-2. This model reproduces the median energy.
cm-2. This model reproduces the median energy.
4.1 Morphology
The soft X-ray contour (starting at four times the background level) overlaps with the HNo soft point-like source can be detected at a level above 1.1![]() .
At this detector position, one would expect that more than 95% of the
photons from a point-source (with the observed soft spectrum) are
located within a circle of radius of 1.5
.
At this detector position, one would expect that more than 95% of the
photons from a point-source (with the observed soft spectrum) are
located within a circle of radius of 1.5
![]() (in Figs. 2 and 3,
we show these circles for comparison). The area with the highest photon
density in that region contains six photons within the 1.5
(in Figs. 2 and 3,
we show these circles for comparison). The area with the highest photon
density in that region contains six photons within the 1.5
![]() radius circle and lies within the highest contour in the middle panel of Fig. 3.
radius circle and lies within the highest contour in the middle panel of Fig. 3.
Table 1: Diffuse X-ray emission in HH 168 (0.3-1.5 keV).
![\begin{figure}
\par\includegraphics[width=5.5cm,clip]{12890fg3.eps}\hspace*{1mm}...
...ps}\hspace*{1mm}
\includegraphics[width=5.5cm,clip]{12890fg5.eps}
\end{figure}](/articles/aa/full_html/2009/47/aa12890-09/img17.png)
|
Figure 3:
Zoom into selected regions. In the left panel, the HW-object, in the middle panel, the region around knot E, and in the right panel the knot F region are shown. Squares denote individual photons. The red contours are the X-ray contours from Fig. 2. H |
| Open with DEXTER | |
Three individual components with an enhanced diffuse emission are
clearly visible within the large region, and are also indicated in
Fig. 2 and shown in greater detail in Fig. 3 (Table 1 summarizes their properties). The location of the eastern one coincides with the HW-object found by Hughes & Wouterloot (1984) at cm-wavelengths, and the central one is located close to but offset to the east, the bright H![]() knot E in the nomenclature of Hartigan et al. (2000),
which shows also weak radio emission. The third component is located
close to knot F, which also emits at radio wavelengths.
There are further radio emission components at the western end of
HH 168 showing equally strong radio emission but outside the X-ray
contour of Fig. 2. On the other hand, all three regions with enhanced X-ray emission have radio components in their vicinity.
knot E in the nomenclature of Hartigan et al. (2000),
which shows also weak radio emission. The third component is located
close to knot F, which also emits at radio wavelengths.
There are further radio emission components at the western end of
HH 168 showing equally strong radio emission but outside the X-ray
contour of Fig. 2. On the other hand, all three regions with enhanced X-ray emission have radio components in their vicinity.
The low count density renders an estimate of the true size of the
emission regions impossible.
For the diffuse emission close to the HW-object and knot E,
circular regions coinciding approximately with the second contour in
Fig. 3 (
![]() cts/pixel,
eight times the background level) were used to extract the photons of
these two components. For knot F, we show the circle in Fig. 3.
cts/pixel,
eight times the background level) were used to extract the photons of
these two components. For knot F, we show the circle in Fig. 3.
The knot E region has an excess of ![]() photons (area 108 arcsec2) and the region around the HW object has an excess of
photons (area 108 arcsec2) and the region around the HW object has an excess of ![]() photons (area 61 arcsec2). Close to knot F, the X-ray emission has an excess of 10 photons (area 44 arcsec2).
All of these regions are not compatible with single point-sources as we would expect only 2-3 photons outside a 1.5
photons (area 61 arcsec2). Close to knot F, the X-ray emission has an excess of 10 photons (area 44 arcsec2).
All of these regions are not compatible with single point-sources as we would expect only 2-3 photons outside a 1.5
![]() radius for the numbers at hand, in contrast to the observational
result. However, it is possible that e.g., six of the photons in the
knot E region are indicative of an active pre-main-sequence star.
The emission close to knot F does not coincide with the position of the foreground star from which no X-ray emission is observed.
radius for the numbers at hand, in contrast to the observational
result. However, it is possible that e.g., six of the photons in the
knot E region are indicative of an active pre-main-sequence star.
The emission close to knot F does not coincide with the position of the foreground star from which no X-ray emission is observed.
There is diffuse emission beyond the three individual emission
components. Excluding the knots from the region defined by the ellipse,
a clear excess of ![]() photons is found. We therefore regard the contours in Fig. 2 as real, although we do not claim that the shape of the contours represent the precise geometry of the emitting volume.
photons is found. We therefore regard the contours in Fig. 2 as real, although we do not claim that the shape of the contours represent the precise geometry of the emitting volume.
![\begin{figure}
\par\includegraphics[angle=270,width=9cm,clip]{12890fg6.ps}
\end{figure}](/articles/aa/full_html/2009/47/aa12890-09/img22.png)
|
Figure 4: Spectrum of the photons within HH 168. The fitted model is shown in red. |
| Open with DEXTER | |
4.2 Spectral properties and energetics
Considering the energies of the photons within these three regions, we find slight differences between the median energies of the photons within the HW-object (1.1 keV) and the knot E photons (0.9 keV). A KS-test infers a probability of only 15% that both samples are drawn from the same distribution. On the other hand it is probable (60%) that the photons around knot E and those of the large-scale diffuse emission are drawn from the same distribution.Ignoring for a moment this difference, we show in Fig. 4 the spectrum of the photons within the ellipse.
The spectrum can be described well by an absorbed, thermal, optically thin plasma with
![]() keV and an absorbing column density of
keV and an absorbing column density of
![]() cm-2.
These values are consistent with the XMM-Newton data of Pravdo & Tsuboi (2005). Using the conversion between
cm-2.
These values are consistent with the XMM-Newton data of Pravdo & Tsuboi (2005). Using the conversion between ![]() and
and ![]() from Vuong et al. (2003), we find that
from Vuong et al. (2003), we find that
![]() .
.
Using the best-fit values, the total unabsorbed energy-loss of the diffuse emission component in X-rays is about
![]() erg s-1. Figure 5 shows the contours of several significance levels in the (kT,
erg s-1. Figure 5 shows the contours of several significance levels in the (kT, ![]() )-plane; this plot illustrates the dependence of the luminosity on the adapted spectral parameters.
The energy-loss within the smaller components scales with their photon numbers (
)-plane; this plot illustrates the dependence of the luminosity on the adapted spectral parameters.
The energy-loss within the smaller components scales with their photon numbers (
![]() ,
,
![]() and
and
![]() erg s-1 for knot E, the HW region, and knot F, respectively).
erg s-1 for knot E, the HW region, and knot F, respectively).
The difference in the median energy of the photons can either be
caused by a different absorbing column density or by an intrinsically
different temperature of the plasmas. In either case, one needs to
approximately double either T or ![]() to increase the median energy by 0.2 keV.
to increase the median energy by 0.2 keV.
![\begin{figure}
\par\includegraphics[width=8cm,clip]{12890fg7.eps}
\end{figure}](/articles/aa/full_html/2009/47/aa12890-09/img32.png)
|
Figure 5:
Contours showing different confidence levels of the plasma parameters. The contours designate the 1 |
| Open with DEXTER | |
An estimate of the electron density ![]() of the X-ray emitting plasma can be given by the volume emission measure (EM, provided by the fit) needed to achieve the observed flux by
of the X-ray emitting plasma can be given by the volume emission measure (EM, provided by the fit) needed to achieve the observed flux by
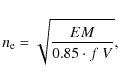
|
(1) |
where V is the volume of the emitting region, f the filling factor, and the factor 0.85 reflects the solar ratio of electrons to H-atoms in an ionized plasma). The EM for the large region has a value of
None of those objects exhibit significant variability in their light
curves. However, the low number of counts is not sufficient to exclude
minor variability (factor ![]() 2) within 10 ks.
2) within 10 ks.
5 Is the emission really diffuse?
The appearance of a diffuse emission component can in principle be mimicked by a superposition of a large number of discrete sources as Cep A is a young star-forming region. We therefore assume in this section that a great number of YSOs produce the soft X-rays, and highlight the problems of this scenario. We concentrate on the 0.3-1.5 keV energy range to which the hard X-ray source does not contribute.- 1.
- For the entire region of HH 168, not even one pixel contains three photons. Assuming that the individual sources contribute only 5 photons each, then 20 of these sources are needed. Lowering the significance of the source-detection algorithm as far as possible, only 26 sources are detected with a mean count number of about two. Thus, a higher number of discrete sources (>50) is required to explain the soft X-ray emission with point sources.
- 2.
- The relatively small absorbing column density should also
ensure that pre-main sequence stars are detectable in the IR and
possibly also as H
 sources.
Taking the saturation limit of
sources.
Taking the saturation limit of
 ,
we find that a single highly active mid-M dwarf would produce a single
X-ray photon at a distance of 730 pc. Thus, about
100 M-dwarfs are needed within the HH object to account for
the total luminosity. A mid M-dwarf has an apparent V-magnitude of about 20 assuming that
,
we find that a single highly active mid-M dwarf would produce a single
X-ray photon at a distance of 730 pc. Thus, about
100 M-dwarfs are needed within the HH object to account for
the total luminosity. A mid M-dwarf has an apparent V-magnitude of about 20 assuming that
 .
Thus, even in the unlikely case that only M-dwarfs and later objects
are present in HH 168, at least some should have been detected
with the available observations.
Furthermore, the X-ray emission does not seem to be concentrated in the
shallow strip as the peaks in H.
For the enhanced emission close to the knot E, we note that the X-ray emission is offset from the bright H
emission and the potential position of the YSOs.
.
Thus, even in the unlikely case that only M-dwarfs and later objects
are present in HH 168, at least some should have been detected
with the available observations.
Furthermore, the X-ray emission does not seem to be concentrated in the
shallow strip as the peaks in H.
For the enhanced emission close to the knot E, we note that the X-ray emission is offset from the bright H
emission and the potential position of the YSOs.
- 3.
- No diffuse hard X-ray emission (E > 1.5 keV), expected to be present in low-mass pre-main-sequence stars, is observed. The median plasma temperature of the sources in the Orion nebula cloud (COUP: Getman et al. 2005; Preibisch et al. 2005) is more than a factor of three higher than the best-fit temperature of the diffuse HH 168 emission. Taking the median count number of the COUP sources, the expected count number of this ``normal'' stellar source would be about 10 photons for the absorption and distance of Cep A. The highest photon density within the HH 168 area contains six photons within the 95% region of a point source.
- 4.
- The probability of finding a YSO in the HH 168 region can be estimated using the stellar surface density of the Cep A region derived by Gutermuth et al. (2009) from mid-infrared imaging. Assuming a uniform distribution of their sources, we derive a probability of about 0.2% of finding one source within a 1 arcsec2 region. The stellar surface density also matches approximately that of the Trapezium region in Orion, which was studied during the COUP project with a 25 times higher X-ray sensitivity than the observation of Cep A. From the surface density of the 1616 COUP X-ray sources, we estimate a probability of about 0.5% of finding one X-ray source within 1 arcsec2. Both values correspond to less than one expected source within the three individual components, while two (five) sources are expected within the large source ellipse. These numbers are too low to account for the luminosity of the object.
6 Are the X-rays produced in shocks?
A solution for the heating of the observed hot plasma is shock heating. In this section, the properties of the observed X-ray emission are related to those expected from shocks.6.1 X-ray emission from shocks
The observed X-ray emission is produced by plasma with temperatures of around or above 106 K. Because shocks are the ultimate origin of this hot plasma (ignoring possible contributions by coronal emission of unresolved stars in this region) we recall some relations between properties observable at other wavelengths and X-rays.
From the strong shock jump condition, the temperature T of the plasma is
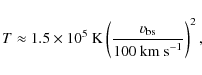
where
|
(3) |
which depends on the pre-shock particle number density n0 and has a
6.2 Are the spectral properties consistent with shocks?
The range of possible plasma temperatures (see Fig. 5) reaches from 0.1 keV to 0.6 keV. The corresponding shock speeds are 280 km s-1 and 680 km s-1, respectively; speeds in that range have been deduced in this region. The proper motion of individual knots is ![]() 300 km s-1 and possibly even higher (Raines et al. 2000), the emission line width might be as great as 400 km s-1 (Hartigan et al. 2000) and Rodríguez et al. (2005) speculate about inhomogeneities in the outflow moving with 900 km s-1. A superposition of flows with different shock speeds might also result in the observed spectrum.
300 km s-1 and possibly even higher (Raines et al. 2000), the emission line width might be as great as 400 km s-1 (Hartigan et al. 2000) and Rodríguez et al. (2005) speculate about inhomogeneities in the outflow moving with 900 km s-1. A superposition of flows with different shock speeds might also result in the observed spectrum.
The observed low absorption is compatible with the detection of NIR and H![]() emission
in that region. Differences in the absorbing column density have not
been investigated with the available observations, although, a uniform
absorbing column density is unlikely.
emission
in that region. Differences in the absorbing column density have not
been investigated with the available observations, although, a uniform
absorbing column density is unlikely.
The derived densities (assuming a filling factor f of unity) are about a factor 1000 lower than those estimated from optical emission lines (Hartigan et al. 2000), but the thermal pressure P of the hot plasma (P=nkT, k Boltzmann's constant) and that of the optically observed material (![]() K and
K and
![]() cm-3) differ by only a factor of ten. To avoid the low pressure of the X-ray plasma, a filling factor f of less than a tenth is mandatory.
cm-3) differ by only a factor of ten. To avoid the low pressure of the X-ray plasma, a filling factor f of less than a tenth is mandatory.
Alternatively, the hot ions might represent a co-spatial
component of a denser and cooler gas, which is not yet thermalised. In
collision-dominated plasmas, a few mean free path lengths are
sufficient to arrive at a Maxwellian energy distribution. The mean free
path l for collisions with neutrals of number density n is
|
(5) |
where a0 is the Bohr radius of the hydrogen atom (Lang 1999). For typical densities of n=103 cm-3, a hot ion population would thermalise within a few AU. Thus, we cannot expect to find two distinct populations in a given volume in the abscence of heating and we reject this scenario. Therefore, either the X-ray emission is produced in only a thin surface layer of gas filled bubbles, possibly at the interface between the driving flow and the ambient medium, or in smaller individual knots such as the H
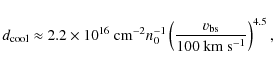
With an estimate of the density of the X-ray emitting plasma, we can derive the cooling time of the material by
|
(6) |
where we assumed for the cooling function
Only for densities above
![]() cm-3
is the cooling time sufficiently short for the plasma to remain within
around 730 AU (an arcsec) of its heating location assuming a
proper motion of 0.1
cm-3
is the cooling time sufficiently short for the plasma to remain within
around 730 AU (an arcsec) of its heating location assuming a
proper motion of 0.1
![]() yr-1.
Otherwise, the timescale for the cooling is so long that the position
of the plasma is not necessarily close to the location where the
heating occurred.
yr-1.
Otherwise, the timescale for the cooling is so long that the position
of the plasma is not necessarily close to the location where the
heating occurred.
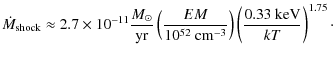
If we assume that the HW object and the knots E and F are
currently heated by ongoing shocks, so that we observe the post-shock
cooling zone, we can calculate the mass loss according to Eq. (4), as
![]() yr-1.
yr-1.
The total X-ray luminosity of HH 168 is an order of magnitude larger than the X-ray jet of DG Tau (which is a pre-main-sequence star of less than one solar mass) and in-between those of HH 2 and HH 80/81. In those cases, the mechanical energy of the outflow is by far sufficient to power the X-ray emission, which is probably also true for HH 168; although the kinetic energy of the outflow is not known, that of the molecular outflow alone exceeds the required energy by a few orders of magnitude.
Thus, we conclude that all spectral properties are consistent with shock heating and the properties derived from other wavelengths.
6.3 Comparison with HH 2 and HH 80/81
Soft X-ray emission within similar HH objects has also been detected from HH 2 (Pravdo et al. 2001), HH 80/81 (Pravdo et al. 2004), and HH 210 (Grosso et al. 2006). Their temperatures (![]() kV) and association with an HH object are very similar to HH 168. The density
kV) and association with an HH object are very similar to HH 168. The density
![]() cm-3
of the X-ray emitting material is for HH 2 and HH 80 higher
than the values of HH 168. In these cases, the brightest X-ray
emission components are correlated with bright H
cm-3
of the X-ray emitting material is for HH 2 and HH 80 higher
than the values of HH 168. In these cases, the brightest X-ray
emission components are correlated with bright H![]() emission knots exhibiting bow-shock-like structures.
emission knots exhibiting bow-shock-like structures.
Therefore, the heating most probably occurs in these objects because of an interaction of the outflow with another medium. This might be the ambient medium or a low-density bubble produced by a protostellar object as suspected by Pravdo et al. (2004) because of the presence of a hard X-ray source between the soft X-ray emission components. For HH 168, the X-ray emission is not located at the head of the outflow where bow-shock structures are observed (Hartigan et al. 2000), but a hard X-ray source within in the soft diffuse X-ray emission is also present. The large-scale diffuse emission found in the case of HH 168 is not present in any of the other sources, which are extended on the scale of a few arcsec.
For HH 2 and HH 80/81, the X-ray emission correlates approximately with radio emission knots in the sense that a radio component is located close to the X-ray emission, while there are also radio knots without X-ray emission. Knot E in HH 168 might be an exception of this rule.
7 Location of shocks
Where should we expect the shocks heating the plasma to the observed X-ray emitting temperatures to be located? Because of the long cooling time of the X-ray emitting material, the observed X-ray emission might have been heated some time ago.7.1 Shocks at the head of the outflow
The natural position of strong shocks is the head of the outflow since there the velocity difference is largest, but the bulk of the X-ray emission is located in the eastern part of the HThe brightest H![]() knot (knot S, see Hartigan et al. 2000)
shows the characteristic properties of a bow shock with the ambient
medium, but has, at most, only weak excess X-ray emission (three
photons above the estimated background). A stronger absorption at this
part of the outflow than at the eastern end of HH 168 might reduce
the observed flux.
Doubling the absorption would decrease the count rate by a factor of
four rendering the detection of soft X-rays virtually impossible, but
a lower shock velocity or a smaller radius of the obstacle would also
result in a smaller amount of material being heated to X-ray emitting
temperatures and thus a reduction in the observed flux.
knot (knot S, see Hartigan et al. 2000)
shows the characteristic properties of a bow shock with the ambient
medium, but has, at most, only weak excess X-ray emission (three
photons above the estimated background). A stronger absorption at this
part of the outflow than at the eastern end of HH 168 might reduce
the observed flux.
Doubling the absorption would decrease the count rate by a factor of
four rendering the detection of soft X-rays virtually impossible, but
a lower shock velocity or a smaller radius of the obstacle would also
result in a smaller amount of material being heated to X-ray emitting
temperatures and thus a reduction in the observed flux.
The shocks might have been more energetic in the past, so that in case of a low plasma density (
![]() cm-3)
the observed material was heated much earlier in the outflow history
and the luminosity at the current shock front (in particular
knot S) is below the detection limit.
The shape of the X-ray emission might then represent the ``shock
history'' of the outflow.
cm-3)
the observed material was heated much earlier in the outflow history
and the luminosity at the current shock front (in particular
knot S) is below the detection limit.
The shape of the X-ray emission might then represent the ``shock
history'' of the outflow.
7.2 Shocks within the HH-object
Since most of the X-ray emission is observed within the outflow, another explanation for the observed features is presented.There has been some speculation about a high velocity component (![]() 900 km s-1) within HH 168 (Rodríguez et al. 2005; Raines et al. 2000),
which is sufficiently fast to produce X-ray emission within HH 168
when encountering denser and slower material, such as a thin bubble
expanding from the hard X-ray source between the HW object and
knot E similar to the scenario proposed by Pravdo et al. (2004)
for HH 80.
The individual X-ray components are not aligned in the east-west
direction of the large-scale outflow, but a single precessing jet (as
proposed for the eastern HH objects, Cunningham et al. 2009)
with an opening angle of only 20 degrees can reach all X-ray and radio
components (assuming a driving source at Cep A East). A deflection
of the outflow at high density clumps or different outflows might also
explain the morphology.
Therefore, the same high velocity flow heating the HW-object might also
heat the material close to knot E and knot F.
900 km s-1) within HH 168 (Rodríguez et al. 2005; Raines et al. 2000),
which is sufficiently fast to produce X-ray emission within HH 168
when encountering denser and slower material, such as a thin bubble
expanding from the hard X-ray source between the HW object and
knot E similar to the scenario proposed by Pravdo et al. (2004)
for HH 80.
The individual X-ray components are not aligned in the east-west
direction of the large-scale outflow, but a single precessing jet (as
proposed for the eastern HH objects, Cunningham et al. 2009)
with an opening angle of only 20 degrees can reach all X-ray and radio
components (assuming a driving source at Cep A East). A deflection
of the outflow at high density clumps or different outflows might also
explain the morphology.
Therefore, the same high velocity flow heating the HW-object might also
heat the material close to knot E and knot F.
The highest X-ray luminosity is observed close to knot E and might be a remnant of strong shocks in that region. The relatively low density of the X-ray emitting material and its lower median energy compared to the HW object, support a scenario in which the heating happened earlier and the currently emitting material is not at the position of its heating.
The strongest radio emission is detected at the HW-object, the region closest to the driving source of the HH 168 outflow, (or harbouring the driving source itself, Garay et al. 1996). Goetz et al. (1998) and Cunningham et al. (2009) speculate that the outflow might be deflected somewhere around the HW-object, or that two outflows (those of HW 2 and HW 3c) collide at this position. It is possible that the heating of the plasma happens somewhere near or within the HW-object and the X-ray emission westwards is from cooling plasma. In this scenario, the difference between the median energy of the HW-object and the knot E photons reflects the cooling of the material, and a density of a few 100 cm-3 is necessary to explain the softening of the photons by radiative losses. The lack of significant X-ray emission at the western end of the HH-object would be naturally explained in this scenario. The weak X-ray emission close to knot S is then, if real, caused by small shocks of the outflowing material with the ambient medium.
However, the correlation of the optically observed material (in particular H![]() emission),
the radio emission and the brightest X-ray emission points to a similar
heating mechanism for all of these features. The electron density
estimated from the radio observations is about a hundred times higher
than that estimated from X-rays but another factor of ten lower than
calculated for the material radiating in forbidden emission lines. This
would imply a pressure balance, if less than a tenth of the observed
volume is filled with a hot plasma. Thus, the observed X-ray emission
probably traces the (former) location of strong shocks that in the mean
time decelerated explaining the offset between H
emission),
the radio emission and the brightest X-ray emission points to a similar
heating mechanism for all of these features. The electron density
estimated from the radio observations is about a hundred times higher
than that estimated from X-rays but another factor of ten lower than
calculated for the material radiating in forbidden emission lines. This
would imply a pressure balance, if less than a tenth of the observed
volume is filled with a hot plasma. Thus, the observed X-ray emission
probably traces the (former) location of strong shocks that in the mean
time decelerated explaining the offset between H![]() and X-ray emission seen in knot E, and on a smaller scale within
the HW object. The diffuse X-ray emission, which is also present
between the individual knots, is probably very thin plasma heated
earlier in the outflow history and cooling slowly.
and X-ray emission seen in knot E, and on a smaller scale within
the HW object. The diffuse X-ray emission, which is also present
between the individual knots, is probably very thin plasma heated
earlier in the outflow history and cooling slowly.
7.3 A reverse shock
Another possible way of explaining the offset between the H7.4 An expanding bubble filled with hot plasma
For a cooling time on the order of the kinematic lifetime of the outflow and a launching point somewhere in the region of the radio sources in Cep A East, it is possible that the X-ray emitting material might be heated closer towards the centre where the absorption is higher and thus the heating source may remain undetected in X-rays by current observations.On larger scales (
![]() parsec), bubbles filled with a very thin (
parsec), bubbles filled with a very thin (
![]() cm-3) and hot (
cm-3) and hot (![]() keV) X-ray emitting gas have been found (Townsley et al. 2003; Güdel et al. 2008a).
The minimum electron densities in the case of HH 168 are close to
these values. However, the proposed B stars in Cep A East
have a lower mass-loss and slower wind speeds than the O type
stars usually needed to fill the large bubbles.
Furthermore, in all other cases the X-ray emitting gas seems to be
channeled by surrounding H2, while in this case, the H2 emission shows signatures of strong interaction with the ambient medium (bow shocks, Cunningham et al. 2009)
co-spatial with the X-ray emission. However, HH 168 might be a
kind of a transition object, where a low density plasma, heated either
within the outflow or close to the driving sources, survives in a
bubble blown out by earlier outflow episodes.
keV) X-ray emitting gas have been found (Townsley et al. 2003; Güdel et al. 2008a).
The minimum electron densities in the case of HH 168 are close to
these values. However, the proposed B stars in Cep A East
have a lower mass-loss and slower wind speeds than the O type
stars usually needed to fill the large bubbles.
Furthermore, in all other cases the X-ray emitting gas seems to be
channeled by surrounding H2, while in this case, the H2 emission shows signatures of strong interaction with the ambient medium (bow shocks, Cunningham et al. 2009)
co-spatial with the X-ray emission. However, HH 168 might be a
kind of a transition object, where a low density plasma, heated either
within the outflow or close to the driving sources, survives in a
bubble blown out by earlier outflow episodes.
8 Summary
The Chandra observation of HH 168 confirms the presence of diffuse soft X-ray emission within HH 168 as seen by XMM-Newton. The spectral properties of both observations agree well. The higher angular resolution of the Chandra observation clearly shows the diffuse character of the emission and discards YSOs as the origin of the X-rays. Furthermore, the substructure within the X-ray emission shows a good correlation with the optical and radio ``knots''. Although this correlation has been seen in other HH objects such as HH 2 and HH 80/81, the bulk of the X-ray emission in the case of HH 168 is not at the location of bow shocks. Instead, the X-rays are displaced towards the driving sources against the outflow direction by several thousands of AU. We regard this as evidence of internal shocks probably powered by a high velocity component within the large-scale outflow. The X-ray emitting plasma correlates with HNote added in proof After acceptance of this paper an article dealing with the same X-ray data appeared in Pravdo et al. (2009). However, these authors concentrate on the central region of Cep A. Their results concerning the spectral properties and the location of the X-ray emission of HH 168 are compatible with ours.
AcknowledgementsWe thank the referee, Dr. M. Güdel, for his valuable comments which improved the paper. This work has made use of data obtained from the Chandra data archive and the SDSS (http://www.sdss.org/). P.C.S. acknowledges support from the DLR under grant 50OR0703. H.M.G. acknowledges support from the DLR under grant 50OR0105.
References
- Abazajian, K. N., Adelman-McCarthy, J. K., Agüeros, M. A., et al. 2009, ApJS, 182, 543 [NASA ADS] [CrossRef]
- Arnaud, K. A. 1996, in Astronomical Data Analysis Software and Systems V, ed. G. H. Jacoby, & J. Barnes, ASP Conf. Ser., 101, 17
- Bally, J., Feigelson, E., & Reipurth, B. 2003, ApJ, 584, 843 [NASA ADS] [CrossRef]
- Codella, C., Bachiller, R., Benedettini, M., & Caselli, P. 2003, MNRAS, 341, 707 [NASA ADS] [CrossRef]
- Crawford, D. L., & Barnes, J. V. 1970, AJ, 75, 952 [NASA ADS] [CrossRef]
- Cunningham, N. J., Moeckel, N., & Bally, J. 2009, ApJ, 692, 943 [NASA ADS] [CrossRef]
- Favata, F., Fridlund, C. V. M., Micela, G., Sciortino, S., & Kaas, A. A. 2002, A&A, 386, 204 [NASA ADS] [EDP Sciences] [CrossRef]
- Favata, F., Bonito, R., Micela, G., et al. 2006, A&A, 450, L17 [NASA ADS] [EDP Sciences] [CrossRef]
- Garay, G., Ramirez, S., Rodriguez, L. F., Curiel, S., & Torrelles, J. M. 1996, ApJ, 459, 193 [NASA ADS] [CrossRef]
- Getman, K. V., Flaccomio, E., Broos, P. S., et al. 2005, ApJS, 160, 319 [NASA ADS] [CrossRef]
- Goetz, J. A., Pipher, J. L., Forrest, W. J., et al. 1998, ApJ, 504, 359 [NASA ADS] [CrossRef]
- Grosso, N., Feigelson, E. D., Getman, K. V., et al. 2006, A&A, 448, L29 [NASA ADS] [EDP Sciences] [CrossRef]
- Güdel, M., Briggs, K. R., Montmerle, T., et al. 2008a, Science, 319, 309 [NASA ADS] [CrossRef]
- Güdel, M., Skinner, S. L., Audard, M., Briggs, K. R., & Cabrit, S. 2008b, A&A, 478, 797 [NASA ADS] [EDP Sciences] [CrossRef]
- Günther, H. M., & Schmitt, J. H. M. M. 2009, A&A, 494, 1041 [NASA ADS] [EDP Sciences] [CrossRef]
- Günther, H. M., Schmitt, J. H. M. M., Robrade, J., & Liefke, C. 2007, A&A, 466, 1111 [NASA ADS] [EDP Sciences] [CrossRef]
- Günther, H. M., Matt, S. P., & Li, Z.-Y. 2009, A&A, 493, 579 [NASA ADS] [EDP Sciences] [CrossRef]
- Gutermuth, R. A., Megeath, S. T., Myers, P. C., et al. 2009, ApJS, 184, 18 [NASA ADS] [CrossRef]
- Hartigan, P., & Lada, C. J. 1985, ApJS, 59, 383 [NASA ADS] [CrossRef]
- Hartigan, P., Lada, C. J., Tapia, S., & Stocke, J. 1986, AJ, 92, 1155 [NASA ADS] [CrossRef]
- Hartigan, P., Morse, J., & Bally, J. 2000, AJ, 120, 1436 [NASA ADS] [CrossRef]
- Heathcote, S., Reipurth, B., & Raga, A. C. 1998, AJ, 116, 1940 [NASA ADS] [CrossRef]
- Hiriart, D., Salas, L., & Cruz-González, I. 2004, AJ, 128, 2917 [NASA ADS] [CrossRef]
- Hughes, V. A., & Moriarty-Schieven, G. 1990, ApJ, 360, 215 [NASA ADS] [CrossRef]
- Hughes, V. A., & Wouterloot, J. G. A. 1984, ApJ, 276, 204 [NASA ADS] [CrossRef]
- Johnson, H. L. 1957, ApJ, 126, 121 [NASA ADS] [CrossRef]
- Lang, K. R. 1999, Astrophysical formulae, ed. K. R. Lang
- Lenzen, R. 1988, A&A, 190, 269 [NASA ADS]
- Pravdo, S. H., & Tsuboi, Y. 2005, ApJ, 626, 272 [NASA ADS] [CrossRef]
- Pravdo, S. H., Feigelson, E. D., Garmire, G., et al. 2001, Nature, 413, 708 [NASA ADS] [CrossRef]
- Pravdo, S. H., Tsuboi, Y., & Maeda, Y. 2004, ApJ, 605, 259 [NASA ADS] [CrossRef]
- Pravdo, S. H., Tsuboi, Y., Uzawa, A., & Ezoe, Y. 2009, ApJ, 704, 1495 [CrossRef]
- Preibisch, T., Kim, Y.-C., Favata, F., et al. 2005, ApJS, 160, 401 [NASA ADS] [CrossRef]
- Raga, A. C., Noriega-Crespo, A., & Velázquez, P. F. 2002, ApJ, 576, L149 [NASA ADS] [CrossRef]
- Raines, S. N., Watson, D. M., Pipher, J. L., et al. 2000, ApJ, 528, L115 [NASA ADS] [CrossRef]
- Rodríguez, L. F., Torrelles, J. M., Raga, A. C., et al. 2005, Rev. Mex. Astron. Astrofis., 41, 435 [NASA ADS]
- Schneider, P. C., & Schmitt, J. H. M. M. 2008, A&A, 488, L13 [NASA ADS] [EDP Sciences] [CrossRef]
- Schneider, P. C., Guenther, H. M., & Schmitt, J. H. M. M. 2009, A&A, 508, 321 [EDP Sciences] [CrossRef]
- Smith, R. K., Brickhouse, N. S., Liedahl, D. A., & Raymond, J. C. 2001, ApJ, 556, L91 [NASA ADS] [CrossRef]
- Swartz, D. A., Drake, J. J., Elsner, R. F., et al. 2005, ApJ, 628, 811 [NASA ADS] [CrossRef]
- Townsley, L. K., Feigelson, E. D., Montmerle, T., et al. 2003, ApJ, 593, 874 [NASA ADS] [CrossRef]
- Vuong, M. H., Montmerle, T., Grosso, N., et al. 2003, A&A, 408, 581 [NASA ADS] [EDP Sciences] [CrossRef]
Footnotes
- ...
![[*]](/icons/foot_motif.png)
- http://www.sdss.org/
- ... website
- http://cxc.harvard.edu/ciao/
All Tables
Table 1: Diffuse X-ray emission in HH 168 (0.3-1.5 keV).
All Figures
| |
Figure 1:
SDSS |
| Open with DEXTER | |
| In the text | |
|
|
Figure 2:
The region around HH 168 in soft X-rays (energies between
0.3 keV and 1.5 keV). Single pixels show individual photon
positions. The blue contour is the H |
| Open with DEXTER | |
| In the text | |
|
|
Figure 3:
Zoom into selected regions. In the left panel, the HW-object, in the middle panel, the region around knot E, and in the right panel the knot F region are shown. Squares denote individual photons. The red contours are the X-ray contours from Fig. 2. H |
| Open with DEXTER | |
| In the text | |
|
|
Figure 4: Spectrum of the photons within HH 168. The fitted model is shown in red. |
| Open with DEXTER | |
| In the text | |
|
|
Figure 5:
Contours showing different confidence levels of the plasma parameters. The contours designate the 1 |
| Open with DEXTER | |
| In the text | |
Copyright ESO 2009
Current usage metrics show cumulative count of Article Views (full-text article views including HTML views, PDF and ePub downloads, according to the available data) and Abstracts Views on Vision4Press platform.
Data correspond to usage on the plateform after 2015. The current usage metrics is available 48-96 hours after online publication and is updated daily on week days.
Initial download of the metrics may take a while.