| Issue |
A&A
Volume 508, Number 1, December II 2009
|
|
|---|---|---|
| Page(s) | 525 - 529 | |
| Section | Atomic, molecular, and nuclear data | |
| DOI | https://doi.org/10.1051/0004-6361/200913233 | |
| Published online | 15 October 2009 | |
A&A 508, 525-529 (2009)
The FERRUM project: transition probabilities for forbidden lines in [Fe II] and experimental metastable lifetimes
J. Gurell1 - H. Hartman2 - R. Blackwell-Whitehead2 - H. Nilsson2 - E. Bäckström1 - L. O. Norlin3 - P. Royen1 - S. Mannervik1
1 - Department of Physics, Stockholm University, AlbaNova University
Center, 10691 Stockholm, Sweden
2 - Lund Observatory, Lund University, Box 43, 22100 Lund, Sweden
3 - Department of Physics, Royal Institute of Technology, AlbaNova
University Center, 10691 Stockholm, Sweden
Received 3 September 2009 / Accepted 2 October 2009
Abstract
Context. Accurate transition probabilities for
forbidden lines are important diagnostic parameters for low-density
astrophysical plasmas. In this paper we present experimental atomic
data for forbidden [Fe II] transitions that
are observed as strong features in astrophysical spectra.
Aims. We measure lifetimes for the 3d6(3G)4s a 4G11/2
and 3d6(3D)4s b 4D1/2
metastable levels in Fe II and experimental
transition probabilities for the forbidden transitions 3d7 a 4F
7/2,9/2-3d6(3G)4s a 4G11/2.
Methods. The lifetimes were measured at the ion
storage ring facility CRYRING using a laser probing technique.
Astrophysical branching fractions were obtained from spectra of Eta
Carinae, obtained with the Space Telescope Imaging Spectrograph onboard
the Hubble Space Telescope. The lifetimes and
branching fractions were combined to yield absolute transition
probabilities.
Results. The lifetimes of the a 4G11/2
and the b 4D1/2
levels have been measured and have the following values, ![]() s
and
s
and ![]() s
respectively. Furthermore, we have determined the transition
probabilities for two forbidden transitions of a 4F
7/2,9/2-a 4G11/2
at 4243.97 and 4346.85 Å. Both the lifetimes and the
transition probabilities are compared to calculated values in the
literature.
s
respectively. Furthermore, we have determined the transition
probabilities for two forbidden transitions of a 4F
7/2,9/2-a 4G11/2
at 4243.97 and 4346.85 Å. Both the lifetimes and the
transition probabilities are compared to calculated values in the
literature.
Key words: atomic data - methods: laboratory - techniques: spectroscopic - stars: individual: Eta Carinae
1 Introduction
The cosmic abundance of iron is relatively high compared to other iron group elements and the spectrum of singly ionized iron, Fe II, is a significant contributor to the spectral opacity of the sun and hotter stars. The complex energy level structure of Fe II makes the spectrum extremely line rich and it has been studied in great detail with more than 1000 energy levels identified in the literature (Johansson 2009).
Fe II lines are observed in the spectra of a wide variety of astronomical objects, and there is a considerable demand for accurate atomic data for this ion. To meet the accurate data requirements of modern astrophysics, a program was initiated to supply the astronomical community with reliable atomic data: the FERRUM-project (Johansson et al. 2002). The aim of this international collaboration is to measure and evaluate astrophysically relevant experimental and theoretical transition data for the iron group elements.
There are 62 metastable levels in Fe II. The parity forbidden lines from some of these levels are observed as prominent features in astrophysical low density plasmas, such as nebulae, H II regions and circumstellar gas clouds. However, metastable levels have radiative lifetimes several orders of magnitude longer than other levels and are thus more affected by collisions. Due to the absence of these lines in laboratory spectra, the majority of forbidden line transition probabilities (A-values) available in the literature are from theoretical calculations.
There are only four metastable levels in Fe II with laboratory measured lifetimes. The a 6S5/2 and b 4D7/2 levels have been measured by Rostohar et al. (2001) using laser probing of a stored ion beam (a laser probing technique, LPT). In addition, the a 4G9/2and b 2H11/2 levels have been measured by Hartman et al. (2003) using the LPT. There is good agreement between Rostohar et al. (2001) and the calculated values of Nussbaumer et al. (1981) and Quinet et al. (1996). However, the lifetimes of Rostohar et al. (2001) are systematically shorter than the calculations of Garstang (1962). Hartman et al. (2003) also combined the lifetimes of a 6S5/2, b 4D7/2and a 4G9/2 with branching fractions (BFs) to determine experimental A-values for forbidden transitions. Hartman et al. (2003) measured the BFs in astrophysical spectra observed in the ejecta of Eta Carinae and presented additional theoretical A-value calculations.
We present radiative lifetimes for the a 4G11/2 and b 4D1/2 metastable levels in Fe II measured using the LPT at the CRYRING facility. In addition, BFs for two forbidden transitions 4243.97 Å and 4346.85 Å (a4F9/2-a4G11/2 and a4F7/2-a4G11/2) have been measured in astrophysical spectra observed in the ejecta of Eta Carinae recorded with the Hubble Space Telescope (HST) Space Telescope Imaging Spectrograph (STIS). The radiative lifetimes have been combined with the BFs to yield A-values and we provide a comparison with theoretical values in the literature.
2 Experimental measurements
The lifetime (![]() )
of a level i is defined as the inverse of the total
transition probability (Aik)
for all possible decay channels from that level,
according to Eq. (1),
where k is summed over all lower levels.
)
of a level i is defined as the inverse of the total
transition probability (Aik)
for all possible decay channels from that level,
according to Eq. (1),
where k is summed over all lower levels.

The majority of all excited levels will decay through electric dipole (E1) transitions which typically gives a lifetime of the order of a nanosecond, but if no allowed E1 decay channels are available, i.e. the level is metastable, the population decay has to be through higher order transitions associated with magnetic dipole or electric quadrupole terms. The probability for such a transition to occur is several orders of magnitude smaller compared to the probability for an E1 transition which makes the lifetime of a metastable level significantly longer, typically several milliseconds, seconds, minutes or even hours.
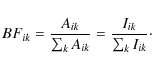
The BF of a transition ik
is defined as the transition probability, Aik,
for a single line divided by the sum of the transition probabilities
from all lines with the
common upper level according to Eq. (2).

By combining Eqs. (1) and (2) the absolute transition probability, referred to as the A-value, of each decay channel can be deduced according to Eq. (3).

2.1 Lifetime measurements of metastable Fe II levels
The lifetimes of the two metastable levels were measured using the LPT (Lidberg et al. 1999; Mannervik 2003; Mannervik et al. 2005) at the ion storage ring CRYRING at the Manne Siegbahn laboratory in Stockholm, Sweden. The LPT has been developed and refined during several years and has been used to measure lifetimes ranging from 3.4 ms in Xe II (Lidberg et al. 1997) to 89 s in Ba II (Gurell et al. 2007).
A hot ion source is used to produce ions that can be extracted
and injected into the storage ring. Once inside CRYRING, singly charged
ions
may be stored for several minutes at 40 keV and investigated
in this ultra high vacuum environment with a background pressure lower
than 10-11 Torr.
For the experiment described in this paper Fe+
ions were produced in a Nielsen ion source used in combination with an
oven filled with FeCl2. By heating the oven to
approximately 400 ![]() C
and running the ion source with argon as a carrier gas it was possible
to extract and store a current of Fe+ ions as
high as 4
C
and running the ion source with argon as a carrier gas it was possible
to extract and store a current of Fe+ ions as
high as 4 ![]() A
in CRYRING.
A
in CRYRING.
Ions in excited states will decay as they are being stored and
by passively monitoring the excited level population, a decay curve can
be constructed.
However, the low intensity of forbidden transitions is hard to detect
directly since the emission is spread out over the 52 m length
of the storage ring and
spread across the 4![]() solid angle. A LPT in combination with a Doppler tuning device (DTD)
was used to increase the strength of the signal. The LPT probes
the population of the metastable level by laser-inducing a transition
to a higher lying short lived level. Within a few ns this level will
decay to another
lower lying level and the fluorescence originating from that transition
is used as an indirect measurement of the population of the metastable
level at the
time of the probe pulse's arrival. The probing scheme used in this
study is shown in Fig. 1
with A-values from Baschek
et al.
(1970), Kostyk
& Orlova (1982)
and Ralchenko et al. (2008) and energy levels from Johansson
(1978).
solid angle. A LPT in combination with a Doppler tuning device (DTD)
was used to increase the strength of the signal. The LPT probes
the population of the metastable level by laser-inducing a transition
to a higher lying short lived level. Within a few ns this level will
decay to another
lower lying level and the fluorescence originating from that transition
is used as an indirect measurement of the population of the metastable
level at the
time of the probe pulse's arrival. The probing scheme used in this
study is shown in Fig. 1
with A-values from Baschek
et al.
(1970), Kostyk
& Orlova (1982)
and Ralchenko et al. (2008) and energy levels from Johansson
(1978).
![\begin{figure}
\par\includegraphics[width=9cm,clip]{13233fg1.eps}
\vspace*{8mm}
\end{figure}](/articles/aa/full_html/2009/46/aa13233-09/img10.png)
|
Figure 1: Probing scheme for the two levels studied. The populations of the metastable levels, shown in the left side of the figure, were probed through excitation to the higher lying levels in the middle of figure. Once in the higher lying excited levels the populations decay to lower lying levels, shown in the right side of the figure. The intensity of this fluorescence is detected and used as a relative measurement of the original population of the metastable level under study. See the text for references to the cited A-values. |
| Open with DEXTER | |
The DTD was used to locally accelerate the ions in front of our detector, thereby inducing a Doppler shift. A narrow band ring dye laser was used to tune the resonance of the ions within the small volume of a few cm3 that constitutes the DTD. This technique forces the probing as well as the following rapid fluorescence to occur in front of the detector which greatly enhances the photon count.
We used a Coherent 699-29 ring dye laser, operated with a Rhodamine 6G dye and pumped by a Coherent Innova 400-25 argon laser, to produce laser light with the desired wavelengths of 5985 and 6143 Å. The fluorescence was monitored with a Hamamatsu R585 photomultiplier tube in front of which an optical filter was mounted in order to reduce the background signal coming from scattered laser light.
The populations of the metastable levels under study were probed as a function of delay time after ion injection. Every fourth ion injection was used to measure the laser induced fluorescence at a fixed time after injection in order to make sure that the initial population of the level of interest did not change during the data acquisition time.
2.1.1 Collisional quenching
The small amount of residual gas in the storage ring gives rise to collisional quenching of the metastable levels. Therefore, it is necessary to measure the decay rate of the level population as a function of pressure and extrapolate to zero pressure in order to get the pure radiative decay rate. The decay rate has a linear dependence and the extrapolation can be determined with a Stern-Vollmer plot (Demtröder 1996). In practice this is achieved by allowing the residual gas pressure inside CRYRING to be varied by heating a non-evaporative getter pump, which releases previously absorbed rest gas thereby increasing the pressure slightly. The operating pressure inside CRYRING is out of the range of standard vacuum meters and a relative pressure measurement has to be used instead. Once stored, ions are gradually neutralized due to collisions with the rest gas and the number of ions stored undergoes an exponential decay as a function of time after injection. This decay rate of the ion beam is assumed to be inversely proportional to the rest gas pressure and is used as a relative pressure measurement. The decay of the ion beam is measured with a multi-channel plate connected to the CRYRING storage ring.
The extrapolations of the decay rates to zero pressure were made in two Stern-Vollmer plots shown in Figs. 4 and 5. The data were fitted with a linear fit weighted against the inverse uncertainty in each data point. The uncertainty of the extrapolated pure radiative decay rate is given as the standard deviation of the fit in the corresponding Stern-Vollmer plot.
![\begin{figure}
\par\includegraphics[width=8cm,clip]{13233fg2.eps}
\end{figure}](/articles/aa/full_html/2009/46/aa13233-09/img11.png)
|
Figure 2: Observed population decay curve of the 3d6(3D)4s b 4D1/2 level. |
| Open with DEXTER | |
![\begin{figure}
\par\includegraphics[width=8cm,clip]{13233fg3.eps}
\par\end{figure}](/articles/aa/full_html/2009/46/aa13233-09/img12.png)
|
Figure 3: Observed population decay curve of the 3d6(3G)4s a 4G11/2 level. |
| Open with DEXTER | |
2.1.2 Repopulation
Collisional excitation of ground state ions into metastable levels, referred to as repopulation, is usually corrected for when using the LPT for lifetime measurements, see e.g. Royen et al. (2007). An attempt to measure the repopulation in this study was made but the signal was below the background level of approximately 5 photons per second which makes the collisional excitation effect negligible. The production of metastable ions at the time of ion injection was monitored and showed stable conditions throughout the experiment. Decay curves for the populations of the two levels are shown in Figs. 2 and 3 together with the fitted curves used to determine the lifetimes of the levels. The standard deviation of each fit was used as the uncertainty in the particular lifetime curve.
![\begin{figure}
\par\includegraphics[width=8cm,clip]{13233fg4.eps}
\end{figure}](/articles/aa/full_html/2009/46/aa13233-09/img13.png)
|
Figure 4: Stern-Vollmer plot showing the decay rate of the 3d6(3D)4s b4D1/2 level population as a function of pressure. |
| Open with DEXTER | |
![\begin{figure}
\par\includegraphics[width=8cm,clip]{13233fg5.eps}
\end{figure}](/articles/aa/full_html/2009/46/aa13233-09/img14.png)
|
Figure 5: Stern-Vollmer plot showing the decay rate of the 3d6(3G)4s a4G11/2 level population as a function of pressure. |
| Open with DEXTER | |
Table 1: Experimentally determined lifetimes of metastable levels in Fe II. The uncertainties are given in brackets.
2.2 Astrophysical branching fractions for a 4G11/2
The intensity of an emission line is proportional to the product NA
where N is the population of the upper level and A
is the transition rate of the
transition. For lines having the same upper level the observed photon
intensity is proportional to the transition rate. Together with
Eq. (2) this relates the
BF to the measured intensities for all the decay
channels from a single upper level:
For electric dipole transitions, the branching fractions are often determined using a standard laboratory light source with a high-density plasma and high resolution spectrometer. However, the A-value of a forbidden line is typically 106-109 times lower than the A-value of an allowed transition which makes the forbidden lines too weak to be observed in the spectrum of a standard laboratory source. To observe strong forbidden lines the ions must be kept in a low-density plasma environment, to minimize the collisional deexcitation (quenching), and in a large volume, to get a critical number of ions. Low density astrophysical plasmas fulfil these criteria, and their spectra often show strong forbidden lines. In particular, the spectra of the Weigelt blobs in Eta Carinae are rich in forbidden transition from the iron group including the [Fe II] 4243 and 4346 Å lines and Weigelt blob spectra observed by HST STIS have been used in this study. A great advantage of using HST STIS is the high angular resolution (0
Astrophysical BFs have similar uncertainties to laboratory measurements including uncertainties in the intensity measurements, intensity calibration and unobservable lines (Sikström et al. 2002). Additional uncertainties include corrections for interstellar reddening and blending from other spatial regions along the line of sight. Furthermore, a standard reddening curve was used to correct for redding. However, the redding effect was found to be only a few percent because the lines are separated by a relative narrow wavelength range of 100 Å. The uncertainties have been treated in accordance with the guidelines the National Institute of Standards and Technology, USA (Taylor & Kuyatt 1994).
3 Results
A summary of the lifetime measurements and a comparison to theoretical
values in the literature is given in Table 1. For the
3d6(3G)4s a 4G11/2
level ![]() s
and for the 3d6(3D)4s b 4D1/2
level
s
and for the 3d6(3D)4s b 4D1/2
level ![]() s.
Theoretical
calculations indicate that unobserved branching transitions for the
a 4G11/2 level
constitute less than 4% of the total BF(Quinet et al. 1996). The large relative
uncertainty associated with the a 4G11/2
lifetime is due to a lower number of photon
counts per second compared to the detection of fluorescence following
excitation from the b 4D1/2
level. This is mainly due to the difference in the
A-values of the two probing transitions used, see
Fig. 1,
which differ by almost two orders of magnitude. The experimental
conditions not
associated with the internal structure of the atomic system (i.e. laser
power, background pressure, ion current, optical alignment etc.)
remained very similar
during the two lifetime measurements.
s.
Theoretical
calculations indicate that unobserved branching transitions for the
a 4G11/2 level
constitute less than 4% of the total BF(Quinet et al. 1996). The large relative
uncertainty associated with the a 4G11/2
lifetime is due to a lower number of photon
counts per second compared to the detection of fluorescence following
excitation from the b 4D1/2
level. This is mainly due to the difference in the
A-values of the two probing transitions used, see
Fig. 1,
which differ by almost two orders of magnitude. The experimental
conditions not
associated with the internal structure of the atomic system (i.e. laser
power, background pressure, ion current, optical alignment etc.)
remained very similar
during the two lifetime measurements.
We have measured astrophysical BFs for lines from a 4G11/2, from which the strongest decay channels are to a 4F at 4243 and 4346 Å. The transitions from b 4D1/2 are distributed over a larger wavelength region than transitions from a 4G11/2, and many of the lines are blended with other lines making the intensity measurements uncertain. Therefore we could not derive BFs for lines from this level. The experimental A-values are given in Table 2, along with uncertainties and comparisons to calculations. The agreement with the values by Quinet et al. (1996) is within our uncertainties. We estimate the uncertainty of the BFs to 6-12%, including the uncertainties in the intensity measurement, calibration, reddening and residual lines.
Table 2: Experimentally determined transition probabilities compared to theoretical values from a 4G11/2.
4 Discussion
The relativistic Hartree-Fock (HFR) calculations by Quinet et al. (1996) show the best general
agreement with the experimental values
presented in this and previous studies. The agreement is good with the
exception of the b 2H11/2
level (Rostohar et al. 2001)
which differs by ![]() .
This deviation has been explained by Hartman
et al. 2003
as an effect of level mixing between the
b 2H11/2 and the
a 4G11/2 levels.
In addition, this mixing has been observed by Johansson (1978) through
unexpected spin forbidden spectral lines, e.g. the b 2H11/2-z 6F9/2
transition at 6269.97 Å.
.
This deviation has been explained by Hartman
et al. 2003
as an effect of level mixing between the
b 2H11/2 and the
a 4G11/2 levels.
In addition, this mixing has been observed by Johansson (1978) through
unexpected spin forbidden spectral lines, e.g. the b 2H11/2-z 6F9/2
transition at 6269.97 Å.
Comparison of the theoretical lifetime values in Table 1 for a 4G11/2 and b 2H11/2 indicate that the lifetime of the a 4G11/2 level should be approximately one tenth of the lifetime of b 2H11/2. However, the experimental values reveal that the a 4G11/2 level is only one fifth of the lifetime for b 2H11/2 indicating that the mixing effect can be observed in the lifetimes. Calculations are sensitive to level mixing and performing ab initio calculations which reproduce the mixing properties of the system is not trivial. This is illustrated in Nahar & Pradhan (1994), Nahar (1995), Hibbert & Corrégé (2005), Corrégé & Hibbert (2006) and Pickering et al. (2002). In particular, Pickering et al. (2002) emphasized that even though the agreement between the theoretical and experimental Fe II A-values investigated by Pickering et al. (2002) are in general extremely good, probabilities related to spin forbidden transitions that occur due to level mixing may differ by up to an order of magnitude.
AcknowledgementsThe authors acknowledge the help from the CRYRING staff. This work was supported by the Swedish Research Council (VR), the Swedish National Space Board (SNSB) and through a Linnaeus grant from VR. R.B.W. would like to acknowledge the European Commission for a Marie Curie Intra-European fellowship. This research has made use of the data archive for the HST Treasury Program on Eta Carinae (GO 9973) which is available online at http://etacar.umn.edu. The archive is supported by the University of Minnesota and the Space Telescope Science Institute under contract with NASA. In addition, we gratefully acknowledge the discussion with Prof. Selvelli on forbidden iron lines in RR Tel.
References
- Baschek, B., Garz, T., Holweger, H., & Richter J. 1970, A&A, 4, 229 [NASA ADS]
- Corrégé, G., & Hibbert, A. 2006, ApJ, 636, 1166 [NASA ADS] [CrossRef]
- Demtröder, W. 1996, Laser spectroscopy, Basic concepts and instrumentation, 2nd ed. (New York, Berlin: Springer)
- Garstang, R. H. 1962, MNRAS, 124, 321 [NASA ADS]
- Gurell, J., et al. 2007, Phys. Rev. A, 75, 052506 [NASA ADS] [CrossRef]
- Hartman, H., Derkatch, A., Donnelly, M. P., et al. 2003, A&A, 397, 1143 [NASA ADS] [CrossRef] [EDP Sciences]
- Hibbert, A., & Corrégé, G. 2005, Phys. Scr., T119, 61 [NASA ADS] [CrossRef]
- Johansson, S. 1978, Phys. Scr., 18, 217 [NASA ADS] [CrossRef]
- Johansson, S. 2009, Phys. Scr., T143, 014013 [NASA ADS] [CrossRef]
- Johansson, S., Derkatch, A., Donnelly, M. P., et al. 2002, Phys. Scr., T100, 71 [NASA ADS] [CrossRef]
- Kostyk, R. I., & Orlova, T. V. 1982, Astrometiya Astrofiz., 47, 32 [NASA ADS]
- Lidberg, J., Al-Khalili, A., Cowan, R. D., et al. 1997, Phys. Rev. A, 56, 4 [CrossRef]
- Lidberg, J., Al-Khalili, A., Norlin, L. O., et al. 1999, Nucl. Instrum. Methods Phys. Res. B, 152, 157 [NASA ADS] [CrossRef]
- Mannervik, S. 2003, Phys. Scr., T119, 49 [NASA ADS] [CrossRef]
- Mannervik, S., Ellmann, A., Lundin, P., et al. 2005, Phys. Scr., T105, 67 [CrossRef]
- Nahar, S. N. 1995, A&A, 293, 967 [NASA ADS]
- Nahar, S. N., & Pradhan, A. K. 1994, J. Phys. B, 27, 429 [NASA ADS] [CrossRef]
- Nussbaumer, H., Pettini, M., & Storey, P. J. 1981, A&A, 102, 351 [NASA ADS]
- Pickering, J. C., Donnelly, M. P., Nilsson, H., Hibbert, A., & Johansson, S. 2002, A&A, 396, 715 [NASA ADS] [CrossRef] [EDP Sciences]
- Quinet, P., Le Dourneuf, M., & Zeippen, C. J. 1996, A&AS, 120, 361 [NASA ADS] [CrossRef] [EDP Sciences]
- Ralchenko, Yu., Kramida, A. E., Reader, J., & NIST ASD Team (2008) NIST Atomic Spectra Database, version 3.1.5, http://physics.nist.gov/asd3; National Institute of Standards and Technology, Gaithersburg, MD
- Rostohar, D., Derkatch, A., Hartman, H., Johansson, S., Lundberg, H., et al. 2001, , 86, 8
- Royen, P., Gurell, J., Lundin, P., Norlin, L. O., & Mannervik, S. 2007, Phys. Rev. A, 76, 030502(R) [NASA ADS] [CrossRef]
- Sikström, C. M., Nilsson, H., Litzen, U., Blom, A., & Lundberg, H. 2002, J. Quant. Spec. Rad. Trans., 74, 355 [NASA ADS] [CrossRef]
- Taylor, B. N., & Kuyatt, C. E. 1994, NIST Technical Note 1297, Guidelines for evaluating and expressing the uncertainty of NIST measurement results, National Institute of Standards and Technology, USA, http://physics.nist.gov/Pubs/guidelines/
- Zethson, T. 2001, Ph.D. Thesis, Lund University
All Tables
Table 1: Experimentally determined lifetimes of metastable levels in Fe II. The uncertainties are given in brackets.
Table 2: Experimentally determined transition probabilities compared to theoretical values from a 4G11/2.
All Figures
|
|
Figure 1: Probing scheme for the two levels studied. The populations of the metastable levels, shown in the left side of the figure, were probed through excitation to the higher lying levels in the middle of figure. Once in the higher lying excited levels the populations decay to lower lying levels, shown in the right side of the figure. The intensity of this fluorescence is detected and used as a relative measurement of the original population of the metastable level under study. See the text for references to the cited A-values. |
| Open with DEXTER | |
| In the text | |
|
|
Figure 2: Observed population decay curve of the 3d6(3D)4s b 4D1/2 level. |
| Open with DEXTER | |
| In the text | |
|
|
Figure 3: Observed population decay curve of the 3d6(3G)4s a 4G11/2 level. |
| Open with DEXTER | |
| In the text | |
|
|
Figure 4: Stern-Vollmer plot showing the decay rate of the 3d6(3D)4s b4D1/2 level population as a function of pressure. |
| Open with DEXTER | |
| In the text | |
|
|
Figure 5: Stern-Vollmer plot showing the decay rate of the 3d6(3G)4s a4G11/2 level population as a function of pressure. |
| Open with DEXTER | |
| In the text | |
Copyright ESO 2009
Current usage metrics show cumulative count of Article Views (full-text article views including HTML views, PDF and ePub downloads, according to the available data) and Abstracts Views on Vision4Press platform.
Data correspond to usage on the plateform after 2015. The current usage metrics is available 48-96 hours after online publication and is updated daily on week days.
Initial download of the metrics may take a while.