| Issue |
A&A
Volume 508, Number 1, December II 2009
|
|
|---|---|---|
| Page(s) | 75 - 92 | |
| Section | Cosmology (including clusters of galaxies) | |
| DOI | https://doi.org/10.1051/0004-6361/200912501 | |
| Published online | 15 October 2009 | |
A&A 508, 75-92 (2009)
A search for steep spectrum radio relics and halos with the GMRT
R. J. van Weeren1 - H. J. A. Röttgering1 - M. Brüggen2 - A. Cohen3
1 - Leiden Observatory, Leiden University,
PO Box 9513, 2300 RA Leiden, The Netherlands
2 - Jacobs University Bremen, PO Box 750 561, 28725 Bremen, Germany
3 - Naval Research Laboratory, Code 7213, Washington, DC 20375, USA
Received 14 May 2009 / Accepted 7 October 2009
Abstract
Context. Diffuse radio emission, in the form of radio halos
and relics, traces regions in clusters with shocks or turbulence,
probably produced by cluster mergers. The shocks and turbulence are
important for the total energetics and detailed temperature
distribution within the intracluster medium (ICM). Only a small
fraction of clusters exhibit diffuse radio emission, whereas a large
majority of well-studied clusters shows clear substructure in the ICM.
Some models of diffuse radio emission in clusters indicate that
virtually all clusters should contain diffuse radio sources with a
steep spectrum. External accretion shocks associated with filamentary
structures of galaxies could also accelerate electrons to relativistic
energies and hence produce diffuse synchrotron emitting regions. The
detection of radio emission from such filaments is important for our
understanding of the origin of the Warm-Hot Intergalactic Medium
(WHIM), and relativistic electrons and magnetic fields in the cosmic
web. Here we report on Giant Metrewave Radio Telescope (GMRT)
observations of a sample of steep spectrum sources from the
74 MHz VLSS survey. These sources are diffuse on scales ![]()
![]() ,
and not clearly associated with nearby (
,
and not clearly associated with nearby (![]() )
galaxies.
)
galaxies.
Aims. The main aim of the observations is to search for diffuse radio emission associated with galaxy clusters or the cosmic web.
Methods. We have carried out GMRT 610 MHz continuum observations of unidentified diffuse steep spectrum sources.
Results. We have constructed a sample of diffuse steep spectrum
sources, selected from the 74 MHz VLSS survey. We identified eight
diffuse radio sources probably all located in clusters. We found five
radio relics, one cluster with a giant radio halo and a radio relic,
and one radio mini-halo. The giant radio halo has the highest radio
power (P1.4) known to date. By complementing our
observations with measurements from the literature we find correlations
between the physical size of relics and the spectral index, in the
sense that smaller relics have steeper spectra. Furthermore, larger
relics are mostly located in the outskirts of clusters while smaller
relics are located closer to the cluster center.
Key words: radio continuum: galaxies - galaxies: active - galaxies: clusters: general - cosmology: large-scale structure of Universe
1 Introduction
Studies of large-scale structure (LSS) formation have made significant advances during the last decade. It has been found that nearly all massive clusters have undergone at least several mergers in their history and that presently clusters are still in the process of accreting matter. A significant fraction of the accreting mass is in the form of (smaller) clusters and galaxy groups. Cluster mergers are the most energetic events in the present day Universe, with kinetic energies of the order of 1063-1064 erg, which are dissipated in giant shock waves and turbulence. An important aspect is the total energy budget and the detailed temperature distribution within the ICM, both of them are affected by the merger history of a cluster (e.g., Dolag et al. 2008).
Diffuse steep spectrum radio emission is observed in about 50 massive
merging and post-merging galaxy clusters (see the review by Ferrari et al. 2008,
and references therein). This diffuse emission is difficult to detect
due to its low surface brightness and steep spectral index![]() ,
so the fraction of clusters hosting diffuse radio emission is probably
larger than we currently know. The diffuse emission in clusters is
commonly divided into three main classes (Feretti & Giovannini 1996). Radio Halos are extended (
,
so the fraction of clusters hosting diffuse radio emission is probably
larger than we currently know. The diffuse emission in clusters is
commonly divided into three main classes (Feretti & Giovannini 1996). Radio Halos are extended (![]() 1 Mpc) diffuse unpolarized (
1 Mpc) diffuse unpolarized (![]()
![]() )
sources, located in the center of clusters. They have a regular smooth appearance, and follow the thermal X-ray emission. Radio Relics
are elongated structures with an irregular morphology, mostly located
in the periphery of clusters. Relics can be highly polarized (
)
sources, located in the center of clusters. They have a regular smooth appearance, and follow the thermal X-ray emission. Radio Relics
are elongated structures with an irregular morphology, mostly located
in the periphery of clusters. Relics can be highly polarized (![]() ). Several different subclasses have been identified (Kempner et al. 2004).
Most known radio relics and halos are found in clusters which show
signs of a current or recent merger. This supports the scenario in
which the relativistic electrons are accelerated by merger-induced
shocks or turbulence. However, Radio Mini-halos are not associated with merging clusters. They are found in the centers of cool core clusters (e.g., Peterson & Fabian 2006; Fabian et al. 1991) and are associated with the central cluster galaxy and typically have sizes
). Several different subclasses have been identified (Kempner et al. 2004).
Most known radio relics and halos are found in clusters which show
signs of a current or recent merger. This supports the scenario in
which the relativistic electrons are accelerated by merger-induced
shocks or turbulence. However, Radio Mini-halos are not associated with merging clusters. They are found in the centers of cool core clusters (e.g., Peterson & Fabian 2006; Fabian et al. 1991) and are associated with the central cluster galaxy and typically have sizes ![]() 500 kpc, with the diffuse emission surrounding the central cluster galaxy (e.g., Govoni et al. 2009).
500 kpc, with the diffuse emission surrounding the central cluster galaxy (e.g., Govoni et al. 2009).
Two different mechanisms for in-situ acceleration of particles have been proposed to explain relics in clusters: (i) adiabatic compression of fossil radio plasma by a passing shock wave producing a so called radio ``phoenix'' (Enßlin & Brüggen 2002; Enßlin & Gopal-Krishna 2001), or (ii) diffusive shock acceleration (DSA) by the Fermi-I process (e.g., Blandford & Eichler 1987; Jones & Ellison 1991; Malkov & O'C Drury 2001; Ensslin et al. 1998; Drury 1983). In the first scenario, radio relics should have toroidal and complex filamentary morphologies. These relics are capable of producing very steep, curved radio spectra due to inverse Compton (IC) and synchrotron losses. In the DSA scenario the electrons are accelerated by multiple crossings of the shock front (in a first order Fermi process). These relics have large sizes (Mpc) and are direct tracers of shock fronts in clusters. The spectral index is determined by the balance between the continuous acceleration at the shock front and energy losses in the post-shock region.
The diffuse emission within clusters reveals the presence of relativistic electrons and magnetic fields on scales ![]() 1 Mpc.
Spectral aging, due to synchrotron and IC losses of the emitting
electrons may explain the steep spectra. If the electrons are injected
via Fermi acceleration (DSA), their energy follows a power-law
distribution. The power-law index of the injected electrons is related
to the Mach number of the shocks (e.g., Hoeft & Brüggen 2007): shocks with a low Mach number have steeper radio spectra.
Clearly, low-frequency surveys are needed to locate and study these sources (Cassano et al. 2006,2008,2007). Interestingly, Brunetti et al. (2008)
discovered a radio halo in the cluster Abell 521, which
was previously known to host a radio relic, with a spectral index of
1 Mpc.
Spectral aging, due to synchrotron and IC losses of the emitting
electrons may explain the steep spectra. If the electrons are injected
via Fermi acceleration (DSA), their energy follows a power-law
distribution. The power-law index of the injected electrons is related
to the Mach number of the shocks (e.g., Hoeft & Brüggen 2007): shocks with a low Mach number have steeper radio spectra.
Clearly, low-frequency surveys are needed to locate and study these sources (Cassano et al. 2006,2008,2007). Interestingly, Brunetti et al. (2008)
discovered a radio halo in the cluster Abell 521, which
was previously known to host a radio relic, with a spectral index of ![]() -2.1, suggesting the existence of a population of diffuse source in clusters with spectral indices <-1.5.
-2.1, suggesting the existence of a population of diffuse source in clusters with spectral indices <-1.5.
Table 1: Source properties and results.
Numerical simulations show the development of various types of shocks during structure formation (Miniati et al. 2000). These shocks differ in their location with respect to the cluster center and Mach numbers (Vazza et al. 2009; Ryu et al. 2003; Miniati et al. 2000; Miniati 2002; Pfrommer et al. 2006). External accretion shocks have
![]() and process the low-density, unshocked intergalactic medium (IGM). This
results in relatively flat spectral indices of about -0.5 at the
location of the shock front. Further away from the shock front the
spectral index steepens due to synchrotron and IC losses. Internal
shocks, (i.e., merger and flow shocks) occur within the cluster. The
Mach numbers of these shocks are lower resulting in steeper spectral
indices. Binary merger shocks are the result of a cluster merging with
a another cluster or a large sub-structure. In this case a double radio
relic is expected (e.g., Roettiger et al. 1999; Hoeft et al. 2008; van Weeren et al. 2009a).
and process the low-density, unshocked intergalactic medium (IGM). This
results in relatively flat spectral indices of about -0.5 at the
location of the shock front. Further away from the shock front the
spectral index steepens due to synchrotron and IC losses. Internal
shocks, (i.e., merger and flow shocks) occur within the cluster. The
Mach numbers of these shocks are lower resulting in steeper spectral
indices. Binary merger shocks are the result of a cluster merging with
a another cluster or a large sub-structure. In this case a double radio
relic is expected (e.g., Roettiger et al. 1999; Hoeft et al. 2008; van Weeren et al. 2009a).
As pointed out by Cen & Ostriker (1999), hydrodynamic models indicate that up to half of the baryons at present time should have temperatures in the range of 105-107 K. Unfortunately, studying the abundance and distribution of this WHIM is very challenging, since its main tracers are highly excited Oxygen lines which are difficult to observe (e.g., Nicastro et al. 2005). A fraction of the accretion shocks will be supersonic and can accelerate energetic electrons up to energies of 1018-1019 eV (e.g., Norman et al. 1995; Kang et al. 1996; Inoue et al. 2008). In the presence of magnetic fields, such electrons will emit faint diffuse synchrotron radiation. The detection of these radio filaments is very important as this would provide a probe of the WHIM. Recent magnetohydrodynamical modeling indicates that detecting radio emission from the filamentary cosmic web should be possible (e.g., Keshet et al. 2004; Hoeft & Brüggen 2007). Pfrommer (2008); Hoeft et al. (2008); Pfrommer et al. (2008) however find that in the outskirts of clusters (at a few times the virial radius) or filaments, external accretion shocks cause little radio emission, owing to the low density of both magnetic field energy and cosmic ray (CR) particles there (Miniati et al. 2001). They are therefore difficult to detect even with the sensitivity of upcoming radio telescopes such as LOFAR. Relic emission from internal accretion shocks occur in a higher density environment so that they should be detected with current radio facilities.
When searching for radio halos, relics and filaments in low-frequency
radio surveys, various other steep spectrum sources are also present.
These include ultra-steep (angular size ![]()
![]() )
spectrum sources (USS, see Miley & De Breuck 2008, for a review) associated with high-z radio galaxies (HzRG), ``fossil'' or ``dying'' FR-I (Fanaroff & Riley 1974)
radio sources, and ``head-tail'' sources, the last two having a steep
spectrum due to spectral aging of the radio emission. In
high-resolution (
)
spectrum sources (USS, see Miley & De Breuck 2008, for a review) associated with high-z radio galaxies (HzRG), ``fossil'' or ``dying'' FR-I (Fanaroff & Riley 1974)
radio sources, and ``head-tail'' sources, the last two having a steep
spectrum due to spectral aging of the radio emission. In
high-resolution (![]()
![]() )
observations, for example at 1.4 GHz with the Very Large Array
(VLA), diffuse objects will be resolved out due to missing short
baselines. This provides a method for selecting diffuse radio sources
associated with galaxy clusters or the cosmic web. FR-I sources can be
partly excluded by removing sources that are clearly associated with
individual galaxies.
)
observations, for example at 1.4 GHz with the Very Large Array
(VLA), diffuse objects will be resolved out due to missing short
baselines. This provides a method for selecting diffuse radio sources
associated with galaxy clusters or the cosmic web. FR-I sources can be
partly excluded by removing sources that are clearly associated with
individual galaxies.
The 74 MHz VLA low-frequency Sky Survey (VLSS), Cohen et al. (2007), covers about ![]() steradians of sky north of
steradians of sky north of
![]() .
The resolution of the survey is 80
.
The resolution of the survey is 80
![]() (FWHM) and the rms noise level is about 0.1 Jy beam-1. The source catalog contains roughly 70 000 sources with a point source detection limit of 0.7 Jy beam-1. A new calibration algorithm (Cotton et al. 2004)
was used to remove the ionospheric distortions, which can be severe at
this low-frequency. The 1.4 GHz NRAO VLA Sky Survey (NVSS), Condon et al. (1998), covers the entire sky above
(FWHM) and the rms noise level is about 0.1 Jy beam-1. The source catalog contains roughly 70 000 sources with a point source detection limit of 0.7 Jy beam-1. A new calibration algorithm (Cotton et al. 2004)
was used to remove the ionospheric distortions, which can be severe at
this low-frequency. The 1.4 GHz NRAO VLA Sky Survey (NVSS), Condon et al. (1998), covers the entire sky above
![]() .
The NVSS images have a rms noise of about 0.45 mJy beam-1, and a resolution of 45
.
The NVSS images have a rms noise of about 0.45 mJy beam-1, and a resolution of 45
![]() (FWHM). The catalog contains about
(FWHM). The catalog contains about
![]() sources above a flux of
sources above a flux of ![]() 2.5 mJy.
2.5 mJy.
In this paper we present radio continuum observations of 26 diffuse (angular size ![]()
![]() )
steep spectrum sources selected from the VLSS survey with the GMRT at
610 MHz. The main aim of this project is to determine the
morphology of the sources and search for diffuse structures which could
be associated with shock fronts or turbulence in clusters, and
accretion shocks onto filaments of galaxies.
)
steep spectrum sources selected from the VLSS survey with the GMRT at
610 MHz. The main aim of this project is to determine the
morphology of the sources and search for diffuse structures which could
be associated with shock fronts or turbulence in clusters, and
accretion shocks onto filaments of galaxies.
The layout of this paper is as follows. In Sect. 2 we discuss the sample selection, this is followed by an overview of the observations and data reduction in Sect. 3. In Sect. 4 we present the radio maps of the most interesting sources and discuss these sources individually. By combining our radio observations with data from the literature (X-ray and optical observations) we have tried to classify the sources. In Sect. 5, spectral indices are modeled using our flux measurements combined with literature values. We end with a discussion and conclusions in Sects. 6 and 7.
Throughout this paper we assume a ![]() CDM cosmology with
H0 = 71 km s-1 Mpc-1,
CDM cosmology with
H0 = 71 km s-1 Mpc-1,
![]() ,
and
,
and
![]() .
.
2 Sample selection
Spectral indices (between 1400 and 74 MHz) were calculated for all sources in the VLSS survey. We selected sources with
![]() which resulted in a total of 176 sources. This cutoff is somewhat
arbitrary, but a significant lower cutoff resulted in a very small
number of sources selected while a higher cutoff would select too many
sources for follow-up observations. VLA B-array 1.4 GHz
which resulted in a total of 176 sources. This cutoff is somewhat
arbitrary, but a significant lower cutoff resulted in a very small
number of sources selected while a higher cutoff would select too many
sources for follow-up observations. VLA B-array 1.4 GHz ![]() 5 min
snapshot observations were carried out on March 25-29 and
May 10, 2005 of a subsample of 68 from the 176 sources. Two
intermediate frequencies (IFs) with a bandwidth of 50 MHz each
were used, centered at 1385 and 1465 MHz. From this
68 sources, 36 were found to be resolved out. This showed that
these sources had extended emission on scales
5 min
snapshot observations were carried out on March 25-29 and
May 10, 2005 of a subsample of 68 from the 176 sources. Two
intermediate frequencies (IFs) with a bandwidth of 50 MHz each
were used, centered at 1385 and 1465 MHz. From this
68 sources, 36 were found to be resolved out. This showed that
these sources had extended emission on scales ![]()
![]() .
From the 36 sources 13 were identified with known nearby galaxies. The
remaining 23 sources were included in the sample. We have also searched
for additional sources with
.
From the 36 sources 13 were identified with known nearby galaxies. The
remaining 23 sources were included in the sample. We have also searched
for additional sources with
![]() ,
by making use of the 1.4 GHz FIRST survey (5
,
by making use of the 1.4 GHz FIRST survey (5
![]() FWHM, Becker et al. 1995).
Sources with a FIRST flux at least 8 times lower than the
1.4 GHz NVSS flux were initially selected and visually inspected
to remove obvious double lobe sources. The spectral index cutoff of
-1.15 was chosen because higher values resulted in too many double
lobes to be selected for visual inspection. Furthermore, most known
radio halos and relics have spectral indices steeper than this value.
The amount of flux resolved out in the selection criterium was a
tradeoff as lower values also resulted in too many sources to be
selected for visual inspection. After visual inspection we found three
additional sources which showed the presence of diffuse emission. None
of these sources were clearly associated with nearby individual
galaxies in the POSS-II or SDSS surveys (Abazajian et al. 2009). The final list of sources and their coordinates are given in Table 1.
FWHM, Becker et al. 1995).
Sources with a FIRST flux at least 8 times lower than the
1.4 GHz NVSS flux were initially selected and visually inspected
to remove obvious double lobe sources. The spectral index cutoff of
-1.15 was chosen because higher values resulted in too many double
lobes to be selected for visual inspection. Furthermore, most known
radio halos and relics have spectral indices steeper than this value.
The amount of flux resolved out in the selection criterium was a
tradeoff as lower values also resulted in too many sources to be
selected for visual inspection. After visual inspection we found three
additional sources which showed the presence of diffuse emission. None
of these sources were clearly associated with nearby individual
galaxies in the POSS-II or SDSS surveys (Abazajian et al. 2009). The final list of sources and their coordinates are given in Table 1.
3 Observations and data reduction
High-sensitivity radio observations at 610 MHz were carried out
with the GMRT in February and November 2008 of a sample
of 26 diffuse steep spectrum radio sources. We divided a
total 102 h of observation time evenly between the 26 sources. A
total of 32 MHz bandwidth was recorded, using both the upper (USB)
and lower sidebands (LSB) which included both RR and LL polarizations.
The data were collected in spectral line mode with 128 channels
per sideband (IF), resulting in a spectral resolution of 125 kHz
per channel. To increase UV-coverage we cycled between various sources,
typically spending 40 min on a sources before moving to the next
source. However, due to scheduling constraints it was only possible to
do this for about half of our sources. The observations resulted in a
net on-source time of ![]() 3 h, after flagging certain time-ranges which were affected by radio frequency interference (RFI) or had other problems.
3 h, after flagging certain time-ranges which were affected by radio frequency interference (RFI) or had other problems.
The data were reduced and analyzed with the NRAO Astronomical Image Processing System (AIPS) package. Bandpass calibration was carried out using the standard flux calibrators: 3C48, 3C147, and 3C286. Fluxes of 29.43 Jy (3C48), 38.26 Jy (3C147), and 21.07 Jy (3C286) at 610 MHz were assigned to these sources using the Perley & Taylor (1999) extension to the Baars et al. (1977) scale. A set of 6 channels free of RFI was taken to normalize the bandpass (channel 15-20) for each antenna. Strong RFI was removed automatically (with the AIPS task ``FLGIT''). The data was then visually inspected for remaining low-level RFI using the AIPS tasks ``SPFLG'' and ``TVFLG''. After that an initial phase and amplitude calibration was carried out using the bandpass and secondary calibrators, where we also transferred the flux densities from the primary calibrators to the secondary calibrators. The found solutions were then transferred to the target sources. We have not chosen to average any channels in order to minimize the effects of bandwidth smearing and to aid further removal of RFI. The first and last few channels of the data were discarded as they were noisy.
For making images we used the polyhedron method (Perley 1989; Cornwell & Perley 1992)
to minimize the effects of non-coplanar baselines. Both USB and LSB
were simultaneously gridded, imaged and cleaned. We used a total of 199
facets to cover ![]() 2 times
the full primary beam. This made the removal of sidelobes from strong
sources far away from the field center possible. After a first round of
imaging, in some cases ``ripples'' were seen in the maps which were
subsequently removed after identifying the corresponding baseline(s).
Several rounds of phase self-calibration were carried out before doing
a final amplitude and phase selfcalibration. Images were made using
robust weighting (robust = 0.5, Briggs 1995)
and corrected for the primary beam attenuation. Images were cleaned to
3 times the rms noise level to minimize clean bias effects.
2 times
the full primary beam. This made the removal of sidelobes from strong
sources far away from the field center possible. After a first round of
imaging, in some cases ``ripples'' were seen in the maps which were
subsequently removed after identifying the corresponding baseline(s).
Several rounds of phase self-calibration were carried out before doing
a final amplitude and phase selfcalibration. Images were made using
robust weighting (robust = 0.5, Briggs 1995)
and corrected for the primary beam attenuation. Images were cleaned to
3 times the rms noise level to minimize clean bias effects.
The thermal noise in each map is expected![]() to be
to be
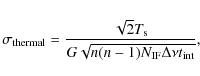
|
(1) |
with
4 Results
All sources, except VLSS J2229.1-0136, were detected in
the GMRT images. The NVSS counterpart of VLSS J2229.1-0136
has a position offset of about 40
![]() ,
the flux density in the NVSS and VLSS surveys of these sources is also
close to the detection threshold. We therefore conclude that
VLSS J2229.1-0136 is most likely a noise peak as the
GMRT observations should have easily detected the source. From here on
we have left out VLSS J2229.1-0136 in the further
discussions.
A summary of the beam parameters and noise levels for the maps is given
in Table 1.
To identify optical counterparts overlays were made using SDSS and
POSS-II images. Spectroscopic redshifts were included from the
literature. For sources without a spectroscopic redshift, but having
SDSS DR7 coverage we took the SDSS photometric redshift. For other
sources we used that K and R magnitudes of massive elliptical galaxies correlate with redshift (K-z and R-z relations, e.g., de Vries et al. 2007; Willott et al. 2003).
,
the flux density in the NVSS and VLSS surveys of these sources is also
close to the detection threshold. We therefore conclude that
VLSS J2229.1-0136 is most likely a noise peak as the
GMRT observations should have easily detected the source. From here on
we have left out VLSS J2229.1-0136 in the further
discussions.
A summary of the beam parameters and noise levels for the maps is given
in Table 1.
To identify optical counterparts overlays were made using SDSS and
POSS-II images. Spectroscopic redshifts were included from the
literature. For sources without a spectroscopic redshift, but having
SDSS DR7 coverage we took the SDSS photometric redshift. For other
sources we used that K and R magnitudes of massive elliptical galaxies correlate with redshift (K-z and R-z relations, e.g., de Vries et al. 2007; Willott et al. 2003).
We have also checked for any X-ray counterparts to the radio sources. In the next subsection we describe the most interesting sources that appear to be related to shocks or turbulence in clusters or filaments. The other sources are discussed in Appendix A.
4.1 Individual sources
4.1.1 VLSS J1133.7+2324
![\begin{figure}
\par\includegraphics[angle=90,width=8.8cm,clip]{12501f1}
\end{figure}](/articles/aa/full_html/2009/46/aa12501-09/img101.png)
|
Figure 1:
GMRT 610 MHz radio map. The Gaussian beam size is shown at the bottom left corner. Contour levels are drawn at
|
| Open with DEXTER | |
![\begin{figure}
\par\includegraphics[angle=90,width=8.8cm,clip]{12501f2}
\end{figure}](/articles/aa/full_html/2009/46/aa12501-09/img102.png)
|
Figure 2:
SDSS r band image overlaid with GMRT 610 MHz contours. Contour levels are drawn at
|
| Open with DEXTER | |
The radio emission shows two parallel filamentary structures and a
northern patch of diffuse emission connected with the western
filamentary component. Some faint radio emission is extending towards
the west. This extension coincides with the galaxy
UGC 6544 (MCG+04-27-065; PGC 35694)
located a z=0.02385 (Haynes et al. 1997). This galaxy was classified as a Sbc spiral by Nilson (1973) and Paturel et al. (2003). The source is also listed in the IRAF Faint Source Catalog (F11311+2341) and detected at 60 and 100 ![]() m (Moshir et al. 1990). The galaxy has been included in 21 cm hydrogen emission line surveys. Springob et al. (2005) give a self-absorption corrected line flux of
m (Moshir et al. 1990). The galaxy has been included in 21 cm hydrogen emission line surveys. Springob et al. (2005) give a self-absorption corrected line flux of
![]() Jy km s-1 and a line-width of
Jy km s-1 and a line-width of ![]() km s-1.The galaxy also has a small UV-excess (Miyauchi-Isobe & Maehara 2002).
km s-1.The galaxy also has a small UV-excess (Miyauchi-Isobe & Maehara 2002).
Using the IRAS fluxes we can estimate the star forming rate (SFR) in this galaxy (Solomon et al. 1997) by calculating the Far Infrared Luminosity (
![]() )
)
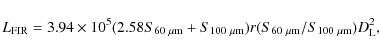
|
(2) |
with
The galaxy is unlikely to be associated with the filamentary radio
structure to the east, given the above calculation, the steep spectral
index, morphology, and spatial offset. In the background (partly behind
the spiral galaxy) there is an overdensity of faint red galaxies. These
have a median photometric redshift of about 0.6 (SDSS DR7) and follow
roughly the filamentary radio source. This is probably a cluster or a
galaxy filament, with the foreground galaxy hiding part of the
cluster/filament. Based on the morphology, the radio source is then
classified as a relic. If the steep spectrum radio source is located at
a distance of z = 0.6, the LAS of 84
![]() corresponds to a physical size of of 660 kpc.
corresponds to a physical size of of 660 kpc.
4.1.2 VLSS J1431.8+1331
![\begin{figure}
\par\includegraphics[angle=90,width=8.8cm,clip]{12501f3}
\end{figure}](/articles/aa/full_html/2009/46/aa12501-09/img116.png)
|
Figure 3: GMRT 610 MHz radio map. Contour levels are drawn as in Fig. 1. |
| Open with DEXTER | |
![\begin{figure}
\par\includegraphics[angle=90,width=8.8cm,clip]{12501f4}
\end{figure}](/articles/aa/full_html/2009/46/aa12501-09/img117.png)
|
Figure 4: SDSS r band image overlaid with GMRT 610 MHz contours. Contour levels are drawn as in Fig. 2. |
| Open with DEXTER | |
The western fainter component does not seem to be associated with any galaxy. The source could either be remnant radio emission from a previous AGN episode or the signature of a shock wave. In the former case, the spectral index should be steeper then eastern component because of spectral aging.
4.1.3 VLSS J2217.5+5943, 24P73
![\begin{figure}
\par\includegraphics[angle=90,width=8.8cm,clip]{12501f5}
\end{figure}](/articles/aa/full_html/2009/46/aa12501-09/img118.png)
|
Figure 5: GMRT 610 MHz radio map. Contour levels are drawn as in Fig. 3. |
| Open with DEXTER | |
This source was found to have an ultra-steep spectrum (
![]() )
by the Synthesis Telescope of the Dominion Radio Observatory (DRAO) Galactic plane survey at 408 MHz and 1.42 GHz (Joncas & Higgs 1990; Higgs 1989). Since this source was located in the galactic plane, Joncas & Higgs (1990)
suggested the sources might be a pulsar. However, they noted that the
source seemed to be slightly extended at 408 MHz. At 1.42 GHz
the source was resolved into two distinct components. Both of these
components were also listed as a single source 25P23. The
source was also detected in the 38 MHz 8C survey (Rees 1990; Hales et al. 1995). Subsequent L-band (1.4 GHz) and X-band (8.4 GHz) observations with the VLA by Green & Joncas (1994),
separated the source clearly into two components. A compact northern
component and a southern diffuse component. The X-band observations
only detected the northern component. By comparing the fluxes of the
VLA and DRAO observations they concluded that the southern diffuse
component had an ultra-steep spectrum and provided the bulk of the
emission at low frequencies. Since the source was resolved this ruled
out a pulsar identification. In fact it was suggested that this source
might be a radio halo or relic located in a galaxy cluster behind the
galactic plane.
)
by the Synthesis Telescope of the Dominion Radio Observatory (DRAO) Galactic plane survey at 408 MHz and 1.42 GHz (Joncas & Higgs 1990; Higgs 1989). Since this source was located in the galactic plane, Joncas & Higgs (1990)
suggested the sources might be a pulsar. However, they noted that the
source seemed to be slightly extended at 408 MHz. At 1.42 GHz
the source was resolved into two distinct components. Both of these
components were also listed as a single source 25P23. The
source was also detected in the 38 MHz 8C survey (Rees 1990; Hales et al. 1995). Subsequent L-band (1.4 GHz) and X-band (8.4 GHz) observations with the VLA by Green & Joncas (1994),
separated the source clearly into two components. A compact northern
component and a southern diffuse component. The X-band observations
only detected the northern component. By comparing the fluxes of the
VLA and DRAO observations they concluded that the southern diffuse
component had an ultra-steep spectrum and provided the bulk of the
emission at low frequencies. Since the source was resolved this ruled
out a pulsar identification. In fact it was suggested that this source
might be a radio halo or relic located in a galaxy cluster behind the
galactic plane.
GMRT observations of 24P73 show a complex filamentary source. The source has some similarities with the relic sources in Abell 85 and Abell 133 (Slee et al. 2001). POSS-II and 2MASS images covering the area do not show the presence of any cluster. However this is not unexpected given the extinction of AB=6.7 (Schlegel et al. 1998). Given the steep spectral index and morphology we conclude that the sources is a radio relic. Deep NIR imaging will be necessary to identify the galaxy cluster associated with the relic.
4.1.4 VLSS J0004.9-3457
![\begin{figure}
\par\includegraphics[angle=90,width=8.8cm,clip]{12501f6}
\end{figure}](/articles/aa/full_html/2009/46/aa12501-09/img120.png)
|
Figure 6: GMRT 610 MHz radio map. Contour levels are drawn as in Fig. 1. |
| Open with DEXTER | |
![\begin{figure}
\par\includegraphics[angle=90,width=8.8cm,clip]{12501f7}
\end{figure}](/articles/aa/full_html/2009/46/aa12501-09/img121.png)
|
Figure 7: POSS-II red image overlaid with GMRT 610 MHz contours. Contour levels are drawn as in Fig. 2. |
| Open with DEXTER | |
4.1.5 VLSS J0717.5+3745, MACS J0717.5+3745
The radio source is associated with the massive X-ray luminous cluster MACS J0717.5+3745 at z=0.5548, with an overall ICM temperature of 11.6 keV (Ebeling et al. 2001; Edge et al. 2003; Ebeling et al. 2007). The cluster shows a pronounced substructure in optical images. Ebeling et al. (2004)
reported the discovery of a large-scale filamentary structure of
galaxies connected to the cluster. NVSS, WENSS and VLSS images reveal
the presence of a steep-spectrum radio source (
![]() ). The radio source was classified as a radio relic by Edge et al. (2003). Ma et al. (2009)
presented X-ray (Chandra) and optical observations (Hubble Space
Telescope, ACS; Keck-II, DEIMOS) of the cluster. They found the cluster
to be an active triple merger. Temperatures in the cluster exceeding
20 keV were found in some regions. Regions with a lower
temperature of
). The radio source was classified as a radio relic by Edge et al. (2003). Ma et al. (2009)
presented X-ray (Chandra) and optical observations (Hubble Space
Telescope, ACS; Keck-II, DEIMOS) of the cluster. They found the cluster
to be an active triple merger. Temperatures in the cluster exceeding
20 keV were found in some regions. Regions with a lower
temperature of ![]() 5 keV were found at the position of two subclusters, probably remnants of cool cores.
5 keV were found at the position of two subclusters, probably remnants of cool cores.
![\begin{figure}
\par\includegraphics[angle=90,width=8.8cm,clip] {12501f8}
\end{figure}](/articles/aa/full_html/2009/46/aa12501-09/img130.png)
|
Figure 8: GMRT 610 MHz radio map. Contour levels are drawn as in Fig. 1. |
| Open with DEXTER | |
![\begin{figure}
\par\includegraphics[angle=90,width=8.8cm,clip]{12501f9}
\end{figure}](/articles/aa/full_html/2009/46/aa12501-09/img131.png)
|
Figure 9:
Chandra X-ray map overlaid with radio contours at 610 MHz from the
GMRT. The color scale represents the X-ray emission from
0.5-7.0 keV. The image has been adaptively smoothed using the TARA
(http://www.astro.psu.edu/xray/docs/TARA) package using a minimal significance of 5. Contour levels are drawn at
[1, 2, 4, 8, 16, 32, ...]
|
| Open with DEXTER | |
![\begin{figure}
\par\includegraphics[angle=90,width=8.8cm,clip]{12501f10}
\end{figure}](/articles/aa/full_html/2009/46/aa12501-09/img132.png)
|
Figure 10: HST F814W ACS image overlaid with GMRT 610 MHzcontours. Contour levels are drawn as in Fig. 2. |
| Open with DEXTER | |
Here we shortly describe our results for this cluster, a more detailed
analysis in combination with additional archival VLA observations has
been presented in a separate paper (van Weeren et al. 2009b), see also Bonafede et al. (2009a).
Our radio maps reveal a complex source, consisting of different
components. The main component is a twisted structure, with enhanced
regions of radio emission in the north and southwest of the cluster.
These regions are connected by two bridges of emission to a bright
central elongated source. The structure has a linear size of
700 kpc. No obvious counterparts are visible for both the north
and south-west components. The presence of the two radio bridges
suggest a relation with the central component. Although, no obvious
counterpart was found for the central component by Edge et al. (2003), we identify an elliptical galaxy at RA 07![]() 17
17![]() 35
35
![]() 5, Dec +37$^$45
5, Dec +37$^$45![]() 05
05
![]() 5
as a possible counterpart. If this is indeed the case then the source
could be a wide-angle tail (WAT) source with the two bridges being the
tails of the central source and the north and south-west components the
hotspots. The eastern boundary of the structure is sharp, while on the
other side some faint emission is seen extending further westwards.
Diffuse radio emission is also seen to the south of the main structure.
The diffuse emission within the cluster has a total size of about
1.2 Mpc and given that it roughly follows the X-ray emission we
classify it as a radio halo. Clearly, the emission is not associated
with individual sources. Using a spectral index of -1.2, typical for
radio halos, we estimate the radio power (P1.4) to be
5
as a possible counterpart. If this is indeed the case then the source
could be a wide-angle tail (WAT) source with the two bridges being the
tails of the central source and the north and south-west components the
hotspots. The eastern boundary of the structure is sharp, while on the
other side some faint emission is seen extending further westwards.
Diffuse radio emission is also seen to the south of the main structure.
The diffuse emission within the cluster has a total size of about
1.2 Mpc and given that it roughly follows the X-ray emission we
classify it as a radio halo. Clearly, the emission is not associated
with individual sources. Using a spectral index of -1.2, typical for
radio halos, we estimate the radio power (P1.4) to be
![]() W Hz-1. This makes it the most powerful radio known to date, in agreement with the X-ray luminosity-radio power (
W Hz-1. This makes it the most powerful radio known to date, in agreement with the X-ray luminosity-radio power (
![]() )
and temperature-radio power (T-P1.4) correlations (Cassano et al. 2006; Liang et al. 2000; Enßlin & Röttgering 2002).
)
and temperature-radio power (T-P1.4) correlations (Cassano et al. 2006; Liang et al. 2000; Enßlin & Röttgering 2002).
Towards the south a fainter linear structure is seen. A compact core,
located halfway the linear structure is associated with a bright
elliptical foreground galaxy (RA 07![]() 17
17![]() 37
37
![]() 2, Dec +37$^$44
2, Dec +37$^$44![]() 23
23
![]() ). The source is probably a FR-I source associated with the compact core.
). The source is probably a FR-I source associated with the compact core.
Interestingly, the main twisted radio structure is located in between
the brightest X-ray emission of the cluster. The main cool core visible
in the X-ray image has no radio emission associated with it. The
central radio structure also coincides with regions having a
significantly higher X-ray temperature ![]() 15 keV.
The ICM temperature and X-ray morphology of the cluster favor of a
relic-like interpretation. We therefore conclude that the twisted radio
structure is a giant relic tracing a shock front linked to the merger
activity of the system.
15 keV.
The ICM temperature and X-ray morphology of the cluster favor of a
relic-like interpretation. We therefore conclude that the twisted radio
structure is a giant relic tracing a shock front linked to the merger
activity of the system.
4.1.6 VLSS J0915.7+2511
![\begin{figure}
\par\includegraphics[angle=90,width=8.8cm,clip]{12501f11}
\end{figure}](/articles/aa/full_html/2009/46/aa12501-09/img137.png)
|
Figure 11: GMRT 610 MHz radio map. Contour levels are drawn as in Fig. 1. |
| Open with DEXTER | |
![\begin{figure}
\par\includegraphics[angle=90,width=8.8cm,clip]{12501f12}
\end{figure}](/articles/aa/full_html/2009/46/aa12501-09/img138.png)
|
Figure 12: SDSS r band image overlaid with GMRT 610 MHz contours. Contour levels are drawn as in Fig. 2. |
| Open with DEXTER | |
The radio map shows a diffuse region of emission associated with a
cluster of galaxies (MaxBCG J138.91895+25.19876) at a
redshift of 0.324. The radio source consists of a northern component
and a fainter southern one. To the west a source is associated with an
elliptical galaxy (RA 09![]() 15
15![]() 39
39
![]() 7, Dec +25$^$11
7, Dec +25$^$11![]() 37
37
![]() ).
A few possible counterparts are visible in SDSS DR7 images for the
northern diffuse component. The southern diffuse component has no
obvious optical counterpart. This could be a radio relic with a
projected size of about 190 kpc. High-resolution observations will
be needed to confirm this interpretation.
).
A few possible counterparts are visible in SDSS DR7 images for the
northern diffuse component. The southern diffuse component has no
obvious optical counterpart. This could be a radio relic with a
projected size of about 190 kpc. High-resolution observations will
be needed to confirm this interpretation.
4.1.7 VLSS J1515.1+0424, Abell 2048
The radio image shows a filamentary radio source in the periphery of
the cluster Abell 2048 at a redshift of 0.0972. The
source consists of three elongated structures orientated roughly
east-west. The three structures connect to the east. The source could
be a complex double WAT source. However, the radio structure itself
does not seem to be connected to any particular galaxy. The source has
a projected size of 310 kpc, if located in the cluster. In the
southeast a compact double-lobe source is associated with a large
elliptical galaxy (RA 15![]() 15
15![]() 14
14
![]() 1, Dec +04$^$23
1, Dec +04$^$23![]() 10
10
![]() )
located in the cluster. On the other side of the cluster a 0.19 Jy
source (PMN J1515+0421) limits the dynamic range. The
cluster is also detected in X-rays as RX J1515.2+0421 (Bade et al. 1998). A substructure on the east-side of the main cluster is visible, hinting at a possible cluster merger, see Fig. 15.
Given the location of the radio source at the edge of the cluster, the
lack of a connection with a single optical counterpart, the steep radio
spectrum, and the morphology, we classify the source as a peripheral
radio relic.
)
located in the cluster. On the other side of the cluster a 0.19 Jy
source (PMN J1515+0421) limits the dynamic range. The
cluster is also detected in X-rays as RX J1515.2+0421 (Bade et al. 1998). A substructure on the east-side of the main cluster is visible, hinting at a possible cluster merger, see Fig. 15.
Given the location of the radio source at the edge of the cluster, the
lack of a connection with a single optical counterpart, the steep radio
spectrum, and the morphology, we classify the source as a peripheral
radio relic.
![\begin{figure}
\par\includegraphics[angle=90,width=8.8cm,clip] {12501f13}
\end{figure}](/articles/aa/full_html/2009/46/aa12501-09/img139.png)
|
Figure 13: GMRT 610 MHz radio map. Contour levels are drawn as in Fig. 1. |
| Open with DEXTER | |
![\begin{figure}
\par\includegraphics[angle=90,width=8.8cm,clip]{12501f14}
\end{figure}](/articles/aa/full_html/2009/46/aa12501-09/img140.png)
|
Figure 14: SDSS r band image overlaid with GMRT 610 MHz contours. Contour levels are drawn as in Fig. 2. |
| Open with DEXTER | |
![\begin{figure}
\par\includegraphics[angle=90,width=8.8cm,clip]{12501f15}
\end{figure}](/articles/aa/full_html/2009/46/aa12501-09/img141.png)
|
Figure 15:
X-ray emission from ROSAT in the 0.1-2.0 keV energy band. The image has been convolved with a circular Gaussian of 225
|
| Open with DEXTER | |
5 Spectral index modeling
Radio spectra can be an important tool to understand the origin of the relativistic electrons and to determine the age of the radio emitting plasma. We have combined our flux measurements at 610 MHz with literature values to determine the radio spectra for the sources in our sample. We have included flux measurements from the following surveys: 38 MHz 8C (Rees 1990; Hales et al. 1995), 74 MHz VLSS, 151 MHz 7C (Hales et al. 2007; Waldram et al. 1996), 232 MHz Miyun (Zhang et al. 1997), 325 MHz WENSS (Rengelink et al. 1997), 352 MHz WISH (De Breuck et al. 2002a), 365 MHz TEXAS (Douglas et al. 1996) and 1400 MHz NVSS.
We model the integrated radio spectra using the Jaffe-Perola (JP) model (Jaffe & Perola 1973) described by Komissarov & Gubanov (1994), see also Slee et al. (2001). We assume that (i) synchrotron self-absorption is negligible as this only occurs in compact sources; (ii) radiative energy losses dominate over other losses such as adiabatic ones; (iii) the magnetic field is spatially uniform and constant in time; (iv) radiative electrons do not escape from the region; (v) the emission in the region is uniform; (iv) relativistic electrons were injected at a single point with a power-law distribution of energy; and (vii) the pitch angles of the synchrotron emitting electrons are assumed to be continuously isotropized on a timescale shorter than the radiative timescale. Relativistic electrons lose their energy by synchrotron emission and IC scattering off the cosmic microwave background (CMB).
In the Kardashev-Pacholczyk (KP) model (Pacholczyk 1970; Kardashev 1962), also used by Komissarov & Gubanov (1994),
the pitch angle of the electrons remains in its original orientation
with respect to the magnetic field. This introduces one more free
parameter in the spectral index modeling (the ratio between the source
magnetic field (B) and the effective magnetic field for IC losses (
![]() ).
We have chosen not to fit this model to limit the number of free
parameters. Furthermore, the JP model is more realistic from a physical
point of view, as an anisotropic pitch angle distribution will become
more isotropic due to changes in the magnetic field strength between
different regions and scattering by self-induced Alfvén waves (e.g., Slee et al. 2001; Carilli et al. 1991).
).
We have chosen not to fit this model to limit the number of free
parameters. Furthermore, the JP model is more realistic from a physical
point of view, as an anisotropic pitch angle distribution will become
more isotropic due to changes in the magnetic field strength between
different regions and scattering by self-induced Alfvén waves (e.g., Slee et al. 2001; Carilli et al. 1991).
Table 2:
JP model fits with
![]() .
.
Our adopted scenario is as follows: When the source starts, we assume that it is fueled at a constant rate for a certain time
![]() (the time of the continuous injection (CI) of relativistic electrons, with an injection spectral index
(the time of the continuous injection (CI) of relativistic electrons, with an injection spectral index
![]() ). This is followed by a relic phase (RE) where the injection of electrons is switched off (
). This is followed by a relic phase (RE) where the injection of electrons is switched off (
![]() ). During both of these phases the electrons lose energy by synchrotron and IC losses. The total source age is
). During both of these phases the electrons lose energy by synchrotron and IC losses. The total source age is
![]() .
.
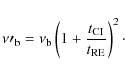
In the spectrum two break frequencies occur both related to spectral aging. The first is the break frequency
![]() of the first injected electron population (at the beginning of the CI phase)
of the first injected electron population (at the beginning of the CI phase)
![\begin{displaymath}\nu_{{\rm b}} \propto \frac{B}{\left(\left[B^2 + B_{{\rm IC}}^2\right]t\right)^2}\cdot
\end{displaymath}](/articles/aa/full_html/2009/46/aa12501-09/img163.png)
|
(3) |
A second higher frequency break
The injection spectral index (
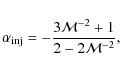
|
(5) |
see van Weeren et al. (2009a). The injection time must be comparable with the crossing time of the relic region by the shock front. Since ``DSA-relics'' are mostly located in the cluster periphery, where the pressure of the ICM gas is lower, adiabatic energy losses may become important. These adiabatic energy losses affect the radio spectrum, depending on the expansion rate of the relic and evolution of the magnetic field strength (B(t)) with time (Murgia et al. 2002; Kardashev 1962; Goldshmidt & Rephaeli 1994). However, we only have a limited number of flux measurements for our sources and only one proposed DSA-relic with enough flux measurements to model the spectrum. Furthermore, the location of this relic in the cluster as well as the identification of the cluster itself are uncertain. We therefore chose to ignore the effects adiabatic expansion losses.
The JP model is thus characterized by four free parameters: (1) the injection spectral index
![]() ;
(2) the length of the CI phase
;
(2) the length of the CI phase
![]() ;
(3) the length of the RE phase
;
(3) the length of the RE phase
![]() ;
and (4) a flux normalization constant. To reduce the number of free parameters we have chosen to keep
;
and (4) a flux normalization constant. To reduce the number of free parameters we have chosen to keep
![]() fixed to a value of -0.75 (Parma et al. 2007).
fixed to a value of -0.75 (Parma et al. 2007).
The spectra are fitted by minimizing the ![]() -squared value of the fit in a two-step process. We first determine the shape of the spectrum for different values of
-squared value of the fit in a two-step process. We first determine the shape of the spectrum for different values of
![]() and
and
![]() ,
both ranging from 0 to 109 yrs
in 25 equal logarithmically spaced steps. Then an overall flux
scaling (normalization) constant is determined by multiplying the
spectrum with a constant until the
,
both ranging from 0 to 109 yrs
in 25 equal logarithmically spaced steps. Then an overall flux
scaling (normalization) constant is determined by multiplying the
spectrum with a constant until the ![]() -squared value is minimized. In this way, a 2-dimensional (
-squared value is minimized. In this way, a 2-dimensional (
![]() )
array of
)
array of ![]() -squared values is created. We continue the fitting using the same process but now centering the
-squared values is created. We continue the fitting using the same process but now centering the
![]() and
and
![]() values around the minimum
values around the minimum ![]() -squared value in the array and increasing the time resolution by a factor of 1.5. The process is repeated until both
-squared value in the array and increasing the time resolution by a factor of 1.5. The process is repeated until both
![]() and
and
![]() converge to a constant value, i.e., do not change by more than 1%
between subsequent iterations. The formal errors in the fitted
parameters are determined by the corresponding distribution of the
converge to a constant value, i.e., do not change by more than 1%
between subsequent iterations. The formal errors in the fitted
parameters are determined by the corresponding distribution of the ![]() -squared
values. For the sources where we successfully fitted the JP-model we
should take in mind that some of the simplifying assumptions we made
may not be valid and could have affected our results.
-squared
values. For the sources where we successfully fitted the JP-model we
should take in mind that some of the simplifying assumptions we made
may not be valid and could have affected our results.
For the magnetic field strength we use the revised equipartition magnetic field strength
![]() (Brunetti et al. 1997; Beck & Krause 2005). We use the same procedure as in van Weeren et al. (2009a) and take for the depth of the source (d) the average of the major and minor axis. The ratio of energy in relativistic protons to that in electrons (k) is set to 100. For the low-energy cutoff (
(Brunetti et al. 1997; Beck & Krause 2005). We use the same procedure as in van Weeren et al. (2009a) and take for the depth of the source (d) the average of the major and minor axis. The ratio of energy in relativistic protons to that in electrons (k) is set to 100. For the low-energy cutoff (
![]() ,
the energy boundary indicated by the Lorentz factor) we take 100. For other values of k and
,
the energy boundary indicated by the Lorentz factor) we take 100. For other values of k and
![]() ,
,
![]() scales with
scales with
![]() ,
with
,
with ![]() the spectral index.
the spectral index.
We have only fitted the radio spectra for sources with a redshift (because the energy loss rate due to IC scattering is proportional to (1+z)4) and at least four flux measurements available. An exception is 24P73 (or VLSS J2217.5+5943) for which we have no redshift. If 24P73 has a similar size as the relic in A85 (150 kpc, Slee et al. 2001), then its redshift would be around 0.1. Since this is a very rough estimate we have also fitted the radio spectrum using redshifts of 0.05, 0.15, and 0.2.
The fluxes for the sources could be contaminated by the presence of field sources within the beam of the low-resolution surveys. In the case of 24P73, there is a 5.0 mJy NVSS source (NVSS J221736+594403) nearby which is blended with the diffuse source in the 8C, VLSS, and WENSS surveys. We fitted a second order polynomial in log-log space to the 610 MHz GMRT, NVSS, and the 1.4 and 8.4 GHz fluxes from Green & Joncas (1994) for this source. We then extrapolated the flux to 325, 74, and 38 MHz and subtracted off this flux to recover the uncontaminated flux for the diffuse source. For the three other diffuse sources no unrelated sources were found that could have significantly contributed to the flux.
The fitted radio spectra are show in Figs. 16 to 19. The values for
![]() ,
,
![]() ,
and
,
and
![]() are reported in Table 2.
The fitting process for the sources VLSS J1636.5+3326,
VLSS J2213.2+3411, VLSS J0004.9-3457 did not converge. For
VLSS J1636.5+3326 the 1.4 GHz flux measurement is relatively
high, in this case the source may have restarted its activity causing
the high 1.4 GHz flux value. This is also seen for several radio
sources by Parma et al. (2007).
For the other sources the flux measurements are too closely spaced in
frequency to provide enough constraints for the fitting process.
are reported in Table 2.
The fitting process for the sources VLSS J1636.5+3326,
VLSS J2213.2+3411, VLSS J0004.9-3457 did not converge. For
VLSS J1636.5+3326 the 1.4 GHz flux measurement is relatively
high, in this case the source may have restarted its activity causing
the high 1.4 GHz flux value. This is also seen for several radio
sources by Parma et al. (2007).
For the other sources the flux measurements are too closely spaced in
frequency to provide enough constraints for the fitting process.
For the sources where we successfully modeled the synchrotron spectrum
![]() .
All of these sources show steepening of the radio spectrum at higher
frequencies which is expected in case of spectral aging. For 24P73 the
spectral index modeling is consistent with the source being a radio
phoenix with a total source age of
.
All of these sources show steepening of the radio spectrum at higher
frequencies which is expected in case of spectral aging. For 24P73 the
spectral index modeling is consistent with the source being a radio
phoenix with a total source age of
![]() yrs.
We find that the derived synchrotron age does not critically depend on
the adopted redshift of 0.1 for this source (see Table 2).
yrs.
We find that the derived synchrotron age does not critically depend on
the adopted redshift of 0.1 for this source (see Table 2).
![\begin{figure}
\par\includegraphics[width=8.8cm,clip]{12501f16}
\end{figure}](/articles/aa/full_html/2009/46/aa12501-09/img174.png)
|
Figure 16: Jaffe-Perola fit to the flux measurements. The duration of the CI and RE phases are indicated in the figure. |
| Open with DEXTER | |
![\begin{figure}
\par\includegraphics[width=8.8cm,clip]{12501f17}
\end{figure}](/articles/aa/full_html/2009/46/aa12501-09/img175.png)
|
Figure 17: Same as Fig. 16 but for VLSS J1133.7+2324. |
| Open with DEXTER | |
![\begin{figure}
\par\includegraphics[width=8.8cm,clip]{12501f18}
\end{figure}](/articles/aa/full_html/2009/46/aa12501-09/img176.png)
|
Figure 18: Same as Fig. 16 but for VLSS J1710.5+6844. |
| Open with DEXTER | |
![\begin{figure}
\par\includegraphics[width=8.8cm,clip]{12501f19}
\end{figure}](/articles/aa/full_html/2009/46/aa12501-09/img177.png)
|
Figure 19: Same as Fig. 16 but for 24P73 (VLSS J2217.5+5943) using z=0.1. |
| Open with DEXTER | |
6 Discussion
Based on their toroidal or filamentary morphologies and curved radio spectra two of our relics could be classified as radio phoenices: VLSS J1515.1+0424 and VLSS J2217.5+5943. Contrary, VLSS J1133.7+2324 and the twisted structure in MACS J0717.5+3745 are probably the result of DSA from structure formation shocks. In the case of VLSS J0717.5+3745, the distorted morphology and high temperature of the ICM are clear evidence for a cluster undergoing a merger. For the other relics more observations are needed to determine their origin.
Most of the sources in our sample are associated with galaxies in clusters and show irregular morphologies. This can be caused by the interaction of the radio plasma with the ICM. The steep spectrum of the sources is caused by spectral aging, e.g., in some cases the central AGN activity may have stopped, producing a so called ``dying'' radio source. Confinement of the radio plasma by the ICM could also have contributed to the steep radio spectra, as in this case the radio plasma has ``the time'' to display the effects of spectral aging.
Table 3: Radio relic properties.
We have calculated the physical size (largest extent), projected distance from the cluster center (
![]() ), and 1.4 GHz radio power (P1.4)
for the radio relics in our sample. We have complemented this with
values from the literature for radio relics with measured spectral
indices: A13, A85, A133, and
A4038 (Slee et al. 2001), A1240 and A2345 (Bonafede et al. 2009b), A3667 (Röttgering et al. 1997), A548b (Feretti et al. 2006), A2256 (Clarke & Ensslin 2006), A521 (Giacintucci et al. 2008), 1253+275 (Giovannini et al. 1991), A2163 (Feretti et al. 2004), A2744 (Orrú et al. 2007), AS753 (Subrahmanyan et al. 2003), A115 (Govoni et al. 2001) A610 (Giovannini & Feretti 2000) and RXC J1314.4-2515 (Venturi et al. 2007).
The spectral indices for our newly found relics were calculated between
74 and 1400 MHz. The spectral indices for the relics taken from
the literature were usually measured between 325 and 1400 MHz, but
for some relics the frequency range is somewhat different (for more
details the reader is referred the references given above).
), and 1.4 GHz radio power (P1.4)
for the radio relics in our sample. We have complemented this with
values from the literature for radio relics with measured spectral
indices: A13, A85, A133, and
A4038 (Slee et al. 2001), A1240 and A2345 (Bonafede et al. 2009b), A3667 (Röttgering et al. 1997), A548b (Feretti et al. 2006), A2256 (Clarke & Ensslin 2006), A521 (Giacintucci et al. 2008), 1253+275 (Giovannini et al. 1991), A2163 (Feretti et al. 2004), A2744 (Orrú et al. 2007), AS753 (Subrahmanyan et al. 2003), A115 (Govoni et al. 2001) A610 (Giovannini & Feretti 2000) and RXC J1314.4-2515 (Venturi et al. 2007).
The spectral indices for our newly found relics were calculated between
74 and 1400 MHz. The spectral indices for the relics taken from
the literature were usually measured between 325 and 1400 MHz, but
for some relics the frequency range is somewhat different (for more
details the reader is referred the references given above).
![\begin{figure}
\par\includegraphics[angle = 90,width=8.8cm,clip]{12501f20}
\end{figure}](/articles/aa/full_html/2009/46/aa12501-09/img180.png)
|
Figure 20: Spectral index of radio relics versus their size. Squares are the proposed radio phoenices, i.e., the sources from Slee et al. (2001), 24P73 and the relic in Abell 2048. Diamonds represent the radio relics tracing merger shocks where particles are being accelerated by the DSA mechanism. The color coding is according to the projected distance from the cluster center. For the relics represented by black symbols we could not obtain a reliable projected distance to the cluster center. |
| Open with DEXTER | |
![\begin{figure}
\par\includegraphics[angle = 90,width=8.8cm,clip]{12501f21}
\end{figure}](/articles/aa/full_html/2009/46/aa12501-09/img181.png)
|
Figure 21: Projected distance from the cluster center of radio relics versus their size. Symbols are defined in Fig. 20. |
| Open with DEXTER | |
Giant Mpc-scale radio relics are probably caused by DSA in an outwards traveling shock front. It is unlikely that they are the result of compression and reignition of fossil radio plasma as the time to compress such a large radio ``ghost'' would remove most of the electrons responsible for the radio emission by radiative energy losses (Clarke & Ensslin 2006). In the case of giant peripheral relics shock-acceleration is ongoing resulting in relatively flat spectral indices of about -1, i.e., a balance between electron cooling in the post-shock regions and continuous acceleration at the shock front. Behind the shock front, the spectral index is indeed observed to steepen for some giant relics (e.g., Röttgering et al. 1997). After a few times 108 yrs the electrons behind the shock front have lost most of their energy and cause little synchrotron emission. It takes of the order of 1 Gyr for a shock wave to travel from the center of the cluster to about the virial radius.
As has been mentioned, an alternative explanation for the found size-spectral index correlation could be a possible different origin of the smaller radio relics. With the smaller radio relics originating from the adiabatic compression of fossil radio plasma. In fossil radio plasma, the high-frequency synchrotron emitting electrons have lost most of their energy. Due to compression and the increase in magnetic field strength the radio plasma becomes visible again. Therefore these sources are characterized by (very) steep and curved spectra. Proposed examples of such sources are 24P73 and those found by Slee et al. (2001). If spectral aging occurs, the steeper radio spectra should be more curved.
It would be interesting to determine the injection spectral indices (
![]() )
for the radio relics. This requires reliable flux measurements over a
wide range of frequencies, especially below the break frequency
)
for the radio relics. This requires reliable flux measurements over a
wide range of frequencies, especially below the break frequency
![]() .
With enough flux measurements it should be possible to separate the effect of spectral aging and a steep
.
With enough flux measurements it should be possible to separate the effect of spectral aging and a steep
![]() .
In particular, if the correlation is explained by the different Mach
numbers of shocks the injection spectral indices for smaller relics
located close to the cluster center should be steeper than that of
larger relics. If this is indeed the case this is evidence for DSA. For
radio phoenices the injection spectral index should be around -0.5 to
-0.75 because the fossil radio plasma originated from AGN. Their steep
spectral indices should then solely be the result of spectral aging and
not a steep injection spectral index. Currently, with a limited number
of flux measurements, mainly at frequencies where electrons have
already lost some of their energy, there is a degeneracy between the
injection spectral index and the amount of spectral aging. New
low-frequency radio facilities, such as LOFAR, will be needed to
determine
.
In particular, if the correlation is explained by the different Mach
numbers of shocks the injection spectral indices for smaller relics
located close to the cluster center should be steeper than that of
larger relics. If this is indeed the case this is evidence for DSA. For
radio phoenices the injection spectral index should be around -0.5 to
-0.75 because the fossil radio plasma originated from AGN. Their steep
spectral indices should then solely be the result of spectral aging and
not a steep injection spectral index. Currently, with a limited number
of flux measurements, mainly at frequencies where electrons have
already lost some of their energy, there is a degeneracy between the
injection spectral index and the amount of spectral aging. New
low-frequency radio facilities, such as LOFAR, will be needed to
determine
![]() for radio relics.
for radio relics.
The spectral index versus the 1.4 GHz radio power for the relics is shown in Fig. 22. From the figure we can see that there is a lack of high power sources with steep radio spectra. This is not surprising since relics with less steep spectra are larger (Fig. 20) and therefore should have a higher radio power.
![\begin{figure}
\par\includegraphics[angle = 90,width=8.8cm,clip]{12501f22}
\end{figure}](/articles/aa/full_html/2009/46/aa12501-09/img182.png)
|
Figure 22: Radio power at 1.4 GHz of radio relics versus their spectral index. Symbols are defined in Fig. 20. |
| Open with DEXTER | |
![\begin{figure}
\par\includegraphics[angle = 90,width=8.8cm,clip]{12501f23}
\end{figure}](/articles/aa/full_html/2009/46/aa12501-09/img183.png)
|
Figure 23:
Curvature of the radio spectra versus their spectral index between 74 and 1400 MHz. The curvature is defined as
|
| Open with DEXTER | |
7 Conclusions
We carried out 610 MHz radio continuum observations with the GMRT of 26 diffuse steep spectrum sources. All of these sources were resolved out by 1.4 GHz VLA B-array snapshot observations or in the 1.4 GHz FIRST survey. Of these 26 sources 25 were detected with the GMRT. The radio observations show a wide range of sources: radio relics, a giant radio halo, a mini-halo, FR-I, head-tail, and USS sources. Here we shortly summarize the properties of the relics and halos in our sample.
- The radio relic 24P73 (VLSS J2217.5+5943) is located close to the galactic plane. This source was previously known to have a steep spectrum but remained unclassified due to the limited sensitivity and resolution of previous observations. Due to the crowed Milky Way field and high extinction no cluster is found in POSS-II images. Deep NIR imaging will be needed to reveal the presence of a cluster. The sources has an extremely steep curved spectrum, likely the result of adiabatic compression of fossil radio plasma and spectral aging.
- VLSS J1133.7+2324 is a filamentary relic located next
to a nearby spiral galaxy. The radio source breaks up into two parallel
filamentary structures. This relic source is probably associated with a
structure of galaxies located at a distance of
 .
The nearby spiral galaxy itself is also detected in the radio images,
the flux density consistent with that predicated by the FIR-radio
correlation (using IRAS fluxes for this galaxy). The galaxy is partly
blocking our view of the distant structure of galaxies, making
follow-up observations more difficult.
.
The nearby spiral galaxy itself is also detected in the radio images,
the flux density consistent with that predicated by the FIR-radio
correlation (using IRAS fluxes for this galaxy). The galaxy is partly
blocking our view of the distant structure of galaxies, making
follow-up observations more difficult. - VLSS J1431.8+1331 consists of two components. The eastern part is probably associated with a cD galaxy in the center of the cluster MaxBCG J217.95869+13.53470 at z=0.16. The radio morphology suggests we are seeing signs of interaction between the radio plasma and the ICM. The other part is probably a relic source. These sources makes an interesting target for follow-up X-ray observations.
- VLSS J0004.9-3457 is associated with an elliptical galaxy in a small cluster at
 .
The diffuse radio emission surrounds the galaxy in the form of a mini-halo. The source has an arc-like extension to the east.
.
The diffuse radio emission surrounds the galaxy in the form of a mini-halo. The source has an arc-like extension to the east.
- VLSS J0717.5+3745 is located in the cluster
MACS J0717.5+3745, a massive merging system at a redshift of
0.5548. The radio emission is complex, consisting of a large elongated
radio relic and a giant 1.2 Mpc radio halo. The halo has a radio
power (P1.4) of
 W Hz-1,
the highest one known to date. The relic might trace a giant shock wave
related to the cluster merger. This is consistent with the very hot ICM
and relatively flat spectral index.
W Hz-1,
the highest one known to date. The relic might trace a giant shock wave
related to the cluster merger. This is consistent with the very hot ICM
and relatively flat spectral index. - VLSS J1515.1+0424 is a radio relic consisting of three filamentary structures in the periphery of the cluster Abell 2048. Adiabatic compression of fossil radio plasma probably resulted in the complex morphology.
If the correlation is explained by the fact that the larger shock waves occur mainly in lower-density regions and have larger Mach numbers then the injection spectral indices should flatten away from the cluster center for the various relics. To measure this requires a sufficient number of flux measurements, especially below the break frequency in the spectrum. With upcoming new radio facilities operating at lower frequencies it should therefore be possible to break the degeneracy between the injection spectral index and spectral aging.
Follow-up observations to measure the polarization properties are currently underway. We also plan to create spectral index maps for our sources which should give more information on the life-times of the various synchrotron emitting regions. Optical observations have been taken to characterize the large-scale environment around the radio sources. For two of our diffuse sources these observations should confirm the presence of a cluster. X-ray observations will be needed to study the dynamical state of the clusters and reveal the presence of shock fronts in the ICM.
AcknowledgementsWe would like to thank the anonymous referee for useful comments. We thank the staff of the GMRT who have made these observations possible. The GMRT is run by the National Centre for Radio Astrophysics of the Tata Institute of Fundamental Research. R.J.v.W. would like to thank J.B.R. Oonk and A. Omar for helping with the observations, D.A. Green for the discussion about source 24P73, and F. Govoni for pointing out the correct flux of A115. R.J.v.W. acknowledges funding from the Royal Netherlands Academy of Arts and Sciences.
This publication makes use of data products from the Two Micron All Sky Survey, which is a joint project of the University of Massachusetts and the Infrared Processing and Analysis Center/California Institute of Technology, funded by the National Aeronautics and Space Administration and the National Science Foundation. This research has made use of the VizieR catalogue access tool, CDS, Strasbourg, France.
The Digitized Sky Surveys were produced at the Space Telescope Science Institute under U.S. Government grant NAG W-2166. The images of these surveys are based on photographic data obtained using the Oschin Schmidt Telescope on Palomar Mountain and the UK Schmidt Telescope. The plates were processed into the present compressed digital form with the permission of these institutions. The Second Palomar Observatory Sky Survey (POSS-II) was made by the California Institute of Technology with funds from the National Science Foundation, the National Geographic Society, the Sloan Foundation, the Samuel Oschin Foundation, and the Eastman Kodak Corporation.
Appendix A: Other sources in the sample
A.1 VLSS J0227.4-1642
The radio map shows two resolved elongated patches of emission. The
brighter eastern component has a flux of 25.8 mJy and the weaker
western component 11.2 mJy. Both components are resolved, 28.3
![]() by 10.3
by 10.3
![]() (eastern component) and 22.3
(eastern component) and 22.3
![]() by 9.0
by 9.0
![]() (western component), and show structure at the limit of the
(western component), and show structure at the limit of the ![]()
![]() beam.
The position angles of the longest axes are roughly the same, which
suggests a link between the two components. No optical counterpart is
detected at the limit of the POSS-II survey. The steep spectral index
of about -1.5 could be explained if this source is a FR-I type AGN,
where the central engine has stopped and the synchrotron emission in
the two lobes has steepened by spectral aging. In this case both
components should roughly have the same spectral index.
beam.
The position angles of the longest axes are roughly the same, which
suggests a link between the two components. No optical counterpart is
detected at the limit of the POSS-II survey. The steep spectral index
of about -1.5 could be explained if this source is a FR-I type AGN,
where the central engine has stopped and the synchrotron emission in
the two lobes has steepened by spectral aging. In this case both
components should roughly have the same spectral index.
A.2 VLSS J0250.5-1247
The radio observations show a double source. The two components are slightly resolved, have a similar flux and seem to be connected by a faint bridge. The separation between the two radio components is 15A.3 VLSS J0646.8-0722
The radio map shows a source with an angular size of 1.0A.4 VLSS J1117.1+7003
This source has a remarkable steep and straight radio spectrum without any indication of a flux turnover at lower frequencies. The source is resolved into a smooth featureless roughly spherical blob (26![\begin{figure}
\par\mbox{\includegraphics[angle = 90, trim =0cm 0cm 0cm 0cm,widt...
...cs[angle = 90, trim =0cm 0cm 0cm 0cm,width=5.6cm]{12501f35} }
\par
\end{figure}](/articles/aa/full_html/2009/46/aa12501-09/img188.png)
|
Figure A.1: GMRT 610 MHz radio map. Contour levels are drawn as in Fig. 1. |
| Open with DEXTER | |
A.5 VLSS J1636.5+3326
The radio map shows two compact components, with the northern component extending to the west. SDSS images show several faint mostly red galaxies around the radio source. Photometric redshifts (SDSS DR7) indicate the presence of a cluster atA.6 VLSS J1710.5+6844
This ``head-tail'' radio source has a length of 0.73![\begin{figure}
\par\mbox{\includegraphics[angle = 90, trim =0cm 0cm 0cm 0cm,widt...
...cs[angle = 90, trim =0cm 0cm 0cm 0cm,width=5.6cm]{12501f41} }
\par
\end{figure}](/articles/aa/full_html/2009/46/aa12501-09/img190.png)
|
Figure A.2: GMRT 610 MHz radio map. Contour levels are drawn as in Fig. 1. |
| Open with DEXTER | |
A.7 VLSS J1930.4+1048
The radio map shows an elongated source with a LAS of 101A.8 VLSS J2043.9-1118
An optical counterpart for this source is detected in POSS-II images. The faint optical source is located on the peak of the radio emission. The radio emission surrounds the galaxy and there is a hint of a faint extension to the east.A.9 VLSS J2044.7+0447
The source is elongated in the east-west direction and has a LAS of 101A.10 VLSS 2122.9+0012
The radio source is compact, 11.6![\begin{figure}
\par\mbox{\includegraphics[angle = 90, trim =0cm 0cm 0cm 0cm,widt...
... trim =0cm 0cm 0cm 0cm,width=5.6cm]{12501f49}\hspace*{2.8cm}}
\par
\end{figure}](/articles/aa/full_html/2009/46/aa12501-09/img192.png)
|
Figure A.3: Optical images for radio sources with counterparts. Images are from SDSS or POSS-II (red), except for VLSS J1710.5+6844 for which we took seven i-band images from the INT Wide Field Camera with a total exposure time of 2520 s. GMRT 610 MHz contour levels are drawn as in Fig. 2. |
| Open with DEXTER | |
A.11 VLSS J2213.2+3411
This source was also included in the USS sample of De Breuck et al. (2000), WN J2213+3411. AA.12 VLSS J2341.1+1231
The radio map shows a FR-I type radio source. The northwestern and southeastern lobes are listed as NVSS J234104+123203 and NVSS J234107+123126, respectively. An optical counterpart is detected on POSS-II images at roughly the expected position based on the location of the lobes. This source may be a so called ``dying'' radio source.
A.13 VLSS J2345.2+2157
The radio source shows an S-shape symmetry. An optical counterpart is detected in 2MASS and POSS-II images being the central cD galaxy of a cluster. This is confirmed by the presence of the X-ray source 1RXS J234518.4+215753.
A.14 VLSS J0511.6+0254
The radio map shows a FR-I type radio source. Two possible optical counterparts are detected which are the central elliptical galaxies in a cluster at a redshift of about 0.2.A.15 VLSS J0516.2+0103
VLSS J0516.2+0103 is a relatively compact source, without a double lobe structure. The source does not have an optical counterpart in POSS-II images. This implies the source is probably located atA.16 VLSS J2209.5+1546
The radio map shows an elongated source. No optical counterpart is detected at the limit of the POSS-II images. The source is probably a distant FR-I source. Optical imaging will be needed to confirm this classification.A.17 VLSS J2241.3-1626
This source could be a disturbed FR-I source, no optical counterpart is detected. Optical imaging will be needed to confirm this classification.A.18 VLSS J2357.0+0441
The source is found to be a blend of three compact sources, all without optical counterparts. By convolving the GMRT image to the NVSS resolution (45
References
- Abazajian, K. N., Adelman-McCarthy, J. K., Agüeros, M. A., et al. 2009, ApJS, 182, 543 [NASA ADS] [CrossRef]
- Baars, J. W. M., Genzel, R., Pauliny-Toth, I. I. K., & Witzel, A. 1977, A&A, 61, 99 [NASA ADS]
- Bade, N., Engels, D., Voges, W., et al. 1998, A&AS, 127, 145 [NASA ADS] [CrossRef] [EDP Sciences]
- Bagchi, J., Jacob, J., Gopal-Krishna, et al. 2009, MNRAS, 399, 601 [CrossRef]
- Battaglia, N., Pfrommer, C., Sievers, J. L., Bond, J. R., & Enßlin, T. A. 2009, MNRAS, 393, 1073 [NASA ADS] [CrossRef]
- Beck, R., & Krause, M. 2005, Astron. Nachr., 326, 414 [NASA ADS] [CrossRef]
- Becker, R. H., White, R. L., & Helfand, D. J. 1995, ApJ, 450, 559 [NASA ADS] [CrossRef]
- Blandford, R., & Eichler, D. 1987, Phys. Rep., 154, 1 [NASA ADS] [CrossRef]
- Bonafede, A., Feretti, L., Giovannini, G., et al. 2009a, A&A, 503, 707 [NASA ADS] [CrossRef] [EDP Sciences]
- Bonafede, A., Giovannini, G., Feretti, L., Govoni, F., & Murgia, M. 2009b, A&A, 494, 429 [NASA ADS] [CrossRef] [EDP Sciences]
- Briggs, D. S. 1995, Ph.D. Thesis, New Mexico Institute of Mining Technology, Socorro, New Mexico, USA
- Brunetti, G., Setti, G., & Comastri, A. 1997, A&A, 325, 898 [NASA ADS]
- Brunetti, G., Giacintucci, S., Cassano, R., et al. 2008, Nature, 455, 944 [NASA ADS] [CrossRef]
- Carilli, C. L., Perley, R. A., Dreher, J. W., & Leahy, J. P. 1991, ApJ, 383, 554 [NASA ADS] [CrossRef]
- Cassano, R., Brunetti, G., & Setti, G. 2006, MNRAS, 369, 1577 [NASA ADS] [CrossRef]
- Cassano, R., Brunetti, G., Setti, G., Govoni, F., & Dolag, K. 2007, MNRAS, 378, 1565 [NASA ADS] [CrossRef]
- Cassano, R., Brunetti, G., Venturi, T., et al. 2008, A&A, 480, 687 [NASA ADS] [CrossRef] [EDP Sciences]
- Cen, R., & Ostriker, J. P. 1999, ApJ, 514, 1 [NASA ADS] [CrossRef]
- Chandra, P., Ray, A., & Bhatnagar, S. 2004, ApJ, 612, 974 [NASA ADS] [CrossRef]
- Clarke, T. E., & Ensslin, T. A. 2006, AJ, 131, 2900 [NASA ADS] [CrossRef]
- Cohen, A. S., Lane, W. M., Cotton, W. D., et al. 2007, AJ, 134, 1245 [NASA ADS] [CrossRef]
- Condon, J. J., Anderson, M. L., & Helou, G. 1991, ApJ, 376, 95 [NASA ADS] [CrossRef]
- Condon, J. J., Cotton, W. D., Greisen, E. W., et al. 1998, AJ, 115, 1693 [NASA ADS] [CrossRef]
- Cornwell, T. J., & Perley, R. A. 1992, A&A, 261, 353 [NASA ADS]
- Cotton, W. D., Condon, J. J., Perley, R. A., et al. 2004, in Presented at the Society of Photo-Optical Instrumentation Engineers (SPIE) Conference, ed. J. M. Oschmann, Jr., 5489, 180
- De Breuck, C., van Breugel, W., Röttgering, H. J. A., & Miley, G. 2000, A&AS, 143, 303 [NASA ADS] [CrossRef] [EDP Sciences]
- De Breuck, C., Tang, Y., de Bruyn, A. G., Röttgering, H., & van Breugel, W. 2002a, A&A, 394, 59 [NASA ADS] [CrossRef] [EDP Sciences]
- De Breuck, C., van Breugel, W., Stanford, S. A., et al. 2002b, AJ, 123, 637 [NASA ADS] [CrossRef]
- de Vries, N., Snellen, I. A. G., Schilizzi, R. T., Lehnert, M. D., & Bremer, M. N. 2007, A&A, 464, 879 [NASA ADS] [CrossRef] [EDP Sciences]
- Dolag, K., Bykov, A. M., & Diaferio, A. 2008, Space Sci. Rev., 134, 311 [NASA ADS] [CrossRef]
- Douglas, J. N., Bash, F. N., Bozyan, F. A., Torrence, G. W., & Wolfe, C. 1996, AJ, 111, 1945 [NASA ADS] [CrossRef]
- Drury, L. O. 1983, Rep. Progr. in Phys., 46, 973 [NASA ADS] [CrossRef]
- Ebeling, H., Edge, A. C., & Henry, J. P. 2001, ApJ, 553, 668 [NASA ADS] [CrossRef]
- Ebeling, H., Barrett, E., & Donovan, D. 2004, ApJ, 609, L49 [NASA ADS] [CrossRef]
- Ebeling, H., Barrett, E., Donovan, D., et al. 2007, ApJ, 661, L33 [NASA ADS] [CrossRef]
- Edge, A. C., Ebeling, H., Bremer, M., et al. 2003, MNRAS, 339, 913 [NASA ADS] [CrossRef]
- Ensslin, T. A., Biermann, P. L., Klein, U., & Kohle, S. 1998, A&A, 332, 395 [NASA ADS]
- Enßlin, T. A., & Brüggen, M. 2002, MNRAS, 331, 1011 [NASA ADS] [CrossRef]
- Enßlin, T. A., & Gopal-Krishna 2001, A&A, 366, 26 [NASA ADS] [CrossRef] [EDP Sciences]
- Enßlin, T. A., & Röttgering, H. 2002, A&A, 396, 83 [NASA ADS] [CrossRef] [EDP Sciences]
- Fabian, A. C., Nulsen, P. E. J., & Canizares, C. R. 1991, A&ARv, 2, 191 [NASA ADS]
- Fanaroff, B. L., & Riley, J. M. 1974, MNRAS, 167, 31P [NASA ADS]
- Feretti, L., & Giovannini, G. 1996, in Extragalactic Radio Sources, ed. R. D. Ekers, C. Fanti, & L. Padrielli, IAU Symp., 175, 333
- Feretti, L., Orrù, E., Brunetti, G., et al. 2004, A&A, 423, 111 [NASA ADS] [CrossRef] [EDP Sciences]
- Feretti, L., Bacchi, M., Slee, O. B., et al. 2006, MNRAS, 368, 544 [NASA ADS] [CrossRef]
- Ferrari, C., Govoni, F., Schindler, S., Bykov, A. M., & Rephaeli, Y. 2008, Space Sci. Rev., 134, 93 [NASA ADS] [CrossRef]
- Giacintucci, S., Venturi, T., Macario, G., et al. 2008, A&A, 486, 347 [NASA ADS] [CrossRef] [EDP Sciences]
- Giovannini, G., & Feretti, L. 2000, New Astron., 5, 335 [NASA ADS] [CrossRef]
- Giovannini, G., Feretti, L., & Stanghellini, C. 1991, A&A, 252, 528 [NASA ADS]
- Goldshmidt, O., & Rephaeli, Y. 1994, ApJ, 431, 586 [NASA ADS] [CrossRef]
- Gopal-Krishna, Kulkarni, V. K., Bagchi, J., & Melnick, J. 2002, in The Universe at Low Radio Frequencies, ed. A. Pramesh Rao, G. Swarup, & Gopal-Krishna, IAU Symp., 199, 159
- Govoni, F., Feretti, L., Giovannini, G., et al. 2001, A&A, 376, 803 [NASA ADS] [CrossRef] [EDP Sciences]
- Govoni, F., Murgia, M., Markevitch, M., et al. 2009, A&A, 499, 371 [NASA ADS] [CrossRef] [EDP Sciences]
- Green, D. A., & Joncas, G. 1994, A&AS, 104, 481 [NASA ADS]
- Hales, S. E. G., Waldram, E. M., Rees, N., & Warner, P. J. 1995, MNRAS, 274, 447 [NASA ADS]
- Hales, S. E. G., Riley, J. M., Waldram, E. M., Warner, P. J., & Baldwin, J. E. 2007, MNRAS, 382, 1639 [NASA ADS]
- Harris, D. E., Forman, W., Gioa, I. M., et al. 1996, VizieR Online Data Catalog, 9013, 0
- Haynes, M. P., Giovanelli, R., Herter, T., et al. 1997, AJ, 113, 1197 [NASA ADS] [CrossRef]
- Higgs, L. A. 1989, JRASC, 83, 105 [NASA ADS]
- Hoeft, M., & Brüggen, M. 2007, MNRAS, 375, 77 [NASA ADS] [CrossRef]
- Hoeft, M., Brüggen, M., Yepes, G., Gottlöber, S., & Schwope, A. 2008, MNRAS, 391, 1511 [NASA ADS] [CrossRef]
- Inoue, S., Sigl, G., Miniati, F., et al. 2008, in International Cosmic Ray Conf., 4, 555
- Jaffe, W. J., & Perola, G. C. 1973, A&A, 26, 423 [NASA ADS]
- Joncas, G., & Higgs, L. A. 1990, A&AS, 82, 113 [NASA ADS]
- Jones, F. C., & Ellison, D. C. 1991, Space Sci. Rev., 58, 259 [NASA ADS] [CrossRef]
- Kang, H., Ryu, D., & Jones, T. W. 1996, ApJ, 456, 422 [NASA ADS] [CrossRef]
- Kardashev, N. S. 1962, SvA, 6, 317 [NASA ADS]
- Kempner, J. C., Blanton, E. L., Clarke, T. E., et al. 2004, in The Riddle of Cooling Flows in Galaxies and Clusters of galaxies, ed. T. Reiprich, J. Kempner, & N. Soker, 335
- Kennicutt, Jr., R. C. 1998, ApJ, 498, 541 [NASA ADS] [CrossRef]
- Keshet, U., Waxman, E., & Loeb, A. 2004, ApJ, 617, 281 [NASA ADS] [CrossRef]
- Koester, B. P., McKay, T. A., Annis, J., et al. 2007, ApJ, 660, 239 [NASA ADS] [CrossRef]
- Komissarov, S. S., & Gubanov, A. G. 1994, A&A, 285, 27 [NASA ADS]
- Liang, H., Hunstead, R. W., Birkinshaw, M., & Andreani, P. 2000, ApJ, 544, 686 [NASA ADS] [CrossRef]
- Lonsdale, C. J., & Helou, G. 1985, Cataloged galaxies and quasars observed in the IRAS survey (Pasadena: Jet Propulsion Laboratory (JPL))
- Ma, C., Ebeling, H., & Barrett, E. 2009, ApJ, 693, L56 [NASA ADS] [CrossRef]
- Malkov, M. A., & O'C Drury, L. 2001, Reports on Progress in Phys., 64, 429 [NASA ADS] [CrossRef]
- Miley, G., & De Breuck, C. 2008, A&A Rev., 15, 67 [NASA ADS]
- Miniati, F. 2002, MNRAS, 337, 199 [NASA ADS] [CrossRef]
- Miniati, F., Ryu, D., Kang, H., et al. 2000, ApJ, 542, 608 [NASA ADS] [CrossRef]
- Miniati, F., Jones, T. W., Kang, H., & Ryu, D. 2001, ApJ, 562, 233 [NASA ADS] [CrossRef]
- Miyauchi-Isobe, N., & Maehara, H. 2002, PASJ, 6, 107
- Moshir, M., et al. 1990, in IRAS Faint Source Catalogue, version 2.0, 0
- Murgia, M., Fanti, C., Fanti, R., et al. 2002, New Astron. Rev., 46, 307 [NASA ADS] [CrossRef]
- Nicastro, F., Mathur, S., Elvis, M., et al. 2005, Nature, 433, 495 [NASA ADS] [CrossRef]
- Nilson, P. 1973, Nova Acta Regiae Soc. Sci. Upsaliensis Ser. V, 0
- Norman, C. A., Melrose, D. B., & Achterberg, A. 1995, ApJ, 454, 60 [NASA ADS] [CrossRef]
- Orrú, E., Murgia, M., Feretti, L., et al. 2007, A&A, 467, 943 [NASA ADS] [CrossRef] [EDP Sciences]
- Pacholczyk, A. G. 1970, Radio astrophysics, nonthermal processes in galactic and extragalactic sources, Series of Books in Astronomy and Astrophysics (San Francisco: Freeman)
- Parma, P., Murgia, M., de Ruiter, H. R., et al. 2007, A&A, 470, 875 [NASA ADS] [CrossRef] [EDP Sciences]
- Paturel, G., Petit, C., Prugniel, P., et al. 2003, A&A, 412, 45 [NASA ADS] [CrossRef] [EDP Sciences]
- Perley, R. A. 1989, in Synthesis Imaging in Radio Astronomy, ed. R. A. Perley, F. R. Schwab, & A. H. Bridle, ASP Conf. Ser., 6, 259
- Perley, R. T., & Taylor, G. B. 1999, VLA Calibrator Manual, Tech. rep., NRAO
- Peterson, J. R., & Fabian, A. C. 2006, Phys. Rep., 427, 1 [NASA ADS] [CrossRef]
- Pfrommer, C. 2008, MNRAS, 385, 1242 [NASA ADS] [CrossRef]
- Pfrommer, C., Springel, V., Enßlin, T. A., & Jubelgas, M. 2006, MNRAS, 367, 113 [NASA ADS] [CrossRef]
- Pfrommer, C., Enßlin, T. A., & Springel, V. 2008, MNRAS, 385, 1211 [NASA ADS] [CrossRef]
- Rees, N. 1990, MNRAS, 244, 233 [NASA ADS]
- Rengelink, R. B., Tang, Y., de Bruyn, A. G., et al. 1997, A&AS, 124, 259 [NASA ADS] [CrossRef] [EDP Sciences]
- Roettiger, K., Burns, J. O., & Stone, J. M. 1999, ApJ, 518, 603 [NASA ADS] [CrossRef]
- Röttgering, H. J. A., Wieringa, M. H., Hunstead, R. W., & Ekers, R. D. 1997, MNRAS, 290, 577 [NASA ADS]
- Ryu, D., Kang, H., Hallman, E., & Jones, T. W. 2003, ApJ, 593, 599 [NASA ADS] [CrossRef]
- Saito, M., Ohtani, H., Asonuma, A., et al. 1990, PASJ, 42, 603 [NASA ADS]
- Schlegel, D. J., Finkbeiner, D. P., & Davis, M. 1998, ApJ, 500, 525 [NASA ADS] [CrossRef]
- Skillman, S. W., O'Shea, B. W., Hallman, E. J., Burns, J. O., & Norman, M. L. 2008, ApJ, 689, 1063 [NASA ADS] [CrossRef]
- Slee, O. B., Roy, A. L., Murgia, M., Andernach, H., & Ehle, M. 2001, AJ, 122, 1172 [NASA ADS] [CrossRef]
- Solomon, P. M., Downes, D., Radford, S. J. E., & Barrett, J. W. 1997, ApJ, 478, 144 [NASA ADS] [CrossRef]
- Springob, C. M., Haynes, M. P., Giovanelli, R., & Kent, B. R. 2005, ApJS, 160, 149 [NASA ADS] [CrossRef]
- Struble, M. F., & Rood, H. J. 1999, ApJS, 125, 35 [NASA ADS] [CrossRef]
- Subrahmanyan, R., Beasley, A. J., Goss, W. M., Golap, K., & Hunstead, R. W. 2003, AJ, 125, 1095 [NASA ADS] [CrossRef]
- van Weeren, R. J., Rottgering, H. J. A., Bagchi, J., et al. 2009a, A&A, accepted [arXiv:0908.0728]
- van Weeren, R. J., Röttgering, H. J. A., Brüggen, M., & Cohen, A. 2009b, A&A, accepted [arXiv:0905.3650]
- Vazza, F., Brunetti, G., & Gheller, C. 2009, MNRAS, 395, 1333 [NASA ADS] [CrossRef]
- Venturi, T., Giacintucci, S., Brunetti, G., et al. 2007, A&A, 463, 937 [NASA ADS] [CrossRef] [EDP Sciences]
- Voges, W., Aschenbach, B., Boller, T., et al. 1999, A&A, 349, 389 [NASA ADS]
- Voges, W., Aschenbach, B., Boller, T., et al. 2000, IAU Circ., 7432, 1 [NASA ADS]
- Waldram, E. M., Yates, J. A., Riley, J. M., & Warner, P. J. 1996, MNRAS, 282, 779 [NASA ADS]
- Weinberger, R., Saurer, W., & Seeberger, R. 1995, A&AS, 110, 269 [NASA ADS]
- Willott, C. J., Rawlings, S., Jarvis, M. J., & Blundell, K. M. 2003, MNRAS, 339, 173 [NASA ADS] [CrossRef]
- Zanichelli, A., Vigotti, M., Scaramella, R., Grueff, G., & Vettolani, G. 2001, A&A, 379, 21 [NASA ADS] [CrossRef] [EDP Sciences]
- Zhang, X., Zheng, Y., Chen, H., et al. 1997, A&AS, 121, 59 [NASA ADS] [CrossRef] [EDP Sciences]
Footnotes
- ... index
![[*]](/icons/foot_motif.png)
-
 ,
with
,
with  the spectral index.
- ... expected
- http://www.gmrt.ncra.tifr.res.in/gmrt_hpage/Users/doc/manual/UsersManual/node13.html
All Tables
Table 1: Source properties and results.
Table 2:
JP model fits with
![]() .
.
Table 3: Radio relic properties.
All Figures
|
|
Figure 1:
GMRT 610 MHz radio map. The Gaussian beam size is shown at the bottom left corner. Contour levels are drawn at
|
| Open with DEXTER | |
| In the text | |
|
|
Figure 2:
SDSS r band image overlaid with GMRT 610 MHz contours. Contour levels are drawn at
|
| Open with DEXTER | |
| In the text | |
|
|
Figure 3: GMRT 610 MHz radio map. Contour levels are drawn as in Fig. 1. |
| Open with DEXTER | |
| In the text | |
|
|
Figure 4: SDSS r band image overlaid with GMRT 610 MHz contours. Contour levels are drawn as in Fig. 2. |
| Open with DEXTER | |
| In the text | |
|
|
Figure 5: GMRT 610 MHz radio map. Contour levels are drawn as in Fig. 3. |
| Open with DEXTER | |
| In the text | |
|
|
Figure 6: GMRT 610 MHz radio map. Contour levels are drawn as in Fig. 1. |
| Open with DEXTER | |
| In the text | |
|
|
Figure 7: POSS-II red image overlaid with GMRT 610 MHz contours. Contour levels are drawn as in Fig. 2. |
| Open with DEXTER | |
| In the text | |
|
|
Figure 8: GMRT 610 MHz radio map. Contour levels are drawn as in Fig. 1. |
| Open with DEXTER | |
| In the text | |
|
|
Figure 9:
Chandra X-ray map overlaid with radio contours at 610 MHz from the
GMRT. The color scale represents the X-ray emission from
0.5-7.0 keV. The image has been adaptively smoothed using the TARA
(http://www.astro.psu.edu/xray/docs/TARA) package using a minimal significance of 5. Contour levels are drawn at
[1, 2, 4, 8, 16, 32, ...]
|
| Open with DEXTER | |
| In the text | |
|
|
Figure 10: HST F814W ACS image overlaid with GMRT 610 MHzcontours. Contour levels are drawn as in Fig. 2. |
| Open with DEXTER | |
| In the text | |
|
|
Figure 11: GMRT 610 MHz radio map. Contour levels are drawn as in Fig. 1. |
| Open with DEXTER | |
| In the text | |
|
|
Figure 12: SDSS r band image overlaid with GMRT 610 MHz contours. Contour levels are drawn as in Fig. 2. |
| Open with DEXTER | |
| In the text | |
|
|
Figure 13: GMRT 610 MHz radio map. Contour levels are drawn as in Fig. 1. |
| Open with DEXTER | |
| In the text | |
|
|
Figure 14: SDSS r band image overlaid with GMRT 610 MHz contours. Contour levels are drawn as in Fig. 2. |
| Open with DEXTER | |
| In the text | |
|
|
Figure 15:
X-ray emission from ROSAT in the 0.1-2.0 keV energy band. The image has been convolved with a circular Gaussian of 225
|
| Open with DEXTER | |
| In the text | |
|
|
Figure 16: Jaffe-Perola fit to the flux measurements. The duration of the CI and RE phases are indicated in the figure. |
| Open with DEXTER | |
| In the text | |
|
|
Figure 17: Same as Fig. 16 but for VLSS J1133.7+2324. |
| Open with DEXTER | |
| In the text | |
|
|
Figure 18: Same as Fig. 16 but for VLSS J1710.5+6844. |
| Open with DEXTER | |
| In the text | |
|
|
Figure 19: Same as Fig. 16 but for 24P73 (VLSS J2217.5+5943) using z=0.1. |
| Open with DEXTER | |
| In the text | |
|
|
Figure 20: Spectral index of radio relics versus their size. Squares are the proposed radio phoenices, i.e., the sources from Slee et al. (2001), 24P73 and the relic in Abell 2048. Diamonds represent the radio relics tracing merger shocks where particles are being accelerated by the DSA mechanism. The color coding is according to the projected distance from the cluster center. For the relics represented by black symbols we could not obtain a reliable projected distance to the cluster center. |
| Open with DEXTER | |
| In the text | |
|
|
Figure 21: Projected distance from the cluster center of radio relics versus their size. Symbols are defined in Fig. 20. |
| Open with DEXTER | |
| In the text | |
|
|
Figure 22: Radio power at 1.4 GHz of radio relics versus their spectral index. Symbols are defined in Fig. 20. |
| Open with DEXTER | |
| In the text | |
|
|
Figure 23:
Curvature of the radio spectra versus their spectral index between 74 and 1400 MHz. The curvature is defined as
|
| Open with DEXTER | |
| In the text | |
|
|
Figure A.1: GMRT 610 MHz radio map. Contour levels are drawn as in Fig. 1. |
| Open with DEXTER | |
| In the text | |
|
|
Figure A.2: GMRT 610 MHz radio map. Contour levels are drawn as in Fig. 1. |
| Open with DEXTER | |
| In the text | |
|
|
Figure A.3: Optical images for radio sources with counterparts. Images are from SDSS or POSS-II (red), except for VLSS J1710.5+6844 for which we took seven i-band images from the INT Wide Field Camera with a total exposure time of 2520 s. GMRT 610 MHz contour levels are drawn as in Fig. 2. |
| Open with DEXTER | |
| In the text | |
Copyright ESO 2009
Current usage metrics show cumulative count of Article Views (full-text article views including HTML views, PDF and ePub downloads, according to the available data) and Abstracts Views on Vision4Press platform.
Data correspond to usage on the plateform after 2015. The current usage metrics is available 48-96 hours after online publication and is updated daily on week days.
Initial download of the metrics may take a while.