| Issue |
A&A
Volume 508, Number 1, December II 2009
|
|
|---|---|---|
| Page(s) | 309 - 320 | |
| Section | Stellar structure and evolution | |
| DOI | https://doi.org/10.1051/0004-6361/200811318 | |
| Published online | 15 October 2009 | |
A&A 508, 309-320 (2009)
The galactic unclassified B[e] star HD 50138![[*]](/icons/foot_motif.png) ,
,
I. A possible new shell phase
M. Borges Fernandes1 - M. Kraus2 - O. Chesneau1 - A. Domiciano de Souza3 - F. X. de Araújo![]() ,4 - P. Stee1 -
A. Meilland5
,4 - P. Stee1 -
A. Meilland5
1 - UMR 6525 H. Fizeau, Univ. Nice Sophia Antipolis, CNRS, Observatoire de la Côte d'Azur, Av. Copernic, 06130 Grasse, France
2 - Astronomický ústav, Akademie ved Ceské republiky, Fricova 298, 251 65 Ondrejov, Czech Republic
3 - UMR 6525 H. Fizeau, Univ. Nice Sophia Antipolis, CNRS, Observatoire de
la Côte d'Azur, Parc Valrose, 06108 Nice, France
4 - Observatório Nacional, Rua General José Cristino 77, 20921-400 São Cristovão, Rio de Janeiro, Brazil
5 - Max-Planck-Institut für Radioastronomie, Auf dem Hügel 69, 53121 Bonn, Germany
Received 10 November 2008 / Accepted 2 September 2009
Abstract
Context. The observed spectral variation of HD 50138
has led different authors to classify it in a very wide range of
spectral types and luminosity classes (from B5 to A0 and III to
Ia) and at different evolutionary stages as either HAeBe star or
classical Be.
Aims. Based on new high-resolution optical spectroscopic data
from 1999 and 2007 associated to a photometric analysis, the aim of
this work is to provide a deep spectroscopic description and a new set
of parameters for this unclassified southern B[e] star and its
interstellar extinction.
Methods. From our high-resolution optical spectroscopic data
separated by 8 years, we perform a detailed spectral description,
presenting the variations seen and discussing their possible origin. We
derive the interstellar extinction to HD 50138 by taking the
influences of the circumstellar matter in the form of dust and an
ionized disk into account. Based on photometric data from the
literature and the new Hipparcos distance, we obtain a revised set of
parameters for HD 50138.
Results. Because of the spectral changes, we tentatively suggest
that a new shell phase could have taken place prior to our observations
in 2007. We find a color excess value of
E(B-V) = 0.08 mag, and from the photometric
analysis, we suggest that HD 50138 is a B6-7 III-V star. A
discussion of the different evolutionary scenarios is also provided.
Key words: stars: fundamental parameters - stars: winds, outflows - stars: individual: HD 50138
1 Introduction
Stars that present the B[e] phenomenon are known to form a heterogeneous group. This group is composed of objects at different evolutionary stages, such as high- and low-mass evolved stars, intermediate-mass pre-main sequence stars, and symbiotic objects (Lamers et al. 1998). However, for more than 50% of the confirmed galactic B[e] stars, the evolutionary stage is still unknown, so that they are gathered in the group of the unclassified B[e] stars. This problem is mainly caused by poor knowledge of their physical parameters, especially their distances.
In this paper, we present our study related to the southern B[e] star HD 50138 (V743 Mon, MWC158, IRAS 06491-0654). The spectrum of this star was discussed for the first time by Merrill et al. (1925). Later, the presence of spectral variability was cited by Merrill (1931) and Merrill & Burwell (1933). Since then, numerous papers have mainly considered this star as either a pre-main sequence star, more specifically as a Herbig Ae/Be star, or as a classical Be star. Jaschek et al. (1993) have even considered this star as a transition object between a classical Be and a B[e] star. Later Lamers et al. (1998) and Zorec (1998) include this star in the list of unclassified B[e] stars.
The difficulty in obtaining the correct classification of HD 50138
is mainly caused by the strong spectral variability as reported in the
literature. Pogodin (1997) cites the presence of different scales of spectral variability, from days to months, especially in the line profiles of H![]() ,
He I (
,
He I (![]() 5876), and Na I lines. Spectral variations have also been identified in the UV, by the analysis of IUE spectra (Hutsemékers 1985). These spectral variabilities have been explained by an outburst that possibly happened in 1978-1979 (Hutsemékers 1985) and by a shell phase in 1990-1991 (Andrillat & Houziaux 1991).
On the other hand, HD 50138 had presented small and non-periodic
photometric variations that did not seem to be associated to the
spectral changes related to this shell phase (Halbedel 1991).
5876), and Na I lines. Spectral variations have also been identified in the UV, by the analysis of IUE spectra (Hutsemékers 1985). These spectral variabilities have been explained by an outburst that possibly happened in 1978-1979 (Hutsemékers 1985) and by a shell phase in 1990-1991 (Andrillat & Houziaux 1991).
On the other hand, HD 50138 had presented small and non-periodic
photometric variations that did not seem to be associated to the
spectral changes related to this shell phase (Halbedel 1991).
In addition, studies based on polarimetry and spectro-polarimetry have identified an intrinsic polarization that seems to be linked to nonspherical symmetry of matter around this object, probably a circumstellar disk (Vaidya et al. 1994; Bjorkman et al. 1998; Oudmaijer & Drew 1999; Harrington & Kuhn 2007). A disk-scattering effect associated to an outflow has also recently been suggested by Harrington & Kuhn (2009).
On the other hand, Cidale et al. (2001) propose that this object could be a binary system. Based on spectro-astrometry, Baines et al. (2006) suggest the same possibility, where the companion would be separated by 0.5
![]() -3.0
-3.0
![]() .
However, up to now, no direct evidence of binarity has been found.
.
However, up to now, no direct evidence of binarity has been found.
HD 50138 was further observed during the Hipparcos mission, and its distance of
![]() pc (Perryman et al. 1997) turned out with
pc (Perryman et al. 1997) turned out with
![]() pc to be almost doubled according to the new data reduction procedure performed by van Leeuwen (2007).
The newly determined distance and the large uncertainties in the
previously published stellar classification attempt request and warrant
detailed investigation and revision of the stellar parameters of
HD 50138.
pc to be almost doubled according to the new data reduction procedure performed by van Leeuwen (2007).
The newly determined distance and the large uncertainties in the
previously published stellar classification attempt request and warrant
detailed investigation and revision of the stellar parameters of
HD 50138.
In this study, we present our new optical spectroscopic observations and perform a photometric and spectroscopic analysis of HD 50138, aimed on the one hand at describing the observed spectral variations and, on the other, at better constraining the stellar parameters, needed for an improved discussion about the nature of this object.
The paper has the following structure. In Sect. 2 we describe our observations. In Sect. 3, we present our results. In Sect. 3.1, we describe our high-resolution spectra taken on different dates. In Sect. 3.2, we derive from the analysis of our spectroscopic data and public photometric measurements, the insterstellar and circumstellar extinction, hence the stellar parameters and the spectral type of this object. In Sect. 4, we discuss the possible scenarios for explaining the nature of this curious star, and finally in Sect. 5, we present our conclusions.
2 Observations
We obtained high-resolution optical spectra using the high-resolution
Fiber-fed Extended Range Optical Spectrograph (FEROS) and the Narval
spectro-polarimeter. The first FEROS spectrum was obtained on
October 27, 1999, when the spectrograph was attached to the 1.52-m
telescope, and the second was obtained on October 4, 2007, when it
was attached to the 2.2-m telescope, both at the European Southern
Observatory in La Silla (Chile). FEROS is a bench-mounted Echelle
spectrograph with fibers, which covers a sky area of 2
![]() of diameter, with a wavelength coverage from 3600 Å to 9200 Å and a spectral resolution of
R = 55 000 (in the region around 6000 Å). We adopted
its complete automatic online reduction, where the heliocentric
correction is done.
of diameter, with a wavelength coverage from 3600 Å to 9200 Å and a spectral resolution of
R = 55 000 (in the region around 6000 Å). We adopted
its complete automatic online reduction, where the heliocentric
correction is done.
The spectrum of 1999 was obtained with an exposure time of 180 s and has S/N of approximately 80 in the 5500 Å region. In 2007, we were able to take two consecutive spectra of the star, both with 180 s of exposure time. Since these spectra do not show significant differences, we added them up for a better S/N, which is around 250.
Concerning the Narval data, they were obtained on March 14, 2007.
Narval is an Echelle spectro-polarimeter attached to the telescope
Bernard Lyot at the observatory of Pic du Midi (France). For this
study, we are only using the spectroscopic data that cover a sky area
of 2.8
![]() of diameter, with a wavelength range from 3750 Å to 10 500 Å and a spectral resolution of
R = 80 000. We obtained 8 exposures of 300 s each. The S/N
is around 360. We also adopted its complete automatic online
reduction; however, due to problems related to the merging of the
spectral orders (especially in the region of the Balmer lines), we use
this spectrum mainly for a qualitative comparison with the FEROS data,
which are of better quality for our purposes.
of diameter, with a wavelength range from 3750 Å to 10 500 Å and a spectral resolution of
R = 80 000. We obtained 8 exposures of 300 s each. The S/N
is around 360. We also adopted its complete automatic online
reduction; however, due to problems related to the merging of the
spectral orders (especially in the region of the Balmer lines), we use
this spectrum mainly for a qualitative comparison with the FEROS data,
which are of better quality for our purposes.
3 Results
3.1 Spectral description of HD 50138
The high-resolution spectra of HD 50138 present lines from neutral and singly ionized elements. In addition to many emission lines with circumstellar origin, HD 50138 exhibits absorption lines, which are probably formed in the stellar photosphere. Our spectra were taken 8 years apart and strong spectral variations can be noted. Similar variations were previously reported in the literature and associated to shell phases and outburst events (Doazan 1965; Hutsemékers 1985; Andrillat & Houziaux 1991; Bopp 1993; Pogodin 1997).
Table 1 lists all lines present in our FEROS spectra, along with
their radial velocities (obtained considering the center of the lines
and the laboratory wavelength of each transition), equivalent widths of
emission and absorption components, and the possible identification![]() .
For some lines there are more than one possible classification, however
the radial velocity is derived assuming the first identification cited.
There, ``Uid'' means that the line is unidentified. Because of
uncertainties in the position of the underlying continuum, we estimate
the errors of our measurements to be about 20% for the faint lines and
about 10% for the strongest lines. Especially for the faint lines,
there is also a significant difference between the radial velocities
measured in 1999 and in 2007. This difference probably comes not only
from circumstellar changes, but also from the low S/N of our 1999 data. The behavior of the lines from the main elements present in our spectra is described here.
.
For some lines there are more than one possible classification, however
the radial velocity is derived assuming the first identification cited.
There, ``Uid'' means that the line is unidentified. Because of
uncertainties in the position of the underlying continuum, we estimate
the errors of our measurements to be about 20% for the faint lines and
about 10% for the strongest lines. Especially for the faint lines,
there is also a significant difference between the radial velocities
measured in 1999 and in 2007. This difference probably comes not only
from circumstellar changes, but also from the low S/N of our 1999 data. The behavior of the lines from the main elements present in our spectra is described here.
- Hydrogen
Another significant variation is related to the radial velocities of
the narrow absorption components. In 1999, this value is almost
constant for H![]() ,
H
,
H![]() ,
and H
,
and H![]() ,
,
![]() 35 km s-1. However in 2007, this value is quite different for each line, 95 km s-1 (H
35 km s-1. However in 2007, this value is quite different for each line, 95 km s-1 (H![]() ), 60 km s-1 (H
), 60 km s-1 (H![]() )
and 50 km s-1 (H
)
and 50 km s-1 (H![]() ). The H
). The H![]() line's central absorption presents a constant value of
line's central absorption presents a constant value of ![]() 60 km s-1 on both dates. This velocity is quite different from the velocity reported by Oudmaijer & Drew (1999); however, this can be related to different spectral resolutions. As cited by Pogodin (1997), the Balmer lines also present symmetric wings, which show velocities that can reach
60 km s-1 on both dates. This velocity is quite different from the velocity reported by Oudmaijer & Drew (1999); however, this can be related to different spectral resolutions. As cited by Pogodin (1997), the Balmer lines also present symmetric wings, which show velocities that can reach ![]() 1500 km s-1, as can be seen in Fig. 1 and even better in the blow-up of the H
1500 km s-1, as can be seen in Fig. 1 and even better in the blow-up of the H![]() wings in Fig. 2.
However, these high velocities seem to come from electron scattering,
since no other element identified in our data present such
characteristic.
wings in Fig. 2.
However, these high velocities seem to come from electron scattering,
since no other element identified in our data present such
characteristic.
We identify Paschen 22 to Paschen 12 lines in our spectra. We show one of these lines, Paschen 19, in Fig. 3.
They display strong variations in our FEROS and Narval data. In the
1999 FEROS data, we detect a single-peaked profile with a blue
shoulder. This shoulder becomes more prominent, probably because of the
better S/N, in the Narval data. However, with the 2007
FEROS data, we clearly have a double-peaked profile with a peak
separation of 190 km s-1. Assuming the shoulder
previously seen in 1999 and in the Narval data as another peak, we have
a variation of V/R in the 2007 FEROS data. A similar variation was
reported by Andrillat & Houziaux (1991), which was associated to an outburst. The wings of Paschen lines are extended in all spectra to ![]() 300 km s-1.
However, as seen in Table 1, we believe the radial velocities
obtained for the Paschen lines are affected by some problems with the
precision of the wavelength calibration of FEROS, beyond 8300 Å.
300 km s-1.
However, as seen in Table 1, we believe the radial velocities
obtained for the Paschen lines are affected by some problems with the
precision of the wavelength calibration of FEROS, beyond 8300 Å.
![\begin{figure}
\par\includegraphics[width=8.5cm,clip]{11318fg1.eps}
\end{figure}](/articles/aa/full_html/2009/46/aa11318-08/img11.png)
|
Figure 1: Balmer lines seen in the FEROS spectra of HD 50138. The solid line is related to the spectrum taken in 1999 and the dotted line to the 2007 one. |
| Open with DEXTER | |
![\begin{figure}
\par\includegraphics[width=8.5cm,clip]{11318fg2.eps}
\end{figure}](/articles/aa/full_html/2009/46/aa11318-08/img12.png)
|
Figure 2:
H |
| Open with DEXTER | |
![\begin{figure}
\par\includegraphics[width=8.5cm,clip]{11318fg3.eps}
\end{figure}](/articles/aa/full_html/2009/46/aa11318-08/img13.png)
|
Figure 3: Variations in the line profile of Paschen 19 at 8413 Å. |
| Open with DEXTER | |
- Iron
We have identified permitted lines from the multiplets 20, 21, 25, 26, 27, 28, 30, 37, 38, 41, 42, 43, 49, 55, 73, 74, 167, 190, 200, and 203. Unlike Jaschek & Andrillat (1998), where the Fe II lines show absorption (mainly) or emission profiles, our spectrum presents a special kind of profile for each date (see Fig. 4). In the 1999 FEROS spectrum, these lines have a P-Cygni profile, where the absorption component is made up of two components, with the bluer one being more intense. In the 2007 FEROS spectrum, these lines have a different profile. There is an emission profile associated to a strong central absorption that also has two components, where the bluer one is also more intense. These absorption components are shifted to higher velocities compared to 1999. On the other hand, the Narval data show a sort of transition between the P-Cygni profile and the profile seen in the 2007 FEROS spectrum. The absorption components are not as intense as seen in the other spectra; however, three of them can be seen, where the red one, contrary to the FEROS data, is the most intense.
![\begin{figure}
\par\includegraphics[width=8.8cm,clip]{11318fg4.eps}
\end{figure}](/articles/aa/full_html/2009/46/aa11318-08/img14.png)
|
Figure 4: Variations in the line profiles of the Fe II multiplet 42. The bottom line corresponds to the line at 4923 Å, the middle one at 5018 Å, and the top one at 5169 Å. |
| Open with DEXTER | |
- Oxygen
The permitted lines present a complex profile and show a strong variation in the different spectra (see Fig. 5). The line centered at 7774 Å is in fact a triplet, thus the profile seen in our data has a combination of possible emission and absorption components from each line. However, the profile of this triplet changes strongly at different dates, as already mentioned by Jaschek & Andrillat (1998). Unlike the 1999 data, the 2007 FEROS data show the absorption components clearly superimposed over a strong emission component, similar to the Fe II lines. In the Narval spectrum, this line has a transitional profile between those detected in the different FEROS spectra, especially in the emission component.
Another oxygen line present in our spectra is located at 8446 Å. This line presents a strong emission in the FEROS spectrum of 1999 and in the Narval data; however, this profile changes completely in the FEROS spectrum of 2007, because it is less intense and has multiple peaks.
![\begin{figure}
\par\includegraphics[width=8.8cm,clip]{11318fg5.eps}
\end{figure}](/articles/aa/full_html/2009/46/aa11318-08/img15.png)
|
Figure 5: Profiles of the permitted lines of O I and their variation. The bottom line corresponds to the triplet at 7774 Å and the top one at 8446 Å. |
| Open with DEXTER | |
- Helium
Our spectra do not show any He II line. The tentative detection of the He II line at 10 123 Å, as reported by Jaschek & Andrillat (1998), could not be confirmed by our Narval data. We can therefore claim that this object is not very hot.
![\begin{figure}
\par\includegraphics[width=8.5cm,clip]{11318fg6.eps}
\vspace*{2mm}
\end{figure}](/articles/aa/full_html/2009/46/aa11318-08/img16.png)
|
Figure 6: Line profile variation of the He I line at 5876 Å. The solid line is related to the spectrum taken in 1999 and the dotted line to the 2007 one. |
| Open with DEXTER | |
- Magnesium
![\begin{figure}
\par\includegraphics[width=8.5cm,clip]{11318fg7.eps}
\vspace*{5mm}
\end{figure}](/articles/aa/full_html/2009/46/aa11318-08/img17.png)
|
Figure 7: As in Fig. 6 but for the Mg II line at 4481 Å. |
| Open with DEXTER | |
- Silicon
![\begin{figure}
\par\includegraphics[width=8.5cm,clip]{11318fg8.eps}
\end{figure}](/articles/aa/full_html/2009/46/aa11318-08/img18.png)
|
Figure 8: The variation of the line profile of Si II at 6347 Å. |
| Open with DEXTER | |
![\begin{figure}
\par\includegraphics[width=8.5cm,clip]{11318fg9.eps}
\end{figure}](/articles/aa/full_html/2009/46/aa11318-08/img19.png)
|
Figure 9: As in Fig. 6 but for the Si II lines at 4128 Å and 4131 Å. |
| Open with DEXTER | |
- Sodium
![\begin{figure}
\par\includegraphics[width=8.5cm,clip]{11318f10.eps}
\end{figure}](/articles/aa/full_html/2009/46/aa11318-08/img20.png)
|
Figure 10: Different line profiles of the Na I lines at 5890 Å and 5896 Å. The normalized continuum is also presented for each date. |
| Open with DEXTER | |
- Other lines
3.2 Determination of the extinction and spectral classification
The determination of the stellar parameters of HD 50138 is difficult, since both its spectral lines and its continuum show strong variations. It is, therefore, not surprising that the range of spectral types (from earlier than B5 down to A0) and luminosity classes (I-V) found in the literature is rather wide, because we can expect that these determinations depend on the method (or lines) used for the classification, as well as on the period at which the observations were obtained.
![\begin{figure}
\par\includegraphics[width=8.5cm,clip]{11318f11.eps}
\end{figure}](/articles/aa/full_html/2009/46/aa11318-08/img21.png)
|
Figure 11: Time variation of photometric observations in the UBVRI bands collected from the literature (see Table 2). Also shown are the supposed positions of the outburst and the shell phase reported in the literature. The dashed lines in the B and V bands indicate the mean values before and after the outburst. The dotted bar in the B and V light-curves refer to the observations of Alvarez & Schuster (1981). |
| Open with DEXTER | |
To constrain the spectral classification of HD 50138, we made use of both our own sets of high-resolution optical spectra and public photometric data. We collected all available UBVRI band photometric data. These observations cover a time interval of almost 25 years and are displayed in Fig. 11. The references for the data are listed in Table 2.
Unfortunately, hardly any photometric data could be found before and around the time of the outburst, which was reported to have happened in 1978/79 (Hutsemékers 1985). The consequences of this outburst are, however, clearly visible in the light curves displayed in Fig. 11: a fading of the star in the UBV bands by about 0.2 mag, and a recovery to the old brightness after about 5 years. This trend in photometric data might be explained by some large mass ejection during the outburst, hiding the stellar continuum inside a dense shell or ring of (partly) optically thick material, which then turns transparent during expansion, allowing the underlying star to be seen again. On the other hand, the shell phase seen in the optical spectra in 1990/91 (Andrillat & Houziaux 1991) remained invisible in the photometric data, as cited by Halbedel (1991). This might indicate that the shell phase was caused by mass ejection with much less mass loss.
Table 2: References to the UBVRI observations of HD 50138 shown in Fig. 11.
Interestingly, after the recovery of the star, it seems to be even
brighter than it was before the outburst, as can be seen by the
comparison of the mean values before and after the outburst (Fig. 11).
We also notice that the mean value before is based only on two
datapoints, but even considering the large errorbars of these
observations, it seems that the star appears brighter after ![]() 1984. In addition, Alvarez & Schuster (1981)
observed HD 50138 in a period close to the outburst, but without
providing either the exact dates or the observed magnitudes. However,
these authors claimed that during their observations, HD 50138 was
not variable, compared to previous observations, meaning that
1984. In addition, Alvarez & Schuster (1981)
observed HD 50138 in a period close to the outburst, but without
providing either the exact dates or the observed magnitudes. However,
these authors claimed that during their observations, HD 50138 was
not variable, compared to previous observations, meaning that ![]() and
and
![]() mag, according
to their definition of variability.
mag, according
to their definition of variability.
This apparent brightening after ![]() 1984
might be caused by some contribution of the circumstellar material
ejected during the outburst and after adding flux at all bands. Even
though HD 50138 is known to possess a strong infrared excess
emission due to circumstellar dust (Allen 1973), this dust will hardly contribute at optical wavelengths, i.e., in the UBV bands. On the other hand, based on
spectropolarimetric observations performed in 1995 by Bjorkman et al.
(1998),
HD 50138 seems to have an almost edge-on ionized Be-like disk.
Such a disk, which might have been formed from the outburst material in
a similar way to how disks are formed around classical Be stars, can
well add flux to the optical continuum in the form of free-free and
especially free-bound emission.
1984
might be caused by some contribution of the circumstellar material
ejected during the outburst and after adding flux at all bands. Even
though HD 50138 is known to possess a strong infrared excess
emission due to circumstellar dust (Allen 1973), this dust will hardly contribute at optical wavelengths, i.e., in the UBV bands. On the other hand, based on
spectropolarimetric observations performed in 1995 by Bjorkman et al.
(1998),
HD 50138 seems to have an almost edge-on ionized Be-like disk.
Such a disk, which might have been formed from the outburst material in
a similar way to how disks are formed around classical Be stars, can
well add flux to the optical continuum in the form of free-free and
especially free-bound emission.
Whether the additional continuum emission from the ionized circumstellar material/disk will hamper proper spectral classification of HD 50138, or whether we even have to account for circumstellar dust along the line of sight towards the star, acting as a further (i.e. circumstellar) extinction source, will be discussed and investigated in detail in Sects. 3.2.3 and 3.2.2, respectively.
3.2.1 The interstellar extinction
First, we estimate the total extinction towards HD 50138, i.e., neglect any circumstellar contribution and thus derive an upper limit on the interstellar one. For this, we make use of the two color indices (U-B) and (B-V). Their variations with time are plotted in Fig. 12.
![\begin{figure}
\par\includegraphics[width=8cm,clip]{11318f12.eps}
\end{figure}](/articles/aa/full_html/2009/46/aa11318-08/img24.png)
|
Figure 12: Time variation of the observed (U-B) and (B-V) color indices. |
| Open with DEXTER | |
Obviously, (U-B) is quite variable, while (B-V) remains rather stable, even during the outburst phase. Despite the variability in (U-B), we can obtain a reasonable range for the possible stellar classification from these observed
color indices, making use of the following relations for the interstellar extinction determinations,
| E(B-V) | = | (B-V) - (B-V)0 | (1) |
| E(B-V) | = | (2) |
The second relation follows from Leitherer & Wolf (1984), and the parameters (U-B)0 and (B-V)0 refer to the intrinsic color indices. By combining these two equations, we obtain for each observed set of (U-B) and (B-V) colors a reddening independent equation of the form
relating the two intrinsic colors, with
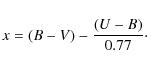
|
(4) |
We calculate the parameter x, hence the relation Eq. (3), for each observation. Then we search for the two boundary cases, i.e., the highest and lowest values for x, and plot the resulting range in relation Eq. (3) in Fig. 13. Next, we look up the tables of Schmidt-Kaler (1982) for the intrinsic colors of stars in the spectral range B3 to A1. The luminosity class of HD 50138 is not well known, but previous classifications found in the literature tend towards luminosity classes III-V (e.g., Houziaux 1960; Houziaux & Andrillat 1976; Frémat et al. 2006). Based on the Hipparcos distance, we can already exclude a supergiant classification for HD 50138, since it would deliver an unrealistically high extinction value. We thus restrict it to luminosity classes II to V.
![\begin{figure}
\par\includegraphics[width=8.5cm,clip]{11318f13.eps}
\end{figure}](/articles/aa/full_html/2009/46/aa11318-08/img28.png)
|
Figure 13: Constraining the range in spectral type for different luminosity classes. The solid lines correspond to the upper and lower limits derived from observations. |
| Open with DEXTER | |
The behavior of the intrinsic colors from Schmidt-Kaler (1982) is included in Fig. 13. From the overlap with the observational ranges we find some preliminary sets, as listed in Table 3, of MK types, effective temperatures and color excess values, which are upper limits to the real interstellar extinction. The assignment of the temperature ranges is made based on the tables of Flower (1996).
Table 3: Possible stellar classifications of HD 50138 under the assumption of pure interstellar extinction along the line of sight.
A rather low value for the interstellar extinction has already been
suggested by Houziaux & Andrillat (1976) and Hutsemékers (1985) based on the weakness of the interstellar feature at
![]() and on the absence of interstellar lines in the IUE spectrum. To split
the total extinction value into its interstellar and (possible)
circumstellar contributions we, therefore, search for further
extinction indicators in our spectra. One such indicator makes use of
diffuse interstellar bands (DIBs). In our high-resolution spectra, we
found one reasonably good DIB at
and on the absence of interstellar lines in the IUE spectrum. To split
the total extinction value into its interstellar and (possible)
circumstellar contributions we, therefore, search for further
extinction indicators in our spectra. One such indicator makes use of
diffuse interstellar bands (DIBs). In our high-resolution spectra, we
found one reasonably good DIB at ![]()
![]() ,
from which the extinction can be derived (see Herbig 1993). This feature is present in both the 1999 and the 2007 FEROS spectra, but because of the poor S/N of the 1999
data we can rely only on our 2007 data. From the equivalent width of 0.04 Å of this DIB, we derive an extinction value of
,
from which the extinction can be derived (see Herbig 1993). This feature is present in both the 1999 and the 2007 FEROS spectra, but because of the poor S/N of the 1999
data we can rely only on our 2007 data. From the equivalent width of 0.04 Å of this DIB, we derive an extinction value of
![]() mag.
mag.
As a further check we investigate the interstellar extinction within
the
galactic plane in the region around our target. It turns out that
HD 50138 is located within a region of rather low extinction (see
Neckel & Klare 1980; Chen et al. 1989;
Arenou et al. 1992). Using the model developed by Hakkila et al. (1997) for the large-scale visual interstellar extinction, assuming
RV = AV/E(B-V) = 3.1, we have obtained
![]() mag, delivering
mag, delivering
![]() mag.
This value agrees with the value we found from the DIB. However,
because of higher uncertainty (and definitely larger error) with this
method, the value found from the DIB of
mag.
This value agrees with the value we found from the DIB. However,
because of higher uncertainty (and definitely larger error) with this
method, the value found from the DIB of
![]() mag
seems to be reasonably accurate, leading us to use this value later.
Compared to the (upper limit) values we found from the color indices,
the contribution of the interstellar extinction towards HD 50138
is thus only half of it, indicating that the other part must be
circumstellar in nature.
mag
seems to be reasonably accurate, leading us to use this value later.
Compared to the (upper limit) values we found from the color indices,
the contribution of the interstellar extinction towards HD 50138
is thus only half of it, indicating that the other part must be
circumstellar in nature.
3.2.2 The influence of circumstellar dust
The presence of a strong infrared excess implies that HD 50138 must be surrounded by circumstellar dust (Allen 1973). How this dust is distributed, i.e., whether it is situated within a disk or shell, within or outside the line of sight, is not known.
The circumstellar dust, like the interstellar one, absorbs and scatters
the light from the star, so that we can define a circumstellar
extinction parameter,
![]() .
The intrinsic magnitude of the star in each photometric band, UBV0, is then obtained from the observed one, corrected for the amounts of interstellar and circumstellar extinction, i.e,
.
The intrinsic magnitude of the star in each photometric band, UBV0, is then obtained from the observed one, corrected for the amounts of interstellar and circumstellar extinction, i.e,
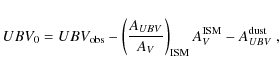
with the parameters
The dust extinction parameter,
![]() ,
can be calculated from
,
can be calculated from
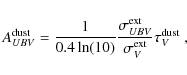
|
(6) |
with
![\begin{figure}
\par\includegraphics[width=8.5cm,clip]{11318f14.eps}
\end{figure}](/articles/aa/full_html/2009/46/aa11318-08/img49.png)
|
Figure 14: Intrinsic colors as a function of dust optical depth. Individual curves represent calculations performed for a mixture of silicates and amophous carbon grains for either single (smallest and largest, as cited in the text) grain sizes or an MRN grain size distribution. The dotted lines indicate theoretically expected intrinsic colors for different spectral types. |
| Open with DEXTER | |
For each grain size and species, the dust extinction depends on only one free parameter, which is
![]() .
Expressing the set of
Eqs. (5) by the intrinsic color indices (U-B)0 and (B-V)0, we end up with two equations
.
Expressing the set of
Eqs. (5) by the intrinsic color indices (U-B)0 and (B-V)0, we end up with two equations
| (U-B)0 | = | (7) | |
| (B-V)0 | = | (8) |
These calculated intrinsic colors for different dust optical depths can then be compared to theoretically expected color indices of stars with different spectral type and luminosity class (e.g. Schmidt-Kaler 1982), in order to constrain the range of possible spectral classifications.
The results are shown in Fig. 14
for stars with luminosity class V, but the results for the other
luminosity classes are very similar. Plotted are the dependences of the
two intrinsic color indices on
![]() computed for the smallest and largest grains, as well as
for the MRN grain size distribution, using a mixture of silicates and
amorphous carbon. The theoretically expected values
for the different spectral types are also shown. Obviously, an
agreement between the computed and theoretical color indices
(delivering the same dust optical depth) is achieved only for stars
with spectral type between B6 and B7. Very similar results
are found for the luminosity classes III/IV, while for stars with
luminosity class II we find a possible spectral range of B8-8.5.
computed for the smallest and largest grains, as well as
for the MRN grain size distribution, using a mixture of silicates and
amorphous carbon. The theoretically expected values
for the different spectral types are also shown. Obviously, an
agreement between the computed and theoretical color indices
(delivering the same dust optical depth) is achieved only for stars
with spectral type between B6 and B7. Very similar results
are found for the luminosity classes III/IV, while for stars with
luminosity class II we find a possible spectral range of B8-8.5.
Interestingly, pure large grains are not able to account for the circumstellar extinction. Instead, the circumstellar dust along the line of sight must consist of predominantly small grains, which can be located in an optically thin dust sphere or shell, in agreement with the results of Bjorkman et al. (1998). However, other scenarios, like a dusty disk where the dust is not in our line of sight or is optically thin, since it is formed far from the star, cannot be discarded. An interferometric analysis will probably answer this question about the circumstellar dust geometry (Borges Fernandes et al., in preparation).
3.2.3 The influence of the ionized circumstellar disk
The contribution of an ionized envelope or disk to the total continuum emission of early-type stars was the subject of many detailed investigations during the past years. For the case of classical Be stars, for instance, Zorec & Briot (1991) found a relation between the excess emission in the V band (defined as the difference between the V band magnitudes measured during the Be phase and the non-Be phase) and the effective temperature of the star. Their relation indicates a stronger circumstellar contribution for hotter (i.e., earlier) Be stars, while late-type Be stars hardly show any contamination of their V band fluxes by their circumstellar ionized material. A similar trend was found by detailed numerical studies of Stee & Bittar (2001), who found circumstellar contributions to the continuum in the B and V bands for a B5e star of 0.57% and 6.01%, respectively, while the contributions are found to be much lower for later types. But not only are classical Be stars influenced by their ionized circumstellar material, B-type supergiants can also have a significant wind contribution at all optical bands, as recently shown by Kraus et al. (2008; 2009).
B[e] stars are generally believed to have disks with higher densities than classical Be stars. In this case, an influence of the free-free and at optical wavelengths, especially of the free-bound continuum emission, might thus be expected. But in contrast to circumstellar dust, which acts at optical wavelengths as a pure absorber that dims the stellar light, the free-free and free-bound processes act not only as an absorber, but at the same time as an additional emission component, which adds more flux at a given wavelength than it absorbs from the underlying stellar flux. A star with an ionized disk thus usually appears brighter at all wavelengths compared to a star with no ionized disk (see Kraus et al. 2008; 2009).
We check the influence of such an ionized circumstellar disk on the proper spectral type determination by calculating the emission of free-free and free-bound processes in circumstellar disks of different densities. The shape of the continuum emission of the ionized gas does not severely depend on the geometry of the ionized material. For instance, a spherically symmetric wind and a geometrically flat disk result in the same shape of the wavelength dependent free-free and free-bound continuum emission. This indicates that the identical continuum flux distribution can be obtained from quite different geometrical scenarios. In addition, the free-free and free-bound continuum at optical wavelengths is generated in the close vicinity of the star, typically within 2-5 R* (Kraus et al. 2008). It can thus not offer any insight into the global disk density distribution and geometry.
Since our aim is only to obtain proper stellar parameters, but not a global description of the detailed geometry and density variations within the highly dynamical and non-spherically symmetric circumstellar material, for which we definitely have too little observational information at hand, we study the influence of the ionized disk emission on the color indices in a very simplified way.
![\begin{figure}
\par\includegraphics[width=8cm,clip]{11318f15.eps}
\end{figure}](/articles/aa/full_html/2009/46/aa11318-08/img52.png)
|
Figure 15: Increase in disk flux with respect to the stellar flux ( top panel) and intrinsic colors ( mid and bottom panel) with disk surface density. The dotted lines indicate theoretically expected intrinsic colors for different spectral types and a luminosity class V. The box extending over all three panels gives the range in possible classifications and the corresponding needed disk flux in all three bands. |
| Open with DEXTER | |
From the literature values (see Fig. 11) we computed the pre-outburst
average observed magnitudes in the UBV bands, deredden them with the
interstellar extinction value derived in Sect. 3.2.1, and convert them
into fluxes. These fluxes correspond to the star plus disk system. Then, individual
disk fluxes in the UBV bands were calculated. For this, we adopted a very
simple disk model whose surface density distribution can be described by

|
(9) |
Such a surface density distribution follows, e.g., for the case of an outflowing disk forming wind, which might be an appropriate model. In that case, the surface density at the inner edge of the disk is given by (see Borges Fernandes et al. 2007)

|
(10) |
where
The disk fluxes (in the form of free-free and free-bound emission) in
the UBV bands, resulting from disks with increasing values of
![]() ,
are then subtracted from the observed and interstellar extinction
corrected ones. The resulting pure stellar fluxes are converted back
into magnitudes and the color indices are derived. The results are
shown in Fig. 15.
Obviously, for low surface densities, the contribution of the disk is
negligible, while its importance drastically increases with increasing
surface density
(top panel of Fig. 15).
,
are then subtracted from the observed and interstellar extinction
corrected ones. The resulting pure stellar fluxes are converted back
into magnitudes and the color indices are derived. The results are
shown in Fig. 15.
Obviously, for low surface densities, the contribution of the disk is
negligible, while its importance drastically increases with increasing
surface density
(top panel of Fig. 15).
Because of the increasing disk flux in all three bands with respect to the stellar flux, the star must be intrinsically fainter in all three bands (see Fig. 15), especially influencing the (B-V) color index (lower panel) more than the (U-B) (middle panel). From a comparison of the derived color indices to the expected intrinsic colors of Schmidt-Kaler (1982) for stars of luminosity class V and different spectral types, we find a rather narrow range of valid stellar classifications, as indicated by the box extending over the complete plot in Fig. 15. While for luminosity classes III-V the range in spectral type is B6-7, we find a spectral type of B8 for luminosity class II. These ranges are in fairly good agreement with those found previously. This is not surprising, because the amount of circumstellar extinction is rather small, so that no big changes in intrinsic colors can be expected.
We would like to emphasize that the surface density chosen for the x-axis
to plot our results in Fig. 15 is not the most relevant parameter.
Instead, the influence of the disk as shown in the top panel is the crucial
parameter here. Such fractions of the free-free and free-bound continuum can
also be achieved with quite different geometrical models and density
distributions. Nevertheless, the range in values for
![]() found
from our analysis can easily be achieved with typical values for B[e]
stars, e.g., disk opening angles in the range of 5-30 degrees,
disk outflow velocities of 10-100 km s-1, and mass loss rates typically of 10-8 to 10
found
from our analysis can easily be achieved with typical values for B[e]
stars, e.g., disk opening angles in the range of 5-30 degrees,
disk outflow velocities of 10-100 km s-1, and mass loss rates typically of 10-8 to 10
![]() yr-1.
However, the exact value for each parameter cannot be provided by our
research due to the lack of reliable information concerning the
geometry and dynamics of such a possible pre-outburst ionized disk, and
the modeling provided here cannot be regarded as the only valid answer.
It was only used to qualitatively discuss the influence of the ionized
material to the color indices of the star in order to constrain the
spectral classification of HD 50138. How the ionized material is
really distributed around the star cannot be derived from a pure
free-free and free-bound emission calculation.
yr-1.
However, the exact value for each parameter cannot be provided by our
research due to the lack of reliable information concerning the
geometry and dynamics of such a possible pre-outburst ionized disk, and
the modeling provided here cannot be regarded as the only valid answer.
It was only used to qualitatively discuss the influence of the ionized
material to the color indices of the star in order to constrain the
spectral classification of HD 50138. How the ionized material is
really distributed around the star cannot be derived from a pure
free-free and free-bound emission calculation.
From our analysis of the circumstellar extinction contributions
of either the dust or the ionized disk, we find possible
classifications of HD 50138
as either a B6-7 III-V star with
![]() K, or a
B8-8.5 II star with
K, or a
B8-8.5 II star with
![]() K. As a further check of these derived classifications, we derived the ratio of
the equivalent widths of the most plausible photospheric Si II
lines
in our spectra. The ratios of the 4131 Å/4128 Å and the
5056 Å/5041 Å equivalent widths are sensitive to temperature
and surface gravity and have been computed from the line identification
tables obtained with the code SYNSPEC (see Hubeny & Lanz 2000) based on Kurucz (1979) model atmospheres in local
thermodynamical equilibrium and Kurucz (1993)
line lists.
At temperatures between 10 000 K and 12 000 K and
surface gravities according to luminosity class II, these ratios
show a mild increase with temperature from 1.7 to 1.8
(4131 Å/4128 Å) and from 2.1 to 2.3
(5056 Å/5041 Å),
while the observed values, based on Table 1, are
K. As a further check of these derived classifications, we derived the ratio of
the equivalent widths of the most plausible photospheric Si II
lines
in our spectra. The ratios of the 4131 Å/4128 Å and the
5056 Å/5041 Å equivalent widths are sensitive to temperature
and surface gravity and have been computed from the line identification
tables obtained with the code SYNSPEC (see Hubeny & Lanz 2000) based on Kurucz (1979) model atmospheres in local
thermodynamical equilibrium and Kurucz (1993)
line lists.
At temperatures between 10 000 K and 12 000 K and
surface gravities according to luminosity class II, these ratios
show a mild increase with temperature from 1.7 to 1.8
(4131 Å/4128 Å) and from 2.1 to 2.3
(5056 Å/5041 Å),
while the observed values, based on Table 1, are
![]() and
and
![]() in 1999 and
in 1999 and
![]() and
and
![]() in 2007. From this discrepancy between observed and calculated
equivalent width ratios, a B8-8.5 II scenario
for HD 50138 can be excluded. For higher temperatures and
especially higher surface gravities, the variations in the equivalent
width ratios are no longer strictly correlated, but an overlap in the
theoretical and observational values for stars of spectral types in the
range B6-7 III-V occurs, so that these equivalent width ratios can
be
used at least as a qualitative check for consistency. From the
photometric results
and the qualitative agreement with the equivalent width ratios of Si II
lines, we can claim that the final spectral classification of HD 50138 is
a B6-7 III-V star. It is important to cite that our results agree with the classification obtained by Zorec et al. (1998) and Cidale et al.(2001) using the BCD (Barbier-Chalonge-Divan) spectrophotometric system, based on the study of the Balmer discontinuity.
in 2007. From this discrepancy between observed and calculated
equivalent width ratios, a B8-8.5 II scenario
for HD 50138 can be excluded. For higher temperatures and
especially higher surface gravities, the variations in the equivalent
width ratios are no longer strictly correlated, but an overlap in the
theoretical and observational values for stars of spectral types in the
range B6-7 III-V occurs, so that these equivalent width ratios can
be
used at least as a qualitative check for consistency. From the
photometric results
and the qualitative agreement with the equivalent width ratios of Si II
lines, we can claim that the final spectral classification of HD 50138 is
a B6-7 III-V star. It is important to cite that our results agree with the classification obtained by Zorec et al. (1998) and Cidale et al.(2001) using the BCD (Barbier-Chalonge-Divan) spectrophotometric system, based on the study of the Balmer discontinuity.
To finish our stellar parameter study, we want to determine the possible
ranges in stellar luminosities. Our ionized disk model implies a pure stellar V band
flux from 6.49 mag to 6.71 mag for the lowest and highest
possible disk contributions of 7% and 20%, respectively, in the range
of possible MK types. We thus conclude that the star has an intrinsic V band flux
of
![]() mag. This result has been obtained from considering the
pre-outburst photometry only. We also tried it with the post-outburst data.
Thanks to the high variability of the data, the results still agree with
a B6-7 star but have a higher uncertainty. Using the bolometric corrections
for B6-7 III-V stars from Flower (1996) and the Hipparcos distances
towards HD 50138 of
mag. This result has been obtained from considering the
pre-outburst photometry only. We also tried it with the post-outburst data.
Thanks to the high variability of the data, the results still agree with
a B6-7 star but have a higher uncertainty. Using the bolometric corrections
for B6-7 III-V stars from Flower (1996) and the Hipparcos distances
towards HD 50138 of
![]() pc, we can finally
calculate the stellar luminosity to
pc, we can finally
calculate the stellar luminosity to
![]() .
.
We did not attempt to derive the luminosities for the case of the circumstellar dust extinction, because: (i) based on the observed ionized disk around HD 50138, this possibility seems to be the more realistic one; and (ii) we currently have no clear indication of the possible dust composition and grain size distribution at hand. Nevertheless, assuming the range in dust optical dephts obtained by our analysis for the MRN grain size distribution (see Fig. 14), the range of stellar luminosities corrected by the circumstellar dust extinction is in a fairly good agreement with the above derived luminosity range.
4 Discussion of the nature of HD 50138
The variability in the line profiles, as cited by Pogodin (1997), seems to be caused by shell phases and/or outburst events. As described in the Sect. 3.1, from comparison of our spectroscopic data, we saw that there is a sort of temporal evolution, in particular an increase of a blue emission component and a redshift of the absorption ones. Based on this, we believe that a new ejection of material took place prior to our Narval observations, i.e., before March 2007 with increasing emission later on (our second FEROS observation). This new shell phase would be the responsible for the changes seen in our data.
Another possibility is that the material was ejected in our direction, possibly by a hot spot on the stellar surface, forming a kind of ``one-armed spiral'', as suggested for classical Be stars. If this was the case, this would mainly explain the blue-shifted emission. On the other hand, even without having complete knowledge of the wind contribution for all lines, we suggested that for some of them, there is no contamination from the wind and they have a pure photospheric origin. Based on this, an extended and expanding atmosphere or a new ring or envelope with a lower outflow velocity that started to expand some time in early 2007 (or slightly earlier) could explain the changes in the radial velocities seen in the photospheric lines (see Fig. 9 and Table 1).
The results of Bjorkman et al. (1998), claiming the existence of intrinsic polarization due to electron scattering, indicate a non-spherically symmetric structure with a gaseous disk seen almost edge-on, in association with an optically thin dust envelope. Our results described in Sect. 3.2.2 confirm that such a scenario for the circumstellar dust is possible.
![\begin{figure}
\par\includegraphics[width=8.8cm,clip]{11318f16.eps}
\end{figure}](/articles/aa/full_html/2009/46/aa11318-08/img67.png)
|
Figure 16: Position of HD 50138 on the HR diagram compared to post-main sequence ( top panel) and pre-main sequence ( bottom panel) evolutionary tracks. In the bottom panel, the dotted line defines the zero-age main sequence, the thick solid line defines the birthline. |
| Open with DEXTER | |
Based on the stellar parameters derived in Sect. 3.2.3, we can indicate
the position of HD 50138 on the HR diagram and compare it to evolutionary tracks.
This is shown in Fig. 16, where we plot the evolutionary
tracks from Schaller et al. (1992) in the top panel for stars at solar metallicity. From this plot, HD 50138 is a
![]() star, since still on, or just
evolving off, the main sequence. The lower panel of Fig. 16 shows its position compared to pre-main sequence evolutionary tracks from Bernasconi & Maeder (1996). The
ZAMS, as well as the birthline are also included. This plot indicates a stellar mass of roughly
star, since still on, or just
evolving off, the main sequence. The lower panel of Fig. 16 shows its position compared to pre-main sequence evolutionary tracks from Bernasconi & Maeder (1996). The
ZAMS, as well as the birthline are also included. This plot indicates a stellar mass of roughly
![]() ,
but for a star that is approaching the main sequence.
,
but for a star that is approaching the main sequence.
From the position in the HR diagram alone, it is not possible to distinguish between a pre-main sequence and a post-main sequence evolutionary phase, however we can discuss some points about the possible nature of HD 50138.
- Pre-main sequence nature:
On the other hand, the absence of any nebulosity around HD 50138 and its situation far from any star-forming region (Pogodin 1997) is against a Herbig B[e] classification. The possible shell ejection phases are also against a young nature. In addition, the results of Bjorkman et al. (1998) show that the dust is probably distributed in an optically thin envelope and not in an accretion disk.
- A Be star close to (or just at the turn-off from) the main sequence:
The high-density circumstellar matter and the gaseous ionized disk-like structure speak for rather high mass loss. This mass loss must have been much higher than in the case of classical Be stars, forming disk-like or spiral arm structures, if the material was expelled from some hot spots on the stellar surface and expanding outwards. Because of the much higher initially released masses in equatorial direction, the density in the outer regions will have ideal conditions for the production of the forbidden emission lines. This mass loss might be less than in the case of B[e] stars. Then, in agreement with Jaschek et al. (1993), we might claim that HD 50138 is ``a transition object between Be and B[e] stars".
- Binary system:
On the other hand, since the radius of the FEROS aperture is 1
![]() ,
in principle, there might be a chance that we observed both components
at the same time. However, we could not find any spectral feature to
confirm the existence of a secondary component. This result also agrees
with Corporon & Lagrange (1999), who searched for T Tauri companions in a sample of HAeBe candidates, based on several diagnostic lines, e.g. from Ca I, Fe I and Li I.
They did not find any evidence of binarity for HD 50138. However,
a HAeBe star as a companion could not be completely discarded. Thus, at
this moment we can neither confirm nor exclude a possible binary nature
for HD 50138.
,
in principle, there might be a chance that we observed both components
at the same time. However, we could not find any spectral feature to
confirm the existence of a secondary component. This result also agrees
with Corporon & Lagrange (1999), who searched for T Tauri companions in a sample of HAeBe candidates, based on several diagnostic lines, e.g. from Ca I, Fe I and Li I.
They did not find any evidence of binarity for HD 50138. However,
a HAeBe star as a companion could not be completely discarded. Thus, at
this moment we can neither confirm nor exclude a possible binary nature
for HD 50138.
- Other classes of B[e] stars:
5 Conclusions
HD 50138 is a very curious star that displays strong
spectroscopic variations. Based on analysis of new high-resolution
data, we present a detailed description of these variations. Our
analysis of the photometric data suggests that HD 50138 is a
B6-7 III-V star, whose luminosity was tentatively obtained from a
careful study of the influence of the possible circumstellar extinction
sources and based on the new Hipparcos distance. A new value for the
color excess,
![]() mag,
was derived. In addition, we suggest that a new-shell phase or the
formation of one-armed spiral could have taken place before 2007.
mag,
was derived. In addition, we suggest that a new-shell phase or the
formation of one-armed spiral could have taken place before 2007.
Based on our results, a pre-main sequence star or a transition object between Be and B[e] stars, close to or just at the turn-off from the main sequence, or a binary scenario, can be neither confirmed nor discarded; however, an observational campaign, based on photometry, to derive a detailed light-curve and high-resolution spectroscopy associated to a detailed analysis in terms of the line profile appearances and variations have to be performed to confirm the possible shell phases of this star. A careful interferometric analysis, associated to a SED modeling considering different scenarios for the circumstellar dust is in progress (Borges Fernandes et al., in preparation) and will certainly provide better constraints for the circumstellar geometry and the nature of this curious star.
AcknowledgementsThis research made use of the NASA Astrophysics Data System (ADS) and of the SIMBAD, VizieR and 2MASS databases. M.B.F. acknowledges financial support from the Programme National de Physique Stellaire (France) and the Centre National de la Recherche Scientifique (CNRS-France) for the post-doctoral grant. M.K. acknowledges financial support from GA AV CR number KJB300030701. M.B.F. and F.X.A. acknowledge Dr. Victor de Amorim d'Ávila to perform the observations at ESO (La Silla, Chile). A.D.S. acknowledges Dr. Michel Auriere to perform the observations at the Observatoire Midi Pyrenees (France). M.B.F. acknowledges Dr. Pierre Cruzalébes for his help with Hakkila et al. (1997) software. We acknowledge Dr. Adéla Kawka for comments on the manuscript and we also wish to thank Dr. Jirí Kubát for providing us with his databases computed with SYNSPEC.
References
- Allen, D. A. 1973, MNRAS, 161, 145 [NASA ADS]
- Alvarez, M., & Schuster, W. J. 1981, Rev. Mex. Astron. Astrophys., 6, 163 [NASA ADS]
- Andrillat, Y., & Houziaux, L. 1972, Ap&SS, 18, 324 [NASA ADS] [CrossRef]
- Andrillat, Y., & Houziaux, L. 1991, IAUC, 5164, 3 [NASA ADS]
- Arenou, F., Grenon, M., & Gomez, A. 1992, A&A, 258, 104 [NASA ADS]
- Baines, D., Oudmaijer, R. D., Porter, J. M., et al. 2006, MNRAS, 367, 737 [NASA ADS] [CrossRef]
- Bernasconi, P. A., & Maeder, A. 1996, A&A, 307, 829 [NASA ADS]
- Bjorkman, K. S., Miroshnichenko, A. S., Bjorkman, J. E., et al. 1998, ApJ, 509, 904 [NASA ADS] [CrossRef]
- Bopp, B. W. 1993, IBVS, 3834, 1
- Borges Fernandes, M., Kraus, M., Lorenz Martins, S., et al. 2007, MNRAS, 377, 1343 [NASA ADS] [CrossRef]
- Cardelli, J. A., Clayton, G. C., & Mathis, J. S. 1989, ApJ, 345, 245 [NASA ADS] [CrossRef]
- Chen, B., Vergely, J. L., Valette, B., et al. 1998, A&A, 336, 137 [NASA ADS]
- Cidale, L., Zorec, J., & Tringaniello, L. 2001, A&A, 368, 160 [NASA ADS] [CrossRef] [EDP Sciences]
- Corporon, P., & Lagrange, A.-M. 1999, A&AS, 136, 429 [NASA ADS] [CrossRef] [EDP Sciences]
- de Winter, D., van den Ancker, M. E., Maira, A., et al. 2001, A&A, 380, 609 [NASA ADS] [CrossRef] [EDP Sciences]
- Doazan, V. 1965, AnAp, 28, 1 [NASA ADS]
- Flower, P. J. 1996, ApJ, 469, 355 [NASA ADS] [CrossRef]
- Frémat, Y., Neiner, C., Hubert, A.-M., et al. 2006, A&A, 451, 1053 [NASA ADS] [CrossRef] [EDP Sciences]
- Hakkila, J., Myers, J. M., Stidham, B. J., et al. 1997, AJ, 114, 2043 [NASA ADS] [CrossRef]
- Halbedel, E. M. 1991, Inf. Bull. Var. Stars, No. 3585, 1
- Hamann, F. 1994, ApJSS, 93, 485 [NASA ADS] [CrossRef]
- Harrington, D. M., & Kuhn, J. R. 2007, ApJ, 667, 89 [NASA ADS] [CrossRef]
- Harrington, D. M., & Kuhn, J. R. 2009, ApJS, 180, 138 [NASA ADS] [CrossRef]
- Haupt, H. F., & Schroll, A. 1974, A&AS, 15, 311 [NASA ADS]
- Herbig, G. H. 1993, ApJ, 407, 142 [NASA ADS] [CrossRef]
- Houziaux, L. 1960, J. Observateurs, 43, 217 [NASA ADS]
- Houziaux, L., & Andrillat, Y. 1976, in Be and Shell Stars, ed. A. Slettebak (Dordrecht: Reidel), IAU Symp., 70, 87
- Hubeny, I., & Lanz, T. 2000, SYNSPEC - A User's Guide
- Hutsemékers, D. 1985, A&AS, 60, 373 [NASA ADS]
- Jaschek, C., & Andrillat, Y. 1998, A&AS, 128, 475 [NASA ADS] [CrossRef] [EDP Sciences]
- Jaschek, M., Jaschek, C., & Andrillat, Y. 1993, A&AS, 97, 781 [NASA ADS]
- Kilkenny, D., Whittet, D. C. B., Davies, J. K., et al. 1985, South African Astron. Obs. Circ., no. 9, 55
- Kraus, M., Kubát, J., & Krticka, J. 2008, A&A, 481, 499 [NASA ADS] [CrossRef] [EDP Sciences]
- Kraus, M., Borges Fernandes, M., & Kubát, J. 2009, A&A, 499, 291 [NASA ADS] [CrossRef] [EDP Sciences]
- Kurucz, R. L. 1979, ApJS, 40, 1 [NASA ADS] [CrossRef]
- Kurucz, R. L. 1993, Atomic Data for Opacity Calculations, Kurucz CD-ROM No. 1
- Lamers, H. J. G. L. M., Zickgraf, F.-J., de Winter, D., Houziaux, L., & Zorec, J. 1998, A&A, 340, 117 [NASA ADS]
- Landaberry, S. J. C., Pereira, C.B., & de Araújo, F. X. 2001, A&A, 376, 917 [NASA ADS] [CrossRef] [EDP Sciences]
- Leitherer, C., & Wolf, B. 1984, A&A, 132, 151 [NASA ADS]
- Mathis, J. S. 1990, ARA&A, 28, 37 [NASA ADS] [CrossRef]
- Mathis, J. S., Rumpl, W., & Nordsieck, K. H. 1977, ApJ, 217, 425 [NASA ADS] [CrossRef]
- Merrill, P. W. 1931, ApJ, 73, 348 [NASA ADS] [CrossRef]
- Merrill, P. W., & Burwell, C. G. 1933, ApJ, 78, 87 [NASA ADS] [CrossRef]
- Merrill, P. W., Humason, M. L., & Burwell, C. G. 1925, ApJ, 61, 389 [NASA ADS] [CrossRef]
- Miroshnichenko, A. S. 2007, ApJ, 667, 497 [NASA ADS] [CrossRef]
- Moore, C. E. 1945, A Multiplet Table of Astrophysical Interest, Part I - Table of Multiplets (Princeton, New Jersey: Princeton University Observatory)
- Neckel, Th., Klare, G., & Sarcander, M. 1980, A&AS, 42, 251 [NASA ADS]
- Oudmaijer, R. D., & Drew, J. E. 1999, MNRAS, 305, 166 [NASA ADS] [CrossRef]
- Penston, M. J. 1973, MNRAS, 164, 133 [NASA ADS]
- Perryman, M. A. C., & ESA 1997, The Hipparcos and Tycho Catalogues (Nordwijk: ESA), ESA SP Ser. 1200
- Pogodin, M. A. 1997, A&A, 317, 185 [NASA ADS]
- Schaller, G., Schaerer, D., Meynet, G., et al. 1992, A&AS, 96, 269 [NASA ADS]
- Schmidt-Kaler, Th. 1982, in Landolt-Börnstein, New Series, Group IV, Vol. 2b, ed. K. Schaifers, & H. H. Voigt (Berlin: Springer), 1
- Stee, Ph., & Bittar, J. 2001, A&A, 367, 532 [NASA ADS] [CrossRef] [EDP Sciences]
- Thackeray, A. D. 1967, MNRAS, 135, 51 [NASA ADS]
- Vaidya, A., Schulte-Ladbeck, R. E., & Bjorkman, K. S. 1994, A&AS, 184, 4411
- van Leeuwen, F. 2007, A&A, 474, 653 [NASA ADS] [CrossRef] [EDP Sciences]
- Waters, L. B. F. M., & Waelkens, C. 1998, ARA&A, 36, 233 [NASA ADS] [CrossRef]
- Zorec J. 1998, in B[e] Stars, Ap&SS Library, ed. A. M. Hubert, & C. Jaschek, 27
- Zorec, J., & Briot, D. 1991, A&A, 245, 150 [NASA ADS]
Footnotes
- ... HD 50138
- Based on observations: (i) with the 1.52-m and 2.2-m telescopes at the European Southern Observatory (La Silla, Chile), under agreement with the Observatório Nacional-MCT (Brazil); and (ii) with the Telescope Bernard Lyot, Observatory of Pic du Midi (France).
- ...
- Table 1 is only available in electronic form at the CDS via anonymous ftp to cdsarc.u-strasbg.fr (130.79.128.5) or via http://cdsweb.u-strasbg.fr/cgi-bin/qcat?J/A+A/508/309
- ...újo
- It is with great sadness that we have to report that, during the final stages of this paper, we had a deep loss when Francisco X. de Araújo passed away.
- ... identification
- In order to identify the lines, we used the line lists provided by Moore (1945), Thackeray (1967), and Landaberry et al. (2001). We also looked up two sites on the web: NIST Atomic Spectra Database Lines Form (URL physics.nist.gov/cgi-bin/AtData/lines_form) and The Atomic Line List v2.04 (URL http://www.pa.uky.edu/ peter/atomic)
All Tables
Table 2: References to the UBVRI observations of HD 50138 shown in Fig. 11.
Table 3: Possible stellar classifications of HD 50138 under the assumption of pure interstellar extinction along the line of sight.
All Figures
|
|
Figure 1: Balmer lines seen in the FEROS spectra of HD 50138. The solid line is related to the spectrum taken in 1999 and the dotted line to the 2007 one. |
| Open with DEXTER | |
| In the text | |
|
|
Figure 2:
H |
| Open with DEXTER | |
| In the text | |
|
|
Figure 3: Variations in the line profile of Paschen 19 at 8413 Å. |
| Open with DEXTER | |
| In the text | |
|
|
Figure 4: Variations in the line profiles of the Fe II multiplet 42. The bottom line corresponds to the line at 4923 Å, the middle one at 5018 Å, and the top one at 5169 Å. |
| Open with DEXTER | |
| In the text | |
|
|
Figure 5: Profiles of the permitted lines of O I and their variation. The bottom line corresponds to the triplet at 7774 Å and the top one at 8446 Å. |
| Open with DEXTER | |
| In the text | |
|
|
Figure 6: Line profile variation of the He I line at 5876 Å. The solid line is related to the spectrum taken in 1999 and the dotted line to the 2007 one. |
| Open with DEXTER | |
| In the text | |
|
|
Figure 7: As in Fig. 6 but for the Mg II line at 4481 Å. |
| Open with DEXTER | |
| In the text | |
|
|
Figure 8: The variation of the line profile of Si II at 6347 Å. |
| Open with DEXTER | |
| In the text | |
|
|
Figure 9: As in Fig. 6 but for the Si II lines at 4128 Å and 4131 Å. |
| Open with DEXTER | |
| In the text | |
|
|
Figure 10: Different line profiles of the Na I lines at 5890 Å and 5896 Å. The normalized continuum is also presented for each date. |
| Open with DEXTER | |
| In the text | |
|
|
Figure 11: Time variation of photometric observations in the UBVRI bands collected from the literature (see Table 2). Also shown are the supposed positions of the outburst and the shell phase reported in the literature. The dashed lines in the B and V bands indicate the mean values before and after the outburst. The dotted bar in the B and V light-curves refer to the observations of Alvarez & Schuster (1981). |
| Open with DEXTER | |
| In the text | |
|
|
Figure 12: Time variation of the observed (U-B) and (B-V) color indices. |
| Open with DEXTER | |
| In the text | |
|
|
Figure 13: Constraining the range in spectral type for different luminosity classes. The solid lines correspond to the upper and lower limits derived from observations. |
| Open with DEXTER | |
| In the text | |
|
|
Figure 14: Intrinsic colors as a function of dust optical depth. Individual curves represent calculations performed for a mixture of silicates and amophous carbon grains for either single (smallest and largest, as cited in the text) grain sizes or an MRN grain size distribution. The dotted lines indicate theoretically expected intrinsic colors for different spectral types. |
| Open with DEXTER | |
| In the text | |
|
|
Figure 15: Increase in disk flux with respect to the stellar flux ( top panel) and intrinsic colors ( mid and bottom panel) with disk surface density. The dotted lines indicate theoretically expected intrinsic colors for different spectral types and a luminosity class V. The box extending over all three panels gives the range in possible classifications and the corresponding needed disk flux in all three bands. |
| Open with DEXTER | |
| In the text | |
|
|
Figure 16: Position of HD 50138 on the HR diagram compared to post-main sequence ( top panel) and pre-main sequence ( bottom panel) evolutionary tracks. In the bottom panel, the dotted line defines the zero-age main sequence, the thick solid line defines the birthline. |
| Open with DEXTER | |
| In the text | |
Copyright ESO 2009
Current usage metrics show cumulative count of Article Views (full-text article views including HTML views, PDF and ePub downloads, according to the available data) and Abstracts Views on Vision4Press platform.
Data correspond to usage on the plateform after 2015. The current usage metrics is available 48-96 hours after online publication and is updated daily on week days.
Initial download of the metrics may take a while.