| Issue |
A&A
Volume 507, Number 3, December I 2009
|
|
|---|---|---|
| Page(s) | 1503 - 1516 | |
| Section | Interstellar and circumstellar matter | |
| DOI | https://doi.org/10.1051/0004-6361/200912917 | |
| Published online | 24 September 2009 | |
A&A 507, 1503-1516 (2009)
Can gas in young debris disks be constrained by their radial brightness profiles?
A. V. Krivov1 - F. Herrmann1 - A. Brandeker2 - P. Thébault3,2
1 - Astrophysikalisches Institut und
Universitätssternwarte, Friedrich-Schiller-Universität Jena,
Schillergäßchen 2-3, 07745 Jena, Germany
2 -
Department of Astronomy, Stockholm University, 106 91 Stockholm, Sweden
3 -
LESIA, Observatoire de Paris, 92195 Meudon Principal Cedex, France
Received 17 July 2009 / Accepted 15 September 2009
Abstract
Disks around young stars are known to evolve from optically thick,
gas-dominated protoplanetary disks to optically thin, almost gas-free
debris disks. It is thought that the primordial gas is largely removed
at ages of ![]() Myr and indeed, only little amounts of gas
have been deduced from observations for debris disks at ages of
Myr and indeed, only little amounts of gas
have been deduced from observations for debris disks at ages of ![]() Myr.
However, gas detections are difficult and often indirect, not allowing
one to discern the true gas densities.
This suggests using dynamical arguments: it has been argued that
gas, if present with higher densities, would lead to flatter radial
profiles of the dust density and brightness than those actually
observed. In this paper, we systematically study the influence of gas
on the radial profiles of brightness. We assume that dust is
replenished by planetesimals orbiting in a
``birth ring'' and model the dust distribution and scattered-light
brightness profile in the outer part of the disk exterior to the birth
ring, under different assumptions about the gas component.
Our numerical simulations, supported with an analytic model, show that
the radial profile of dust density and the surface brightness are
surprisingly insensitive to variation of the parameters of a central
star, location of the dust-producing planetesimal belt, dustiness of
the disk and - most importantly - the parameters of the
ambient gas. The radial brightness slopes in the outer disks are all
typically in the range -3...-4. This result holds for a wide range of
gas densities (three orders of magnitude), for different radial
profiles of the gas temperature, both for gas of solar composition and
gas of strongly non-solar composition. The slopes of -3...-4 we find
are the same that were theoretically found for gas-free debris disks,
and they are the same as actually retrieved from observations of many
debris disks. Our specific results for three young (10-30 Myr
old), spatially resolved, edge-on debris disks (
Myr.
However, gas detections are difficult and often indirect, not allowing
one to discern the true gas densities.
This suggests using dynamical arguments: it has been argued that
gas, if present with higher densities, would lead to flatter radial
profiles of the dust density and brightness than those actually
observed. In this paper, we systematically study the influence of gas
on the radial profiles of brightness. We assume that dust is
replenished by planetesimals orbiting in a
``birth ring'' and model the dust distribution and scattered-light
brightness profile in the outer part of the disk exterior to the birth
ring, under different assumptions about the gas component.
Our numerical simulations, supported with an analytic model, show that
the radial profile of dust density and the surface brightness are
surprisingly insensitive to variation of the parameters of a central
star, location of the dust-producing planetesimal belt, dustiness of
the disk and - most importantly - the parameters of the
ambient gas. The radial brightness slopes in the outer disks are all
typically in the range -3...-4. This result holds for a wide range of
gas densities (three orders of magnitude), for different radial
profiles of the gas temperature, both for gas of solar composition and
gas of strongly non-solar composition. The slopes of -3...-4 we find
are the same that were theoretically found for gas-free debris disks,
and they are the same as actually retrieved from observations of many
debris disks. Our specific results for three young (10-30 Myr
old), spatially resolved, edge-on debris disks (![]() Pic,
HD 32297, and AU Mic) show that the observed radial profiles
of the surface brightness do not pose any stringent constraints on the
gas component of the disk. We cannot exclude that outer parts of the
systems may have retained substantial amounts of primordial gas which
is not evident in the gas observations (e.g. as much as
50 Earth masses for
Pic,
HD 32297, and AU Mic) show that the observed radial profiles
of the surface brightness do not pose any stringent constraints on the
gas component of the disk. We cannot exclude that outer parts of the
systems may have retained substantial amounts of primordial gas which
is not evident in the gas observations (e.g. as much as
50 Earth masses for ![]() Pic). However, the possibility that gas, most likely secondary,
is only present in little to moderate amounts, as deduced from gas detections (e.g.
Pic). However, the possibility that gas, most likely secondary,
is only present in little to moderate amounts, as deduced from gas detections (e.g.
![]() Earth masses in the
Earth masses in the ![]() Pic disk or even less), remains open, too.
Pic disk or even less), remains open, too.
Key words: planetary systems: formation - circumstellar matter -
stars: individual: ![]() Pic - stars: individual: HD 32297 - stars: individual: AU Mic - celestial mechanics
Pic - stars: individual: HD 32297 - stars: individual: AU Mic - celestial mechanics
1 Introduction
In the course of their evolution, circumstellar disks transform from
optically thick, gas-dominated protoplanetary disks to optically thin,
almost gas-free debris disks. How the gas is removed is not known in
detail, but the removal is thought to be the result of a quick
inside-out process at an age of ![]() Myr (Hillenbrand 2008; Alexander 2008).
It may be either due to the UV switch mechanism resulting
from an interplay between photoevaporation and viscous accretion
(e.g. Alexander & Armitage 2007; Hollenbach et al. 2000; Takeuchi et al. 2005; ; Clarke et al. 2001) or due to gap opening by hidden giant planets (e.g. Lubow & D'Angelo 2006; Lubow et al. 1999). Although the former effect seems to be slightly preferred by observational statistics (e.g. Cieza et al. 2008), it is not yet possible to distinguish between them with certainty
(Hillenbrand 2008; Alexander 2008; Najita et al. 2007).
Myr (Hillenbrand 2008; Alexander 2008).
It may be either due to the UV switch mechanism resulting
from an interplay between photoevaporation and viscous accretion
(e.g. Alexander & Armitage 2007; Hollenbach et al. 2000; Takeuchi et al. 2005; ; Clarke et al. 2001) or due to gap opening by hidden giant planets (e.g. Lubow & D'Angelo 2006; Lubow et al. 1999). Although the former effect seems to be slightly preferred by observational statistics (e.g. Cieza et al. 2008), it is not yet possible to distinguish between them with certainty
(Hillenbrand 2008; Alexander 2008; Najita et al. 2007).
In this paper, we concentrate on a more advanced phase of system's
evolution: the debris disk stage. Apart from possible planets, a debris
disk system contains remnant planetesimals and dust into
which they are ground through collisions (see, e.g. Wyatt 2008,
and references therein).
Debris disks are expected to be nearly gas-free, at least extremely
gas-poor compared to protoplanetary disks. Even so, in the case of ![]() Pic, gas was detected very early on in absorption (Hobbs et al. 1985; Slettebak 1975), and later in emission (Olofsson et al. 2001), due to the favorable edge-on orientation of the disk. The observed gas around
Pic, gas was detected very early on in absorption (Hobbs et al. 1985; Slettebak 1975), and later in emission (Olofsson et al. 2001), due to the favorable edge-on orientation of the disk. The observed gas around ![]() Pic
is most likely replenished, i.e. secondary, as opposed to a
remnant from the initial star-forming cloud. Evidence for this comes
from the presence of CO (Vidal-Madjar et al. 1994; Jolly et al. 1998; Roberge et al. 2000), which would be dissociated on time-scales of
Pic
is most likely replenished, i.e. secondary, as opposed to a
remnant from the initial star-forming cloud. Evidence for this comes
from the presence of CO (Vidal-Madjar et al. 1994; Jolly et al. 1998; Roberge et al. 2000), which would be dissociated on time-scales of ![]() 200 yr (van Dishoeck & Black 1988; Roberge et al. 2000) and from the presence of neutral gas elements in the disk (Olofsson et al. 2001; Brandeker et al. 2004), subject to short removal times (Fernández et al. 2006). Possible mechanisms for producing secondary gas include photon-induced desorption from solids (Chen et al. 2007) and grain-grain collisions
(Czechowski & Mann 2007).
Part of the observed gas may also stem from comet evaporation, as
inferred from observed time-variable absorption lines (e.g. Ferlet et al. 1987; Beust & Valiron 2007).
200 yr (van Dishoeck & Black 1988; Roberge et al. 2000) and from the presence of neutral gas elements in the disk (Olofsson et al. 2001; Brandeker et al. 2004), subject to short removal times (Fernández et al. 2006). Possible mechanisms for producing secondary gas include photon-induced desorption from solids (Chen et al. 2007) and grain-grain collisions
(Czechowski & Mann 2007).
Part of the observed gas may also stem from comet evaporation, as
inferred from observed time-variable absorption lines (e.g. Ferlet et al. 1987; Beust & Valiron 2007).
However, in general observations of gas are much more difficult than
that of dust. Standard detection techniques either use CO as a tracer
of hydrogen which can be observed at radio frequencies, as done by Hughes et al. (2008) for 49 Cet, or measure ![]() emission
lines which are pumped by stellar emission lines originating from the
chromospheric and coronal regions, which was done for AU Mic by France et al. (2007). A potentially more sensitive way of
finding gas is to look for it in absorption, as was done for
emission
lines which are pumped by stellar emission lines originating from the
chromospheric and coronal regions, which was done for AU Mic by France et al. (2007). A potentially more sensitive way of
finding gas is to look for it in absorption, as was done for ![]() Pic.
The downside is that this requires the special edge-on geometry of the
disk, but this method has nevertheless been successfully used by Redfield (2007)
to detect circumstellar Na I absorption towards
HD 32297, a star with a known disk. Conversely, stars which are
known to exhibit circumstellar absorption lines, so called shell stars, can be searched for evidence of circumstellar
material, as done by Roberge & Weinberger (2008)
using Spitzer/MIPS data. Out of 16 surveyed shell stars they found
infrared excess, and thus evidence for circumstellar dust, around four
stars: HD 21620, HD 118232, HD 142926 and
HD 158352.
Pic.
The downside is that this requires the special edge-on geometry of the
disk, but this method has nevertheless been successfully used by Redfield (2007)
to detect circumstellar Na I absorption towards
HD 32297, a star with a known disk. Conversely, stars which are
known to exhibit circumstellar absorption lines, so called shell stars, can be searched for evidence of circumstellar
material, as done by Roberge & Weinberger (2008)
using Spitzer/MIPS data. Out of 16 surveyed shell stars they found
infrared excess, and thus evidence for circumstellar dust, around four
stars: HD 21620, HD 118232, HD 142926 and
HD 158352.
Despite substantial efforts, the gas component of the debris disks remains much less constrained observationally than the dusty one. It is quite possible that primordial gas survives longer than usually assumed, at least in the outer parts of the disks, or is present in larger amounts than expected, without showing up in observations. In fact, about ten Earth masses of gas, if not more, could still remain in many young debris disks where gas was searched for and not found, without violating observations (Hillenbrand 2008). If present, this hardly detectable gas would heavily affect the disk's physics and evolution and could necessitate revisions to standard theories of disk evolution and planet formation.
The goal of our work is to analyze the effects of gas on the
dynamical evolution of solids. We would like to find out whether gas,
if present in larger amounts or with a different radial distribution
than usually assumed, would alter the dust distribution and thus the
brightness profile of a debris disk in such a way as to show up in the
observations. We follow the approach first suggested by Thébault & Augereau (2005) who applied it to the the ![]() Pic
system: we first postulate
a certain amount and spatial distribution of gas in one or another
debris disk system, then compute a steady-state distribution of dust
in it, calculate the observables such as brightness profile,
and compare them with available observations.
Pic
system: we first postulate
a certain amount and spatial distribution of gas in one or another
debris disk system, then compute a steady-state distribution of dust
in it, calculate the observables such as brightness profile,
and compare them with available observations.
In Sect. 2 we select and analyze three young debris disk systems relevant for this study. Section 3 lays down basic theory of the dust production and dynamical evolution in a debris disk with a gas component. Section 4 describes numerical simulations and Sect. 5 their results. In Sect. 6 we devise an analytical model and use it to interpret the numerical results. Section 7 contains our conclusions.
2 Systems
2.1 Selection criteria
We wish to choose several young debris disks in which the presence
of gas in little to moderate amounts has been reported. Ideally, these
should be edge-on systems, so that better constraints on gas are
available from the presence or absence of absorption lines, not just
CO mm emission. We need dust disks that are spatially resolved,
preferably in scattered light, so that the radial profile of brightness
is known. The age of the disks should not be very far from the boundary
that separates gas- and dust-rich, optically thick protoplanetary disks
from nearly gasless, optically thin debris
disks, which is believed to lie at
![]() Myr. The best ages would thus be 10-30 Myr.
Myr. The best ages would thus be 10-30 Myr.
We find three systems to satisfy these criteria the best: ![]() Pic,
HD 32297, and AU Mic.
Known facts and key parameters of these systems relevant to our study
are presented in the subsequent sections. We stress, however, that all
three systems should be regarded as ``typical'' examples of their
classes and might be used as a proxy for other systems. Thus our
results, being of interest in the context of particular objects, could
at the same time be considered as generic.
Pic,
HD 32297, and AU Mic.
Known facts and key parameters of these systems relevant to our study
are presented in the subsequent sections. We stress, however, that all
three systems should be regarded as ``typical'' examples of their
classes and might be used as a proxy for other systems. Thus our
results, being of interest in the context of particular objects, could
at the same time be considered as generic.
2.2  Pic
Pic
Star.
A 12 Myr-old (Zuckerman et al. 2001) A5V star at d = 19.44 ![]() 0.05 pc.
0.05 pc.
Dust and parent bodies.
The debris disk was first resolved by Smith & Terrile (1984) and later at various wavelengths (Artymowicz 2000, and references therein). According to Artymowicz & Clampin (1997),
the vertical optical depth of the dust disk has a maximum of 1.53 ![]() 10-2 at 60 AU,
and has a slope of -1.7...-2 in the outer part. Mouillet et al. (1997) give
5
10-2 at 60 AU,
and has a slope of -1.7...-2 in the outer part. Mouillet et al. (1997) give
5 ![]() 10-3 at 100 AU with an outer slope of -1.7. Dust mass is roughly 0.05...
10-3 at 100 AU with an outer slope of -1.7. Dust mass is roughly 0.05...
![]() (Artymowicz 2000; Thébault & Augereau 2005), with
(Artymowicz 2000; Thébault & Augereau 2005), with
![]() being probably the best estimate (Lagrange et al. 2000; Zuckerman & Becklin 1993). Analysis by Augereau et al. (2001) (their Fig. 1)
show that an extended dust disk produced by the planetesimal belt
(``birth ring'') between 80-120 AU would closely match the
resolved scattered light images together with the long-wavelength
photometric data. The dust distribution itself is given in Fig. 2 of Augereau et al. (2001). The radial
being probably the best estimate (Lagrange et al. 2000; Zuckerman & Becklin 1993). Analysis by Augereau et al. (2001) (their Fig. 1)
show that an extended dust disk produced by the planetesimal belt
(``birth ring'') between 80-120 AU would closely match the
resolved scattered light images together with the long-wavelength
photometric data. The dust distribution itself is given in Fig. 2 of Augereau et al. (2001). The radial
![]() profile of the mid-plane scattered-light images shows a slope of -3...-4 outside 130-260 AU (Golimowski et al. 2006). The dust disk around
profile of the mid-plane scattered-light images shows a slope of -3...-4 outside 130-260 AU (Golimowski et al. 2006). The dust disk around ![]() Pic is famous for its large scale asymmetries, which might be caused by a sub-stellar companion in the disk (see, e.g. Augereau et al. 2001; Mouillet et al. 1997).
Pic is famous for its large scale asymmetries, which might be caused by a sub-stellar companion in the disk (see, e.g. Augereau et al. 2001; Mouillet et al. 1997).
Gas.
Before ![]() Pic was known to harbor a debris disk, it was classified as a shell star by Slettebak (1975) due to its prominent Ca II H & K absorption. Gas was then re-discovered in absorption by Hobbs et al. (1985) and in spatially resolved Na I emission by Olofsson et al. (2001). The atomic hydrogen content of the disk was constrained by Freudling et al. (1995) to be
Pic was known to harbor a debris disk, it was classified as a shell star by Slettebak (1975) due to its prominent Ca II H & K absorption. Gas was then re-discovered in absorption by Hobbs et al. (1985) and in spatially resolved Na I emission by Olofsson et al. (2001). The atomic hydrogen content of the disk was constrained by Freudling et al. (1995) to be
![]() ,
and the molecular column density to be
<3
,
and the molecular column density to be
<3 ![]() 1018 cm-2 by Lecavelier des Etangs et al. (2001), which corresponds to
1018 cm-2 by Lecavelier des Etangs et al. (2001), which corresponds to
![]() ,
assuming the gas to be distributed in the disk (Brandeker et al. 2004).
Brandeker et al. (2004)
observed spatially extended gas emission from a number of elements
(including Na I, Fe I, and Ca II), and derived a spatial
distribution for the gas
,
assuming the gas to be distributed in the disk (Brandeker et al. 2004).
Brandeker et al. (2004)
observed spatially extended gas emission from a number of elements
(including Na I, Fe I, and Ca II), and derived a spatial
distribution for the gas
![\begin{displaymath}%
n(H) = n_0
\left[
\left( r \over r_0 \right)^{2.4}
+
\left( r \over r_0 \right)^{5.3}
\right]^{-1/2}
\end{displaymath}](/articles/aa/full_html/2009/45/aa12917-09/img20.png)
with n0 = 2.25
2.3 HD 32297
Star.
A 30 Myr-old A5V star (Maness et al. 2008) at d = 113 ![]() 12 pc.
12 pc.
Dust and parent bodies.
The dust disk was first resolved with HST/NICMOS in scattered light by Schneider et al. (2005)
up to 400 AU. The surface brightness (
![]() )
of the SW wing is fitted by a power law with index -3.6,
while the NE side shows a break at 200 AU: the inner part has
a slope of -3.7, whereas the outer one -2.7. Kalas (2005) resolved the disk in the R-band
between 560 and 1680 AU. The mid-plane slopes were found to
be -2.7 and -3.1 for NE and SW wings, respectively, with strong
asymmetries. Moerchen et al. (2007) resolved the disk with Gemini South/T-ReCS
in thermal emission at 12 and
)
of the SW wing is fitted by a power law with index -3.6,
while the NE side shows a break at 200 AU: the inner part has
a slope of -3.7, whereas the outer one -2.7. Kalas (2005) resolved the disk in the R-band
between 560 and 1680 AU. The mid-plane slopes were found to
be -2.7 and -3.1 for NE and SW wings, respectively, with strong
asymmetries. Moerchen et al. (2007) resolved the disk with Gemini South/T-ReCS
in thermal emission at 12 and
![]() up to 150 AU. Resolved images by Fitzgerald et al. (2007b) taken with Gemini North at
up to 150 AU. Resolved images by Fitzgerald et al. (2007b) taken with Gemini North at
![]() revealed a bilobed structure with peaks at
revealed a bilobed structure with peaks at ![]() AU from the star. Maness et al. (2008) marginally resolved the disk with CARMA at 1.3 mm.
AU from the star. Maness et al. (2008) marginally resolved the disk with CARMA at 1.3 mm.
The spectral energy distribution (SED) fitting by Fitzgerald et al. (2007b) suggests a population of larger grains - and therefore a location of the birth ring - at
![]() AU. The vertical optical depth of the dust disk at the same distance is
4
AU. The vertical optical depth of the dust disk at the same distance is
4 ![]() 10-3 (Maness et al. 2008). 1.3 mm measurements by Maness et al. (2008)
point to the existence of a third population of even larger grains at a
characteristic stellar distance of 50 AU, which probably comprises
10-3 (Maness et al. 2008). 1.3 mm measurements by Maness et al. (2008)
point to the existence of a third population of even larger grains at a
characteristic stellar distance of 50 AU, which probably comprises
![]() % of the total dust mass. Dust mass required to fit the SED up to far-infrared wavelengths is roughly
% of the total dust mass. Dust mass required to fit the SED up to far-infrared wavelengths is roughly
![]() ,
but 1.3 mm flux may require as much as
,
but 1.3 mm flux may require as much as
![]() of dust (Maness et al. 2008).
of dust (Maness et al. 2008).
Gas.
Redfield (2007) found an intriguingly
strong Na I absorption. Assuming the morphology and
abundances of the stable gas component to be the same as for ![]() Pic, and that the gas disk extends up to 1680 AU as debris disk does, he derived the total gas mass of
Pic, and that the gas disk extends up to 1680 AU as debris disk does, he derived the total gas mass of
![]() .
The absence of the observable CO J=2-1 emission with CARMA places an upper limit on the gas mass of
.
The absence of the observable CO J=2-1 emission with CARMA places an upper limit on the gas mass of
![]() (Maness et al. 2008).
(Maness et al. 2008).
2.4 AU Mic
Star.
A 12 Myr-old dM1e flare star, a member of the ![]() Pictoris Moving Group at d = 9.94
Pictoris Moving Group at d = 9.94 ![]() 0.13 pc. It is the closest known debris disk resolved in scattered light.
0.13 pc. It is the closest known debris disk resolved in scattered light.
Dust and parent bodies.
The debris disk was first resolved in R-band by Kalas et al. (2004) and Liu (2004).
Later on, it was resolved with HST/ACS by Krist et al. (2005) and in the H-band with Keck AO by Metchev et al. (2005). The dust fractional luminosity is 6 ![]() 10-4 (Liu 2004). The dust mass (up to 1 mm) is estimated to be
10-4 (Liu 2004). The dust mass (up to 1 mm) is estimated to be ![]()
![]()
![]() (Augereau & Beust 2006), but sub-mm fluxes require 1
(Augereau & Beust 2006), but sub-mm fluxes require 1 ![]()
![]() (Liu et al. 2004). The birth ring of planetesimals is believed to be located at 35 AU (Augereau & Beust 2006). An R-band
(Liu et al. 2004). The birth ring of planetesimals is believed to be located at 35 AU (Augereau & Beust 2006). An R-band
![]() profile slope of -3.8 between 35-200 AU was found by Kalas et al. (2004), whereas Liu (2004), Krist et al. (2005), and Fitzgerald et al. (2007a) derived
profile slope of -3.8 between 35-200 AU was found by Kalas et al. (2004), whereas Liu (2004), Krist et al. (2005), and Fitzgerald et al. (2007a) derived
![]() slopes in the range -3.8...-4.7. Like
slopes in the range -3.8...-4.7. Like ![]() Pic
and HR 32297, the disk of AU Mic possesses asymmetries, which are
probably formed by the dynamical influence of planets (Liu 2004).
Pic
and HR 32297, the disk of AU Mic possesses asymmetries, which are
probably formed by the dynamical influence of planets (Liu 2004).
Gas.
Non-stringent upper limits on the gas mass were found from non-detection of CO 3-2 emission by Liu et al. (2004) (
![]() )
and
)
and ![]() UV absorption by Roberge et al. (2005) (<7
UV absorption by Roberge et al. (2005) (<7 ![]()
![]() ). France et al. (2007) tentatively detected and analyzed fluorescent
). France et al. (2007) tentatively detected and analyzed fluorescent ![]() emission.
Within the observational uncertainties, the data are consistent with
gas residing in the debris disk, although other possibilities such as a
cloud that extends beyond the disk cannot be completely ruled out. They
found a very low total gas mass between
emission.
Within the observational uncertainties, the data are consistent with
gas residing in the debris disk, although other possibilities such as a
cloud that extends beyond the disk cannot be completely ruled out. They
found a very low total gas mass between ![]()
![]()
![]() and
and ![]()
![]()
![]() ,
consistent with upper limits
,
consistent with upper limits
![]() obtained from a search for optical absorption lines from Ca I, Ca II and Fe I by Brandeker & Jayawardhana (2008).
obtained from a search for optical absorption lines from Ca I, Ca II and Fe I by Brandeker & Jayawardhana (2008).
3 Basic theory
3.1 General picture
Throughout this paper, we adopt the following standard scenario of a debris disk evolution (e.g. Strubbe & Chiang 2006; Thébault & Wu 2008; ; Krivov et al. 2006,2008):
- There is a relatively narrow belt of planetesimals (``birth ring'') in orbits with moderate eccentricities and inclinations. We assume that this birth ring is located where the scattered image brightness peaks. Note that the systems resolved at (sub)-mm wavelengths usually exhibit a bright ring of approximately the same radius.
-
Orbiting planetesimals in the birth ring undergo collisional cascade
that grinds the solids down to dust. We assume that the dust grains
with radii
![$[s, s+{\rm d}s]$](/articles/aa/full_html/2009/45/aa12917-09/img41.png) are produced in the birth ring at a constant rate
are produced in the birth ring at a constant rate
 , where
The parameter q is unknown. However, a usual assumption -- which we will follow unless stated otherwise - is q=3.5. - At smallest dust sizes, stellar radiation pressure effectively reduces the mass of the central star and quickly (on the dynamical timescale) sends the grains into more eccentric orbits, with their pericenters still residing within the birth ring while the apocenters are located outside the ring. As a result, the dust disk spreads outward from the planetesimal belt. The smaller the grains, the more extended their ``partial'' disk.
- The dust grain orbits undergo slower modifications due to gas drag and experience gradual loss due to mutual collisions.
3.2 Stellar gravity and radiation pressure
We require that the disk is optically thin, so that each dust
grain is fully exposed to stellar radiation at any location in the
disk. Since the radiation pressure is proportional to r-2,
as is the stellar gravity, a dust grain experiences
``photogravity'', i.e. gravity of a star with an ``effective
stellar mass''
![]() :
:
|
(3) |
where
Here,
3.3 Gas drag
We assume that the gas distribution remains unaffected by that of dust and that gas simply exerts a drag force on the dust particles. If the gas mass is larger than the dust mass, this assumption is natural. In the case where both are comparable, the validity of this assumption will be checked later a posteriori. Indeed, we will choose the same initial distributions for dust and gas and will see that these will not diverge considerably in the course of the disk evolution.
Gas orbits the star at a sub-keplerian speed
|
(5) |
where
There exist two possible reasons for sub-keplerian rotation of a gas
disk. One is the case of a thermally-supported disk, in which the
sub-keplerian rotation stems from the gas pressure gradient.
However, around ![]() Pic
the gas at non-solar composition has been observed, which is dominantly
supported by radiation pressure rather than gas pressure (Fernández et al. 2006; Roberge et al. 2006). Thus we also consider another case, where gas is supported against stellar gravity by radiation pressure.
Pic
the gas at non-solar composition has been observed, which is dominantly
supported by radiation pressure rather than gas pressure (Fernández et al. 2006; Roberge et al. 2006). Thus we also consider another case, where gas is supported against stellar gravity by radiation pressure.
For a thermally-supported gas disk, we follow a standard description of the dust aerodynamics
(Weidenschilling 1977), generalized to the presence of radiation pressure (Takeuchi & Artymowicz 2001; Thébault & Augereau 2005; Herrmann & Krivov 2007). The factor ![]() is
is
Here,

|
(7) |
with the Boltzmann constant k, the mean molecular weight
The gas temperature and density are usually taken to be power laws

and

Then, Eq. (6) takes the form
where
We now consider the case where gas is supported against stellar gravity by radiation pressure.
Denoting by
![]() the effective radiation pressure coefficient acting on the gas,
its speed is
the effective radiation pressure coefficient acting on the gas,
its speed is
|
(11) |
yielding a simple relation

Regardless of the mechanism that supports the gas disk against gravity, the gas drag force on a dust grain is expressed by (Takeuchi & Artymowicz 2001)
|
(13) |
which combines the subsonic and supersonic regimes. Here,
|
(14) |
For later discussions of the timescales, we also define the stopping time,
the time interval over which
3.4 Gas temperature
As we saw in the previous section, dust dynamics is expected to depend
sensitively on the gas temperature, in particular on its radial
gradient p. A commonly used assumption is that the gas shares the dust temperature profile (Kamp & van Zadelhoff 2001), which in the simple blackbody approximation gives p=1/2.
This is a reasonable assumption if gas-dust interaction is strong and
the photo-electric heating weak, but may not be valid in general.
Indeed, in case of strong UV environments the photo-electric
effect on dust can be the dominant heating source of the gas and lead
to a dust drift instability (Besla & Wu 2007; Klahr & Lin 2005).
For sufficiently high dust content, one may expect (at every distance)
a power-law relation between the gas temperature and the number
density of dust. Following Klahr & Lin (2005), Eq. (8) generalizes to

with
To evaluate how valid the p=1/2 assumption is for a more detailed model of the thermal balance, we used the code ONTARIO (Zagorovsky et al., in prep.). ONTARIO
is tuned to model gas emission during the debris disk phase, given
input parameters related to the gas/dust disk structure, elemental
abundances, and the stellar luminosity spectrum. ONTARIO computes the ionization and thermal balance self-consistently, with particular care taken of heating/cooling
mechanisms (the most important being photo-electric and ionization heating, and cooling by C II
![]() ).
The major simplifying assumptions are that the gas is considered to be
in atomic/ion form (no molecules), and that the disks are
optically thin (i.e. no chemistry
and simplified radiative transfer), conditions that are expected to be
closely met by debris disks around A and F stars, but not
necessarily around stars of later spectral type. Using the same gas and
dust profiles as in the dynamical simulations (i.e., surface density
slope of -1.5 corresponding to a mid-plane density slope
of -2.5), we computed the mid-plane temperature for three
different cases, as shown in Fig. 1 (top):
).
The major simplifying assumptions are that the gas is considered to be
in atomic/ion form (no molecules), and that the disks are
optically thin (i.e. no chemistry
and simplified radiative transfer), conditions that are expected to be
closely met by debris disks around A and F stars, but not
necessarily around stars of later spectral type. Using the same gas and
dust profiles as in the dynamical simulations (i.e., surface density
slope of -1.5 corresponding to a mid-plane density slope
of -2.5), we computed the mid-plane temperature for three
different cases, as shown in Fig. 1 (top):
- 1.
- an
 disk at solar abundance with hydrogen entirely in atomic form (giving the mean molecular weight
 );
);
- 2.
- a similar model but with
 ;
;
- 3.
- an
model with Pic abundances (i.e. solar abundance except
 carbon, no helium, and
 hydrogen, giving
 ,
as motivated by the inventory of gas observed around Pic, compiled by Roberge et al. 2006).
,
as motivated by the inventory of gas observed around Pic, compiled by Roberge et al. 2006).
![\begin{figure}
\par\includegraphics[width=8.8cm,clip]{12917f01.eps}
\vspace*{5mm}
\end{figure}](/articles/aa/full_html/2009/45/aa12917-09/img95.png)
|
Figure 1:
Top: gas temperature in the |
| Open with DEXTER | |
3.5 Radial dynamics of dust under photogravity and gas drag
We start with a thermally-supported gas disk. Since gas adds or removes
angular momentum to or from solid particles, it causes them to
spiral outward or inward, until a certain size-dependent stability
distance is reached, at which the gas pressure gradient and the stellar
radiation pressure balance each other (Takeuchi & Artymowicz 2001):
which can be solved for
We now turn to the case where the gas is radiation pressure-supported. Then, ![]() is independent
of distance, so that there is only one value for
is independent
of distance, so that there is only one value for ![]() over the entire disk and for all particle sizes. In this case, the particles with
over the entire disk and for all particle sizes. In this case, the particles with
![]() (
(
![]() )
will spiral inward (outward) from the birth ring; those that just have
)
will spiral inward (outward) from the birth ring; those that just have
![]() will have no radial motion and will stay in the parent belt. Therefore, only grains with
will have no radial motion and will stay in the parent belt. Therefore, only grains with
![]() will make a contribution to the outer disk. They all will be drifting outward all the way through in a steady-state regime.
will make a contribution to the outer disk. They all will be drifting outward all the way through in a steady-state regime.
3.6 Vertical dynamics of dust under photogravity and gas drag
Apart from the radial dynamics described above, dust grain orbits also
have vertical evolution. The essential effect is dust sedimentation (or
settling) toward the mid-plane of the disk. It happens on
a timescale
![]() that depends on the particle size and the vertical profile of the gas density. Generally,
that depends on the particle size and the vertical profile of the gas density. Generally,
![]() also changes with time because of the grain's radial drift.
If, for dust grains that contribute to visible brightness, the settling timescale is comparable to the stopping time (
also changes with time because of the grain's radial drift.
If, for dust grains that contribute to visible brightness, the settling timescale is comparable to the stopping time (
![]() ),
a combination of settling and radial drift would cause the aspect ratio
of the outer disk to decrease with distance (``anti-flaring''). Thus in
principle, a comparison of the observed vertical distribution of
brightness in an edge-on debris disk with a modeled one may offer
another method of constraining the gas densities. In the present paper,
however, we confine our analysis to the radial distribution and radial
brightness profiles.
),
a combination of settling and radial drift would cause the aspect ratio
of the outer disk to decrease with distance (``anti-flaring''). Thus in
principle, a comparison of the observed vertical distribution of
brightness in an edge-on debris disk with a modeled one may offer
another method of constraining the gas densities. In the present paper,
however, we confine our analysis to the radial distribution and radial
brightness profiles.
3.7 Collisions
Collisions are the main mechanism that limits the lifetime of dust grains in the outer disk, if they are large enough not to be blown away by radiation pressure or rapidly dragged away by gas.
Collisional outcome is known to depend sensitively upon the
relative velocities. Both projectiles are disrupted if their relative
velocity
![]() exceeds (see, e.g. Krivov et al. 2005, their Eq. (5.2))
exceeds (see, e.g. Krivov et al. 2005, their Eq. (5.2))
where
The relative velocity
![]() mainly stems from the difference in the radial velocities of different-sized grains |vr|, as set by stellar photogravity and gas drag. In Sect. 5, we will see that
mainly stems from the difference in the radial velocities of different-sized grains |vr|, as set by stellar photogravity and gas drag. In Sect. 5, we will see that
![]() is typically high enough for catastrophic collisions to occur even if the gas density is high.
is typically high enough for catastrophic collisions to occur even if the gas density is high.
4 Numerical simulations
4.1 Setups for simulations
For each of the three systems, we adopt a fixed set of parameters for the central star and solids (planetesimals and dust) and test various gas density models (Table 1). One model may differ from another in four respects:
Table 1:
Models for ![]() Pic, HD 32297, and AU Mic.
Pic, HD 32297, and AU Mic.
- 1.
- Gas support mechanism. We consider two possible reasons
for sub-keplerian rotation
of a gas disk: a thermally-supported disk, which seems reasonable
in the case of primordial gas at solar composition, and a radiation
pressure-supported disk, which could be more appropriate for secondary
gas with a non-solar composition. Fernández et al. (2006) computed the effective radiation pressure on the ionized gas to be
 in the Pic disk (see their Fig. 4),
assuming solar abundances. Since the mass is dominated by (inert)
carbon, which was later found to be overabundant by a factor 20 (Roberge et al. 2006), the effective radiation pressure coefficient acting on the gas including 20
in the Pic disk (see their Fig. 4),
assuming solar abundances. Since the mass is dominated by (inert)
carbon, which was later found to be overabundant by a factor 20 (Roberge et al. 2006), the effective radiation pressure coefficient acting on the gas including 20 carbon is estimated to be
 .
Thus for the radiation pressure-supported disks we set
.
Thus for the radiation pressure-supported disks we set
 .
.
- 2.
- Radial slope of the gas temperature. In most of the models, we assume p=1/2, but also test p=0 and p=1 to bracket the behavior of expected temperature profiles (Sect. 3.4).
- 3.
- Total amount of gas.
In the nominal gas models, the total gas mass is taken as retrieved from the gas observations:
 for Pic,
 for HD 32297, 4
 for AU Mic. As we consider here only the outer part of the
disks, outside the birth ring, we simply halve these masses. Indeed, in
the Pic gas disk, the masses of the inner and outer disks are nearly equal (two terms in Eqs. (4) or (5) of Brandeker et al. 2004, make comparable contributions). Interestingly, the above gas masses are roughly comparable with the dust mass
(gas:dust ratio
for AU Mic. As we consider here only the outer part of the
disks, outside the birth ring, we simply halve these masses. Indeed, in
the Pic gas disk, the masses of the inner and outer disks are nearly equal (two terms in Eqs. (4) or (5) of Brandeker et al. 2004, make comparable contributions). Interestingly, the above gas masses are roughly comparable with the dust mass
(gas:dust ratio  1:1). However, as explained in the introduction, the systems may
contain much more gas than is evident in the observations. For this
reason, we consider high gas mass models, in which the total gas mass
is 100 times the nominal mass. With this choice, the gas-to-dust
ratio is a standard 100:1. Finally, we try a very high gas case,
in which the gas mass is ten times higher than in the high gas models.
1:1). However, as explained in the introduction, the systems may
contain much more gas than is evident in the observations. For this
reason, we consider high gas mass models, in which the total gas mass
is 100 times the nominal mass. With this choice, the gas-to-dust
ratio is a standard 100:1. Finally, we try a very high gas case,
in which the gas mass is ten times higher than in the high gas models.
- 4.
- Radial slope of the gas surface density.
If the gas is secondary, one could expect the gas profile to approximately follow the dust profile (e.g., Czechowski & Mann 2007). For our three systems, the latter falls off as
 ...
...
 .
Slopes in this range are also expected on theoretical grounds in a
standard ``birth ring - collisionally evolving gas-free disk''
model explained in Sect. 3.1. Thus our standard choice is to set
the surface density of both gas and dust
to be
.
Slopes in this range are also expected on theoretical grounds in a
standard ``birth ring - collisionally evolving gas-free disk''
model explained in Sect. 3.1. Thus our standard choice is to set
the surface density of both gas and dust
to be
 initially. However, if the gas is primordial, i.e. a remnant
of an accretion disk, the profile is more uncertain. One could still
expect
(consistent with an isothermal steady-state solution for a viscous accretion disk), but, for instance, a flat density profile
(another known steady-state solution) could also be possible.
initially. However, if the gas is primordial, i.e. a remnant
of an accretion disk, the profile is more uncertain. One could still
expect
(consistent with an isothermal steady-state solution for a viscous accretion disk), but, for instance, a flat density profile
(another known steady-state solution) could also be possible.
- X indicates the type of the gas disk:
- 0 (no gas);
- t (thermally-supported);
- r (radiation pressure-supported).
- p indicates the slope of gas temperature:
- 0 (p=0);
- 1 (p=1);
- nothing (p=1/2).
- Y indicates the total amount of gas:
- 0 (no gas);
- n (``nominal'' gas mass);
- h (``high'' gas mass);
- v (``very high'' gas mass).
- Z indicates the slope of the gas density profile:
- 0 (no gas);
- s (standard, surface density falls off as 1.5);
- f (flat, surface density falls off as 1.0).
As reference models, we treat ``tns'' and ``ths'' cases
(a thermally-supported gas disk with a nominal or high gas content
and a standard surface density slope). We ran these models for all
three systems. In the case of ![]() Pic, we additionally tested other disks, as listed in Table 1.
Pic, we additionally tested other disks, as listed in Table 1.
4.2 Numerical integrations
We now describe the procedure to compute individual trajectories of dust grains as well as the overall brightness profiles of the disks.
First, we assumed that dust parent bodies are orbiting in the ``birth ring''. Their orbital semimajor axes were uniformly distributed within the birth ring as specified in Table 1 and their eccentricities between [0.0, 0.1].
In each run with a thermally-supported gas disk, we launched
500 particles with radii distributed uniformly in a log scale
between
![]() and
and
![]() .
The size ranges
.
The size ranges
![]() used correspond to a
used correspond to a ![]() -ratio interval from 0.9 down to 0.01. The minimum
-ratio interval from 0.9 down to 0.01. The minimum ![]() value
of 0.01 is chosen to cover all grains which can have their
stability distance in or outside the center of the birth ring (see
Fig. 2 below).
Upon release, the particles instantaneously acquire orbits with
semimajor axes and eccentricities different from those of their parent
bodies, which is a standard radiation pressure effect (Burns et al. 1979).
value
of 0.01 is chosen to cover all grains which can have their
stability distance in or outside the center of the birth ring (see
Fig. 2 below).
Upon release, the particles instantaneously acquire orbits with
semimajor axes and eccentricities different from those of their parent
bodies, which is a standard radiation pressure effect (Burns et al. 1979).
The forces included stellar gravity, direct radiation pressure, the Poynting-Robertson force, and gas drag.
The drag force due to the stellar wind, which is known to be important for AU Mic (Strubbe & Chiang 2006; Augereau & Beust 2006),
is not included. The reason is that a nearly radial stellar wind could
no longer exist in the outer disk considered here, between
roughly 35 and 300 AU, because of the interactions with the
presumed rotating gas. Indeed, a simple estimate, assuming a mass loss
rate of
![]() and the stellar wind velocity of
and the stellar wind velocity of
![]() ,
yields the total mass of the stellar wind particles in the outer disk of
,
yields the total mass of the stellar wind particles in the outer disk of
![]() ,
about three orders of magnitude less than the mass of rotating gas in the nominal model.
,
about three orders of magnitude less than the mass of rotating gas in the nominal model.
The particle orbits were followed with the Everhart (1985,1974)
integrator of 15th order with an adaptive step size. The
integrations ended upon one of the following, whichever was the
earliest: (i) a grain came as close as 10 AU to the star;
(ii) a grain reached the distance of 1000 AU;
(iii) after 105 yr of integration. Instantaneous
positions of particles were stored each 500 years for bound grains
and each 5 years for unbound ones. A typical number of
instantaneous positions per system and gas model was
![]() .
.
The setup for the runs with radiation pressure-supported gas
disks was different from what is described above, because using the
same setup would lead to the following problem. As explained in
Sect. 4.3, we normalize the calculated dust density in such as way
as to arrive at the correct maximum geometrical optical depth ![]() (Table 1). In the usual runs for thermally-supported disks,
(Table 1). In the usual runs for thermally-supported disks, ![]() in the birth ring is dominated by the particles with
in the birth ring is dominated by the particles with
![]() .
But in the ``rns'' run these drift inward, so that
.
But in the ``rns'' run these drift inward, so that ![]() comes from grains with
comes from grains with
![]() .
These have smaller cross section, and thus their number density turns
out to be two orders of magnitude higher than in standard runs. Thus
the collisional lifetime becomes quite short,
.
These have smaller cross section, and thus their number density turns
out to be two orders of magnitude higher than in standard runs. Thus
the collisional lifetime becomes quite short, ![]() ...10 years.
For these reasons, the ``rns'', ``r0ns'', and ``r1ns'' models were run
with just 15 grains (instead of 500) over 103 years (instead of 105),
and the recording time step was as small as 0.5 years for bound
grains and 0.005 years for unbound ones. The minimum
...10 years.
For these reasons, the ``rns'', ``r0ns'', and ``r1ns'' models were run
with just 15 grains (instead of 500) over 103 years (instead of 105),
and the recording time step was as small as 0.5 years for bound
grains and 0.005 years for unbound ones. The minimum ![]() value was set to
value was set to
![]() (instead of 0.01), because in the radiation pressure-supported disks only grains with
(instead of 0.01), because in the radiation pressure-supported disks only grains with
![]() drift outward from the birth ring.
drift outward from the birth ring.
4.3 Collisional post-processing
The collisions were applied to the numerical integration results through the following post-processing algorithm:
- 1.
- The instantaneous positions of grains stored during the
numerical integrations are distributed into two-dimensional
size-distance bins,
( si, rj) or
 .
The number of occurrences in each bin
.
The number of occurrences in each bin
 is converted into the absolute number density
 from the known normal geometrical optical depth at the birth ring
(Table 1). Besides, for each bin we calculate the average radial velocity of its grains,
from the known normal geometrical optical depth at the birth ring
(Table 1). Besides, for each bin we calculate the average radial velocity of its grains,
 .
.
- 2.
- For each
-bin, the collisional lifetime of its particles is calculated as follows. We consider all bins with various
 at the same distance rj and check if Eq. (18) is fulfilled. The reciprocal of the collisional lifetime is
where is the collisional cross section and summation is performed over those projectiles that satisfy Eq. (18).
- 3.
- We then go back to the stored numerical integration results and go along each trajectory again. For a particle with
 at each time step tl, we calculate a probability that the particle survives destructive collisions over the current time step,
![$p(\beta_i, t_l) = \exp [-\Delta t / T_{{\rm coll}}(\beta_i,r_j)]$](/articles/aa/full_html/2009/45/aa12917-09/img151.png) ,
where rj is the distance at the moment tl and
,
where rj is the distance at the moment tl and
 is time step between two successive stored positions of the particle. Having p for all previous time steps for the same grain, we determine the probability for that grain to survive
collisions up to the current moment of time:
is time step between two successive stored positions of the particle. Having p for all previous time steps for the same grain, we determine the probability for that grain to survive
collisions up to the current moment of time:
(20)
- 4.
- Steps 1-3 are repeated iteratively. From now on, when determining the number densities in step 1, we use
 instead of just
.
instead of just
.
![$\displaystyle %
T_{{\rm coll}}(\beta_i,r_j)^{-1}
=
\sum\limits_k
n(\beta_k,r_j)
\times
\max [ v_{r}(\beta_i,r_j), v_{r}(\beta_k,r_j) ]
\sigma (\beta_i,\beta_k),$](/articles/aa/full_html/2009/45/aa12917-09/img148.png)
![\begin{figure}
\par\includegraphics[width=8.5cm,clip]{12917f02.eps}
\end{figure}](/articles/aa/full_html/2009/45/aa12917-09/img155.png)
|
Figure 2:
Loci of stability in the |
| Open with DEXTER | |
4.4 Calculation of surface brightness profiles
From
![]() recalculated after several iterations, the surface brightness of the disk is computed as
recalculated after several iterations, the surface brightness of the disk is computed as
|
(21) |
(we set q=3.5). Here, the factor s3-q provides conversion from particle numbers to their cross section area (s2), accounts for a logarithmic binning of sizes (
The latter conversion needs to be explained in more detail. For the
sake of simplicity, we assume here gray, isotropic scattering. In that
case, the brightness of the edge-on disk is known to come
mostly from the part of the line of sight closest to the star (e.g. Nakano 1990; Thébault & Augereau 2007). Further, as mentioned above, we assume a non-flared disk, with the dust scale height being linearly proportional to r. With these assumptions, the standard brightness integral gives
![]() .
Therefore, if
.
Therefore, if

|
(22) |
then

|
(23) |
with
5 Results
In this section, we start with an analysis of typical single-grain dynamics and then proceed with
![]() profiles.
profiles.
5.1 Radial drift of dust grains
We start with the case of a thermally-supported gas disk. Numerical solution of Eq. (17) with p=1/2 is shown in Fig. 2. It shows that the stability distance is less than 1000 AU only for grains with
![]() .
Grains with higher
.
Grains with higher ![]() ratios are sweeping outward all the way through the disk.
ratios are sweeping outward all the way through the disk.
![\begin{figure}
\par\includegraphics[width=7.5cm,clip]{12917f03.eps}
\end{figure}](/articles/aa/full_html/2009/45/aa12917-09/img163.png)
|
Figure 3:
Radial drift of different-size particles in the |
| Open with DEXTER | |
Figure 3 illustrates how grains with different ![]() ratios drift toward their stability distances in the nominal and high gas
ratios drift toward their stability distances in the nominal and high gas ![]() Pic models. It shows in particular how sensitive the drift timescale
Pic models. It shows in particular how sensitive the drift timescale
![]() (time needed for a grain to reach its stability distance) is to the the
grain sizes and to the gas content. Further, it tells us that
(time needed for a grain to reach its stability distance) is to the the
grain sizes and to the gas content. Further, it tells us that
![]() .
One reason for this is that
.
One reason for this is that
![]() increases rapidly with increasing distance. For instance, in the nominal gas case, the
increases rapidly with increasing distance. For instance, in the nominal gas case, the ![]() grains have the stability distance at
grains have the stability distance at ![]() AU, but are still at
AU, but are still at ![]() AU after 1 Myr of evolution. Hence they have
AU after 1 Myr of evolution. Hence they have
![]() Myr, whereas their stopping time at the birth ring distance is
Myr, whereas their stopping time at the birth ring distance is
![]()
![]() 103 yr.
103 yr.
We now turn to the case where the gas is radiation pressure-supported. As explained in Sect. 3.5, only the particles with
![]() will spiral outward from the birth ring, and the stability distance
does not exist. Thus the outer disk will only be composed of relatively
small grains in unbound orbits.
will spiral outward from the birth ring, and the stability distance
does not exist. Thus the outer disk will only be composed of relatively
small grains in unbound orbits.
5.2 Radial velocities and collisional outcomes
![\begin{figure}
\par\includegraphics[width=13.5cm,clip]{12917f04.eps}
\end{figure}](/articles/aa/full_html/2009/45/aa12917-09/img173.png)
|
Figure 4:
Radial velocity of different-sized grains in the |
| Open with DEXTER | |
The relative velocity of impacting grains is a crucial parameter, leading to their destruction if it exceeds
![]() (Eq. (18)). As discussed in Sect. 4.3, we assume that these impact speeds are of the order of particle radial velocities. Figure 4 plots vr for grains of various sizes, in the
(Eq. (18)). As discussed in Sect. 4.3, we assume that these impact speeds are of the order of particle radial velocities. Figure 4 plots vr for grains of various sizes, in the ![]() Pic disk without gas and for two gas models, and compares them to the value of
Pic disk without gas and for two gas models, and compares them to the value of
![]() for impacts between
equal-sized particles. The top panel reveals Keplerian U-shape curves, where
for impacts between
equal-sized particles. The top panel reveals Keplerian U-shape curves, where
![]() for all grains smaller than
for all grains smaller than
![]() (
(
![]() ), except near the apsides. Under the presence of gas (middle and bottom panels), radial velocities are damped, and only
), except near the apsides. Under the presence of gas (middle and bottom panels), radial velocities are damped, and only
![]() (
(
![]() )
grains have vr
exceeding the disruption threshold in the nominal gas case. For the
high gas case, this damping is much more efficient so that after a few
pseudo-orbits, even
)
grains have vr
exceeding the disruption threshold in the nominal gas case. For the
high gas case, this damping is much more efficient so that after a few
pseudo-orbits, even
![]() (
(
![]() )
grains have
)
grains have
![]() .
The results are similar for the other two systems, i.e., low vr for all grains larger than
.
The results are similar for the other two systems, i.e., low vr for all grains larger than
![]() in the gas free case and
in the gas free case and
![]() in the high gas case.
in the high gas case.
However, collisional disruption plays a significant role in all the
systems, for all gas models considered, and across the whole range of
distances in the outer disk. This is because of the crucial role of
collision between grains of unequal sizes. This is easy to understand. Indeed, Fig. 4
shows that very small grains always maintain large radial velocities.
Hence, for a grain of a given size, there is a significant amount of
somewhat smaller grains that are fast enough and still massive enough
to satisfy Eq. (18). To illustrate this, we plot in Fig. 5
the collisional lifetimes of different-sized grains around all three
stars, calculated with the algorithm described in Sect. 4. We see
that for
![]() ,
,
![]() is more or less independent of particle sizes in all considered cases. Overall,
is more or less independent of particle sizes in all considered cases. Overall,
![]() is longer in high-gas models and shorter in nominal-gas ones. For bound grains (
is longer in high-gas models and shorter in nominal-gas ones. For bound grains (
![]() )
in all models, they never exceed 4
)
in all models, they never exceed 4 ![]() 104 yr.
104 yr.
![\begin{figure}
\par\includegraphics[width=8cm,clip]{12917f05.eps}
\end{figure}](/articles/aa/full_html/2009/45/aa12917-09/img187.png)
|
Figure 5:
Collisional lifetime of different-sized grains (i.e. those with different |
| Open with DEXTER | |
![\begin{figure}
\par\includegraphics[width=8cm,clip]{12917f06.eps}
\end{figure}](/articles/aa/full_html/2009/45/aa12917-09/img188.png)
|
Figure 6:
|
| Open with DEXTER | |
![\begin{figure}
\par\includegraphics[width=8cm,clip]{12917f07.eps}
\end{figure}](/articles/aa/full_html/2009/45/aa12917-09/img189.png)
|
Figure 7: Same as Fig. 6, but for several gas models (thick curves). Collisions are included. |
| Open with DEXTER | |
5.3 Surface brightness profiles without gas
We now turn to
![]() profiles and start with a disk that does not contain gas (``000'' model for
profiles and start with a disk that does not contain gas (``000'' model for ![]() Pic), both with and without collisions taken into account. For comparison, we ran our full collisional code ACE (Krivov et al. 2008)
that provides a detailed treatment of collisions with a multitude of
collisional outcomes. The resulting profiles are shown
in Fig. 6.
Pic), both with and without collisions taken into account. For comparison, we ran our full collisional code ACE (Krivov et al. 2008)
that provides a detailed treatment of collisions with a multitude of
collisional outcomes. The resulting profiles are shown
in Fig. 6.
Without collisions we get a steep (
![]() )
)
![]() profile. This result is expected when assuming that grains down to the radiation pressure blow-out limit (
profile. This result is expected when assuming that grains down to the radiation pressure blow-out limit (
![]() )
are produced in the birth ring with a q=3.5 size distribution and that the smallest of these grains, which
dominate the outer ring, are then simply diluted along their eccentric orbits and thus get underabundant in the birth ring. Strubbe & Chiang (2006) showed that in this case the resulting surface density profile approximately decreases as r-2.5, yielding an
)
are produced in the birth ring with a q=3.5 size distribution and that the smallest of these grains, which
dominate the outer ring, are then simply diluted along their eccentric orbits and thus get underabundant in the birth ring. Strubbe & Chiang (2006) showed that in this case the resulting surface density profile approximately decreases as r-2.5, yielding an
![]() slope
of -4.5 (see Thébault & Wu 2008, for a more detailed discussion).
slope
of -4.5 (see Thébault & Wu 2008, for a more detailed discussion).
In contrast, the
![]() profile with collisions turned out to be close to -3.5...-4.0,
which corresponds to a surface density slope of
profile with collisions turned out to be close to -3.5...-4.0,
which corresponds to a surface density slope of
![]() ...-2.0. This slope agrees reasonably well with the one calculated with a full collisional simulation with ACE. A radial
...-2.0. This slope agrees reasonably well with the one calculated with a full collisional simulation with ACE. A radial
![]() slope close to 3.5 is theoretically expected, too. The difference with the collisionless case is that the small high-
slope close to 3.5 is theoretically expected, too. The difference with the collisionless case is that the small high-![]() grains
can only be produced and destroyed in the birth ring but spend most of
their time in collisionally inactive regions beyond it. As a
result, their number density follows the q=3.5 size distribution within
the birth ring
(instead of being underabundant as in the collisionless case)
so that the total integrated number of small grains (taking into
account the large fraction outside the birth ring) is much higher than
the one derived from a q=3.5 law (see Strubbe & Chiang 2006; Thébault & Wu 2008).
grains
can only be produced and destroyed in the birth ring but spend most of
their time in collisionally inactive regions beyond it. As a
result, their number density follows the q=3.5 size distribution within
the birth ring
(instead of being underabundant as in the collisionless case)
so that the total integrated number of small grains (taking into
account the large fraction outside the birth ring) is much higher than
the one derived from a q=3.5 law (see Strubbe & Chiang 2006; Thébault & Wu 2008).
5.4 Surface brightness profiles with gas: Pic
Figure 7 compares
![]() profiles for the
profiles for the ![]() Pic
systems in several gas models. It shows that the nominal amount of
gas leads to almost the same profile as the one without gas (close to
-3.5...-4.0). Furthermore, and surprisingly, all profiles with high and
very high gas masses (``ths'', ``tvs'', and ``thf'') are all close
to each other and
to those without or with little gas (
Pic
systems in several gas models. It shows that the nominal amount of
gas leads to almost the same profile as the one without gas (close to
-3.5...-4.0). Furthermore, and surprisingly, all profiles with high and
very high gas masses (``ths'', ``tvs'', and ``thf'') are all close
to each other and
to those without or with little gas (
![]() ...-4.0).
...-4.0).
Our ``tvs'' and ``000'' models are close, although not completely identical, to the ``high gas'' and ``no gas'' models in Thébault & Augereau (2005). In those two cases they obtained the slopes of
![]() and
and
![]() ,
respectively (their Figs. 3 and 4). Thus our result (
,
respectively (their Figs. 3 and 4). Thus our result (
![]() and
and
![]() ...-4.0)
slightly differs from theirs. Most of the difference comes from the
fact that they used a more realistic, extended distribution of parent
planetesimals, but a much simpler, monosized collisional model without
a collisional disruption threshold.
...-4.0)
slightly differs from theirs. Most of the difference comes from the
fact that they used a more realistic, extended distribution of parent
planetesimals, but a much simpler, monosized collisional model without
a collisional disruption threshold.
![\begin{figure}
\par\includegraphics[width=8cm,clip]{12917f08.eps}
\end{figure}](/articles/aa/full_html/2009/45/aa12917-09/img197.png)
|
Figure 8: Same as Fig. 7, but for models assuming different gas temperature profiles. Since all the curves fall almost on top of each other, we artificially lowered each curve listed in the legend (starting from ``tns'') relative to the previous one by a factor of 1.5. |
| Open with DEXTER | |
Next, we compared the ``rns'' profile with the ``tns'' one. Both turned out to be very similar (Fig. 8). This implies that both thermally-supported and radiation pressure-supported gas disks with the same amount of gas may yield similar radial distributions of dust.
Finally, we have also tested the influence of the radial profile of the gas temperature on the
![]() profiles. To this end, we compared the
profiles. To this end, we compared the
![]() profiles of
profiles of ![]() Pic
obtained in the ``tns'' model (p=1/2) with those in the ``t0ns'' and ``t1ns'' models (p=0 and 1, respectively). Similarly, ``rns'' results were compared with ``r0ns'' and ``r1ns''.
Again, the
Pic
obtained in the ``tns'' model (p=1/2) with those in the ``t0ns'' and ``t1ns'' models (p=0 and 1, respectively). Similarly, ``rns'' results were compared with ``r0ns'' and ``r1ns''.
Again, the
![]() profiles turned out to be almost indistinguishable (Fig. 8).
profiles turned out to be almost indistinguishable (Fig. 8).
5.5 Surface brightness profiles with gas: all systems
We now proceed with the numerical runs for all three systems and two
gas models (``tns'' and ``ths'') for each system (Table 1). The resulting profiles are shown in Fig. 9.
One lesson from the plots is about the role of collisions. In systems
with a high dust density (or a large optical depth) and low gas
density, collisions flatten the profile (![]() Pic, nominal gas; see also Fig. 6 without gas).
When the dust density is lower (AU Mic), collisions have little influence on the
Pic, nominal gas; see also Fig. 6 without gas).
When the dust density is lower (AU Mic), collisions have little influence on the
![]() slope.
The same is true in the case of a high gas density (high gas models for
all three systems). This is mostly because the strong gas drag sustains
sufficiently high radial
velocities even far from the star, so that vr(r) does not decrease with increasing r as abruptly as in the nominal gas cases (see Fig. 4).
slope.
The same is true in the case of a high gas density (high gas models for
all three systems). This is mostly because the strong gas drag sustains
sufficiently high radial
velocities even far from the star, so that vr(r) does not decrease with increasing r as abruptly as in the nominal gas cases (see Fig. 4).
![\begin{figure}
\par\includegraphics[width=15.2cm,clip]{12917f09.eps}
\end{figure}](/articles/aa/full_html/2009/45/aa12917-09/img198.png)
|
Figure 9:
|
| Open with DEXTER | |
In addition, Fig. 9 depicts partial contributions to
![]() profiles by different-sized grains. The largest contribution typically comes from medium-sized grains with
profiles by different-sized grains. The largest contribution typically comes from medium-sized grains with
![]() ,
most of which have stability distances outside the disk (Fig. 2)
and can be treated as ``effectively unbound'' ones. The relative contribution of the small
,
most of which have stability distances outside the disk (Fig. 2)
and can be treated as ``effectively unbound'' ones. The relative contribution of the small
![]() grains
slightly rises with increasing distance, but never becomes comparable
to that of the medium-sized particles. Large grains with
grains
slightly rises with increasing distance, but never becomes comparable
to that of the medium-sized particles. Large grains with
![]() do not make any appreciable contribution to the
do not make any appreciable contribution to the
![]() profiles in any of the systems.
profiles in any of the systems.
However, the most important conclusion from Fig. 9 is that the slopes differ only moderately for the two extreme gas models, an effect that we have already seen for ![]() Pic
and now see for the other two systems. In the nominal gas case, a
distinctive feature of the profiles is their slight
``curvature'' - they do not follow a single power-law across the
entire disk. This effect mostly comes from collisions rather than gas,
and it can also be seen in the gasless case (Fig. 6). The profiles are steeper close to the birth ring and are more gently sloping farther out. Between 2 and
Pic
and now see for the other two systems. In the nominal gas case, a
distinctive feature of the profiles is their slight
``curvature'' - they do not follow a single power-law across the
entire disk. This effect mostly comes from collisions rather than gas,
and it can also be seen in the gasless case (Fig. 6). The profiles are steeper close to the birth ring and are more gently sloping farther out. Between 2 and
![]() (
(
![]() being the birth ring distance), the slopes are -4.6 for
being the birth ring distance), the slopes are -4.6 for ![]() Pic, -4.5 for HD 32297,
and -4.7 for AU Mic. Outside
Pic, -4.5 for HD 32297,
and -4.7 for AU Mic. Outside
![]() ,
the slopes flatten to -3.5, -3.2, and -3.3,
respectively. In contrast, in the high gas case the curvature
effect is only present close to the birth ring. Outside
,
the slopes flatten to -3.5, -3.2, and -3.3,
respectively. In contrast, in the high gas case the curvature
effect is only present close to the birth ring. Outside
![]() ,
all three
,
all three
![]() profiles have slopes in a -3.6...-4.0 range.
profiles have slopes in a -3.6...-4.0 range.
Finally, the model slopes have to be compared with the observed slopes: -3.0...-4.0 (![]() Pic), -2.7...-3.7 (HD 32297), and -3.8...-4.7 (AU Mic). From all these values and from Fig. 9,
it is hardly possible to judge whether nominal-gas or high-gas
models match observations better. In particular, this depends on the
radial zone of the disk considered. Besides, one should keep in mind
that our models rest on many simplifying assumptions (as, for instance,
grey isotropic scattering) and have limited accuracy (e.g., contain
some numerical noise). Equally, the slopes retrieved from observations
inherit uncertainties from the data and are sensitive to the specific
procedure of data reduction (see, e.g., a discussion in Sect. 3.2
of Fitzgerald et al. 2007a)
and should be treated with caution, too. Thus the only conclusion we
can make is that nominal-gas and high-gas models are both is reasonable
agreement with observations.
Pic), -2.7...-3.7 (HD 32297), and -3.8...-4.7 (AU Mic). From all these values and from Fig. 9,
it is hardly possible to judge whether nominal-gas or high-gas
models match observations better. In particular, this depends on the
radial zone of the disk considered. Besides, one should keep in mind
that our models rest on many simplifying assumptions (as, for instance,
grey isotropic scattering) and have limited accuracy (e.g., contain
some numerical noise). Equally, the slopes retrieved from observations
inherit uncertainties from the data and are sensitive to the specific
procedure of data reduction (see, e.g., a discussion in Sect. 3.2
of Fitzgerald et al. 2007a)
and should be treated with caution, too. Thus the only conclusion we
can make is that nominal-gas and high-gas models are both is reasonable
agreement with observations.
6 Analytic model
To better understand the numerical simulation results, in this section we address the dust distributions analytically.
6.1 ``Static'' model in the case of a thermally-supported gas disk
We start with a simple model that assumes dust to swiftly drift by gas drag:
![]() ,
where
,
where
![]() is the dust radial drift time and
is the dust radial drift time and
![]() is the grain lifetime, e.g. collisional one. With this assumption, a dust grain of radius s is expected to ``instantaneously'' arrive at an equilibrium distance (17) from the star r
(for brevity the subscript ``stab'' will be omitted). This model
ignores that fact that grains spend finite time on their way to
stability distances, and thus also contribute to the optical depth and
brightness closer to the star than their parking distances.
It also ignores that stability distances of smaller grains
(if p<1) are located outside the disk and they never
arrive there. And, even if stability distances are well inside the
disk, grains may not arrive there (or not all of them may), if
they are collisionally eliminated on shorter timescales, meaning
that the assumption
is the grain lifetime, e.g. collisional one. With this assumption, a dust grain of radius s is expected to ``instantaneously'' arrive at an equilibrium distance (17) from the star r
(for brevity the subscript ``stab'' will be omitted). This model
ignores that fact that grains spend finite time on their way to
stability distances, and thus also contribute to the optical depth and
brightness closer to the star than their parking distances.
It also ignores that stability distances of smaller grains
(if p<1) are located outside the disk and they never
arrive there. And, even if stability distances are well inside the
disk, grains may not arrive there (or not all of them may), if
they are collisionally eliminated on shorter timescales, meaning
that the assumption
![]() fails.
fails.
Some of these assumptions fail in the systems considered in this paper.
For instance, in Sect. 5.5 we showed that the largest contribution
to the
![]() profiles
comes from ``effectively unbound'' grains. Nevertheless, we deem this
``static'' model useful. First, the ``static'' case is fully tractable
analytically. Second, it can give us a rough idea, to what extent the
ambient gas can change the dust profiles and it can be considered as a
limiting case for a more realistic ``dynamic'' model that will be
worked out later.
profiles
comes from ``effectively unbound'' grains. Nevertheless, we deem this
``static'' model useful. First, the ``static'' case is fully tractable
analytically. Second, it can give us a rough idea, to what extent the
ambient gas can change the dust profiles and it can be considered as a
limiting case for a more realistic ``dynamic'' model that will be
worked out later.
The grains with radii
![]() are produced in the birth ring at a constant rate
are produced in the birth ring at a constant rate
![]() ,
see Eq. (2). These grains drift to a size-dependent stability distance, which is
easy to find. In the limit of geometric optics,
,
see Eq. (2). These grains drift to a size-dependent stability distance, which is
easy to find. In the limit of geometric optics,
![]() ,
Eq. (4). Next,
,
Eq. (4). Next, ![]() is given by Eq. (10). Equating
is given by Eq. (10). Equating ![]() and
and ![]() we find a simple relation between the grain radius and stability distance (one-to-one if
we find a simple relation between the grain radius and stability distance (one-to-one if ![]() ):
):
Grains with radii

|
(26) |
and the normal geometrical optical depth of the annulus is
We now assume that the grain lifetime is independent of size (or distance). This is a reasonable approximation as can be seen, for instance, from Fig. 5. Substituting Eqs. (25) and (2) into (27) yields a radial dependence

where
According to Eq. (24), the
In the above derivations we adopted the gas temperature which is independent of the dust distribution. However, as discussed above (see Eq. (16)), in a high dust density limit the gas temperature may become proportional to a certain power of the dust density (or equivalently the optical depth
and Eq. (30) for the
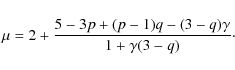
![\begin{figure}
\par\includegraphics[width=8.5cm,clip]{12917f10.eps}
\end{figure}](/articles/aa/full_html/2009/45/aa12917-09/img218.png)
|
Figure 10:
Radial slope of surface brightness for different p, q, |
| Open with DEXTER | |
Figure 10 gives slopes ![]() of surface brightness (without grain-grain collisions) for various p, q, and for
of surface brightness (without grain-grain collisions) for various p, q, and for ![]() and 1. These results can easily be understood. Consider, for instance, the standard gas heating model (
and 1. These results can easily be understood. Consider, for instance, the standard gas heating model (
![]() ). We start with the dependence on q for a fixed p. If the temperature gradient is not too steep (p<1), then s decreases with increasing r. In that case, assuming a steeper size distribution (larger q)
makes the profile flatter, as it should. For a steep temperature drop-off (p>1), it is the other way round. The steeper the size distribution, the steeper the profile. The dependence on p for a fixed q is also obvious. For all q > 3.0 (which is expected), a steeper temperature gradient
steepens the
). We start with the dependence on q for a fixed p. If the temperature gradient is not too steep (p<1), then s decreases with increasing r. In that case, assuming a steeper size distribution (larger q)
makes the profile flatter, as it should. For a steep temperature drop-off (p>1), it is the other way round. The steeper the size distribution, the steeper the profile. The dependence on p for a fixed q is also obvious. For all q > 3.0 (which is expected), a steeper temperature gradient
steepens the
![]() profile. For all q < 3.0, the opposite is true. In the standard case that we took in most of the numerical simulations (p = 1/2, q = 3.5), we get
profile. For all q < 3.0, the opposite is true. In the standard case that we took in most of the numerical simulations (p = 1/2, q = 3.5), we get
![]() (asterisk in Fig. 10).
(asterisk in Fig. 10).
In the case of a dust-induced gas heating (
![]() ), Eq. (32) and Fig. 10 suggest that a much wider range of
), Eq. (32) and Fig. 10 suggest that a much wider range of ![]() is possible, and that the results are more sensitive to q. For example, the same standard case p = 1/2, q = 3.5 would result in an extremely steep
is possible, and that the results are more sensitive to q. For example, the same standard case p = 1/2, q = 3.5 would result in an extremely steep ![]() .
However, in view of the temperature calculation results presented
in Fig. 1, we do not expect Eq. (32) to be better approximation to reality than Eq. (30). Rather, it is meant to show that the radial distribution of dust is quite sensitive to the assumed gas heating model.
.
However, in view of the temperature calculation results presented
in Fig. 1, we do not expect Eq. (32) to be better approximation to reality than Eq. (30). Rather, it is meant to show that the radial distribution of dust is quite sensitive to the assumed gas heating model.
6.2 ``Dynamic'' model
Instead of considering a system in which all grains reside at their
stability distances, we now allow grains to drift through the disk
towards their respective parking positions. We start with a
thermally-supported gas disk and, for a time being, we neglect
collisions. Equation (27) for the normal geometrical optical depth of the disk replaces by
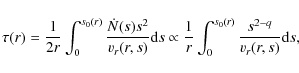
and the surface brightness profile is now given by
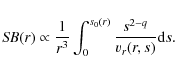
Here, s0(r) is the radius of those grains whose stability distance is r. For disks with p<1, s0 decreases with r. The radius s0 or equivalently, the radiation pressure-to-gravity ratio of grains with radius s0, which we denote by
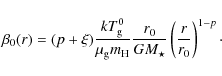
As a numerical example, for
Unfortunately,
vr(r,s) is a complicated, non-power-law function of both arguments (see, e.g., Eq. (23) in Takeuchi & Artymowicz 2001). What is more, a distance-dependent integration limit s0(r) in Eq. (34) would result is a non-power-law brightness profile even if vr was a power law. The only straightforward particular case is blowout grains with
![]() .
Figure 4 shows that their radial velocity is nearly constant, yielding
.
Figure 4 shows that their radial velocity is nearly constant, yielding
![]() .
This is consistent with numerical simulations (see dotted lines in Fig. 9).
.
This is consistent with numerical simulations (see dotted lines in Fig. 9).
For the bound grains with moderate ![]() that actually dominate outer disks, there are two competing effects. One is the distance-dependent integration limit s0 (r).
Its physical meaning is as follows. The larger the distance, the
smaller the grains need to be to be able to reach it by gas drag. Thus
larger grains are only present closer to the star, which steepens the
that actually dominate outer disks, there are two competing effects. One is the distance-dependent integration limit s0 (r).
Its physical meaning is as follows. The larger the distance, the
smaller the grains need to be to be able to reach it by gas drag. Thus
larger grains are only present closer to the star, which steepens the
![]() slope. Another effect is that vr decreases with r (see Fig. 4), making the
slope. Another effect is that vr decreases with r (see Fig. 4), making the
![]() slope flatter than -3. For instance, if we adopt
slope flatter than -3. For instance, if we adopt
![]() as a very rough approximation for the outer disk, we will have
as a very rough approximation for the outer disk, we will have
![]() .
.
Further complications are expected from collisions. The grains have then a limited lifetime, and the integrand in Eq. (34) would have to be weighted with a fraction of particles that survive collisions before they arrive at a distance r. This would generally affect the
![]() slope.
slope.
Because of the complexity of
vr(r,s) and limited grain
lifetime due to collisions, it is difficult to extend our
``dynamic'' model further. However, the model is still useful, as it
uncovers the reason why
![]() slopes in systems with gas may be flatter than -3 (like in Thébault & Augereau 2005, see their Fig. 3):
it is the slow-down of radial drift velocity with increasing
distance. On the other hand, the model demonstrates that slopes steeper
than -3 are also possible, because larger grains can only drift to
limited distances and only contribute to the parts of the disk close to
the birth ring.
slopes in systems with gas may be flatter than -3 (like in Thébault & Augereau 2005, see their Fig. 3):
it is the slow-down of radial drift velocity with increasing
distance. On the other hand, the model demonstrates that slopes steeper
than -3 are also possible, because larger grains can only drift to
limited distances and only contribute to the parts of the disk close to
the birth ring.
Equations (33), (34) also hold for the radiation pressure-supported disks. However, in this case the upper integration limit s0 has another meaning: the radius of
grains whose ![]() ratio is equal to
ratio is equal to
![]() ,
Eq. (12).
The above discussion applies in large part to this case, too. The main
conclusion is that a slope around -3.0 is expected, possible
deviations from which stem from a size-dependent radial
drift velocity and collisions.
,
Eq. (12).
The above discussion applies in large part to this case, too. The main
conclusion is that a slope around -3.0 is expected, possible
deviations from which stem from a size-dependent radial
drift velocity and collisions.
7 Conclusions
We considered young debris disks, in which there is observational evidence for a rotating gas component (either primordial or secondary). We assumed that dust is replenished from parent bodies that are located in a ``birth ring'' (which usually shows up in the resolved images). We then modeled the dust distribution and scattered-light brightness profile in the outer part of the disk, exterior to the birth ring, under different assumptions about possible amount and distribution of gas.
Our main conclusions are as follows:
- 1.
- Our numerical simulations revealed that the radial profile of dust density, and thus the surface brightness profile of a dusty disk, are surprisingly insensitive to the parameters of a central star, location of the dust-producing planetesimal belt, dustiness of the disk and, most interestingly, the parameters of the ambient gas. The radial brightness slopes in the outer disks are all typically in the range -3...-4. This result holds for gas densities varying by three orders of magnitude and for different radial profiles of the gas temperature. Both the gas of solar composition supported against gravity by gas pressure gradient and gas of strongly non-solar composition that must be supported by radiation pressure would lead to similar profiles, too. The slopes of -3...-4 are the same that were theoretically found for gas-free debris disks, and they are the same as actually retrieved from observations of many debris disks.
- 2.
- Although the slopes roughly fall into the range -3...-4, the numerical simulations made it apparent that the exact slope depends on the total amount of gas in the disk and the gas density distribution slope, as well as on the dust density (through collisional timescales).
- 3.
- We developed a simple analytic description of the radial
distribution of dust brightness in an optically thin disk. The analytic
model explains the numerical results 1.-2. and provides guidelines to
what can be expected in young debris disks, prior to any detailed
numerical modeling.
Assuming gray isotropic scattering by dust, the analytic model predicts
a range of slopes around -3, due to the dominant contribution of
small high-
grains. It shows that deviations from this nominal value may come from
the slow-down of radial drift of bigger grains at larger distances
(flattening), from the fact that larger grains cannot reach larger
distances (steepening),
and from the collisional elimination of dust particles. In the limiting
case of very high gas densities and low dust densities (where the
``visible'' dust drifts through the outer disk
over timescales shorter than their collisional timescales), if the dust
size distribution at production follows a power law with an
index -3.5, and assuming a black-body gas temperature,
the model predicts a slope of -3.75.
- 4.
- Our results for three young (10-30 Myr old), spatially resolved, edge-on debris disks ( Pic,
HD 32297, and AU Mic) show that the observed radial profiles
of the surface brightness do not pose any stringent constraints on the
gas component of the disk. At least for gas densities falling
within the observationally derived density limits, we do not see any
significant effect of gas on dust distributions. Thus we cannot exclude
that outer parts of the systems may have
retained substantial amounts of primordial gas which is not evident in
the gas observations
(e.g. as much as 50 Earth masses for Pic).
However, the possibility that gas is only present in small to moderate
amounts, as deduced from gas detections (e.g.
 Earth masses in the Pic
disk or even less), remains open, too. In that case, gas would be
secondary, stemming for instance from grain-grain collisions or
photo-desorption of dust.
Earth masses in the Pic
disk or even less), remains open, too. In that case, gas would be
secondary, stemming for instance from grain-grain collisions or
photo-desorption of dust.
We thank Torsten Löhne for many useful discussions. Comments by an anonymous referee that helped to improve the paper are appreciated. Part of this work was supported by the Deutsche Forschungsgemeinschaft, DFG project number Kr 2164/8-1, by the Deutscher Akademischer Austauschdienst (DAAD), project D/0707543, and by the International Space Science Institute Bern, Switzerland (``Exozodiacal Dust Disks and Darwin'' working group, http://www.issibern.ch/teams/exodust/). F.H. was partly funded by the graduate student fellowship of the Thuringia State. A.B. was funded by the Swedish National Space Board (contract 84/08:1).
Appendix A: Nomenclature
| Symbol | Description |
| d | Distance of the star from Earth |
| G | Universal gravitational constant |
| k | Boltzmann constant |
| n | Dust number density |
| q | Slope of dust size distribution in the birth ring (2) |
| Critical energy for fragmentation and dispersal (18) | |
|
|
Radiation pressure efficiency |
| r | Distance from the star |
| Stellar luminosity | |
| Solar luminosity | |
| Mass of hydrogen atom | |
| Projectile mass (18) | |
| Target mass (18) | |
| Stellar mass | |
| Solar mass | |
| Earth mass | |
| s | Radius of a dust grain |
|
|
Surface brightness |
| SED | Spectral energy distribution |
| p | Radial slope of |
| P | Gas pressure |
| Gas temperature | |
|
|
Collisional lifetime (19) |
|
|
Time a grain needs to reach its rstab |
|
|
Dust settling time (towards the disk mid-plane) |
|
|
Dust stopping time (15) |
|
|
Minimum relative velocity for collisional disruption (18) |
| Orbital velocity of a gas parcel | |
| Circular Keplerian velocity | |
| vr | Radial velocity of a dust grain |
|
|
Relative velocity of two dust grains at collision |
| Thermal velocity of gas | |
| Radial slope of |
|
| Ratio of radiation pressure force to gravity for dust grains | |
|
|
Ratio of radiation pressure force to gravity for gas |
| Efficiency of gas heating by dust (16) | |
| Ratio of gas-supporting force to gravity (6), (12) | |
|
|
Bulk density of dust grains |
|
|
Gas density |
| Collisional cross section of dust grains (19) | |
| Normal geometrical optical depth | |
| Radial slope of
|
|
|
|
Molecular weight of gas |
| Radial slope of gas density (9) |
References
- Alexander, R. 2008, New Astron. Rev., 52, 60 [NASA ADS] [CrossRef]
- Alexander, R. D., & Armitage, P. J. 2007, MNRAS, 375, 500 [NASA ADS] [CrossRef]
- Artymowicz, P. 2000, Space Sci. Rev., 92, 69 [NASA ADS] [CrossRef]
- Artymowicz, P., & Clampin, M. 1997, ApJ, 490, 863 [NASA ADS] [CrossRef]
- Augereau, J., & Beust, H. 2006, A&A, 455, 987 [NASA ADS] [CrossRef] [EDP Sciences]
- Augereau, J.-C., Nelson, R. P., Lagrange, A.-M., et al. 2001, A&A, 370, 447 [NASA ADS] [CrossRef] [EDP Sciences]
- Benz, W., & Asphaug, E. 1999, Icarus, 142, 5 [NASA ADS] [CrossRef]
- Besla, G., & Wu, Y. 2007, ApJ, 655, 528 [NASA ADS] [CrossRef]
- Beust, H., & Valiron, P. 2007, A&A, 466, 201 [NASA ADS] [CrossRef] [EDP Sciences]
- Brandeker, A., & Jayawardhana, R. 2008, poster on conference New Light on Young Stars: Spitzer's View of Circumstellar Disks held in Pasadena, CA, October 26-30
- Brandeker, A., Liseau, R., Olofsson, G., & Fridlund, M. 2004, A&A, 413, 681 [NASA ADS] [CrossRef] [EDP Sciences]
- Burns, J. A., Lamy, P. L., & Soter, S. 1979, Icarus, 40, 1 [NASA ADS] [CrossRef]
- Chen, C. H., Li, A., Bohac, C., et al. 2007, ApJ, 666, 466 [NASA ADS] [CrossRef]
- Cieza, L. A., Swift, J. J., Mathews, G. S., & Williams, J. P. 2008, ApJ, 686, L115 [NASA ADS] [CrossRef]
- Clarke, C. J., Gendrin, A., & Sotomayor, M. 2001, MNRAS, 328, 485 [NASA ADS] [CrossRef]
- Czechowski, A., & Mann, I. 2007, ApJ, 660, 1541 [NASA ADS] [CrossRef]
- Everhart, E. 1974, Celest. Mech. Dynam. Astron., 10, 35
- Everhart, E. 1985, in Dynamics of Comets: Their Origin and Evolution, ed. A. Carusi, & G. B. Valsecchi (Dordrecht: Reidel), 185
- Ferlet, R., Vidal-Madjar, A., & Hobbs, L. M. 1987, A&A, 185, 267 [NASA ADS]
- Fernández, R., Brandeker, A., & Wu, Y. 2006, ApJ, 643, 509 [NASA ADS] [CrossRef]
- Fitzgerald, M. P., Kalas, P. G., Duchêne, G., Pinte, C., & Graham, J. R. 2007a, ApJ, 670, 536 [NASA ADS] [CrossRef]
- Fitzgerald, M. P., Kalas, P. G., & Graham, J. R. 2007b, ApJ, 670, 557 [NASA ADS] [CrossRef]
- France, K., Roberge, A., Lupu, R. E., Redfield, S., & Feldman, P. D. 2007, ApJ, 668, 1174 [NASA ADS] [CrossRef]
- Freudling, W., Lagrange, A.-M., Vidal-Madjar, A., Ferlet, R., & Forveille, T. 1995, A&A, 301, 231 [NASA ADS]
- Golimowski, D. A., Ardila, D. R., Krist, J. E., et al. 2006, AJ, 131, 3109 [NASA ADS] [CrossRef]
- Herrmann, F., & Krivov, A. V. 2007, A&A, 476, 829 [NASA ADS] [CrossRef] [EDP Sciences]
- Hillenbrand, L. A. 2008, Physica Scripta Volume T, 130, 014024 [NASA ADS] [CrossRef]
- Hobbs, L. M., Vidal-Madjar, A., Ferlet, R., Albert, C. E., & Gry, C. 1985, ApJ, 293, L29 [NASA ADS] [CrossRef]
- Hollenbach, D. J., Yorke, H. W., & Johnstone, D. 2000, in Protostars and Planets IV, ed. V. Mannings, A. P. Boss, & S. S. Russell (Tucson: University of Arizona Press), 401
- Hughes, A. M., Wilner, D. J., Kamp, I., & Hogerheijde, M. R. 2008, ApJ, 681, 626 [NASA ADS] [CrossRef]
- Jolly, A., McPhate, J. B., Lecavelier, A., et al. 1998, A&A, 329, 1028 [NASA ADS]
- Kalas, P. 2005, ApJ, 635, L169 [NASA ADS] [CrossRef]
- Kalas, P., Liu, M. C., & Matthews, B. C. 2004, Science, 303, 1990 [NASA ADS] [CrossRef]
- Kamp, I., & van Zadelhoff, G.-J. 2001, A&A, 373, 641 [NASA ADS] [CrossRef] [EDP Sciences]
- Klahr, H., & Lin, D. N. C. 2005, ApJ, 632, 1113 [NASA ADS] [CrossRef]
- Krist, J. E., Ardila, D. R., Golimowski, D. A., & 38 colleagues. 2005, AJ, 129, 1008 [NASA ADS] [CrossRef]
- Krivov, A. V., Sremcevic, M., & Spahn, F. 2005, Icarus, 174, 105 [NASA ADS] [CrossRef]
- Krivov, A. V., Löhne, T., & Sremcevic, M. 2006, A&A, 455, 509 [NASA ADS] [CrossRef] [EDP Sciences]
- Krivov, A. V., Müller, S., Löhne, T., & Mutschke, H. 2008, ApJ, 687, 608 [NASA ADS] [CrossRef]
- Lagrange, A.-M., Backman, D. E., & Artymowicz, P. 2000, in Protostars and Planets IV, ed. V. Mannings, A. P. Boss, & S. S. Russell (Tucson: University of Arizona Press), 639
- Lecavelier des Etangs, A., Vidal-Madjar, A., Roberge, A., et al. 2001, Nature, 412, 706 [NASA ADS] [CrossRef]
- Liu, M. C. 2004, Science, 305, 1442 [NASA ADS] [CrossRef]
- Liu, M. C., Matthews, B. C., Williams, J. P., & Kalas, P. G. 2004, ApJ, 608, 526 [NASA ADS] [CrossRef]
- Lubow, S. H. & D'Angelo, G. 2006, ApJ, 641, 526 [NASA ADS] [CrossRef]
- Lubow, S. H., Seibert, M., & Artymowicz, P. 1999, ApJ, 526, 1001 [NASA ADS] [CrossRef]
- Maness, H. L., Fitzgerald, M. P., Paladini, R., et al. 2008, ApJ, 686, L25 [NASA ADS] [CrossRef]
- Metchev, S. A., Eisner, J. A., Hillenbrand, L. A., & Wolf, S. 2005, ApJ, 622, 451 [NASA ADS] [CrossRef]
- Moerchen, M. M., Telesco, C. M., De Buizer, J. M., Packham, C., & Radomski, J. T. 2007, ApJ, 666, L109 [NASA ADS] [CrossRef]
- Mouillet, D., Larwood, J. D., Papaloizou, J. B., & Lagrange, A.-M. 1997, MNRAS, 292, 896 [NASA ADS]
- Najita, J. R., Strom, S. E., & Muzerolle, J. 2007, MNRAS, 378, 369 [NASA ADS] [CrossRef]
- Nakano, T. 1990, ApJ, 355, L43 [NASA ADS] [CrossRef]
- Olofsson, G., Brandeker, A., & Liseau, R. 2001, ApJ, 563, L41 [CrossRef]
- Redfield, S. 2007, ApJ, 656, L97 [NASA ADS] [CrossRef]
- Roberge, A., & Weinberger, A. J. 2008, ApJ, 676, 509 [NASA ADS] [CrossRef]
- Roberge, A., Feldman, P. D., Lagrange, A. M., et al. 2000, ApJ, 538, 904 [NASA ADS] [CrossRef]
- Roberge, A., Weinberger, A. J., Redfield, S., & Feldman, P. D. 2005, ApJ, 626, L105 [NASA ADS] [CrossRef]
- Roberge, A., Feldman, P. D., Weinberger, A. J., Deleuil, M., & Bouret, J.-C. 2006, Nature, 441, 724 [NASA ADS] [CrossRef]
- Schneider, G., Silverstone, M. D., & Hines, D. C. 2005, ApJ, 629, L117 [NASA ADS] [CrossRef]
- Slettebak, A. 1975, ApJ, 197, 137 [NASA ADS] [CrossRef]
- Smith, B. A., & Terrile, R. I. 1984, Science, 226, 1421 [NASA ADS] [CrossRef]
- Strubbe, L. E., & Chiang, E. I. 2006, ApJ, 648, 652 [NASA ADS] [CrossRef]
- Takeuchi, T., & Artymowicz, P. 2001, ApJ, 557, 990 [NASA ADS] [CrossRef]
- Takeuchi, T., & Lin, D. N. C. 2005, ApJ, 623, 482 [NASA ADS] [CrossRef]
- Takeuchi, T., Clarke, C. J., & Lin, D. N. C. 2005, ApJ, 627, 286 [NASA ADS] [CrossRef]
- Thébault, P., & Augereau, J.-C. 2005, A&A, 437, 141 [NASA ADS] [CrossRef] [EDP Sciences]
- Thébault, P., & Augereau, J.-C. 2007, A&A, 472, 169 [NASA ADS] [CrossRef] [EDP Sciences]
- Thébault, P., & Wu, Y. 2008, A&A, 481, 713 [NASA ADS] [CrossRef] [EDP Sciences]
- van Dishoeck, E. F., & Black, J. H. 1988, ApJ, 334, 771 [CrossRef]
- Vidal-Madjar, A., Lagrange-Henri, A.-M., Feldman, P. D., et al. 1994, A&A, 290, 245 [NASA ADS]
- Weidenschilling, S. J. 1977, MNRAS, 180, 57 [NASA ADS]
- Wyatt, M. C. 2008, ARA&A, 46, 339 [NASA ADS] [CrossRef]
- Zuckerman, B., & Becklin, E. E. 1993, ApJ, 414, 793 [NASA ADS] [CrossRef]
- Zuckerman, B., Song, I., Bessell, M. S., & Webb, R. A. 2001, ApJ, 562, L87 [NASA ADS] [CrossRef]
All Tables
Table 1:
Models for ![]() Pic, HD 32297, and AU Mic.
Pic, HD 32297, and AU Mic.
All Figures
|
|
Figure 1:
Top: gas temperature in the |
| Open with DEXTER | |
| In the text | |
|
|
Figure 2:
Loci of stability in the |
| Open with DEXTER | |
| In the text | |
|
|
Figure 3:
Radial drift of different-size particles in the |
| Open with DEXTER | |
| In the text | |
|
|
Figure 4:
Radial velocity of different-sized grains in the |
| Open with DEXTER | |
| In the text | |
|
|
Figure 5:
Collisional lifetime of different-sized grains (i.e. those with different |
| Open with DEXTER | |
| In the text | |
|
|
Figure 6:
|
| Open with DEXTER | |
| In the text | |
|
|
Figure 7: Same as Fig. 6, but for several gas models (thick curves). Collisions are included. |
| Open with DEXTER | |
| In the text | |
|
|
Figure 8: Same as Fig. 7, but for models assuming different gas temperature profiles. Since all the curves fall almost on top of each other, we artificially lowered each curve listed in the legend (starting from ``tns'') relative to the previous one by a factor of 1.5. |
| Open with DEXTER | |
| In the text | |
|
|
Figure 9:
|
| Open with DEXTER | |
| In the text | |
|
|
Figure 10:
Radial slope of surface brightness for different p, q, |
| Open with DEXTER | |
| In the text | |
Copyright ESO 2009
Current usage metrics show cumulative count of Article Views (full-text article views including HTML views, PDF and ePub downloads, according to the available data) and Abstracts Views on Vision4Press platform.
Data correspond to usage on the plateform after 2015. The current usage metrics is available 48-96 hours after online publication and is updated daily on week days.
Initial download of the metrics may take a while.