| Issue |
A&A
Volume 507, Number 3, December I 2009
|
|
|---|---|---|
| Page(s) | 1271 - 1276 | |
| Section | Cosmology (including clusters of galaxies) | |
| DOI | https://doi.org/10.1051/0004-6361/200912762 | |
| Published online | 01 October 2009 | |
A&A 507, 1271-1276 (2009)
Local dark matter and dark energy
as estimated on a scale of  1 Mpc in a self-consistent way
A. D. Chernin1,2 - P. Teerikorpi1 - M. J. Valtonen1 - V. P. Dolgachev2 - L. M. Domozhilova2 - G. G. Byrd3
1 - Tuorla Observatory, Department of Physics and Astronomy, University of Turku, 21500 Piikkiö,
Finland
2 - Sternberg Astronomical Institute, Moscow University, Moscow 119899, Russia
3 - University of Alabama, Tuscaloosa, AL 35487-0324, USA
Received 24 June 2009 / Accepted 14 September 2009
Abstract
Context. Dark energy was first detected from large distances on gigaparsec scales. If it is vacuum energy (or Einstein's ![]() ), it should also exist in very local space. Here we discuss its measurement on megaparsec scales of the Local Group.
), it should also exist in very local space. Here we discuss its measurement on megaparsec scales of the Local Group.
Aims. We combine the modified Kahn-Woltjer method for the
Milky Way-M 31 binary and the HST observations
of the expansion flow around the Local Group in order to study in a
self-consistent way and simultaneously the local density of dark energy
and the dark matter mass contained within the Local Group.
Methods. A theoretical model is used that accounts for the dynamical effects of dark energy on a scale of ![]() 1 Mpc.
1 Mpc.
Results. The local dark energy density is put into the range
![]() (
(
![]() is the globally measured density), and the Local Group mass lies within
is the globally measured density), and the Local Group mass lies within
![]() .
The lower limit of the local dark energy density, about
.
The lower limit of the local dark energy density, about
![]() the global value, is determined by the natural binding condition for
the group binary and the maximal zero-gravity radius. The near
coincidence of two values measured with independent methods on scales
differing by
the global value, is determined by the natural binding condition for
the group binary and the maximal zero-gravity radius. The near
coincidence of two values measured with independent methods on scales
differing by ![]() 1000 times is remarkable. The mass
1000 times is remarkable. The mass ![]()
![]() and the local dark energy density
and the local dark energy density ![]()
![]() are also consistent with the expansion flow close to the Local Group, within the standard cosmological model.
are also consistent with the expansion flow close to the Local Group, within the standard cosmological model.
Conclusions. One should take into account the dark energy in
dynamical mass estimation methods for galaxy groups, including the
virial theorem. Our analysis gives new strong evidence in favor of
Einstein's idea of the universal antigravity described by the
cosmological constant.
Key words: galaxies: Local Group - cosmology: dark matter - cosmology: cosmological parameters
1 Introduction
Regardless of its microscopic structure and physical nature, dark
energy is not currently assumed to cluster. If dark energy is described
macroscopically by Einstein's cosmological constant ![]() ,
the dark energy density is the same in all space. It does not change
with time, and it has the same value in any reference frame. This
interpretation is adopted in the currently standard
,
the dark energy density is the same in all space. It does not change
with time, and it has the same value in any reference frame. This
interpretation is adopted in the currently standard ![]() cold dark matter (
cold dark matter (![]() CDM) cosmology, where dark
energy is treated as a medium with positive constant density
and negative pressure (
CDM) cosmology, where dark
energy is treated as a medium with positive constant density
and negative pressure (
![]() ,
,
![]() ). It
is characterized by the equation of state
). It
is characterized by the equation of state
![]() (c
=1), like that of a vacuum. According to the equations of general relativity, gravity
depends on pressure, as well as density: the effective gravitating
density
(c
=1), like that of a vacuum. According to the equations of general relativity, gravity
depends on pressure, as well as density: the effective gravitating
density
![]() is negative for a vacuum (=
is negative for a vacuum (=
![]() ), and this leads to repulsion (antigravity). Since all
galaxies and galaxy systems are embedded in a perfectly uniform
and static dark energy background, their motions in space are
affected by its antigravity. The antigravity is so
strong that it accelerates the cosmological recession.
This acceleration was observationally discovered
at
), and this leads to repulsion (antigravity). Since all
galaxies and galaxy systems are embedded in a perfectly uniform
and static dark energy background, their motions in space are
affected by its antigravity. The antigravity is so
strong that it accelerates the cosmological recession.
This acceleration was observationally discovered
at ![]() 1000 Mpc horizon-scale distances (Riess et al. 1998;
Perlmutter et al. 1999).
1000 Mpc horizon-scale distances (Riess et al. 1998;
Perlmutter et al. 1999).
1.1 The very local environment
Dark matter antigravity can also affect galaxy motions in our
near environment in a volume several Mpc across, as
first mentioned by Chernin et al. (2000). The region is
dominated by our Milky Way and its sister galaxy M 31 at
0.7 Mpc from us, approaching each other with a relative velocity
![]() 120 km s-1. Together with the Magellanic Clouds, the
Triangulum galaxy, and four dozen other dwarf galaxies, these two
major galaxies form the Local Group occupying a
spherical volume of
120 km s-1. Together with the Magellanic Clouds, the
Triangulum galaxy, and four dozen other dwarf galaxies, these two
major galaxies form the Local Group occupying a
spherical volume of ![]() 1.2 Mpc in radius. Around the group, two
dozen neighboring dwarf galaxies are seen at distances 1.6-3 Mpc from the
group barycenter, moving away from the group. Their motion is the local part of the
expansion flow discovered in 1929 by Hubble. The
Local Group and the flow may be viewed as an isolated system with
a common origin and evolutionary history (the
local ``Hubble cell''). Systems of this kind are typical in the local universe.
1.2 Mpc in radius. Around the group, two
dozen neighboring dwarf galaxies are seen at distances 1.6-3 Mpc from the
group barycenter, moving away from the group. Their motion is the local part of the
expansion flow discovered in 1929 by Hubble. The
Local Group and the flow may be viewed as an isolated system with
a common origin and evolutionary history (the
local ``Hubble cell''). Systems of this kind are typical in the local universe.
Galaxies in the Local Group and in the neighboring flow have been systematically observed with the HST during more than 200 orbital periods (Karachentsev 2005; Karachentsev et al. 2003-2009). From these and other observations, high-precision radial velocities and distances are known for about 200 galaxies of the Local Group and neighbors within 7 Mpc from the group center.
The two major physical parameters of the local Hubble cell are the
total gravitating (dark and baryonic) mass of the Local
Group and the local density of the dark energy. The total mass of
the group has been determined with a number of empirical methods
including the classic model of Kahn & Woltjer (1959; see also
Einasto & Lynden-Bell 1982), the virial theorem (see a review by
van den Bergh 1999), and the zero-velocity estimate (cf. a recent
paper by Karachentsev et al. 2009 and references therein). The
results are in the interval
![]() .
.
1.2 Dark energy, the mass, and the ``lost gravity'' effect
If dark energy is identified with Einstein' constant
![]() ,
the local dark energy density must be
identical to that measured in the global
observations (Riess et al. 1998; Perlmutter et al. 1999).
From recent CMB studies (Spergel et al. 2007),
,
the local dark energy density must be
identical to that measured in the global
observations (Riess et al. 1998; Perlmutter et al. 1999).
From recent CMB studies (Spergel et al. 2007),
![]() g cm-1. In earlier studies, using the HST
observations of the local Hubble cell (Karachentsev 2005; Karachentsev et al.
2003-2009), we found that the
density of dark energy can be studied independently of the global
measurements (Chernin 2001; Chernin et al. 2006; Teerikorpi et al.
2008). We concluded that a local dark energy density of the global
value
g cm-1. In earlier studies, using the HST
observations of the local Hubble cell (Karachentsev 2005; Karachentsev et al.
2003-2009), we found that the
density of dark energy can be studied independently of the global
measurements (Chernin 2001; Chernin et al. 2006; Teerikorpi et al.
2008). We concluded that a local dark energy density of the global
value
![]() and a group mass from the literature are consistent with the local
Hubble cell
and a group mass from the literature are consistent with the local
Hubble cell ![]() 1 Mpc dynamics.
1 Mpc dynamics.
In the present paper, we make the next step using the Hubble cell data. In contrast to our earlier study, we derive the Local Group mass and the local dark energy density from the Hubble cell data in a self-consistent manner within a common framework.
We show first (Sects. 2, 3) that the true mass of the group can only be found if the dark energy is included in the procedure. Indeed, galaxies and their systems ``lose'' a part of their gravity due to the antigravity of the dark energy within their volumes. So, dynamical mass estimation should take into account this ``lost-gravity'' effect - otherwise the mass would be systematically underestimated. As a result, the value of the mass determined with the dynamical methods depends on the assumed value of the local density of the dark energy.
Secondly, we introduce in Sect. 4 a mass-density diagram for the local Hubble cell which displays this dependence explicitly. The HST data enable us to localize the area in the diagram which contains the allowed values of the local density of the dark energy density and the gravitating mass of the group. Significantly, the new approach is entirely independent of virial considerations or zero-velocity estimates. The Kahn-Woltjer model modified to include the dark energy and a simple model of the cell show the basis of the framework. In Sect. 5, we show that our discussion of the inner parts of the local Hubble cell is consistent with the observed outflow of the dwarf galaxies beyond the zero-gravity radius. Finally, in Sect. 6, we summarize the results and their significance for local and global cosmology. In the Appendix we consider the lost-gravity effect in the virial theorem and its significance for virial mass determination in groups and clusters of galaxies.
2 Modified Kahn-Woltjer (MKW) model
Fifty years ago, Kahn & Woltjer (1959) used a simple linear two
body dynamics to describe the relative motion of the Milky Way
(MW) and M 31 galaxies. The motion of the galaxies was described
(in the reference frame of the binary's center of mass) by the
equation of motion,
|
(2) |
where D is the distance between the galaxies and M is the total mass m1+m2 of the binary. In the well-known first integral,
|
(3) |
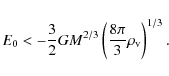
E0 is a constant total mechanical energy of the binary (per unit reduced mass). The energy is negative for a gravitationally bound system, E0 < 0. This inequality and Eq. (2) with the observed values D = 0.7 Mpc and
With a minimal modification of the original KW method, including
the dark energy (DE) background
![]() ,
the equation of motion
and its first integral become:
,
the equation of motion
and its first integral become:
|
(4) |
|
(5) |
Now the total energy for a bound system embedded in the DE background is
|
(6) |
This may be easily seen from the gravitational potential
The same data lead now to a larger value for the upper mass limit
as well:
![]() ,
assuming here
the time-scale of the collapse t0 > 7 Gyr (see also Fig. 1 where
the dependence of the mass limit on the collapse time is showed
for both original and modified models). It is motivated by the
global
,
assuming here
the time-scale of the collapse t0 > 7 Gyr (see also Fig. 1 where
the dependence of the mass limit on the collapse time is showed
for both original and modified models). It is motivated by the
global ![]() CDM cosmology: gravitational instability is
terminated in the linear regime about 7 Gyr ago with the start of
the DE dominated epoch (e.g. Chernin et al. 2003).
CDM cosmology: gravitational instability is
terminated in the linear regime about 7 Gyr ago with the start of
the DE dominated epoch (e.g. Chernin et al. 2003).
Our estimated range of masses assuming the globally determined dark energy
is
![]() to
to
![]() .
This range of values is similar to but smaller than the interval,
.
This range of values is similar to but smaller than the interval,
![]() ,
found in the
,
found in the ![]() CDM Millennium Simulation (Li & White 2008) and
a modern classical Kahn-Woltjer recalculation obtaining
CDM Millennium Simulation (Li & White 2008) and
a modern classical Kahn-Woltjer recalculation obtaining
![]() (Binney & Tremaine 2008) both of which assume
the global dark energy value.
(Binney & Tremaine 2008) both of which assume
the global dark energy value.
![\begin{figure}
\par\includegraphics[width=9cm,clip]{12762fig1.eps}
\end{figure}](/articles/aa/full_html/2009/45/aa12762-09/img37.png)
|
Figure 1:
The difference between the Local Group mass predictions from
the classical Kahn-Woltjer estimator (KW) and its modified form here
introduced (MKW). The x-axis gives the assumed look-back time of maximum separation and
the y-axis gives the calculated total mass of the Milky Way & M 31 binary.
The local DE density is assumed to be equal to the global value
|
| Open with DEXTER | |
These results demonstrate the effect of the lost gravity in
gravitationally bound systems embedded in the dark energy
background. The relative motion of the bodies is controlled by the
gravity (of dark matter and baryons) which is partly
counterbalanced by the dark energy antigravity. Consequently, the
mass estimate for dark matter and baryons must be corrected for dark energy. The
true mass of the system given by the modified Kahn-Woltjer (MKW)
estimator is larger than obtained
without dark energy![]() .
.
3 Zero-gravity radius
The local Hubble cell may be described by a simple model in which
the Local Group is represented by the MW-M 31 binary. This is an
interior component of the system. Its exterior component is the
expansion flow of neighboring dwarf galaxies whose total mass is at
least 100 times less than the mass of the central binary. In
the model, the flow can be viewed as an ensemble of receding
test particles moving in the gravitational potential of the binary and
the antigravity potential of the dark energy background. The
gravity-antigravity potential outside the binary becomes
practically spherical and static at distances >1.5 Mpc
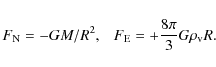
from the group barycenter (Fig. 2). Therefore, at distances R > 1.5 Mpc, the gravity force is given by Newton's inverse square law relative to the group barycenter. The
antigravity force produced by the dark energy density
![]() is
given by Einstein's linear law (e.g. Chernin 2001, 2008; Chernin
et al. 2006) in the same reference frame:
is
given by Einstein's linear law (e.g. Chernin 2001, 2008; Chernin
et al. 2006) in the same reference frame:
|
(7) |
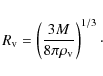
Gravity and antigravity are exactly balanced at the zero-gravity surface of the radius
|
(8) |
Antigravity dominates at
![\begin{figure}
\par\includegraphics[width=7.8cm,clip]{12762fig2.eps}
\end{figure}](/articles/aa/full_html/2009/45/aa12762-09/img48.png)
|
Figure 2:
Equipotential curves for the Milky Way-M 31 binary system,
showing their near-sphericity at distances >1.5 Mpc.
The LG mass
|
| Open with DEXTER | |
Conversely, if the zero-gravity radius is known from observations, the
mass of the group may be found as a function of the dark energy
density:
![\begin{displaymath}M = {\frac{8\pi}{3}} \rho_{\rm v} R_{\rm v}^{3} \simeq 0.9 \times 10^{12}
[R_{\rm v}/({\rm Mpc})]^{3}~M_{\odot}. \end{displaymath}](/articles/aa/full_html/2009/45/aa12762-09/img49.png)
|
(9) |
The position of the zero-gravity surface can be estimated from the observations of the local Hubble cell performed with the HST (Karachentsev 2005; Karachentsev et al. 2003-2009). There are sixty galaxies with good distances (8-10% accuracy) and velocities (5-10 km s-1 accuracy) in the cell volume. Nearly half of them plus the Milky Way and M 31 galaxies form the Local Group. In the Hubble diagram, they occupy distances to somewhat more than 1 Mpc. Their radial velocities (relative to the group barycenter) range from -150 to +150 km s-1. The other half of the observed galaxies (all dwarfs) recede from the group and have only positive velocities (Fig. 4). The minimal distance of outflowing galaxies is 1.2-1.6 Mpc from the group barycenter (Karachentsev 2005; Karachentsev et al. 2009). The flow of receding galaxies is rather regular, close to a linear velocity-distance relation. The flows velocity dispersion is about 25-30 km s-1 which is 2-3 times less than within the group, a radical difference.
The radical difference in the phase-space structure of the group
and the outflow around it is the most prominent feature of the
local Hubble cell. We have argued earlier (Chernin et al. 2000, 2006;
Chernin 2001; Teerikorpi et al. 2008) that the physics behind this
feature might be due to the interplay between the gravity of the
group and antigravity of the dark energy background, so that the
group size is less than ![]() and the flow starts at the
distances
and the flow starts at the
distances
![]() (as in the example above). Therefore the
zero-gravity surface is located somewhere in the gap between the
group and the outflow in the distance interval of 1.2-1.6 Mpc.
(as in the example above). Therefore the
zero-gravity surface is located somewhere in the gap between the
group and the outflow in the distance interval of 1.2-1.6 Mpc.
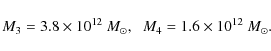
The double inequality
![]() Mpc and Eq. (8) lead to
lower and upper limits for the non-vacuum mass of the group,
M4
< M < M3, where
Mpc and Eq. (8) lead to
lower and upper limits for the non-vacuum mass of the group,
M4
< M < M3, where
|
(10) |
This result is quite compatible with the estimates obtained in Sect. 2 from the internal dynamics of the group binary.
Combining the four mass limits
M1, M2, M3, M4, we may give a
rather narrow interval for possible values of the Local Group
mass:
![]() .
The interval is
narrower than previously in the literature (see Sect. 1); it may be
somewhat broadened, if one takes into account the accuracy
of the estimation, about 20-30%.
.
The interval is
narrower than previously in the literature (see Sect. 1); it may be
somewhat broadened, if one takes into account the accuracy
of the estimation, about 20-30%.
4 Local density of dark energy
The results of Sects. 2, 3 for the group mass were obtained by taking
the local density of dark energy equal to
its global value
![]() measured on scales of
measured on scales of ![]() 1000 Mpc. This assumption is motivated by the standard
1000 Mpc. This assumption is motivated by the standard ![]() CDM
cosmology which views dark energy as a perfect fluid of
constant density everywhere. It is obviously important to
prove or disprove the assumption using only a local model and
local data.
CDM
cosmology which views dark energy as a perfect fluid of
constant density everywhere. It is obviously important to
prove or disprove the assumption using only a local model and
local data.
To do that, we develop further the approach of
Sects. 2, 3 and consider the four characteristic masses introduced there
as functions of the local density of dark energy
![]() .
It
is assumed to be uniform in space and constant in time, but may not be equal
to the global density
.
It
is assumed to be uniform in space and constant in time, but may not be equal
to the global density
![]() .
The functions
M1(x), M2(x),
M3(x), M4(x), where
.
The functions
M1(x), M2(x),
M3(x), M4(x), where
![]() ,
are shown in Fig. 3.
We see that the two masses M1(x) (which comes from the
binding condition for the MW-M 31 binary) and M2(x) (from the
timing argument) form a strip on the M vs. x plot,
which confines possible values of the group mass as a function of the
local density. Note that the mass values grow
with x - another sign of the lost-mass effect (Sects. 2-4).
,
are shown in Fig. 3.
We see that the two masses M1(x) (which comes from the
binding condition for the MW-M 31 binary) and M2(x) (from the
timing argument) form a strip on the M vs. x plot,
which confines possible values of the group mass as a function of the
local density. Note that the mass values grow
with x - another sign of the lost-mass effect (Sects. 2-4).
The strip is crossed by two beams
M3 = 3.8 x (the upper
limit to the zero-gravity radius) and
M4 = 1.6 x (the lower
limit to the radius); the unit of mass here is
![]() .
As a result, a closed elongated
area appears in the plot which contains all possible values of the
group mass. The mass proves to lie in the interval
.
As a result, a closed elongated
area appears in the plot which contains all possible values of the
group mass. The mass proves to lie in the interval
|
(11) |
This interval is considerably wider than that at x = 1 (see Sect. 3). The result agrees well (within the 20-30% accuracy) with the even wider interval
![\begin{figure}
\par\includegraphics[width=9cm,clip]{12762fig3.eps}
\end{figure}](/articles/aa/full_html/2009/45/aa12762-09/img57.png)
|
Figure 3:
The mass-DE density diagram for the local Hubble cell.
Here M (in units of
|
| Open with DEXTER | |
Beyond this straightforward mass range, with the same Fig. 3 plot one can find the permitted interval for the local dark energy density,
| (12) |
The interval includes the global value
The lower limit to the local density
![]() is of special
interest indicating that dark energy antigravity does indeed exist
on a local scale. The value of the lower limit is near
the value of the global density
is of special
interest indicating that dark energy antigravity does indeed exist
on a local scale. The value of the lower limit is near
the value of the global density
![]() .
Note that the lower
density limit follows from the equation
M1(x) = M3(x), so that
it is determined by the natural binding condition for the group
binary and the clear upper limit to the zero-gravity radius. It
does not depend on the timing argument for the group binary or the
lower limit to the zero-gravity radius.
.
Note that the lower
density limit follows from the equation
M1(x) = M3(x), so that
it is determined by the natural binding condition for the group
binary and the clear upper limit to the zero-gravity radius. It
does not depend on the timing argument for the group binary or the
lower limit to the zero-gravity radius.
5 Consistency with the outflow beyond R

Here we check whether the outflow of dwarf galaxies just beyond Rvis consistent with the relatively high mass of the Local Group suggested by the above discussion assuming the standard dark energy density in the concordance cosmological model.
Previously, we introduced the concept
of a normalized Hubble diagram, in order to study the kinematic structure
of a group and its surroundings (Teerikorpi et al. 2008) in the presence of
dark energy. If one fixes the mass of the group and the local dark energy density,
one can calculate the zero-gravity radius ![]() (Eq. (7)) and the
vacuum Hubble constant
(Eq. (7)) and the
vacuum Hubble constant
![]() .
Then in the representation with
.
Then in the representation with
![]() and
and
![]() as x- and y-axes, respectively, one may conveniently describe different dynamical regions of the system (see Fig. 1 in Teerikorpi et al. 2008). Beyond
as x- and y-axes, respectively, one may conveniently describe different dynamical regions of the system (see Fig. 1 in Teerikorpi et al. 2008). Beyond ![]() there is a minimum energy curve corresponding to the total mechanical energy
there is a minimum energy curve corresponding to the total mechanical energy
![]() .
Test particles ejected from the region of bound orbits (
.
Test particles ejected from the region of bound orbits (
![]() )
cannot appear below this curve.
)
cannot appear below this curve.
Here we note that the finite look-back time provides a stricter lower-limit
curve which can be parametrized in terms of the vacuum Hubble time
![]() .
The flight time from the center of the group to the normalized distance
.
The flight time from the center of the group to the normalized distance
![]() ,
for a particle with energy
,
for a particle with energy
![]() is
is
while the normalized velocity y is related to x as
|
(14) |
Evidently, only such x-values and corresponding energies
![\begin{figure}
\par\includegraphics[width=9cm,clip]{12762fig4.eps}
\end{figure}](/articles/aa/full_html/2009/45/aa12762-09/img71.png)
|
Figure 4:
The distance-velocity diagram for the Local Group and its near
environment. The curves give outflow, for Local Group masses 2, 4 (the
thick
line), and
|
| Open with DEXTER | |
Using
x0 = 0.001 in the above integral we have calculated
the predicted velocities for different present positions for the standard ![]() model,
with t = 13.7 Gyr and
model,
with t = 13.7 Gyr and
![]() Gyr, for different values of the LG mass. We show these
curves in Fig. 4. One sees that
Gyr, for different values of the LG mass. We show these
curves in Fig. 4. One sees that
![]() puts the
Hubble curve too high, and
puts the
Hubble curve too high, and
![]() too low,
while
too low,
while
![]() provides an admissible fit.
If the flight time is made shorter (it cannot be longer than the universe model),
the curves move up, meaning a still larger mass.
Examining the curves versus the data points, the masses estimated from the outflowing dwarfs
are also consistent with those in Sects. 2-4,
which used the inner parts of the Local Group system.
provides an admissible fit.
If the flight time is made shorter (it cannot be longer than the universe model),
the curves move up, meaning a still larger mass.
Examining the curves versus the data points, the masses estimated from the outflowing dwarfs
are also consistent with those in Sects. 2-4,
which used the inner parts of the Local Group system.
We shall discuss the predicted outflow beyond ![]() in more detail and for different models
in a separate study.
in more detail and for different models
in a separate study.
6 Discussion and conclusions
The local volume proves to be a productive area for the studies
of dark matter and dark energy (e.g. Chernin 2001, 2008; Ekholm et al.
2001; Baryshev et al. 2001; Byrd et al. 2007; Niemi et al. 2007;
Teerikorpi et al. 2008).
Study of the Local Group enables one to learn not only the mass in the
system, but simultaneusly, the local density of the dark energy itself.
Generally, the mass of a galaxy group determined using dynamical
methods (like
the zero-gravity radius, the zero-velocity
radius & the nearby Hubble flow, the Kahn-Woltjer method and also
the virial mass - see the Appendix) becomes higher when the
``lost-gravity'' effect of the dark energy is taken into account.
We derived the total mass of the Local Group to lie within
![]() ,
while the local dark energy density lies within
,
while the local dark energy density lies within
![]() (
(
![]() is the global density value). Indeed, the main result of this paper is
our new estimate of the local density of the dark energy on a scale of
is the global density value). Indeed, the main result of this paper is
our new estimate of the local density of the dark energy on a scale of ![]() 1 Mpc.
The estimated range of values encompasses the global value which
supports the validity of the cosmological constant formulation. The
lower limit is only about 20% less than the global density dark energy
value - impressive considering that the two values are measured with
quite different methods on scales differing by a factor of 1000.
1 Mpc.
The estimated range of values encompasses the global value which
supports the validity of the cosmological constant formulation. The
lower limit is only about 20% less than the global density dark energy
value - impressive considering that the two values are measured with
quite different methods on scales differing by a factor of 1000.
In our approach, we use the concept of the local Hubble cell as an isolated physical system with a two-component structure. The components are drastically different: the gravitationally bound Local Group dominated by the MW-M 31 binary and the surrounding cool local Hubble flow. The difference is due to the interplay between the gravity produced by the dark (and baryonic) matter of the Local Group and the antigravity from the DE background in a local volume only about 6 Mpc across. The bound group with a high velocity dispersion is located within the zero-gravity surface, while the low-dispersion expansion flow is found outside the surface, where antigravity dominates and dwarf galaxies move away from the group with acceleration. In this sense, the local dynamics reproduces (in one billionth of observed space) the global dynamics of the cosmological expansion. Our analysis indicates that the local and global antigravity effects are due to, most probably, the same agent - dark energy of the same density. The fact that the range of local density values encompasses the global density is strong new evidence for the cosmological constant formulation.
AcknowledgementsWe thank A. Cherepashchuk, Yu. Efremov, I. Karachentsev, A. Silbergleit and A. Zasov for discussions. We also thank the anonymous referee for useful suggestions which improved the presentation.
Appendix A: The ``lost-gravity'' effect in the virial theorem
The conventional virial theorem needs an extra term due to the contribution of the particle-dark energy interaction to the total potential energy, for systems embedded in the dark energy background. This extra term has been pointed out and used in some applications (Lahav et al. 1991; Horellou & Berge 2005; see also Bertolami et al. 2007). Here we discuss in some detail the derivation of the modified virial theorem and show how it leads to a correction upwards for the mass estimates. How significant can this correction be?
Virial theorem
estimators use the relation between the mean total kinetic
![]() and potential
and potential
![]() energies of a quasi-stationary gravitationally
bound many-body system:
energies of a quasi-stationary gravitationally
bound many-body system:
![]() .
In the presence of dark
energy, the total potential energy includes
not only the sum U1 of the mutual potential energies of its
member particles, but also the sum U2 of the potential energies
of the same particles in the force field of dark energy:
.
In the presence of dark
energy, the total potential energy includes
not only the sum U1 of the mutual potential energies of its
member particles, but also the sum U2 of the potential energies
of the same particles in the force field of dark energy:
Here
A link to the kinetic energy is provided by the equation of motion
of an individual particle:
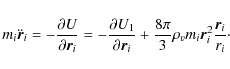
Averaging over time and using the Euler theorem on homogeneous functions (applied separately to the two functions that come from the two terms in the right side of Eq. (A.2)), we find
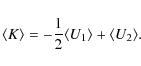
This is the modified virial relation adapted to the universe with the dark energy background include in the second term above. Now we ask how much the inclusion of the dark energy influences the usual virial mass estimates.
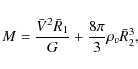
Equation (A.3) may be rewritten in terms of the total mass M, a
characteristic velocity ![]() and characteristic sizes
and characteristic sizes
![]() :
:
or in convenient units:
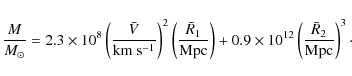
This new mass estimator - from the modified virial theorem - includes an additional positive term. It is equal to the absolute value of the effective (anti)gravitating mass of dark energy contained in the spherical volume of radius R2:
Equations (A.4) and (A.5) can be calculated with representative values of
the characteristic sizes
![]() and velocity
and velocity ![]() .
In the simple example of only one body orbiting a
gravitating mass M, the size
.
In the simple example of only one body orbiting a
gravitating mass M, the size
![]() is the
radius of curvature of the orbit and the velocity
is the
radius of curvature of the orbit and the velocity ![]() is the
orbital velocity.
A similar
identification of the quantities is obvious when the
mass of a galaxy is derived from its rotation curve. In both
cases, the estimated mass is larger than that in conventional
estimations. The additional mass is
is the
orbital velocity.
A similar
identification of the quantities is obvious when the
mass of a galaxy is derived from its rotation curve. In both
cases, the estimated mass is larger than that in conventional
estimations. The additional mass is
![]() .
.
Generally, the characteristic sizes and velocities for groups and
clusters need more sophisticated analysis than the above - even in the absence of
dark energy (e.g. Peebles 1971). The first (conventional) term in
Eq. (A.5) is estimated for the Local Group as
![]() (van den Bergh 1999) or
(van den Bergh 1999) or
![]() (Karachentsev 2005, Karachentsev et al. 2009). Then the second
term in Eq. (A.5) contributes from 30 to 50% of the total mass, if
the total size
(Karachentsev 2005, Karachentsev et al. 2009). Then the second
term in Eq. (A.5) contributes from 30 to 50% of the total mass, if
the total size ![]() is about 1 Mpc. Assuming
is about 1 Mpc. Assuming
![]() ,
one may see that the relative contribution of the dark
energy scales as thecrossing time squared
,
one may see that the relative contribution of the dark
energy scales as thecrossing time squared
![]() .
In that case the lost-gravity effect is 10-30 times larger in a group like
the Local Group than in a rich cluster like the Coma cluster.
.
In that case the lost-gravity effect is 10-30 times larger in a group like
the Local Group than in a rich cluster like the Coma cluster.
A study of the lost-gravity effect in groups in general is complicated by the fact that in existing group catalogues, the virial masses tend to be overestimated for other reasons (Niemi et al. 2007). We will discuss this in detail elsewhere.
References
- Baryshev, Yu. V., Chernin, A. D., & Teerikorpi, P. 2001, A&A, 378, 729 [NASA ADS] [CrossRef] [EDP Sciences]
- Bertolami, O., Pedro, G., & Le Delliou, M. 2007, Phys. Lett. B, 654, 165 [NASA ADS] [CrossRef]
- Binney, J., & Tremaine, S. 2008, Galactic Dynamics, 2nd edition (Princeton and Oxford: Princeton University Press)
- Byrd, G. G., Chernin A. D., & Valtonen M. J. 2007, Cosmology: Foundations and Frontiers (Moscow: Editorial URSS)
- Chernin, A. D. 2001, Physics-Uspekhi, 44, 1099 [NASA ADS] [CrossRef]
- Chernin, A. D. 2008, Physics-Uspekhi, 51, 253 [NASA ADS] [CrossRef]
- Chernin, A. D., Teerikorpi, P., & Baryshev, Yu. V. 2000, Adv. Space Res., 31, 459 [NASA ADS] [CrossRef], 2003
- Chernin, A. D., Nagirner, D. I., & Starikova, S. V. 2003, A&A, 399, 19 [NASA ADS] [CrossRef] [EDP Sciences]
- Chernin, A. D., Karachentsev I. D., Valtonen M. J. et al. 2004, A&A, 415, 19 [NASA ADS] [CrossRef] [EDP Sciences]
- Chernin, A., Teerikorpi, P., & Baryshev, Yu. 2006, A&A, 456, 13 [NASA ADS] [CrossRef] [EDP Sciences]
- Dolgachev, V. P., Domozhilova, L. M., & Chernin, A. D. 2003, Astr. Rep., 47, 728 [NASA ADS] [CrossRef]
- Einasto, J., & Lynden-Bell, D. 1982, MNRAS, 199, 67 [NASA ADS]
- Ekholm, T., Baryshev, Yu., Teerikorpi, P., Hanski, M., & Paturel, G. 2001, A&A, 368, L17 [NASA ADS] [CrossRef] [EDP Sciences]
- Gromov, A., Baryshev, Yu., Suson, D., & Teerikorpi, P. 2001, Gravitation & Cosmology, 7, 140 [NASA ADS]
- Horellou, C., & Berge, J. 2005, MNRAS, 360, 1393 [NASA ADS] [CrossRef]
- Kahn, F. D., & Woltjer, L. 1959, ApJ, 130, 705 [NASA ADS] [CrossRef]
- Karachentsev, I. D. 2005, AJ, 129, 178 [NASA ADS] [CrossRef]
- Karachentsev, I. D., Makarov, D. I., Sharina, M. E., et al. 2003, A&A, 398, 479 [NASA ADS] [CrossRef] [EDP Sciences]
- Karachentsev, I. D., Karachentseva, V. E., Huchtmeier, W. K., & Makarov, D. I. 2004, AJ, 127, 2031 [NASA ADS] [CrossRef]
- Karachentsev, I. D., Kashibadze, O. G., Makarov, D. I., & Tully, R. B. 2009, MNRAS, 393, 1265 [NASA ADS] [CrossRef]
- Lahav, O., Lilje, P. B., Primack, J. R., & Rees M. J. 1991, MNRAS, 251, 128 [NASA ADS]
- Li, Y.-S., & White, S. M. D. 2008, MNRAS, 384, 1459 [NASA ADS] [CrossRef]
- Macciò, A. V., Governato, F., & Horellou, C. 2005, MNRAS, 359, 941 [NASA ADS] [CrossRef]
- Niemi, S.-M., Nurmi, P., Heinämäki, P., & Valtonen M. J. 2007, MNRAS, 382, 1864 [NASA ADS]
- Peebles, P. J. E. 1971, Physical Cosmology (New-Jersey: Princeton Univ. Press)
- Peirani, S., & de Freitas Pacheco, J. A. 2006, New Ast., 11, 325 [NASA ADS] [CrossRef]
- Peirani, S., & de Freitas Pacheco, J. A. 2008, A&A, 488, 845 [NASA ADS] [CrossRef] [EDP Sciences]
- Perlmutter, S., Aldering, G., Goldhaber, G., et al. 1999, ApJ, 517, 565 [NASA ADS] [CrossRef]
- Riess, A. G., Filippenko, A. V., Challis P., et al. 1998, AJ, 116, 1009 [NASA ADS] [CrossRef]
- Spergel, D. N., Bean, R., Doré, O., et al. 2007, ApJS, 170, 377 [NASA ADS] [CrossRef]
- Teerikorpi, P., Chernin, A. D., Karachentsev, I. D., & Valtonen, M. J. 2008, A&A, 483, 383 [NASA ADS] [CrossRef] [EDP Sciences]
- Valtonen, M. J., Byrd, G. G., McCall, M. L., & Innanen, K. A. 1993, AJ, 105, 886 [NASA ADS] [CrossRef]
- van den Bergh, S. 1999, A&ARv, 9, 273 [NASA ADS]
Footnotes
- ... energy
![[*]](/icons/foot_motif.png)
- The linear binary model for the relative motion of the Milky Way and M 31 galaxies is an idealization. The real dynamics of the Local Group must be more complex (see Einasto & Lynden-Bell 1982; and especially Valtonen et al. 1993). In particular, a transverse velocity might increase the mass value, but not more than by 10-15%. The earlier dynamical history of the binary (not saying about its formation) can hardly be described by this model. This process needs more studies, and the cosmological computer N-body simulations are a real tool to clarify the matter - see Li & White (2008) and Macció et al. (2005).
All Figures
|
|
Figure 1:
The difference between the Local Group mass predictions from
the classical Kahn-Woltjer estimator (KW) and its modified form here
introduced (MKW). The x-axis gives the assumed look-back time of maximum separation and
the y-axis gives the calculated total mass of the Milky Way & M 31 binary.
The local DE density is assumed to be equal to the global value
|
| Open with DEXTER | |
| In the text | |
|
|
Figure 2:
Equipotential curves for the Milky Way-M 31 binary system,
showing their near-sphericity at distances >1.5 Mpc.
The LG mass
|
| Open with DEXTER | |
| In the text | |
|
|
Figure 3:
The mass-DE density diagram for the local Hubble cell.
Here M (in units of
|
| Open with DEXTER | |
| In the text | |
|
|
Figure 4:
The distance-velocity diagram for the Local Group and its near
environment. The curves give outflow, for Local Group masses 2, 4 (the
thick
line), and
|
| Open with DEXTER | |
| In the text | |
Copyright ESO 2009
Current usage metrics show cumulative count of Article Views (full-text article views including HTML views, PDF and ePub downloads, according to the available data) and Abstracts Views on Vision4Press platform.
Data correspond to usage on the plateform after 2015. The current usage metrics is available 48-96 hours after online publication and is updated daily on week days.
Initial download of the metrics may take a while.