| Issue |
A&A
Volume 507, Number 2, November IV 2009
|
|
|---|---|---|
| Page(s) | 639 - 659 | |
| Section | Cosmology (including clusters of galaxies) | |
| DOI | https://doi.org/10.1051/0004-6361/200912465 | |
| Published online | 24 September 2009 | |
A&A 507, 639-659 (2009)
Radio spectral study of the cluster of galaxies Abell 2255
R. F. Pizzo1 - A. G. de Bruyn1,2
1 - Kapteyn Institute, Postbus 800, 9700 AV Groningen, The Netherlands
2 - ASTRON, Postbus 2, 7990 AA Dwingeloo, The Netherlands
Received 11 May 2009 / Accepted 31 August 2009
Abstract
Context. The study of the nonthermal components
associated with the intra cluster medium (ICM) in galaxy
clusters is important in understanding the history and evolution of
clusters.
Aims. Spectral index studies of halos, relics, and
radio galaxies provide useful information on their origin and
connection with merger processes. Moreover, they reveal the
energy spectrum of the relativistic particles and the magnetic
field distribution in galaxy clusters.
Methods. We present WSRT multi-wavelength
observations of the galaxy cluster Abell 2255 at 25 cm,
85 cm, and 2 m. The spectral index images
allowed us to study the integrated spectrum of halo and relic and to
investigate the physical properties of the Beaver head-tail radio
galaxy belonging to the cluster.
Results. In the radio halo, the spectral index is
steeper at the center and flatter at the locations of the radio
filaments, clearly detected at 25 cm. In the relics,
the spectral index flattens, moving away from the cluster center. For
the Beaver radio galaxy, the spectrum severely steepens from the head
towards the end of the tail, because of the energy losses suffered by
the relativistic particles. In the 2 m map, which is
the first high-sensitivity image presented in the literature at such a
long wavelength, a new Mpc-size emission region is detected between the
known radio halo and the NW relic. Not detecting this feature in
the more sensitive 85 cm observations implies that
it must have a very steep spectrum (
![]() ).
).
Conclusions. The observational properties of the
radio halo suggest that either we are looking at a superposition of
different structures (filaments in the foreground plus real halo in the
background) seen in projection across the cluster center or that the
halo is intrinsically peculiar. The newly detected extended region to
the NW of the halo could be considered as an asymmetric extension of
the halo itself. However, since radio halos are known in the literature
as structures showing a regular morphology, the new feature
could represent the first example of steep Mpc-size diffuse structures
(MDS), detected around clusters at very low frequencies. The spectrum
of the initial part of the tail of the Beaver, detected at the three
wavelengths, is well-fitted by a single injection model.
Key words: galaxies: clusters: general - galaxies: clusters: individual: Abell 2255 - galaxies: intergalactic medium
1 Introduction
Galaxy clusters, which contains up to a few thousand galaxies and considerable amounts of gas, are the most massive gravitationally bound objects in the universe. Cosmological simulations (Navarro et al. 1995) show that they are not static, but instead grow and still form at the present epoch, as the result of several merger events (e.g. Evrard & Gioia 2002).
In an increasing number of massive, merging,
and X-ray luminous galaxy
clusters, large diffuse radio sources associated with the ICM have been
detected. They represent the most spectacular aspect of
cluster radio
emission, and they cannot be associated with any individual galaxy.
These
diffuse synchrotron radio sources are characterized by a typical size
of about 1 Mpc, low surface brightness (![]() 1
1 ![]() Jy arcsec-2
at 20 cm), and
steep radio spectrum (
Jy arcsec-2
at 20 cm), and
steep radio spectrum (
![]() ,
,
![]() ).
They are classified (Feretti &
Giovannini 1996) as radio halos, if
located at the center of the cluster and not significantly polarized,
and radio relics, if lying at the cluster
periphery and showing high
polarization percentages (
).
They are classified (Feretti &
Giovannini 1996) as radio halos, if
located at the center of the cluster and not significantly polarized,
and radio relics, if lying at the cluster
periphery and showing high
polarization percentages (![]() 10%-30%).
The synchrotron nature of their
radio emission indicates cluster-wide magnetic fields of
approximately 0.1-1
10%-30%).
The synchrotron nature of their
radio emission indicates cluster-wide magnetic fields of
approximately 0.1-1 ![]() G,
and of a population of relativistic electrons with Lorentz factor
G,
and of a population of relativistic electrons with Lorentz factor
![]() .
.
The knowledge of the physical conditions in halos and relics is important for a comprehensive physical description of the ICM. Since they are related to other cluster properties in the optical and X-ray domains, these extended features are directly connected to the cluster history and evolution. Moreover, they provide a significant test for several theories concerning the origin of relativistic particles in the ICM and particle propagation in astrophysical plasmas.
The origin of halos and relics is still matter of debate. It is suggested that relics relics are related to shocks either by Fermi-I diffuse acceleration of ICM electrons (Enßlin et al. 1998; Keshet et al. 2004b) or by adiabatic energization of the relativistic electrons confined in fossil radio plasma (``ghosts''), released by a former active radio galaxy (Enßlin & Gopal-Krishna 2001). In the case of radio halos, it is required that the electrons are either re-accelerated (primary models: e.g. Brunetti et al. 2001; Tribble 1993; Fujita et al. 2003; Cassano & Brunetti 2005; Brunetti et al. 2004; Petrosian 2001) or continuously injected over the entire cluster volume by hadronic collisions (secondary models: e.g. Dolag & Enßlin 2000; Dennison 1980; Blasi & Colafrancesco 1999).
Spectral index studies of halos and relics provide important information on their formation and their connection to cluster merger processes. Given their large angular size and steep spectra, low-frequency radio observations are suitable for such investigations. There are only a few clusters for which spectral index maps of halos have been published: Coma (Giovannini et al. 1993), A2163, A665 (Feretti et al. 2004), A3562 (Giacintucci et al. 2005), A2744, and A2219 (Orrú et al. 2007). In agreement with primary models, in all these objects the spectral index maps show a patchy structure with, in some cases, a steepening of the spectrum with increasing distance from the center to the edge. The detailed spectral index distribution is known for the relics of A3667 (Rottgering et al. 1997), the Coma cluster (Giovannini et al. 1991), S753 (Subrahmanyan et al. 2003), A2744 and A2219 (Orrú et al. 2007), and A2345 and A1240 (Bonafede et al. 2009). Apart from one of the two relics of A2345, in all the other examples the spectral index flattens going from the regions closer to the cluster center to the outer rim. This is consistent with the presence of electron re-acceleration in an expanding merger shock.
Other important members of clusters in the radio domain are the radio galaxies. Their emission often extends well beyond the optical boundaries of the radio galaxies, out to hundreds of kilo-parsec, and hence it is expected that the ICM would affect their structure. This interaction is proved by the existence of radio galaxies showing distorted structures (tailed radio sources). Spectral studies of radio galaxies with different morphologies at different frequencies provide an excellent opportunity to test the ageing of the electrons, under some standard assumptions.
A2255 is a nearby (z=0.0806, Struble & Rood 1999) and
rich cluster, which has
been studied in several bands. ROSAT X-ray
observations indicate that
A2255 has recently undergone a merger (Feretti et al. 1997; Burns
et al. 1995; Davis et al. 2003). Recent
XMM-Newton observations revealed temperature
asymmetries of the ICM
suggesting that the merger happened ![]() 0.15 Gyr ago,
probably along the
E-W direction (Sakelliou & Ponman 2006).
Optical studies of A2255 revealed the
presence of kinematic substructures in the form of several associated
groups
(Yuan et al. 2003).
This result, together with the large ratio of velocity
dispersion to X-ray temperature (6.3 keV; Horner
2001) indicates a
non-relaxed system.
0.15 Gyr ago,
probably along the
E-W direction (Sakelliou & Ponman 2006).
Optical studies of A2255 revealed the
presence of kinematic substructures in the form of several associated
groups
(Yuan et al. 2003).
This result, together with the large ratio of velocity
dispersion to X-ray temperature (6.3 keV; Horner
2001) indicates a
non-relaxed system.
When studied at radio wavelengths, A2255 shows the
presence of a diffuse radio halo (located at the center of the cluster)
and of
a relic (at the cluster periphery), together with a large number of
embedded
head-tail radio galaxies (Harris
et al. 1980). High resolution radio observations at
21 cm shown that the radio halo has a rectangular shape and a
surface
brightness increasing from the center to the edge (Feretti
et al. 1997). At this
location 3 highly polarized (![]() 20%-40%)
bright filaments perpendicular
to each other are detected (Govoni
et al. 2005). Sensitive low-frequency observations
carried out with the Westerbork synthesis radio telescope (WSRT) at
85 cm
proved the presence of a large number of low-surface brightness
extended
features around the cluster, that are likely related to Large Scale
Structure
(LSS) shocks (Pizzo
et al. 2008). In this work we combine these data
with observations at 25 cm and at 2m in order to study the
spectral index
properties of the structures belonging to A2255.
20%-40%)
bright filaments perpendicular
to each other are detected (Govoni
et al. 2005). Sensitive low-frequency observations
carried out with the Westerbork synthesis radio telescope (WSRT) at
85 cm
proved the presence of a large number of low-surface brightness
extended
features around the cluster, that are likely related to Large Scale
Structure
(LSS) shocks (Pizzo
et al. 2008). In this work we combine these data
with observations at 25 cm and at 2m in order to study the
spectral index
properties of the structures belonging to A2255.
This paper is organized as follows. Section 1 describes the main steps of the data reduction and discusses a few issues related to low-frequency radio observations. In Sect. 3, we present the final maps of A2255 at the three wavelengths and in Sect. 4 we show the spectral index analysis for the halo and the relics. In Sect. 5, we analyze the physical properties of the Beaver radio galaxy and we test the ageing processes of the radiating electrons along the tail. We discuss the implications of our results in Sect. 6 and summarize our work in Sect. 7.
Throughout this paper we assume a ![]() cosmology with H0
= 71 km s-1 Mpc-1,
cosmology with H0
= 71 km s-1 Mpc-1,
![]() ,
and
,
and ![]() .
All
positions are given in J2000 coordinates. The resolutions are expressed
in RA
.
All
positions are given in J2000 coordinates. The resolutions are expressed
in RA ![]() Dec.
At the distance of A2255, 1' corresponds
to 90 kpc.
Dec.
At the distance of A2255, 1' corresponds
to 90 kpc.
2 Observations and data reduction
The observations were carried out with the WSRT in three broad frequency ranges with central wavelengths of about 25 cm, 85 cm, and 2 m. The array consists of fourteen 25 m dishes on an east-west baseline and uses earth rotation to fully synthesize the uv-plane. Ten of the telescopes are on fixed mountings, 144 m apart; the four remaining dishes are movable along two rail tracks. The interferometer can observe in different configurations that differ from each other in the distance between the last fixed telescope and the first movable one (RT9-RTA). In the array, the baselines can extend from 36 m to 2.7 km. At the high declination of A2255 the array does not suffer from shadowing.
The pointing center of the telescope, as well as the phase
center of the
array, was directed towards
![]() ,
,
![]() ,
which is the center of A2255. The time sampling
is 30 s in the 25 cm and 85 cm
datasets, and 10 s for the 2 m observations. This is
generally sufficient to
sample the phase fluctuations of the ionosphere and to avoid the
smearing of
sources at the outer edge of the field. During each observation, two
pairs of
calibrators, one polarized and one unpolarized, have been observed for
30 min each. Table 2
summarizes the observational
parameters.
,
which is the center of A2255. The time sampling
is 30 s in the 25 cm and 85 cm
datasets, and 10 s for the 2 m observations. This is
generally sufficient to
sample the phase fluctuations of the ionosphere and to avoid the
smearing of
sources at the outer edge of the field. During each observation, two
pairs of
calibrators, one polarized and one unpolarized, have been observed for
30 min each. Table 2
summarizes the observational
parameters.
The technical details about the datasets will be discussed in the next sub sections. Here we give a short overview about the main steps taken for the data reduction. The data were processed with the WSRT-tailored NEWSTAR reduction package following mostly standard procedures: automatic interference flagging, self calibration, fast Fourier transform imaging, and CLEAN deconvolution (Högbom 1974). Further flagging based on the residual data after self calibration and model subtraction was done after each self calibration iteration. An on-line Hamming taper was used to lower the distant spectral side lobe level (Harris 1978). The final analysis was done using only the odd channels, because each Hamming tapered output channel is a linear combination of its direct neighbors and itself.
At 85 cm and 2 m, the data were
flux-calibrated using 3C 295, for
which we adopted a flux of 63 Jy
and 95 Jy at central frequencies of 346 MHz
and 148 MHz, respectively. At 25 cm the flux
scales have been set using the
flux calibrator CTD93, for which we adopted a flux of 5.2 Jy
at 1220 MHz. The
flux scale at 2 m is still uncertain to a level that we
estimate of 5% and 1% at 25 cm and 85 cm. We
computed the flux densities of the calibrators
across the entire bands assuming a spectral index of
![]() and
and
![]() for CTD93 and 3C 295
respectively (see Table 1).
for CTD93 and 3C 295
respectively (see Table 1).
Table 1: The flux calibrators used during the data reduction.
Table 2: Observations overview.
2.1 25 cm dataset
At 25 cm, we observed A2255 for
![]() h
with 4 different
configurations of the WSRT. By stepping the 4 movable
telescopes at 18 m increments, from 36 m to
90 m, we pushed the grating lobe due to
the regular 18 m baseline increment to a radius of
h
with 4 different
configurations of the WSRT. By stepping the 4 movable
telescopes at 18 m increments, from 36 m to
90 m, we pushed the grating lobe due to
the regular 18 m baseline increment to a radius of ![]() 1
1![]() .
.
At this wavelength, the receiving band is divided into 8 contiguous slightly overlapping sub-bands of 20 MHz centered at 1169, 1186, 1203, 1220, 1237, 1254, 1271, and 1288 MHz. Each sub-band is covered by 64 channels in 4 cross-correlations to recover all Stokes parameters.
Because of limitations of the software in handling files
larger than
2.15 GB, the data reduction was done for each frequency band
independently. Thus, the original dataset has been split in 8
sub-datasets, each containing the ![]() h of data, but just
in one frequency band.
h of data, but just
in one frequency band.
Because of strong RFI, 2 out of the original 8 frequency
sub-bands
have not been used for imaging. Moreover, the presence of a strong
off-axis source caused phase errors affecting the central field of the
final image. The peeling procedure that we used to solve for those
problems was successful only in the lower 3 frequency bands,
where the
problematic source is brighter (see Sect. 2.2).
Therefore, the total amount of data that we could use for imaging
was ![]() 35%. At
25 cm, the resolution is
35%. At
25 cm, the resolution is
![]() .
.
2.2 Off-axis errors in 25 cm maps
High dynamic range imaging is seriously limited by the phase stability
of the atmosphere (troposphere and ionosphere), which causes the
presence of spiky patterns surrounding the brightest off-axis sources
within the field of view of the interferometer. This pattern is due to
the instantaneous fan beam response of the WSRT, which rotates
clockwise from position angle ![]() to
to
![]() during the 12 h
synthesis time.
during the 12 h
synthesis time.
The selfcal algorithm tries to minimize the time variations between data and the model of the sky, applying only one averaged time-dependent correction in the uv plane. If in the field of view there are bright off-axis sources that seem to move during the observation, due to differential tropospheric refraction or rapid ionospheric phase instabilities, the selfcal will not be able to correct simultaneously for the phase errors associated with them. Thus, the final map will show artefacts around the sources, as secondary lobes, or in the source itself, which will appear distorted. The only way to remove the off-axis errors in the maps is to ``peel'' each problematic source out of the dataset, using its own direction-dependent selfcal corrections. This technique has been recently developed to solve for the ionospheric phase disturbances in low-frequency observations (e.g. Intema 2007; Cotton et al. 2004), but it can be also applied at higher frequencies, when phase errors due to the differential tropospheric effects are also present in high dynamic range images.
The peeling scheme involves self calibration on individual bright sources. It produces phase corrections per array element for several viewing directions, repeatedly using the following recipe:
- subtraction of all but the brightest source from UV data, using the best model and calibration available;
- several rounds of phase only self calibration and imaging on the brightest source;
- subtraction of the brightest source from the original UV data, using model and calibration from the previous step.
The peeling procedure has been applied in each of the 6 frequency bands we could use at 25 cm (Sect. 2.1). Unfortunately, it turned out to be satisfactory just for the three lower frequency bands, where the selfcal corrections for the steep spectrum 4C +64.21 can be better determined, given the higher signal to noise ratio of the data. Thus, we decided to use only these 3 frequency bands to make the final image for the further analysis.
![\begin{figure}
\par\includegraphics[angle=270,width=8.3cm,clip]{124651a.eps}\hspace*{4mm}
\includegraphics[angle=270,width=8.3cm,clip]{124651b.eps}
\end{figure}](/articles/aa/full_html/2009/44/aa12465-09/img32.png)
|
Figure 1:
Grey scale images of 4C +64.21 at 25 cm before (
left panel) and after ( right panel)
applying the peeling procedure. The resolution is
|
| Open with DEXTER | |
2.3 85 cm dataset
To fully image the primary beam, six array configurations were used for the observations, with the four movable telescopes stepped at 12 m increments (i.e. half the dish diameter) and the shortest spacing running from 36 m to 96 m. This provides continuous uv-coverage with interferometer baselines ranging from 36 m to 2760 m.
The receiving band is covered by 8 sub-bands of
10 MHz centered at 315, 324,
332, 341, 350, 359, 367, and 376 MHz. Each sub-band is covered
by 128 channels
in 4 cross-correlations to recover all Stokes parameters. The
85 cm dataset
was split in 16 sub-datasets, each containing
![]() h
of
observation, but in one frequency half-band only.
h
of
observation, but in one frequency half-band only.
The imaging was done using 5 out of the 6 nights of
observation, because of
the poor phase stability of the ionosphere during the third night
(RT9-RTA =
60 m). The total amount of flagged data was ![]() 25%. At
85 cm
wavelength, the resolution is
25%. At
85 cm
wavelength, the resolution is
![]() .
.
2.4 2 m dataset (LFFE-band observations)
At 2 m, A2255 was observed for
![]() h
to fully image the primary
beam.
h
to fully image the primary
beam.
The LFFE (Low-Frequency Front End) at the WSRT is covered by 8 frequency sub-bands of 2.5 MHz centered at 116, 121, 129, 139, 141, 146, 156, and 162 MHz. Each sub-band is divided in 512 channels.
Given the large size of the final dataset (![]() 250 GB)
and the limitations
in the maximum size of a NEWSTAR dataset, the observations
have been split in
240 sub-datasets, each containing data for a single night of
observation and
with a limited number of channels. Therefore, for a single spacing and
for
each sub-band, we worked with 5 datasets. To produce the
final map, we
processed the 240 sub datasets separately, self calibrating them with
different models and doing the imaging and the deconvolution
steps 240 times.
We did not obtain a good image through the normal selfcal procedure.
The best
image has been obtained using a simplified self calibration where we
only
solved for the phase slope across the array. In this case, only the
phases
were self calibrated. At the end, the images were combined, weighting
them for
the input number of visibilities.
250 GB)
and the limitations
in the maximum size of a NEWSTAR dataset, the observations
have been split in
240 sub-datasets, each containing data for a single night of
observation and
with a limited number of channels. Therefore, for a single spacing and
for
each sub-band, we worked with 5 datasets. To produce the
final map, we
processed the 240 sub datasets separately, self calibrating them with
different models and doing the imaging and the deconvolution
steps 240 times.
We did not obtain a good image through the normal selfcal procedure.
The best
image has been obtained using a simplified self calibration where we
only
solved for the phase slope across the array. In this case, only the
phases
were self calibrated. At the end, the images were combined, weighting
them for
the input number of visibilities.
Due to serious problems with the correlators of the WSRT
during the night
between the 17th July and the 18th July 2007
(RT9-RTA = 60 m), the final data
reduction was done using ![]() h
of observation. Moreover, given
serious ionospheric instabilities during the last night of observations
(RT9-RTA = 96 m), we decided to not include this 12 hours run
in imaging.
The total amount of flagged data was
h
of observation. Moreover, given
serious ionospheric instabilities during the last night of observations
(RT9-RTA = 96 m), we decided to not include this 12 hours run
in imaging.
The total amount of flagged data was ![]() 35%. At 2 m, the
resolution is
35%. At 2 m, the
resolution is
![]() .
.
2.5 A few issues related to low-frequency observations
The low-frequency radio sky is very bright and populated by strong radio sources, such as Cas A, Cyg A, Vir A and Tau A, whose flux densities vary from 1000-10 000 Jy. Even far from the field center, the (relatively) high distant sidelobe levels of the primary beam (``only'' -30 to -40 dB) keeps these sources very bright, giving rise to significant side lobes in the final images. Solar flares can also affect the data, causing interferences in the short baselines and/or grating rings in the imaged central field.
During the editing and imaging processes at low frequency, we
had to take care
of Cas A, Cyg A and the Sun. Cas A lies at a
projected distance of ![]()
![]() from the cluster,
Cyg A at
from the cluster,
Cyg A at ![]()
![]() and the Sun at
and the Sun at ![]()
![]() .
At 85 cm and at 2 m, we used
models of Cas A and Cyg A and we subtracted them from
the data during
imaging. To remove the interferences generated by the Sun in the
85 cm
dataset, we flagged the short baselines in the hour angles in which the
Sun
was above the horizon (
.
At 85 cm and at 2 m, we used
models of Cas A and Cyg A and we subtracted them from
the data during
imaging. To remove the interferences generated by the Sun in the
85 cm
dataset, we flagged the short baselines in the hour angles in which the
Sun
was above the horizon (
![]() ).
At 2 m, the Sun was high in the sky for most part of
the observation. In this case, we produced different
cleaning models of this
source for the different nights and we subtracted them during the final
imaging.
).
At 2 m, the Sun was high in the sky for most part of
the observation. In this case, we produced different
cleaning models of this
source for the different nights and we subtracted them during the final
imaging.
2.6 Flux scale at 2 m wavelength
Table 3: Parameters of the observations and of the final full resolution maps.
The flux scale at low frequencies is not very accurately determined. Until a more definitive flux scale is in place (this is being developed for LOFAR) we use the radio source 3C 295 as the primary WSRT flux calibrator at low frequencies. We have adopted a flux density at 150 MHz of 95 Jy for 3C 295 and a power-law spectral index of -0.6 in the frequency range from 115-175 MHz. We believe this number to be accurate to about 5%.
A major component of the system noise (receiver + sky) at low frequencies is due to our Galaxy. The System Equivalent Flux Density (SEFD) of the telescopes at 150 MHz is about 8000 Jy in the Galactic areas where 3C 295 happens to be located, but it rises to well over 10 000 Jy in the Galactic plane. Because the WSRT receivers operate with an automatic gain control (AGC) system before the analog-to-digital converter, it continuously measures the total power to allow corrections for the variable input levels. Unfortunately, most of the time the total powers detectors (which integrate the power over the whole 2.5 MHz sub-band) are corrupted by RFI so we can not automatically correct the correlation coefficients for the variations in system noise. The LFFE band is full of mostly impulsive and narrow band RFI coming from airplanes, satellites, and mobile users as well as electronic hardware within the building which is located halfway the array. At the high spectral resolution (10 kHz) provided by the backend most of this RFI can be excised. However, the total power data must be manually inspected for suitable stretches of power level measurements. These data form the basis for a manual correction of the flux scale.
For A2255 the total power ratio between the cluster region and
the 3C 295 field
is ![]() at 141 MHz. Following the transfer of the complex gain
correction determined for 3C 295 we have therefore applied an
additional
correction of a factor 1.15 to the visibility data.
at 141 MHz. Following the transfer of the complex gain
correction determined for 3C 295 we have therefore applied an
additional
correction of a factor 1.15 to the visibility data.
![\begin{figure}
\par\includegraphics[width=5.5cm,clip]{124652a.eps}\hspace*{4mm}
...
...b.eps}\hspace*{4mm}
\includegraphics[width=5.5cm,clip]{124652c.eps}
\end{figure}](/articles/aa/full_html/2009/44/aa12465-09/img46.png)
|
Figure 2: Observed noise level uncorrected for the primary beam as a function of distance from the field center for the 2 m ( left panel), 85 cm ( middle panel), and 25 cm ( right panel) maps. The dashed line represents the estimated thermal noise level, again uncorrected for the primary beam. |
| Open with DEXTER | |
![\begin{figure}
\par\includegraphics[width=15.5cm,clip]{124653a.eps}\par\vspace*{...
...egraphics[angle=270,width=7.3cm,clip]{124653b.eps}\hspace*{4.1cm}}\end{figure}](/articles/aa/full_html/2009/44/aa12465-09/img47.png)
|
Figure 3:
Grey scale images of A2255 at 25 cm ( top left panel),
85 cm ( top right panel), and 2 m (
bottom panel). All images cover the same area of the sky. The
resolutions are
|
| Open with DEXTER | |
![\begin{figure}
\par\includegraphics[width=12.5cm,clip]{124654.eps}
\end{figure}](/articles/aa/full_html/2009/44/aa12465-09/img48.png)
|
Figure 4:
Top panel: big field grey scale image of
A2255 at 25 cm. The radio galaxies Bean, Embryo, and Beaver
are visible, at large distance from the cluster center. The resolution
is
|
| Open with DEXTER | |
![\begin{figure}
\par\includegraphics[width=13.7cm,clip]{124655z.eps} %\vspace*{0.5mm}
\end{figure}](/articles/aa/full_html/2009/44/aa12465-09/img49.png)
|
Figure 5:
Composite images of A2255 obtained from superposing the radio and
optical images. The WSRT 85 cm radio map (in grey)
for the total field ( central panel), NW relic (
bottom left panel), and SW relic ( bottom right panel)
are shown overlaid on the red band Digitized Sky Survey image (black
and white). The radio image has a resolution of
|
| Open with DEXTER | |
![\begin{figure}
\par\includegraphics[width=12cm,clip]{124656.eps}
\end{figure}](/articles/aa/full_html/2009/44/aa12465-09/img50.png)
|
Figure 6:
Contour map of A2255 at 85 cm. The resolution is
|
| Open with DEXTER | |
![\begin{figure}
\par\includegraphics[width=12cm,clip]{124657.eps}
\end{figure}](/articles/aa/full_html/2009/44/aa12465-09/img51.png)
|
Figure 7:
Contour map of A2255 at 2 m. The resolution is
|
| Open with DEXTER | |
2.7 Errors and noise in the final images
Knowing the value of the error in an image is essential in determining
the
reliability of the image and of the derived parameters. The observed
errors
(
![]() )
in a map mainly consist of:
)
in a map mainly consist of:
- the thermal noise (
 ), which is due to the
stochastic errors, coming from the Galaxy, receivers and other
electronics used in the array;
), which is due to the
stochastic errors, coming from the Galaxy, receivers and other
electronics used in the array;
- the confusion noise (
 ), which actually consists of
three contributions:
), which actually consists of
three contributions:
- 1.
- the ``normal'' sidelobe noise, which arises from the sum of all the sidelobes responses to the very large number of sources visible within the field of view. This noise can be minimized by deconvolution;
- 2.
- the ``classical'' source confusion, which is associated with the number of sources within the same beam;
- 3.
- the ``error'' sidelobe noise, which results from calibration errors and non-isoplanaticity.
In Table 3,
we list the estimated ![]() and
and ![]() for the
three observing wavelengths. Reliable estimates of the thermal noise
have been obtained from polarization images (Q,U,V)
and narrow spectral bands.
The confusion limit for WSRT at 21 cm was determined by
Garrett et al.
(2000) to be
for the
three observing wavelengths. Reliable estimates of the thermal noise
have been obtained from polarization images (Q,U,V)
and narrow spectral bands.
The confusion limit for WSRT at 21 cm was determined by
Garrett et al.
(2000) to be ![]() 5
5 ![]() Jy. Because
the PSF of the
WSRT depends on the declination, this value refers to Dec =
+6
Jy. Because
the PSF of the
WSRT depends on the declination, this value refers to Dec =
+6![]() .
At a different wavelength (
.
At a different wavelength (![]() )
it is given by
)
it is given by
|
where
Assuming that
![]() and
and
![]() are
uncorrelated, the observed noise in the
final map as a function of the distance from the center of the
field is given
by:
are
uncorrelated, the observed noise in the
final map as a function of the distance from the center of the
field is given
by:
|
(1) |
In Fig. 2, we plot the observed noise levels, uncorrected for the primary beam, as a function of the distance from the field center for the final 2 m, 85 cm, and 25 cm full resolution maps. Because the classical confusion noise will be attenuated by the primary beam, the observed noise decreases from the center to the edges of the field, where it approaches the thermal noise level. This trend, more clear in the low-frequency maps, is a problem when trying to assess the significance of the central extended features in the contour maps. In principle, we should consider as detection limit the noise observed at the center of the field and plot the contours starting from, for example, 3 times this value. However, it is worth noting that in this area we are confusion limited (this is a situation similar to that found in deep optical images of galaxies, where the central fluctuations are often dominated by the large number of stars within a resolution element). Therefore, in order to show the significance of the features in our final contour maps, we start plotting the contours from 3 times the noise observed at the edge of the fully imaged field. To assess the significance of the detected structures with respect to the background fluctuations, we advice the reader to compare the contour maps at 25 cm, 85 cm, and 2 m with their grey scale version in Fig. 3.
2.8 Flux measurement uncertainties
Because of the errors present in the final images, the flux and spectral index estimates are affected by uncertainties. The error associated with the flux depends on:
- the observed noise in the final maps (
 );
);
- the error due to the negative bowl, which arises around the
extended structures because of the missing short spacings (
 ). This severely affects the
non full resolution
maps only (see Sect. 2.9).
In our case, its value was estimated by determining the mean
value of the negative bowl around the central maximum in the
antenna pattern;
). This severely affects the
non full resolution
maps only (see Sect. 2.9).
In our case, its value was estimated by determining the mean
value of the negative bowl around the central maximum in the
antenna pattern;
- the uncertainty related with the flux of the calibrator
(
 ). This is a scale error which
apply to the whole map.
). This is a scale error which
apply to the whole map.
|
(2) |
The uncertainty on the spectral index is given by
|
(3) |
where
2.9 Making maps at 25 cm, 85 cm, and 2 m for a spectral index analysis
To make the final spectral index maps, we tapered the
data to the same
low resolution of the 2 m dataset (
![]() ),
and we cut the uv data with the same minimum uv coverage (144
),
and we cut the uv data with the same minimum uv coverage (144![]() ), which is
determined by the 25 cm data.
), which is
determined by the 25 cm data.
The missing short spacings in the low resolution
2 m and 85 cm maps
created a negative bowl around the central radio halo. To remove as
much as possible of the negative bowl, we cleaned very deep the halo
emission. At 2 m, the final map was obtained
including in imaging only
the three frequency bands least affected by RFI. Finally,
the maps
have been corrected for the total power primary beam of the WSRT,
which can be approximated by
|
(4) |
where c is a constant
3 Results
A grey scale version of the final full resolution maps at 25 cm, 85 cm and 2 m is shown in Fig. 3. In the following subsections, we describe the features detected at each wavelength.
3.1 25 cm map
The 25 cm map is presented in Fig. 4. The image, which
has a noise level of 11 ![]() Jy at the edge of the field, shows the well known
extended halo, located at the cluster center, the relic, that lies 10
Jy at the edge of the field, shows the well known
extended halo, located at the cluster center, the relic, that lies 10![]() to the northeast from it, and 3 extended radio galaxies at a very large
distance from the center of the cluster: the Embryo and the Beaver lie
at
to the northeast from it, and 3 extended radio galaxies at a very large
distance from the center of the cluster: the Embryo and the Beaver lie
at ![]() 1.6 Mpc
from the cluster center, while the Bean lies at more than
3.5 Mpc (quoted names are taken from Harris
et al. 1980). Since more relic features are
detected at low frequency around A2255 (Sect. 3.2), from now on
we will refer to the relic as NE (north-east) relic. Zooming into the
central region of A2255, we notice the presence of 4 additional
extended cluster radio galaxies: the Goldfish, the Double, the original
TRG, and the Sidekick. The positions of the 7 radio galaxies are listed
in Table 4.
Each of them has an optical counterpart that belongs to the cluster (Miller & Owen 2003).
1.6 Mpc
from the cluster center, while the Bean lies at more than
3.5 Mpc (quoted names are taken from Harris
et al. 1980). Since more relic features are
detected at low frequency around A2255 (Sect. 3.2), from now on
we will refer to the relic as NE (north-east) relic. Zooming into the
central region of A2255, we notice the presence of 4 additional
extended cluster radio galaxies: the Goldfish, the Double, the original
TRG, and the Sidekick. The positions of the 7 radio galaxies are listed
in Table 4.
Each of them has an optical counterpart that belongs to the cluster (Miller & Owen 2003).
The halo has a rectangular shape and shows a filamentary
structure,
which is in agreement with previous 21 cm VLA observations
(Govoni et al. 2005).
Given the high sensitivity of our new observations, halo
and NE relic look more extended and directly connected by a
radio
bridge, which extends towards the north-east and seems associated with
two features; the former is located at
![]() ,
,
![]() and
belongs to the NE relic,
the latter lies at
and
belongs to the NE relic,
the latter lies at
![]() ,
,
![]() .
They
are labeled respectively C1 and C2 in Fig. 4. The physical
parameters of halo and NE relic are reported in Table
5.
.
They
are labeled respectively C1 and C2 in Fig. 4. The physical
parameters of halo and NE relic are reported in Table
5.
We detect a very low surface brightness feature at location
![]() ,
,
![]() ,
that is associated with one
of the two filaments of the NW relic detected at 85 cm
(Sect. 3.2).
Since it lies in a pretty empty region of the
radio sky, a possible association of this feature with a collection of
point sources or with a central radio galaxy seems unlikely.
,
that is associated with one
of the two filaments of the NW relic detected at 85 cm
(Sect. 3.2).
Since it lies in a pretty empty region of the
radio sky, a possible association of this feature with a collection of
point sources or with a central radio galaxy seems unlikely.
3.2 85 cm map
The 85 cm map of A2255 is presented in Fig. 6. With noise levels ranging between 0.08 mJy/beam to 0.25 mJy/beam, limited by classical confusion noise (see Sect. 2.7 and Table 3), it improves over previous imaging at close wavelength (Feretti et al. 1997) by a factor of 20. The overlay of the radio map with the red band Digitized Sky Survey (DSS) optical image is presented in Fig. 5. This image clearly shows the extension of the radio emission compared to the optical galaxies.
The halo, the NE relic, and the radio galaxies belonging to the cluster are detected. The central radio halo looks much more complex than in previous images at the same frequency (Feretti et al. 1997) and it is more extended than at 25 cm, in particular towards the S and SW. We notice that the southern region of the halo is directly connected, in projection, to the tail of the Beaver radio galaxy, which has doubled its length to almost 1 Mpc between 25 cm and 85 cm. Feature C2 in the 25 cm map (see Fig. 4) is now more prominent and it looks directly associated to the NE relic. The physical parameters of halo and NE relic at 85 cm are listed in Table 5.
The high sensitivity of our observations allow us to detect
two new
extended features at a projected distance of 2 Mpc from the cluster
center. The new ``relics'' are located NW and SW of the center of the
cluster and previous 21 cm images of A2255 revealed that they
are
genuine features and not a collection of discrete sources
(Pizzo & de Bruyn
2008). From now on, we will call them the NW
(north-west) and SW (south-west) relic, respectively. They have
different shapes. The SW relic appears like a filament of about
8![]() in length and 2
in length and 2![]() in
width. It has the same orientation of the known NE relic, but is
located on the opposite side from the cluster center and at a double
distance from it. The NW relic has a more
complex morphology. We can
distinguish 2 filaments, labeled NW1 and NW2 in Fig. 6.
NW1 points towards the cluster center and has a length of
in
width. It has the same orientation of the known NE relic, but is
located on the opposite side from the cluster center and at a double
distance from it. The NW relic has a more
complex morphology. We can
distinguish 2 filaments, labeled NW1 and NW2 in Fig. 6.
NW1 points towards the cluster center and has a length of ![]() 8
8
![]() ,
while NW2 is
,
while NW2 is
![]() 13
13
![]() and
is perpendicular to NW1. The SW and NW relics have integrated flux
densities of
and
is perpendicular to NW1. The SW and NW relics have integrated flux
densities of ![]() 17 mJy
and
17 mJy
and ![]() 61 mJy,
respectively. The
physical properties of the newly detected structures and their origin
have been investigated by Pizzo
et al. (2008), who suggested a
connection with LSS shocks.
61 mJy,
respectively. The
physical properties of the newly detected structures and their origin
have been investigated by Pizzo
et al. (2008), who suggested a
connection with LSS shocks.
Other extended diffuse low surface
brightness features are detected to the east (
![]() ,
,
![]() )
and to the west (
)
and to the west (
![]() ,
,
![]() )
of the cluster center. Their
nature is still unclear. Moreover, the map shows positive and
negative fluctuations on a scale of 0.5 to 1 degree,
which are likely
due to our Galaxy.
)
of the cluster center. Their
nature is still unclear. Moreover, the map shows positive and
negative fluctuations on a scale of 0.5 to 1 degree,
which are likely
due to our Galaxy.
3.3 2 m map
The 2 m map is shown in Fig. 7. The noise ranges between 2 mJy and 3 mJy and is limited by classical confusion noise in the inner part of the map (see Sect. 2.7 and Table 3).
Table 4: The extended radio galaxies of A2255.
Around the central radio halo, the known radio galaxies
belonging to the
cluster are still detected. The diffuse emission associated with A2255
seems
to be rather complex. The radio halo is extended towards NW and is
connected
to the NW relic. The largest detectable structure in our 85 cm
observations is
![]() 1
1![]() ,
which means that non detecting this extended
feature at 85 cm cannot be due to uv plane coverage issues.
Instead, it
supports the more likely hypothesis that the new emission
region is a steep
spectrum feature, whose nature is different from the NW relic. We note
that
point sources might make an important contribution to
the new extended
emission feature. To test its nature, we removed the contribution of
point
sources detected at 25 cm in this area, assuming a nominal
spectral index of
,
which means that non detecting this extended
feature at 85 cm cannot be due to uv plane coverage issues.
Instead, it
supports the more likely hypothesis that the new emission
region is a steep
spectrum feature, whose nature is different from the NW relic. We note
that
point sources might make an important contribution to
the new extended
emission feature. To test its nature, we removed the contribution of
point
sources detected at 25 cm in this area, assuming a nominal
spectral index of
![]() .
The total flux subtracted in the region is 635 mJy. The
result, shown in Fig. 8,
confirms the genuine diffuse
nature of the feature. The source at location
.
The total flux subtracted in the region is 635 mJy. The
result, shown in Fig. 8,
confirms the genuine diffuse
nature of the feature. The source at location
![]() ,
,
![]() is
due to a blend of 2
point sources, as can be seen at higher frequency
(Fig. 6).
Given their steep spectrum (
is
due to a blend of 2
point sources, as can be seen at higher frequency
(Fig. 6).
Given their steep spectrum (
![]() ), they
are still visible after the subtraction. We computed the upper limit
for the
spectral index of this feature using maps at 2 m and
at 85 cm restored with
the same resolution (
), they
are still visible after the subtraction. We computed the upper limit
for the
spectral index of this feature using maps at 2 m and
at 85 cm restored with
the same resolution (
![]() ),
covering the same uv
range and in which we subtracted the point sources detected at
25 cm. In the 2
m map, the feature has a peak brightness of
28 mJy/beam, while in the 85 cm
map we can only give an upper limit, considering 3 times the noise of
this map
(
),
covering the same uv
range and in which we subtracted the point sources detected at
25 cm. In the 2
m map, the feature has a peak brightness of
28 mJy/beam, while in the 85 cm
map we can only give an upper limit, considering 3 times the noise of
this map
(
![]() mJy/beam),
i.e. 3 mJy/beam. As a result, we obtain that
the newly detected feature should have a spectrum steeper
than -2.6.
mJy/beam),
i.e. 3 mJy/beam. As a result, we obtain that
the newly detected feature should have a spectrum steeper
than -2.6.
Because of the low resolution of the image, the NE relic seems
to be
embedded in the halo emission. The feature associated with it,
already detected at 85 cm and tentatively at 25 cm
(C2 in
Fig. 4,
bottom left panel), is now more
prominent. However, we notice that, in this case, part of it could be
due to the radio source located at
![]() ,
,
![]() ,
clearly detected at both 25 cm
and 85 cm.
,
clearly detected at both 25 cm
and 85 cm.
The physical parameters of halo and NE relic at 2 m are listed in Table 5. We note that it is difficult to determine the real size and the borders of the halo and the NE relic, therefore the integrated flux densities reported in the table also reflect this uncertainty. The angular sizes of the two structures are assumed to be the same than at 85 cm.
The NW relic is visible at 2 m, while the SW one,
which has a surface
brightness lower than the NW relic at 85 cm, is not detected (
![]() mJy).
This is mainly due to the confusion limit in the
central area of the map, where the noise level
is 3 mJy.
mJy).
This is mainly due to the confusion limit in the
central area of the map, where the noise level
is 3 mJy.
Other extended features are detected to the E, NW and SW of
the
cluster center and at very large projected distance from it. The first
one is located at
![]() ,
,
![]() ,
the
second one at
,
the
second one at
![]() ,
,
![]() and
the
third one at
and
the
third one at
![]() ,
,
![]() .
Comparing the 2 m map with the full resolution
85 cm and 25 cm images,
it is evident that in this case we are dealing with unresolved point
sources.
.
Comparing the 2 m map with the full resolution
85 cm and 25 cm images,
it is evident that in this case we are dealing with unresolved point
sources.
![\begin{figure}
\par\includegraphics[width=8cm,clip]{124658.eps}
\end{figure}](/articles/aa/full_html/2009/44/aa12465-09/img109.png)
|
Figure 8:
Map at 2 m of the new extended emission region to the NW of
the halo of A2255 after the subtraction of the model of point
sources
detected at 25 cm (see text). The result suggests that the new
feature
is genuine and not due to a collection of point sources. The
resolution of the map is
|
| Open with DEXTER | |
![\begin{figure}
\includegraphics[angle=270,width=12cm]{124659z.eps}
\end{figure}](/articles/aa/full_html/2009/44/aa12465-09/img110.png)
|
Figure 9:
Spectral index map of A2255 between 25 cm and
85 cm, with a
resolution of
|
| Open with DEXTER | |
![\begin{figure}
\par\includegraphics[width=12.68cm,angle=270,clip]{1246510z.eps}
\end{figure}](/articles/aa/full_html/2009/44/aa12465-09/img111.png)
|
Figure 10:
Spectral index map of A2255 between 85 cm and
2 m, with a
resolution of 163
|
| Open with DEXTER | |
Table 5: Parameters of the halo and the relics derived from the full resolution maps.
4 Spectral index analysis of A2255
After obtaining the final maps with the same resolution, uv min and gridding, we computed the spectral index images using the NRAO Astronomical Image Processing System (AIPS) package.
4.1 Spectral index analysis between 25 cm and 85 cm
The spectral index image of A2255 between 25 cm and 85 cm is shown in Fig. 9.
We did not subtract the extended discrete radio sources, to
avoid
errors which might be introduced by the residuals of the
subtraction. Therefore, we notice that the steep ![]() values in
the central area of the halo are probably associated with the tail of
the ``Original TRG''. Moreover, the flat spectrum of the eastern
regions of the halo, are heavily influenced by the presence of the
nuclei of the Double and the Goldfish radio galaxies. For this reason,
the only
values in
the central area of the halo are probably associated with the tail of
the ``Original TRG''. Moreover, the flat spectrum of the eastern
regions of the halo, are heavily influenced by the presence of the
nuclei of the Double and the Goldfish radio galaxies. For this reason,
the only ![]() values in the N and NW area of the halo can be
considered as representative of the halo itself. Here, the spectrum
shows a radial flattening from the center (
values in the N and NW area of the halo can be
considered as representative of the halo itself. Here, the spectrum
shows a radial flattening from the center (
![]() )
to the periphery (
)
to the periphery (
![]() ),
where the three
bright radio filaments are detected at high-frequency (see
Fig. 4).
At this location, fresh (re-)acceleration of
relativistic particles is expected to take place, producing a
flattening of the spectrum.
),
where the three
bright radio filaments are detected at high-frequency (see
Fig. 4).
At this location, fresh (re-)acceleration of
relativistic particles is expected to take place, producing a
flattening of the spectrum.
The NE relic shows ![]() values which range from
values which range from ![]() to
to
![]() .
There is a gradient of the spectral index along
the main axis:
.
There is a gradient of the spectral index along
the main axis: ![]() flattens from south-east towards north-west
(see right panel of Fig. 11).
Moreover,
flattens from south-east towards north-west
(see right panel of Fig. 11).
Moreover, ![]() shows
a trend also along the minor axis, being steeper in the
regions
close to the cluster center and flattening towards the periphery (see
left panel of Fig. 11).
shows
a trend also along the minor axis, being steeper in the
regions
close to the cluster center and flattening towards the periphery (see
left panel of Fig. 11).
As discussed in Sect. 3.1, the brighter
filament of the NW
relic is detected at 25 cm as a very low brightness feature
(1![]() /beam).
Because of the 3
/beam).
Because of the 3![]() criterium we used to
produce the spectral index map between 25 cm and
85 cm, this feature
is not visible in the low resolution map.
criterium we used to
produce the spectral index map between 25 cm and
85 cm, this feature
is not visible in the low resolution map.
4.2 Spectral index analysis between 85 cm and 2 m
Figure 10
shows the spectral index image of A2255, calculated
between 2 m and 85 cm. The spectral index image has
been obtained
clipping the pixels where the brightness was below ![]() level at
both wavelengths.
level at
both wavelengths.
The spectral index within the halo shows a more
patchy structure than
between 25 cm and 85 cm. The ![]() values are flatter in the regions corresponding to
the nuclei of the central radio galaxies (
values are flatter in the regions corresponding to
the nuclei of the central radio galaxies (
![]() )
and steepen in between (
)
and steepen in between (
![]() ).
In the NW
regions of the halo, where there is no contamination from
radio galaxies,
).
In the NW
regions of the halo, where there is no contamination from
radio galaxies, ![]() shows a discontinuous behavior, ranging
between
shows a discontinuous behavior, ranging
between ![]() and
and ![]() .
As for
the spectral index image between 25 cm and 85 cm, the
flatter values
are confined to a semi circular area that approximately describes the
location of the 3 bright filaments at high-frequency.
.
As for
the spectral index image between 25 cm and 85 cm, the
flatter values
are confined to a semi circular area that approximately describes the
location of the 3 bright filaments at high-frequency.
The NE relic shows ![]() values in the range of
values in the range of ![]() to
to
![]() ,
with the steeper values confined in its NW areas. We
notice, however, that because of the criteria used to make the
spectral index map, combined with the high noise level in the
central
part of the 2 m map,
,
with the steeper values confined in its NW areas. We
notice, however, that because of the criteria used to make the
spectral index map, combined with the high noise level in the
central
part of the 2 m map, ![]() has been determined for the central area
of the NE relic only. Moreover, given the high rms values associated
with the spectral index in its SE region, no clear radial trend
neither along the main axis nor perpendicular to it can be
determined.
has been determined for the central area
of the NE relic only. Moreover, given the high rms values associated
with the spectral index in its SE region, no clear radial trend
neither along the main axis nor perpendicular to it can be
determined.
The NW relic, detected at 2 m in the high
sensitivity map, is no
longer entirely visible and only a small part of the filament pointing
towards the cluster center is still detected. Its spectral index
ranges between ![]() and
and ![]() ,
and steepens towards
the cluster center. Moreover, there is a feature at location
,
and steepens towards
the cluster center. Moreover, there is a feature at location
![]() ,
,
![]() ,
which is likely associated
with the second filament perpendicular to the previous one. Here,
,
which is likely associated
with the second filament perpendicular to the previous one. Here,
![]() steepens
towards the cluster center and ranges between
steepens
towards the cluster center and ranges between
![]() and
and
![]() .
.
We determined the integrated synchrotron spectrum of the
region of the
radio halo without the contamination of radio galaxies and of the NE
relic in the wavelength range 2 m-25 cm
(Fig. 12).
The fluxes of the analyzed
features are reported in Table 6. The
spectrum of the
radio halo has a constant slope between the 3 wavelengths (
![]() and
and
![]() ), while
the one of the NE relic is flatter at low-frequency
(
), while
the one of the NE relic is flatter at low-frequency
(
![]() )
and steepens at high-frequency
(
)
and steepens at high-frequency
(
![]() ).
).
4.3 Equipartition magnetic field
The total energy content of a synchrotron source (
![]() )
is given
by the contribution of the energy of the relativistic particles and
the energy of the magnetic field.
)
is given
by the contribution of the energy of the relativistic particles and
the energy of the magnetic field.
![]() shows
a minimum when these
2 contributions are approximately equal. For this reason
the minimum
energy is known also as equipartition value. If we assume that a radio
source is in a condition of minimum energy, it is possible to
estimate
the magnetic field strength (Pacholczyk
1970). The
equipartition magnetic field (
shows
a minimum when these
2 contributions are approximately equal. For this reason
the minimum
energy is known also as equipartition value. If we assume that a radio
source is in a condition of minimum energy, it is possible to
estimate
the magnetic field strength (Pacholczyk
1970). The
equipartition magnetic field (
![]() )
is expressed by
)
is expressed by
|
(5) |
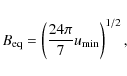
where the total minimum energy density (
![$\displaystyle \times \left( I_{0\left[\frac{{\rm mJy}}{{\rm arcsec^2}}\right]}\right)^{4/7} (d_{[{\rm kpc}]})^{-4/7} \Phi^{-4/7}.$](/articles/aa/full_html/2009/44/aa12465-09/img142.png)
Here,
|
|
= | ||
| (7) |
where V is the source volume.
Table 6
lists the equipartition
magnetic field for the region of the halo free of radio galaxies and
for the
NE relic. It was computed using the
fluxes at 85 cm. Furthermore, we assumed equal energy in
relativistic protons
and electrons (k = 1) and a filling factor of unity (![]() ,
the volume is
homogeneously filled by the relativistic plasma). The synchrotron
luminosity
is calculated in the frequency range 10 MHz-100 GHz.
Halo and relic are
shaped as cylinders with a size (length
,
the volume is
homogeneously filled by the relativistic plasma). The synchrotron
luminosity
is calculated in the frequency range 10 MHz-100 GHz.
Halo and relic are
shaped as cylinders with a size (length ![]() depth, derived from the map at 25 cm) of
depth, derived from the map at 25 cm) of
![]() kpc
and
kpc
and ![]() kpc,
respectively. A spectral index of
kpc,
respectively. A spectral index of
![]() for
the halo
and
for
the halo
and ![]() for the NE relic was adopted.
for the NE relic was adopted.
Govoni
et al. (2006) studied the intra
cluster magnetic field
power spectrum of A2255 through the analysis of the RM distributions of
three
cluster radiogalaxies. They found that to reproduce
the behavior of the RM for the radio galaxies, the power spectrum of
the magnetic field of the cluster should steep from the center
to the
periphery, with an average magnetic field strength for the
radio halo
calculated over 1 Mpc3 of about
1.2 ![]() G.
This value is a factor
of 2 higher than the equipartition magnetic field obtained by
us. The
discrepancy is mainly due to the fact that, in the approach
followed
by Govoni et al.
(2006), also low energy relativistic particles
are taken into account when computing the strength of
the magnetic
field, while in the standard approach used in the computation of the
equipartition parameters one considers a cut frequency window
between
G.
This value is a factor
of 2 higher than the equipartition magnetic field obtained by
us. The
discrepancy is mainly due to the fact that, in the approach
followed
by Govoni et al.
(2006), also low energy relativistic particles
are taken into account when computing the strength of
the magnetic
field, while in the standard approach used in the computation of the
equipartition parameters one considers a cut frequency window
between ![]() and
and ![]() .
Brunetti et al.
(1997) demonstrated that
it is more appropriate to calculate the radio source energy by
integrating the synchrotron luminosity over a range of electron
energies. This method has the advantage that electrons of very
low
energy are also taken into account and it avoids the problem that
electron energies corresponding to frequencies
.
Brunetti et al.
(1997) demonstrated that
it is more appropriate to calculate the radio source energy by
integrating the synchrotron luminosity over a range of electron
energies. This method has the advantage that electrons of very
low
energy are also taken into account and it avoids the problem that
electron energies corresponding to frequencies ![]() and
and ![]() depend on
the magnetic field value. Representing the electron energy
with its Lorentz factor
depend on
the magnetic field value. Representing the electron energy
with its Lorentz factor ![]() ,
and assuming that
,
and assuming that
![]() ,
the new expression of the equipartition magnetic
field is
,
the new expression of the equipartition magnetic
field is
where
![\begin{figure}
\par\includegraphics[width=12cm,clip]{1246511.eps}
\end{figure}](/articles/aa/full_html/2009/44/aa12465-09/img157.png)
|
Figure 11:
Spectral index profile of the NE relic between 25 cm and 85
cm along the minor axis ( left panel) and
the main axis ( right
panel). For the former the distance is from the cluster
center, for
the latter the distance is from position
|
| Open with DEXTER | |
![\begin{figure}
\par\mbox{\includegraphics[width=5.8cm,clip]{1246512a.eps}\hspace*{4mm}
\includegraphics[width=5.8cm,clip]{1246512b.eps} }
\end{figure}](/articles/aa/full_html/2009/44/aa12465-09/img158.png)
|
Figure 12: Radio spectra of the integrated emission of the radio halo ( left panel) and of the NE radio relic ( right panel) for the frequency range 2 m-25 cm. For this spectral comparison, we have computed the fluxes of the halo in its NW region. |
| Open with DEXTER | |
Table 6: Parameters of the NW region of the halo and of the NE relic derived from the images produced with the same uv coverage and the same resolution.
5 The head-tail Beaver radio galaxy
Abell 2255 is one of the richest clusters of the Abell catalog in terms of radio galaxies. In our maps we can detect 7 radio galaxies: four are located in the central region of the cluster, and three lie at large projected distance from it. The physical properties of these radio galaxies have already been studied by several authors (Feretti et al. 1997; Harris et al. 1980; Miller & Owen 2003), but so far spectral index images were not presented in the literature. During the analysis of our multi-frequency observations, we studied the physical properties of the Beaver radio galaxy because its long tail gave us the possibility to test ageing models of the radiating electrons.
5.1 Spectral index analysis
One of the most interesting properties of the Beaver
is that it
doubles the length of its tail to almost 1 Mpc between 25 cm
and 85 cm
(see Fig. 13).
This suggests very steep ![]() values
for the ending part of the tail, which is an indication of
severe energy losses suffered by the relativistic particles.
values
for the ending part of the tail, which is an indication of
severe energy losses suffered by the relativistic particles.
In Figs. 14
and 15,
we show the
spectral index maps of the Beaver, between 25 cm and
85 cm, and
between 85 cm and 2 m. The spectral index
distribution clearly
confirms that we are dealing with a tailed radio galaxy, since
![]() severely
steepens going from the head of the source towards
the end of the tail. Between 25 cm and 85 cm, the
spectral index of
the Beaver could be computed for the head and the initial part of the
tail. As we expect,
severely
steepens going from the head of the source towards
the end of the tail. Between 25 cm and 85 cm, the
spectral index of
the Beaver could be computed for the head and the initial part of the
tail. As we expect, ![]() is flatter in the regions closer to the
nucleus (
is flatter in the regions closer to the
nucleus (
![]() ),
where more energetic electrons are
continuously injected by the central AGN, and then it steepens
reaching values of
),
where more energetic electrons are
continuously injected by the central AGN, and then it steepens
reaching values of ![]() .
We would have expected a flatter spectral index for the head of the
radio galaxy, but the low resolution of
the maps makes the final
spectral index of the nucleus contaminated by the surrounding steeper
regions. The spectral index between 85 cm and 2 m
shows basically the
same trend, being flatter in the nucleus region (
.
We would have expected a flatter spectral index for the head of the
radio galaxy, but the low resolution of
the maps makes the final
spectral index of the nucleus contaminated by the surrounding steeper
regions. The spectral index between 85 cm and 2 m
shows basically the
same trend, being flatter in the nucleus region (
![]() )
and steepening towards the cluster radio halo (
)
and steepening towards the cluster radio halo (
![]() ).
).
The integrated spectra of the head and the tail of
the Beaver are shown in Fig. 16.
The trend
of the spectral index and of the primary beam corrected brightness
between 2 m and 85 cm along the tail is shown in
Fig. 17.
We computed ![]() at 3 different
positions, starting from 4
at 3 different
positions, starting from 4![]() from the nucleus of the radio galaxy
and going towards the end of the tail, averaging the
from the nucleus of the radio galaxy
and going towards the end of the tail, averaging the ![]() values
within beam size boxes.
values
within beam size boxes.
![\begin{figure}
\par\includegraphics[width=12cm,clip]{1246513.eps}
\end{figure}](/articles/aa/full_html/2009/44/aa12465-09/img176.png)
|
Figure 13:
Comparison between the morphologies of the Beaver radio
galaxy at 25 cm ( left panel) and
85 cm ( right panel). The
25 cm map
has been convolved with the 85 cm beam (54
|
| Open with DEXTER | |
![\begin{figure}
\par\includegraphics[width=9cm,angle=270,clip]{1246514z.eps}
\end{figure}](/articles/aa/full_html/2009/44/aa12465-09/img177.png)
|
Figure 14:
Spectral index map of the Beaver radio galaxy between
25 cm
and 85 cm, with a resolution of 163
|
| Open with DEXTER | |
![\begin{figure}
\par\includegraphics[width=9cm,angle=270,clip]{1246515z.eps}
\end{figure}](/articles/aa/full_html/2009/44/aa12465-09/img178.png)
|
Figure 15:
Spectral index map of the Beaver radio galaxy between
85 cm
and 2 m, with a resolution of 163
|
| Open with DEXTER | |
5.2 Physical parameters and spectral ageing in the tail of the Beaver
The electrons in the tail of the radio galaxies are not thought to be subjected to large bulk motions. Their number in a particular region of the tail remains constant after the galaxy has passed. Therefore, their position can be considered a measure of the age of the electrons.
Given a homogeneous and isotropic population of electrons with
a power
law energy distribution (
![]() ), the
synchrotron spectrum for regions optically thin to their own radiation
varies with frequency as
), the
synchrotron spectrum for regions optically thin to their own radiation
varies with frequency as
|
(9) |
where
The electron energy decreases with time and the resulting
synchrotron spectrum undergoes to a modification. One will
observe a
critical frequency ![]() ,
such that for
,
such that for ![]() the
spectrum is unchanged, whereas for
the
spectrum is unchanged, whereas for
![]() the
spectrum
steepens.
the
spectrum
steepens.
There are several mechanisms that can make the electrons loose their energy: synchrotron radiation, inverse Compton scattering, adiabatic expansion, Bremstrahlung and ionization losses (Pacholczyk 1970; Kardashev 1962). However, for confined tails the first two mechanisms play the most important role.
There are mainly two models that describe
the steepening of the radio
spectrum above ![]() :
:
- the Kardashev-Pacholczyk model (KP model, Pacholczyk 1970; Kardashev 1962), in which the electrons maintain the same pitch angle with respect to the B lines. The particles will have different energy losses depending on the value of this parameter;
- the Jaffe-Perola model (JP model, Jaffe & Perola 1973), where one considers an electrons population with an isotropic distributions of pitch angles. This results in a sharp energy cutoff in the energy electron distribution, with a synchrotron spectrum showing an exponential drop at high-frequency.
![\begin{figure}
\par\mbox{
\includegraphics[width=5.8cm,clip]{1246517a.eps}\hspace*{4mm}
\includegraphics[width=5.8cm,clip]{1246517b.eps} }\end{figure}](/articles/aa/full_html/2009/44/aa12465-09/img187.png)
|
Figure 17:
Right panel: point to point spectral index
between 85 cm and 2 m. The |
| Open with DEXTER | |
![\begin{displaymath}E_{\rm c} {\rm [GeV]} = 1.3 \times 10^{10} \frac{1}{(B_{\rm eq} ^2 + B_{\rm IC} ^2)t} ,
\end{displaymath}](/articles/aa/full_html/2009/44/aa12465-09/img188.png)
|
(10) |
where
The break frequency is
|
(11) |
We have fitted the integrated fluxes of the Beaver for two regions along the tail (labeled A and B in Fig. 13). They have been selected far from any possible contaminant source, as nucleus and extended emitting areas of the cluster radio halo. The tail of the Beaver was not detected at 25 cm in region B, thus the flux we used in this case is an upper limit. To produce the fit, the break frequency and the spectral index in the part of the spectrum not affected by any evolution (
From the shape of its synchrotron spectrum and under the
assumption of
equipartition, it is possible to estimate the radiative age of the
radio source. For the JP model, this is given by
![\begin{displaymath}t_{\rm r} = \frac{1.6 \times 10^{9}}{B^2 + B_{\rm IC} ^2} \sqrt{\frac{B}{(1+z) \nu^{*}}} \;\;\;\;\;\; {\rm [yr]} ,
\end{displaymath}](/articles/aa/full_html/2009/44/aa12465-09/img195.png)
|
(12) |
where B is in
An estimation of the kinematic age of the Beaver can be
obtained
assuming that the host galaxy traveled from position B till
its
current location (D = 900 kpc) with the
constant velocity of ![]() 1000 km s-1
(the velocity dispersion of A2255 is
1000 km s-1
(the velocity dispersion of A2255 is
![]() km s-1).
This implies
km s-1).
This implies
![]() yr.
yr.
5.3 Radio source confinement
Table 7: Fluxes and equipartition parameters of the Beaver radio galaxy.
![\begin{figure}
\par\includegraphics[width=12cm,clip]{1246518.eps}
\end{figure}](/articles/aa/full_html/2009/44/aa12465-09/img219.png)
|
Figure 18:
Fluxes of region A ( left panel) and region B (
right panel) fitted with the JP model. |
| Open with DEXTER | |
An important connection between the ICM and the radio galaxies is provided by the thermal pressure of the gas. From the radio data it is possible to derive the pressure within the radio source, under the assumption that the radio galaxy is in equipartition. From X-ray data, one can estimate the parameters of the intergalactic medium surrounding the radio source. By comparing the internal pressure of the radio emitting plasma with the thermal pressure of the ambient gas, we can get information about the equilibrium between thermal and nonthermal plasma.
The X-ray emitting gas plays an important role in influencing
the
expansion and the structure of a radio source because it gives rise to
a static pressure (
![]() ), which depends only on the
gas
temperature (
), which depends only on the
gas
temperature (
![]() )
and on the numerical density (
)
and on the numerical density (
![]() )
of the
X-ray emitting gas
)
of the
X-ray emitting gas
where k is the Boltzmann constant.
For our analysis, we used the X-ray results obtained by Feretti et al. (1997),
and we scaled the parameters to our cosmology. The central electron
density of the X-ray emitting gas is
![]() cm-3and
its temperature is
cm-3and
its temperature is ![]() 3.5 keV,
corresponding to
3.5 keV,
corresponding to ![]() K.
The thermal pressure of the X-ray emitting gas has been
scaled with the
K.
The thermal pressure of the X-ray emitting gas has been
scaled with the ![]() model
law:
model
law:
![\begin{displaymath}n(r)=\frac{n_0}{[1+(\frac{r}{r_{\rm c}})^2]^{3\beta /2}} ,
\end{displaymath}](/articles/aa/full_html/2009/44/aa12465-09/img227.png)
|
(14) |
where
The Beaver radio galaxy lies at a projected distance from the center
of the cluster of ![]() 18
18![]() (1.6 Mpc), where the
X-ray brightness of the thermal gas is very low, but still above the
background (see Table 8). By
comparing the internal
pressure of regions A and B along the tail (see Table 7)
with the static pressure of the
X-ray emitting gas at their projected distance from the cluster center
computed with Eq. (14)
(Table 8),
we
conclude that the equipartition pressure is lower by a factor of
102 or 103 than the
corresponding thermal pressure of the
gas. We notice that projection effects might play an important
role in
the determination of
(1.6 Mpc), where the
X-ray brightness of the thermal gas is very low, but still above the
background (see Table 8). By
comparing the internal
pressure of regions A and B along the tail (see Table 7)
with the static pressure of the
X-ray emitting gas at their projected distance from the cluster center
computed with Eq. (14)
(Table 8),
we
conclude that the equipartition pressure is lower by a factor of
102 or 103 than the
corresponding thermal pressure of the
gas. We notice that projection effects might play an important
role in
the determination of ![]() .
The large gap between
.
The large gap between
![]() and
and
![]() implies that
either the numerous
assumptions used in the calculations of the equipartition parameters
are not valid, or that there is a real deviation from the
equipartition conditions.
implies that
either the numerous
assumptions used in the calculations of the equipartition parameters
are not valid, or that there is a real deviation from the
equipartition conditions.
6 Discussion
6.1 Halo origin
The origin and evolution of cluster radio halos is still
a matter of
debate (Jaffe
1977; Dennison 1980).
The main
difficulty in explaining their nature arises from their large size
(![]() 1 Mpc)
and the short radiative lifetime of the relativistic
electrons emitting in them. Different theoretical models have
been
suggested in order to infer the mechanism of transferring
energy into
the relativistic electron population and for the origin of the
relativistic electrons themselves: in-situ re-acceleration of
relativistic electrons by shock waves (primary models),
particle
injection from radio galaxies, acceleration out of the thermal pool,
secondary electrons resulting from hadronic collisions of relativistic
protons with the ICM gas protons (secondary models),
and
combination of these processes
(Blasi
2003; Petrosian 2003; Brunetti
2003).
1 Mpc)
and the short radiative lifetime of the relativistic
electrons emitting in them. Different theoretical models have
been
suggested in order to infer the mechanism of transferring
energy into
the relativistic electron population and for the origin of the
relativistic electrons themselves: in-situ re-acceleration of
relativistic electrons by shock waves (primary models),
particle
injection from radio galaxies, acceleration out of the thermal pool,
secondary electrons resulting from hadronic collisions of relativistic
protons with the ICM gas protons (secondary models),
and
combination of these processes
(Blasi
2003; Petrosian 2003; Brunetti
2003).
Several properties make the halo of A2255 unique
among the other known cluster
radio halos. Embedded in the halo emission there is an unusually large
number (4) of tailed radio sources, which are likely supplying
it with relativistic
particles (Feretti et al. 1997).
Morphologically, the structure of the halo is rather
complex, as Figs. 4-7 show. At
25 cm, the halo has a
rectangular shape, due to the presence of 3 bright filaments at the
edges,
perpendicular to each other. Previous VLA observations
at 1.4 GHz (Govoni
et al. 2005)
revealed that they are strongly polarized (![]() 20%-40%), which
represents the first detection of a polarized halo in the literature.
Also at
85 cm and at 2 m the halo has a rectangular shape,
with a considerable
extension towards the S and SW with respect to high-frequency (see
Figs. 6
and 7).
Furthermore, in the 2 m
observations a new extended emitting region is detected to the NW of
the halo
(Figs. 7
and 8).
This new feature,
undetected in the more sensitive observations at
85 cm
(Fig. 6),
should have a very steep spectrum (
20%-40%), which
represents the first detection of a polarized halo in the literature.
Also at
85 cm and at 2 m the halo has a rectangular shape,
with a considerable
extension towards the S and SW with respect to high-frequency (see
Figs. 6
and 7).
Furthermore, in the 2 m
observations a new extended emitting region is detected to the NW of
the halo
(Figs. 7
and 8).
This new feature,
undetected in the more sensitive observations at
85 cm
(Fig. 6),
should have a very steep spectrum (
![]() ).
).
Table 8: Physical parameters of the X-ray emitting gas at the location of the Beaver.
As a consequence of the presence of the filaments, the surface
brightness of the halo increases from the center towards the edges and
this
reflects in the the spectral index behavior within the halo (see
Figs. 9-10). Although the
low resolution of the images does
not allow us to obtain very precise trends and the presence of the
radio
galaxies at the cluster center partially contaminate the determination
of the
spectral index, it is evident that ![]() is steeper in
the regions in between the filaments and flattens along them, where
fresh
(re-) acceleration of the relativistic particles takes place. This
trend, due
to the presence of the radio filaments, has not been seen before in a
radio
halo; in the few clusters for which maps of the spectral index
are available
(e.g. Coma C, Giovannini
et al. (1993), A665, A2163,
Feretti et al.
2004, A3562, Giacintucci
et al. 2005, A2744, and
A2219, Orrú
et al. 2007) the halo radio spectrum shows
variations
on small scales (as clumpy structures) and/or on large scales (radial
steepening from the center to the edges).
is steeper in
the regions in between the filaments and flattens along them, where
fresh
(re-) acceleration of the relativistic particles takes place. This
trend, due
to the presence of the radio filaments, has not been seen before in a
radio
halo; in the few clusters for which maps of the spectral index
are available
(e.g. Coma C, Giovannini
et al. (1993), A665, A2163,
Feretti et al.
2004, A3562, Giacintucci
et al. 2005, A2744, and
A2219, Orrú
et al. 2007) the halo radio spectrum shows
variations
on small scales (as clumpy structures) and/or on large scales (radial
steepening from the center to the edges).
The singular properties of the halo of A2255 (morphology, surface brightness, spectral index distribution, and polarization), suggest that either this extended structure has a more complex structure than the other known radio halos or that it is seen in a particular stage of its evolution. Since our observations do not support a unique explanation for the origin of the radio halo, we suggest the two following scenarios:
- the halo and the filaments are two physically
distinct
structures, seen in projection as a unique feature.
X-ray, optical and radio data provide evidence that A2255 is currently in an active dynamical state, and other surrounding structures might be interacting with it. A ROSAT X-ray survey observation indicates that this cluster belongs to the north ecliptic pole super-cluster, which contains at least 21 members (Mullis et al. 2001). Signs of the interaction of A2255 with the other cosmic structures are expected. Indeed, many radio features are detected at various distances from the cluster center. These radio ``relics'' suggest that the cluster is currently accreting gas from the cosmic environment and is possibly hosting many shock waves deriving from the past merger activity. Relics, usually found at the cluster periphery, should occasionally also be detected in projection towards the cluster center. Thus, it is possible that the three filaments that ``form'' the radio halo of A2255 are shocked regions of plasma which are seen in projection on the central real radio halo. Their highly polarized flux (Govoni et al. 2005) favors a location of these structures in the foreground instead than in the background, where Faraday depolarization would rapidly depolarize them. The new extended feature detected at 2 m to the NW of the cluster center could be considered as an extension of the halo and its very steep spectral index could be explained in the framework of the primary electron re-acceleration models, where a steepening of the spectral index from the center to the edges of the halo is expected. However, since radio halos in the literature are known to have regular morphologies, we should also consider the hypothesis that the new feature is not physically related with the central radio halo. In this case, this could be considered as the first example of Mpc-size diffuse structures (MDS), which lie around clusters and are detectable at very low frequency only.
- the halo has an intrinsic surface brightness
increasing
towards the edges and a spectral index flattening from the center to
its outermost regions.
The bright and polarized filaments at the edge of the halo could derive from the injection in the intra cluster medium of energy on large scales, which is produced by turbulence, resulting from past merger activity. On the theoretical point of view, the picture of the development of turbulence in clusters seems still uncertain. Dolag et al. (2005) argue that the bulk of turbulence is injected in the core of galaxy clusters, implying a more developed turbulence in the innermost regions, compared to the outer parts. On the other hand, cosmological numerical simulations suggest that turbulence is expected to be greater at increasing radial distances from the cluster center (Bryan & Norman 1998; Sunyaev et al. 2003). Moreover, Govoni et al. (2006) showed that to reproduce the RM distribution for three of the radio galaxies of A2255 one needs a power spectrum of the magnetic field of the cluster steepening from the center towards the periphery and the presence of filamentary structures on large scale. Therefore, it is possible that the turbulence at the center of A2255 gave rise to shocked regions at the edges of the halo.
In this framework, a physical connection between central halo and the newly detected extended feature to the NW from it seems unlikely. Thus, the latter should be classified as the first example of MDS.
6.2 Relics
Relics are associated with clusters with or without cooling core, suggesting that they may be related to minor or off-axis mergers, as well as major mergers. Their formation is supposed to be related to shocks either by Fermi-I diffuse acceleration of ICM electrons (Enßlin et al. 1998; Keshet et al. 2004a) or by adiabatic energization of the relativistic electrons confined in bubbles of fossil radio plasma (``ghosts''), released by a former active radio galaxy. Shocks in clusters environments can derive from the merger of subclusters ( merger shocks, Bykov et al. 2008), or can be due to the accretion of diffuse, unprocessed (cold) matter on gravitationally attracting nodes (accretion shocks, Keshet et al. 2003; Miniati 2003)
The presence of shocked regions in A2255 is strongly supported
by
X-ray and radio observations. Recently, the XMM-Newton satellite
detected a shocked region near (![]() 4
4![]() ,
360 kpc) the cluster
center. The morphology of this thermal emission suggests that
it
could arise from a merger that happened along the east-west
direction
about 0.15 Gyr ago (Sakelliou
& Ponman 2006). However, the complicated
structure of the temperature map does not allow any precise
conclusion
about the geometry of the merger.
,
360 kpc) the cluster
center. The morphology of this thermal emission suggests that
it
could arise from a merger that happened along the east-west
direction
about 0.15 Gyr ago (Sakelliou
& Ponman 2006). However, the complicated
structure of the temperature map does not allow any precise
conclusion
about the geometry of the merger.
At radio wavelengths, A2255 shows the presence of several relics and filamentary features (see Figs. 4 and 6) which are likely associated with shocks. The young merger event inferred by the X-ray observations cannot be responsible for the formation of these features, which are located at large distance from the cluster center. The shock derived from it lies still inside the radio halo. Cosmological simulations show that cosmic structures form through several merger events. Consequently, the cluster environment can host many shocks traveling towards different directions, together with possible other shocks, appearing at large distance from the cluster center and possibly associated with the flow of cold gas into the potential wall of the cluster itself. This scenario seems to be present in A2255. In its outermost regions there are relic-like structures, which are probably associated with LSS shocks (Pizzo et al. 2008). In addition, in its innermost regions there are shock-related features (NE relic, bridge, C1, and C2 in Fig. 4) which likely derive from the past merger activity.
The shape and location of the NE relic clearly suggest that
this could
originate in a shock wave traveling along the NE to SW direction. The
orientation of the magnetic field in it, being parallel to
the major
axis (Govoni et al. 2005),
also supports this scenario. Its radio spectral
index (
![]() ), unusually flat for a relic,
suggests
that this structure is young and the relativistic electrons have been
recently (re)accelerated. The spectral index trend along
the minor
axis, being steep near the cluster center and flattening towards the
periphery (see left panel of Fig. 11),
implies
that the shock is traveling outwards. The fact that we see a gradient
of the spectral index also along the major axis (see
right panel of Fig. 11), may
be due to the
complex geometry of the shock. The presence of filamentary radio
emission perpendicular to the NE relic (bridge, C1
and C2
in Fig. 4)
suggests that another shock could be present at
this location and it could have influenced the physical properties of
the NE relic itself.
), unusually flat for a relic,
suggests
that this structure is young and the relativistic electrons have been
recently (re)accelerated. The spectral index trend along
the minor
axis, being steep near the cluster center and flattening towards the
periphery (see left panel of Fig. 11),
implies
that the shock is traveling outwards. The fact that we see a gradient
of the spectral index also along the major axis (see
right panel of Fig. 11), may
be due to the
complex geometry of the shock. The presence of filamentary radio
emission perpendicular to the NE relic (bridge, C1
and C2
in Fig. 4)
suggests that another shock could be present at
this location and it could have influenced the physical properties of
the NE relic itself.
The nature of the NW and SW relics has been already
investigated by
Pizzo et al.
(2008) by means of the 85 cm observations.
The
spectral index study carried out in this paper, allow us to reinforce
our first conclusion. The spectrum of the NW relic has been determined
for the only filament oriented towards the cluster center. Its
![]() values (
values (
![]() )
and its location with respect to the cluster center, still support the
hypothesis that it could be related to LSS shocks. The SW relic is not
detected at 2 m, therefore we can only compute a lower limit (
)
and its location with respect to the cluster center, still support the
hypothesis that it could be related to LSS shocks. The SW relic is not
detected at 2 m, therefore we can only compute a lower limit (
![]() ). Given the common physical
properties with the NW relic,
we still suggest that also the SW relic could be associated with LSS
shocks.
). Given the common physical
properties with the NW relic,
we still suggest that also the SW relic could be associated with LSS
shocks.
6.3 The Beaver radio galaxy
Narrow angle tail (NAT) radio galaxies have a U shape morphology, with the nucleus coincident with the parent optical galaxy and both tails bending backwards. Most of these sources were detected in clusters of galaxies and they have been the target of numerous investigations. The morphology of NAT radio sources is due to the ram pressure exerted by the ambient medium on the radio plasma ejected by the host galaxy that moves through the cluster. In this scenario, the quasi continuous beams ejected by the central galaxy are bent backwards, forming a tail which marks the path that the galaxy has traveled through the ICM. It is currently accepted that in non collapsing clusters, the motion of the ICM is subsonic, thus not having a substantial effect on the orientation of the radio tails. In this context, the tail of the radio galaxy will be parallel to the galaxy advance motion.
The size of
NAT radio galaxies, from the nucleus till the end of the tail, is on
average about 200-300 kpc (Vallee
& Roger 1987). This is
comparable with the extent of the more common double radio
sources,
which have a I shape, with the parent galaxy located at the
centroid. However, a few examples of NAT radio galaxies with
uncommonly long tails are reported in the literature. Among them, the
most well known objects are IC 711 in Abell 1314 (![]() 650 kpc,
Vallee
(1988); Vallee & Roger (1987))
and NGC 1265 in the
Perseus cluster (>500 kpc, Sijbring &
de Bruyn (1998)). The Beaver
radio galaxy (1712+638, J2000), whose tail extends to
almost 1 Mpc at
85 cm wavelength, provides a clear example of such radio
sources.
650 kpc,
Vallee
(1988); Vallee & Roger (1987))
and NGC 1265 in the
Perseus cluster (>500 kpc, Sijbring &
de Bruyn (1998)). The Beaver
radio galaxy (1712+638, J2000), whose tail extends to
almost 1 Mpc at
85 cm wavelength, provides a clear example of such radio
sources.
The long tail of the Beaver may suggest that the host
galaxy (2MASX
J17131603+6347378) has traveled from the central regions of the
cluster to its actual location without any substantial deviation from
its original direction, at least on the plane of the sky. Projection
effects could make the tail appear shorter, but knowing the
real
extent of the tail as well as the 3-dimensional location of the Beaver
with respect to the other cluster structures is challenging. A
polarization study of the cluster at 85 cm reveals that the
end of the
tail of the Beaver is polarized (Pizzo et al., in prep.). This
suggests that this structure is not located deep inside the dense
X-ray emitting gas, which would make it depolarized due to
Faraday
depolarization. However, since the radial velocity of the galaxy
(
![]() km s-1)
is only 700 km s-1
higher than the mean
velocity of the cluster (
km s-1)
is only 700 km s-1
higher than the mean
velocity of the cluster (
![]() km s-1),
which is less than
its velocity dispersion (
km s-1),
which is less than
its velocity dispersion (
![]() km s-1),
the
direction of the velocity vector cannot be determined.
km s-1),
the
direction of the velocity vector cannot be determined.
We have checked that the long nature of the Beaver is real subtracting the point sources visible at higher frequency along the path of the tail in the low-frequency maps. Support to the genuine nature of the tail is also the regular steepening of the spectral index from the head towards its outermost regions (Figs. 14 and 15).
The severe steepening of the spectral index along the tail of
the
Beaver implies that the relativistic electrons responsible of the
radio emission suffered important energy losses after their first
ejection from the parent galaxy, which is confirmed by the high
radiative ages of the plasma at the end of the tail (![]()
![]() yr, see
Sect. 5.2).
Its detectability, even
at low frequency, raises questions, since adiabatic expansion should
play an important role in rapidly depriving the electrons of their
energy. In this context, it is suggested that the ICM could have a
drastic influence on the final stages of the life of the plasma
(e.g. Venturi
et al. 1998; Parma et al. 2007).
In our case,
the high static pressure exerted by the ICM on the ending part of the
tail of the Beaver (where the internal pressure is 103 times
lower
than the external one) may prevent its quick dissipation
through
adiabatic expansion.
yr, see
Sect. 5.2).
Its detectability, even
at low frequency, raises questions, since adiabatic expansion should
play an important role in rapidly depriving the electrons of their
energy. In this context, it is suggested that the ICM could have a
drastic influence on the final stages of the life of the plasma
(e.g. Venturi
et al. 1998; Parma et al. 2007).
In our case,
the high static pressure exerted by the ICM on the ending part of the
tail of the Beaver (where the internal pressure is 103 times
lower
than the external one) may prevent its quick dissipation
through
adiabatic expansion.
It is worth noting that the Beaver shows at the end of the tail spectral index values very similar to the ones of the southern regions of the halo (Fig. 15). This characteristic suggests that the Beaver and the halo may be physically related structures and that the radio galaxy provides the halo with the relativistic particles for its own radio emission. Tailed radio sources are thought to supply the relativistic electrons to radio halos (see the example of NGC 4869 in the COMA cluster, Giovannini et al. 1993). In the Beaver radio galaxy and A2255 we may witness this process.
7 Summary and conclusions
We presented WSRT observations of the cluster of galaxies A2255 at wavelengths of 25 cm, 85 cm, and 2 m. In the final maps, the radio halo and the relics are detected. In each image, the radio emission associated with the cluster seems to be very complex and several new features are detected. Our observations, together with the results coming from optical and X-ray studies, have highlighted an interesting picture for this cluster, which has probably undergone multiple merger events during its past history. Several features, detected in the radio domain in and around the cluster, could be considered as an indication of a still undergoing strong dynamical activity.
At 25 cm, the radio halo shows a U shape, with three bright filaments perpendicular to each other at the edges. Two additional filamentary features are detected at low level, the first one at the same location of the NW relic found at 85 cm and the other one near the already known NE relic (see Fig. 4). At 85 cm, the halo is more extended towards S and SW and at 2 m it shows a Mpc-size extension towards NW which was not detected previously.
From the spectral index images we found that ![]() is steep in the central part of the halo and flattens moving
towards its outermost regions (Figs. 9 and 10). This is likely
due to the presence at this location of bright filaments, clearly
detected at higher frequency. Understanding the nature of these
filaments and of the newly detected extended emission between halo and
NW relic is challenging. One possibility is that the central radio halo
and the filaments are two physically unrelated structures, seen in
projection near the cluster center. In this case, the extended feature
detected at 2 m to the NW of the halo could be considered as
an asymmetric extension of the halo itself; its steep spectrum (
is steep in the central part of the halo and flattens moving
towards its outermost regions (Figs. 9 and 10). This is likely
due to the presence at this location of bright filaments, clearly
detected at higher frequency. Understanding the nature of these
filaments and of the newly detected extended emission between halo and
NW relic is challenging. One possibility is that the central radio halo
and the filaments are two physically unrelated structures, seen in
projection near the cluster center. In this case, the extended feature
detected at 2 m to the NW of the halo could be considered as
an asymmetric extension of the halo itself; its steep spectrum (
![]() )
could be justified in the framework of the primary electron
re-acceleration models, where a steepening of the spectral
index from the center to the edges of the halo is expected. However,
since radio halos are known in the literature as structures showing a
regular morphology, the new feature could be physically not
related with the central radio halo and it should be considered as the
first example of Mpc-size diffuse structures (MDS), which are
detectable around clusters at very low frequency only. On the other
hand, it is also possible that A2255 hosts an intrinsically peculiar
radio halo, which has a filamentary structure at the edges. In this
scenario, the diffuse emission region to the NW of the halo should be
considered as not related to the central halo and classified as MDS. In
order to distinguish between the two possible scenarios, it is
important to understand the real nature of the filaments. Sensitive
X-ray observations are needed to investigate the presence of X-ray
substructures, possible shocks, and their connection to the radio halo.
On the other hand, a detailed study of the rotation measure of
the different physical structures of the cluster could make it
possible to infer the 3-dimensional geometry of A2255 (Pizzo
et al., in prep.), possibly answering this still open
question.
)
could be justified in the framework of the primary electron
re-acceleration models, where a steepening of the spectral
index from the center to the edges of the halo is expected. However,
since radio halos are known in the literature as structures showing a
regular morphology, the new feature could be physically not
related with the central radio halo and it should be considered as the
first example of Mpc-size diffuse structures (MDS), which are
detectable around clusters at very low frequency only. On the other
hand, it is also possible that A2255 hosts an intrinsically peculiar
radio halo, which has a filamentary structure at the edges. In this
scenario, the diffuse emission region to the NW of the halo should be
considered as not related to the central halo and classified as MDS. In
order to distinguish between the two possible scenarios, it is
important to understand the real nature of the filaments. Sensitive
X-ray observations are needed to investigate the presence of X-ray
substructures, possible shocks, and their connection to the radio halo.
On the other hand, a detailed study of the rotation measure of
the different physical structures of the cluster could make it
possible to infer the 3-dimensional geometry of A2255 (Pizzo
et al., in prep.), possibly answering this still open
question.
The NE relic shows a flattening of the spectral index along its minor axis, moving outwards from the cluster center (see left panel of Fig. 11). This, and the rather flat integrated spectrum of the NE relic (Fig. 12, right panel), suggests that the relativistic particles have been recently (re) accelerated by a shock, that is traveling from the center of the cluster towards its periphery along the NE-SW direction.
The NW and SW relics are both detected at 85 cm only.
The NW relic is
also visible at 2 m, but just partially at 25 cm.
From the spectral
index image between 2 m and 85 cm, we obtain spectral
index values
ranging between -0.6 and -1.8, steepening towards the
cluster
center. We cannot obtain a direct estimation of the spectral index for
the SW relic, because of sensitivity limitations in the 25 cm
and 2 m
maps, therefore only a lower limit can be derived in this case
(
![]() ).
).
The tail of the Beaver radio galaxy increases its length to
almost 1 Mpc between 25 cm and 85 cm. This
is a clear indication that the
plasma along the tail suffered severe energy losses after the ejection
from the parent optical galaxy, and that is still confined in the tail
due to the static pressure exerted by the external ICM. The very long
tail of the radio galaxy gives us the possibility to test ageing
models for the relativistic electrons. The JP model gives a
good
representation of our data for the initial part of the tail
(Fig. 18,
left panel). For the ending part, more
observations at intermediate wavelengths between 25 cm and
85 cm are
needed to draw any conclusion (Fig. 18, right panel).
In
the spectral index map between 85 cm and 2 m
(Fig. 15)
there is the indication that the ![]() values of the ending part of
the tail of the Beaver are similar to the
ones of the southern regions of the halo of A2255. This might
suggest
that the radio galaxy has provided the halo with relativistic
particles for its own radio emission. To test this hypothesis,
a more
detailed study of the steepening of the spectral index along the tail
of the Beaver is needed. LOFAR, thanks to its wide low-frequency range
and high resolution, will play a major role in such
investigations.
values of the ending part of
the tail of the Beaver are similar to the
ones of the southern regions of the halo of A2255. This might
suggest
that the radio galaxy has provided the halo with relativistic
particles for its own radio emission. To test this hypothesis,
a more
detailed study of the steepening of the spectral index along the tail
of the Beaver is needed. LOFAR, thanks to its wide low-frequency range
and high resolution, will play a major role in such
investigations.
R.F.P. is thankful to Luigina Feretti for the useful discussions during the data analysis. R.F.P. is grateful to Monica Orienti for the very helpful and detailed comments and suggestions during the writing of the manuscript. The Westerbork Synthesis Radio Telescope is operated by ASTRON (Netherlands Institute for Radio Astronomy) with support from the Netherlands Foundation for Scientific Research (NWO).
References
- Blasi, P. 2003, in ASP Conf. Ser. 301, ed. S. Bowyer, & C.-Y. Hwang, 203
- Blasi, P., & Colafrancesco, S. 1999, Astroparticle Phys., 12, 169 [CrossRef] [NASA ADS]
- Bonafede, A., Giovannini, G., Feretti, L., Govoni, F., & Murgia, M. 2009, A&A, 494, 429 [EDP Sciences] [CrossRef] [NASA ADS]
- Brunetti, G. 2003, in ASP Conf. Ser. 301, ed. S. Bowyer, & C.-Y. Hwang, 349
- Brunetti, G., Setti, G., & Comastri, A. 1997, A&A, 325, 898 [NASA ADS]
- Brunetti, G., Setti, G., Feretti, L., & Giovannini, G. 2001, MNRAS, 320, 365 [CrossRef] [NASA ADS]
- Brunetti, G., Blasi, P., Cassano, R., & Gabici, S. 2004, MNRAS, 350, 1174 [CrossRef] [NASA ADS]
- Bryan, G. L., & Norman, M. L. 1998, ApJ, 495, 80 [CrossRef] [NASA ADS]
- Burns, J. O., Roettiger, K., Pinkney, J., et al. 1995, ApJ, 446, 583 [CrossRef] [NASA ADS]
- Bykov, A. M., Dolag, K., & Durret, F. 2008, Space Sci. Rev., 134, 119 [CrossRef] [NASA ADS]
- Cassano, R., & Brunetti, G. 2005, MNRAS, 357, 1313 [CrossRef] [NASA ADS]
- Cotton, W. D., Condon, J. J., Perley, R. A., et al. 2004, in SPIE Conf. Ser. 5489, ed. J. M. Oschmann, Jr., 180
- Davis, D. S., Miller, N. A., & Mushotzky, R. F. 2003, ApJ, 597, 202 [CrossRef] [NASA ADS]
- Dennison, B. 1980, ApJ, 239, L93 [CrossRef] [NASA ADS]
- Dolag, K., & Enßlin, T. A. 2000, A&A, 362, 151 [NASA ADS]
- Dolag, K., Vazza, F., Brunetti, G., & Tormen, G. 2005, MNRAS, 364, 753 [CrossRef] [NASA ADS]
- Enßlin, T. A., & Gopal-Krishna. 2001, A&A, 366, 26 [EDP Sciences] [CrossRef] [NASA ADS]
- Enßlin, T. A., Biermann, P. L., Klein, U., & Kohle, S. 1998, A&A, 332, 395 [NASA ADS]
- Evrard, A. E., & Gioia, I. M. 2002, in Merging Processes in Galaxy Clusters, ed. L. Feretti, I. M. Gioia, & G. Giovannini, Ap&SS Library, 272, 253
- Feretti, L., & Giovannini, G. 1996, in Extragalactic Radio Sources, ed. R. D. Ekers, C. Fanti, & L. Padrielli, IAU Symp., 175, 333
- Feretti, L., Boehringer, H., Giovannini, G., & Neumann, D. 1997, A&A, 317, 432 [NASA ADS]
- Feretti, L., Orrù, E., Brunetti, G., et al. 2004, A&A, 423, 111 [EDP Sciences] [CrossRef] [NASA ADS]
- Fujita, Y., Takizawa, M., & Sarazin, C. L. 2003, ApJ, 584, 190 [CrossRef] [NASA ADS]
- Garrett, M. A., de Bruyn, A. G., Giroletti, M., Baan, W. A., & Schilizzi, R. T. 2000, A&A, 361, L41 [NASA ADS]
- Giovannini, G., Feretti, L., & Stanghellini, C. 1991, A&A, 252, 528 [NASA ADS]
- Giovannini, G., Feretti, L., Venturi, T., Kim, K.-T., & Kronberg, P. P. 1993, ApJ, 406, 399 [CrossRef] [NASA ADS]
- Giacintucci, S., Venturi, T., Brunetti, G., et al. 2005, A&A, 440, 867 [EDP Sciences] [CrossRef] [NASA ADS]
- Govoni, F., & Feretti, L. 2004, Int. J. Mod. Phys. D, 13, 1549 [CrossRef] [NASA ADS]
- Govoni, F., Murgia, M., Feretti, L., et al. 2005, A&A, 430, L5 [EDP Sciences] [CrossRef] [NASA ADS]
- Govoni, F., Murgia, M., Feretti, L., et al. 2006, A&A, 460, 425 [EDP Sciences] [CrossRef] [NASA ADS]
- Harris, D. E., Kapahi, V. K., & Ekers, R. D. 1980, A&AS, 39, 215 [NASA ADS]
- Harris, F. J. 1978, in Institute of Electrical and Electronics Engineers, Inc. Conf., Proc. IEEE, 66, 51
- Högbom, J. A. 1974, A&AS, 15, 417 [NASA ADS]
- Horner, D. 2001, Ph.D. Thesis, University of Meryland
- Intema, H. 2007, in From Planets to Dark Energy: the Modern Radio Universe. October 1-5 2007, The University of Manchester, UK. Published online at SISSA, Proc. Sci., 101
- Jaffe, W. J. 1977, ApJ, 212, 1 [CrossRef] [NASA ADS]
- Jaffe, W. J., & Perola, G. C. 1973, A&A, 26, 423 [NASA ADS]
- Kardashev, N. S. 1962, SvA, 6, 317 [NASA ADS]
- Keshet, U., Waxman, E., Loeb, A., Springel, V., & Hernquist, L. 2003, ApJ, 585, 128 [CrossRef] [NASA ADS]
- Keshet, U., Waxman, E., & Loeb, A. 2004a, ApJ, 617, 281 [CrossRef] [NASA ADS]
- Keshet, U., Waxman, E., & Loeb, A. 2004b, New Astron. Rev., 48, 1119 [CrossRef] [NASA ADS]
- Miller, N. A., & Owen, F. N. 2003, AJ, 125, 2427 [CrossRef] [NASA ADS]
- Miniati, F. 2003, MNRAS, 342, 1009 [CrossRef] [NASA ADS]
- Mullis, C. R., Henry, J. P., Gioia, I. M., et al. 2001, ApJ, 553, L115 [CrossRef] [NASA ADS]
- Navarro, J. F., Frenk, C. S., & White, S. D. M. 1995, MNRAS, 275, 56 [NASA ADS]
- Orrú, E., Murgia, M., Feretti, L., et al. 2007, A&A, 467, 943 [EDP Sciences] [CrossRef] [NASA ADS]
- Pacholczyk, A. G. 1970, Radio astrophysics. Nonthermal processes in galactic and extragalactic sources, Series of Books in Astronomy and Astrophysics, (San Francisco: Freeman)
- Parma, P., Murgia, M., de Ruiter, H. R., et al. 2007, A&A, 470, 875 [EDP Sciences] [CrossRef] [NASA ADS]
- Petrosian, V. 2001, ApJ, 557, 560 [CrossRef] [NASA ADS]
- Petrosian, V. 2003, in ASP Conf. Ser. 301, ed. S. Bowyer, & C.-Y. Hwang, 337
- Pizzo, R. F., & de Bruyn, A. G. 2008, in Extragalactic Jets: Theory and Observation from Radio to Gamma Ray, ed. T. A. Rector, & D. S. De Young, ASP Conf. Ser., 386, 368
- Pizzo, R. F., de Bruyn, A. G., Feretti, L., & Govoni, F. 2008, A&A, 481, L91 [EDP Sciences] [CrossRef] [NASA ADS]
- Rottgering, H. J. A., Wieringa, M. H., Hunstead, R. W., & Ekers, R. D. 1997, MNRAS, 290, 577 [NASA ADS]
- Sakelliou, I., & Ponman, T. J. 2006, MNRAS, 367, 1409 [CrossRef] [NASA ADS]
- Sijbring, D., & de Bruyn, A. G. 1998, A&A, 331, 901 [NASA ADS]
- Struble, M. F., & Rood, H. J. 1999, ApJS, 125, 35 [CrossRef] [NASA ADS]
- Subrahmanyan, R., Beasley, A. J., Goss, W. M., Golap, K., & Hunstead, R. W. 2003, AJ, 125, 1095 [CrossRef] [NASA ADS]
- Sunyaev, R. A., Norman, M. L., & Bryan, G. L. 2003, Astron. Lett., 29, 783 [CrossRef] [NASA ADS]
- Tribble, P. C. 1993, MNRAS, 263, 31 [NASA ADS]
- Vallee, J. P. 1988, Ap&SS, 149, 225 [CrossRef] [NASA ADS]
- Vallee, J. P., & Roger, R. S. 1987, AJ, 94, 1 [CrossRef] [NASA ADS]
- Venturi, T., Bardelli, S., Morganti, R., & Hunstead, R. W. 1998, MNRAS, 298, 1113 [CrossRef] [NASA ADS]
- Yuan, Q., Zhou, X., & Jiang, Z. 2003, VizieR Online Data Catalog, 214, 90053 [NASA ADS]
All Tables
Table 1: The flux calibrators used during the data reduction.
Table 2: Observations overview.
Table 3: Parameters of the observations and of the final full resolution maps.
Table 4: The extended radio galaxies of A2255.
Table 5: Parameters of the halo and the relics derived from the full resolution maps.
Table 6: Parameters of the NW region of the halo and of the NE relic derived from the images produced with the same uv coverage and the same resolution.
Table 7: Fluxes and equipartition parameters of the Beaver radio galaxy.
Table 8: Physical parameters of the X-ray emitting gas at the location of the Beaver.
All Figures
|
|
Figure 1:
Grey scale images of 4C +64.21 at 25 cm before (
left panel) and after ( right panel)
applying the peeling procedure. The resolution is
|
| Open with DEXTER | |
| In the text | |
|
|
Figure 2: Observed noise level uncorrected for the primary beam as a function of distance from the field center for the 2 m ( left panel), 85 cm ( middle panel), and 25 cm ( right panel) maps. The dashed line represents the estimated thermal noise level, again uncorrected for the primary beam. |
| Open with DEXTER | |
| In the text | |
|
|
Figure 3:
Grey scale images of A2255 at 25 cm ( top left panel),
85 cm ( top right panel), and 2 m (
bottom panel). All images cover the same area of the sky. The
resolutions are
|
| Open with DEXTER | |
| In the text | |
|
|
Figure 4:
Top panel: big field grey scale image of
A2255 at 25 cm. The radio galaxies Bean, Embryo, and Beaver
are visible, at large distance from the cluster center. The resolution
is
|
| Open with DEXTER | |
| In the text | |
|
|
Figure 5:
Composite images of A2255 obtained from superposing the radio and
optical images. The WSRT 85 cm radio map (in grey)
for the total field ( central panel), NW relic (
bottom left panel), and SW relic ( bottom right panel)
are shown overlaid on the red band Digitized Sky Survey image (black
and white). The radio image has a resolution of
|
| Open with DEXTER | |
| In the text | |
|
|
Figure 6:
Contour map of A2255 at 85 cm. The resolution is
|
| Open with DEXTER | |
| In the text | |
|
|
Figure 7:
Contour map of A2255 at 2 m. The resolution is
|
| Open with DEXTER | |
| In the text | |
|
|
Figure 8:
Map at 2 m of the new extended emission region to the NW of
the halo of A2255 after the subtraction of the model of point
sources
detected at 25 cm (see text). The result suggests that the new
feature
is genuine and not due to a collection of point sources. The
resolution of the map is
|
| Open with DEXTER | |
| In the text | |
|
|
Figure 9:
Spectral index map of A2255 between 25 cm and
85 cm, with a
resolution of
|
| Open with DEXTER | |
| In the text | |
|
|
Figure 10:
Spectral index map of A2255 between 85 cm and
2 m, with a
resolution of 163
|
| Open with DEXTER | |
| In the text | |
|
|
Figure 11:
Spectral index profile of the NE relic between 25 cm and 85
cm along the minor axis ( left panel) and
the main axis ( right
panel). For the former the distance is from the cluster
center, for
the latter the distance is from position
|
| Open with DEXTER | |
| In the text | |
|
|
Figure 12: Radio spectra of the integrated emission of the radio halo ( left panel) and of the NE radio relic ( right panel) for the frequency range 2 m-25 cm. For this spectral comparison, we have computed the fluxes of the halo in its NW region. |
| Open with DEXTER | |
| In the text | |
|
|
Figure 13:
Comparison between the morphologies of the Beaver radio
galaxy at 25 cm ( left panel) and
85 cm ( right panel). The
25 cm map
has been convolved with the 85 cm beam (54
|
| Open with DEXTER | |
| In the text | |
|
|
Figure 14:
Spectral index map of the Beaver radio galaxy between
25 cm
and 85 cm, with a resolution of 163
|
| Open with DEXTER | |
| In the text | |
|
|
Figure 15:
Spectral index map of the Beaver radio galaxy between
85 cm
and 2 m, with a resolution of 163
|
| Open with DEXTER | |
| In the text | |
![\begin{figure}
\par\mbox{\includegraphics[width=5.8cm,clip]{1246516a.eps}\hspace*{4mm}
\includegraphics[width=5.8cm,clip]{1246516b.eps} }\end{figure}](/articles/aa/full_html/2009/44/aa12465-09/img186.png)
|
Figure
16: Radio spectra of the head ( left panel) and the tail ( right panel) of the Beaver radio galaxy in the frequency range 2 m-25 cm. |
| In the text | |
|
|
Figure 17:
Right panel: point to point spectral index
between 85 cm and 2 m. The |
| Open with DEXTER | |
| In the text | |
|
|
Figure 18:
Fluxes of region A ( left panel) and region B (
right panel) fitted with the JP model. |
| Open with DEXTER | |
| In the text | |
Copyright ESO 2009
Current usage metrics show cumulative count of Article Views (full-text article views including HTML views, PDF and ePub downloads, according to the available data) and Abstracts Views on Vision4Press platform.
Data correspond to usage on the plateform after 2015. The current usage metrics is available 48-96 hours after online publication and is updated daily on week days.
Initial download of the metrics may take a while.