| Issue |
A&A
Volume 507, Number 2, November IV 2009
|
|
|---|---|---|
| Page(s) | 581 - 588 | |
| Section | Astrophysical processes | |
| DOI | https://doi.org/10.1051/0004-6361/200912262 | |
| Published online | 17 September 2009 | |
A&A 507, 581-588 (2009)
Time-dependent MHD shocks and line intensity ratios in the HH 30 jet: a focus on cooling function and numerical resolution
O. Tesileanu1,2 - S. Massaglia2 - A. Mignone2 - G. Bodo3 - F. Bacciotti4
1 - RCAPA - Department of Physics, University of Bucharest,
CP MG-11, RO-077125, Bucuresti-Mãgurele, Romania
2 -
Dipartimento di Fisica Generale dell'Università,
via Pietro Giuria 1, 10125 Torino, Italy
3 -
INAF - Osservatorio Astronomico di Torino, Viale Osservatorio 20, 10025
Pino Torinese, Italy
4 -
INAF - Osservatorio Astrofisico di Arcetri, Largo E. Fermi 5, 50125
Firenze, Italy
Received 2 April 2009 / Accepted 18 August 2009
Abstract
Context. The coupling between time-dependent,
multidimensional MHD numerical codes and radiative line emission is of
utmost importance in the studies of the interplay between dynamical and
radiative processes in many astrophysical environments, with particular
interest for problems involving radiative shocks. There is a widespread
consensus that line emitting knots observed in Herbig-Haro jets can be
interpreted as radiative shocks. Velocity perturbations at the jet base
steepen into shocks to emit the observed spectra. To derive the
observable characteristics of the emitted spectra, such as line
intensity ratios, one has to study physical processes that involve the
solution of the MHD equations coupled with radiative cooling in
non-equilibrium conditions.
Aims. In this paper we address two different aspects relevant to
the time-dependent calculations of the line intensity ratios of
forbidden transitions, resulting from the excitation by planar,
time-dependent radiative shocks traveling in a stratified medium. The
first one concerns the impact of the radiation and ionization processes
included in the cooling model, and the second one the effects of the
numerical grid resolution.
Methods. Dealing with both dynamical and radiative processes in
the same numerical scheme means to treat phenomena characterized by
different time and length scales. This may be especially arduous and
computationally expensive when discontinuities are involved, such as in
the case of shocks. Adaptive mesh refinement (AMR) methods have been
introduced in order to alleviate these difficulties. In this paper we
apply the AMR methodology to the treatment of radiating shocks and show
how this method is able to vastly reduce the integration time.
Results. The technique is applied to the knots of the HH 30
jet to obtain the observed line intensity ratios and derive the
physical parameters, such as density, temperature and ionization
fraction. We consider the impact of two different cooling functions and
different grid resolutions on the results.
Conclusions. We conclude that the use of different cooling
routines has effects on results whose weight depends upon the line
ratio considered. Moreover, we find the minimum numerical resolution of
the simulation grid behind the shock to achieve convergence in the
results. This is crucial for the forthcoming 2D calculations of
radiative shocks.
Key words: ISM: jets and outflows - ISM: Herbig-Haro objects - magnetohydrodynamics (MHD) - shock waves - methods: numerical
1 Introduction
Supersonic flows are ubiquitous in the Universe: expanding supernova remnants, stellar winds, AGN and Herbig-Haro jets are some examples, and shocks are abundant and prominent in these flows. Shocks located in extragalactic environments, such as AGN jets, can be considered adiabatic, since the cooling time for thermal emission typically exceeds by far the source lifetime. On the other hand, shocks that form in galactic objects such as supernova remnants and Herbig-Haro jets must be treated including radiative effects.Radiative shocks have been studied in steady-state conditions by several authors (e.g. Cox &
Raymond 1985; Hartigan et al. 1994), who derived
the one-dimensional post-shock behavior of various physical parameters (temperature,
ionization fraction, electron density, etc.), as
functions of the distance from the shock front. From these
studies it turns out that the physical parameters vary behind the shock
front on scale lengths that differ by orders of magnitude,
and this becomes a major problem when tackling the
time-dependent evolution of such radiative shocks.
For example, in Herbig-Haro jets, one needs to treat in the same scheme
spatial scales well below ![]() 1013 cm,
to reproduce the time-dependent post-shock temperature
variations correctly, and scales
1013 cm,
to reproduce the time-dependent post-shock temperature
variations correctly, and scales ![]() 1015 cm to study the behavior of the
electron density (Massaglia et al. 2005a, Paper I).
Under these conditions and with these requirements, employing an adaptive mesh refinement (AMR)
technique becomes almost mandatory. This technique can
provide adequate spatial and temporal resolution by dynamically
adapting the grid to the moving regions of interest, giving
a tremendous saving in computational time
and memory overhead with respect to the more traditional uniform grid approach.
1015 cm to study the behavior of the
electron density (Massaglia et al. 2005a, Paper I).
Under these conditions and with these requirements, employing an adaptive mesh refinement (AMR)
technique becomes almost mandatory. This technique can
provide adequate spatial and temporal resolution by dynamically
adapting the grid to the moving regions of interest, giving
a tremendous saving in computational time
and memory overhead with respect to the more traditional uniform grid approach.
The important issue of numerical spatial resolution in
time-dependent simulations of radiative shocks in 2D has been considered by Raga et al. (2007)
employing an AMR technique as well. They discussed the dependence of the morphological structure of the
perturbations depending on the grid resolution. Their maximum grid resolution was with a cell
size corresponding to
![]() cm. They found that while the detailed structure of the
shocks depends on the resolution, the emission line luminosities, integrated over the volume, are less dependent
on cell size.
cm. They found that while the detailed structure of the
shocks depends on the resolution, the emission line luminosities, integrated over the volume, are less dependent
on cell size.
A second crucial question is: does the dependence on the cooling function details have qualitative or quantitative effects on the calculated distributions of the physical parameters? Tesileanu et al. (2008) have developed a detailed treatment including an ionization network of 29 species and compared, at constant numerical resolution, the resulting distribution of physical parameters (such as temperature, density, etc.) with the one obtained employing the simplified cooling of Paper I, for a 2D cylindrical jet affected by perturbations that evolved in internal working surfaces. They found quantitative differences but qualitatively the outcomes were very similar.
A more challenging problem than the determination of the integrated line emissions and distributions of physical parameters is the calculation of line intensity ratios between different species. In this case, the fractional abundances of the various species vary in very different ways with space behind the shocks (see Paper I). This variation is mainly governed by the temperature profile, which is typically a very steep function of space. Therefore we will examine the effects of both the details of the cooling function and of the grid resolution adopted.
As discussed in Paper I and Massaglia et al. (2005b), observations of some HH jets at distances of a few arcseconds from the source typically show that the behavior of temperature, ionization and density along the jet is incompatible with a freely cooling jet. It is now generally accepted that the line emission in HH jets is a result of the observation of several post-shock regions of high excitation with a filling factor of about 1%. In our calculations, we will refer, in particular, to the observational results described in Bacciotti et al. (1999), where a specialized diagnostic technique has been applied to HST data of the HH 30 jet. Hartigan & Morse (2007) also re-examined the HH 30 case using slitless spectroscopy performed with the Hubble Space Telescope Imaging Spectrograph. Their results are fully consistent with the findings in Bacciotti et al. (1999).
In this paper, we will follow the dynamical evolution of an initial perturbation as it steepens into a (radiative)
shock traveling along the jet, and derive the post-shock physical parameters consistently.
From these parameters, we construct the synthetic theoretical emission line ratios to
be compared with observations.
Using this setup, we implicitly consider that the medium in the real jet returns close
to the steady jet conditions between the propagating shocks. This was verified in parallel
2D simulations (Tesileanu et al. 2009), as the 1D simulation, being done
in the reference frame of the mean flow, lacks the steady flow of the jet.
After the shock and the high-density post-shock zone pass, there follows an underdense zone,
and then the medium returns to the stationary conditions of the constant flow. The distance
after which this happens increases during the evolution of the shock from
![]() cm
close to the jet base to about 1015 cm at 500 AU from the base. This increasing distance
becomes resolved observationally at about 200 AU from the base of the jet, and also at such
distances interactions between different shockwaves become likely, these being possible
explanations for the oscillations visible in the observational data after 200 AU.
The emission at each point of the jet is
computed by simulating the propagation of a shock produced at the base of the jet up to
that point.
As discussed before, we will adopt two different treatments for the radiative losses, namely:
i) the simplified cooling employed in Paper I and ii) the new cooling treatment described
in Tesileanu et al. (2008).
cm
close to the jet base to about 1015 cm at 500 AU from the base. This increasing distance
becomes resolved observationally at about 200 AU from the base of the jet, and also at such
distances interactions between different shockwaves become likely, these being possible
explanations for the oscillations visible in the observational data after 200 AU.
The emission at each point of the jet is
computed by simulating the propagation of a shock produced at the base of the jet up to
that point.
As discussed before, we will adopt two different treatments for the radiative losses, namely:
i) the simplified cooling employed in Paper I and ii) the new cooling treatment described
in Tesileanu et al. (2008).
The plan of the paper is the following: in Sect. 2 we present the computation setup and the adopted techniques to model the problem; in Sect. 3 we apply the model to the case of HH 30 and discuss the results obtained with the two cooling functions and the effects of the grid resolution; the conclusions are drawn in Sect. 4.
2 The model
In this Section we give a general outline of the model and the form of the initial perturbation. More details on the setup can be found in Paper I, where we analyzed the case of the DGTau jet.
As mentioned in the Introduction, in the preshock conditions
assumed here (decreasing density departing from a few 104 cm-3,
uniform temperature of 2000 K)
the post-shock temperature drops by about one order of magnitude
over a scale length lower than ![]() 1013 cm i.e. a much smaller
distance than the post-shock evolution that goes on over
distances of a few times 1015 cm. This has been a
compelling reason for developing and employing adaptive mesh refinement,
as in Paper I, described in detail in a companion paper (Mignone et al. 2009).
We have verified the validity of this approach by computing
several of the models presented in the next section on uniform
and adaptive meshes and found a tremendous gain in efficiency.
Figures 1 and 2 show the results of
one particular model computed on a uniform grid employing
49 152 zones and on an equivalent adaptive grid with 5 levels
of refinement (base level resolution is 1536 zones).
On a Pentium IV processor with a 1.7 GHz clock and 1 GB of RAM,
the uniform grid approach took about
1013 cm i.e. a much smaller
distance than the post-shock evolution that goes on over
distances of a few times 1015 cm. This has been a
compelling reason for developing and employing adaptive mesh refinement,
as in Paper I, described in detail in a companion paper (Mignone et al. 2009).
We have verified the validity of this approach by computing
several of the models presented in the next section on uniform
and adaptive meshes and found a tremendous gain in efficiency.
Figures 1 and 2 show the results of
one particular model computed on a uniform grid employing
49 152 zones and on an equivalent adaptive grid with 5 levels
of refinement (base level resolution is 1536 zones).
On a Pentium IV processor with a 1.7 GHz clock and 1 GB of RAM,
the uniform grid approach took about
![]() s, while the AMR computation required only 238 s, up to
the same final integration time
s, while the AMR computation required only 238 s, up to
the same final integration time
![]() .
.
2.1 Model equations and initial perturbation
We restrict our attention to one-dimensional MHD planar flow, which implies that
we are following the shock evolution along the jet axis.
The fluid is described in terms of its density ![]() ,
velocity u, thermal pressure p and (transverse) magnetic
field By. These quantities obey the standard MHD equations
for conservation of mass, momentum, magnetic field and
total energy, in the presence of radiative cooling represented by
the energy loss term
,
velocity u, thermal pressure p and (transverse) magnetic
field By. These quantities obey the standard MHD equations
for conservation of mass, momentum, magnetic field and
total energy, in the presence of radiative cooling represented by
the energy loss term
![]() (energy per
unit volume per unit time), which depends on the temperature T and
on the ionization state of the plasma, described by the vector of
ionization fractions X. A discussion on the cooling function
follows in the next subsection.
(energy per
unit volume per unit time), which depends on the temperature T and
on the ionization state of the plasma, described by the vector of
ionization fractions X. A discussion on the cooling function
follows in the next subsection.
A nonuniform preshock density that decreases away from the star is a reasonable
assumption when dealing with an expanding jet, as suggested by observations.
We note that shocks propagating into a stratified medium
tend to increase their amplitude when they find a decreasing preshock density.
We consider the following form for the preshock density:
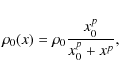
|
(1) |
where x is the spatial coordinate along the jet axis, x0 sets the initial steepness of the density function (this affects the shock evolution even at larger distances) and
![\begin{figure}
\par\includegraphics[width=8cm,clip]{12262fg1.eps}
\end{figure}](/articles/aa/full_html/2009/44/aa12262-09/img22.png)
|
Figure 1: Snapshot of the temperature behavior vs. distance for the uniform grid, for a propagating shock in a stratified medium. |
| Open with DEXTER | |
![\begin{figure}
\par\includegraphics[width=8cm,clip]{12262fg2.eps}
\end{figure}](/articles/aa/full_html/2009/44/aa12262-09/img23.png)
|
Figure 2: The same as in Fig. 1 but for the AMR integration and five levels of refinement, for an equivalent resolution of 49 152 cells, with a zoom on the shock region. The histogram in the lower part of the plot (with the right vertical scale) represents the refinement level employed in each cell of the simulation. |
| Open with DEXTER | |
As in Paper I, the form of the initial perturbation has been taken in
such a way as to keep the hydrodynamic Riemann
invariant
![]() .
In this way a single forward shock is formed.
In this scheme, the density perturbation is:
.
In this way a single forward shock is formed.
In this scheme, the density perturbation is:
![\begin{displaymath}\rho=\left[ \frac{\gamma-1}{2 \sqrt{K\gamma}} (u-U_0)+\rho_0^{\frac{\gamma-1}{2}}
\right]^{\frac{2}{\gamma-1}} ,
\end{displaymath}](/articles/aa/full_html/2009/44/aa12262-09/img25.png)
where K is a constant derived from the single shock assumption,
![\begin{eqnarray*}u(x)=
\left\{ \begin{array}{ll}
u_0 \left[-(x-x_{\rm 1})^2 + 2 ...
...\rm 1} \\ [2mm]
0 & \quad \; {\rm otherwise}
\end{array} \right.
\end{eqnarray*}](/articles/aa/full_html/2009/44/aa12262-09/img27.png)
where u0 is the perturbation amplitude,
In carrying out the calculations we have set U0(x)=0, i.e. the reference frame is that of the mean flow (that is, the steady jet flow on which the perturbation is set). To transforme the results back to the laboratory frame we have set U0=100 km s-1, which is the bulk velocity we assume for the HH 30 jet (U0 must not be mistaken for u0, the initial velocity perturbation amplitude).
The boundary conditions assume free outflow at x=0 and x=L.
The extent of the computational domain, L, has been chosen
sufficiently large to follow the shock evolution for
![]() yrs and to avoid spurious interactions with the boundaries.
For this reason, we adopt
yrs and to avoid spurious interactions with the boundaries.
For this reason, we adopt
![]() cm.
cm.
The assumption of a monoatomic gas is justified in the case of HH30 and many other YSO jets - however, there are cases (the so-called ''molecular jets``) when this assumption is not valid anymore, and molecular cooling must be taken into account.
2.2 Radiative cooling
In the current work we use two different approaches for the computation of the
radiative cooling loss term
![]() .
In a first
simplified model (see Paper I), X consists of the ionization fraction
of H only, whereas a second, more accurate treatment is summarized below.
.
In a first
simplified model (see Paper I), X consists of the ionization fraction
of H only, whereas a second, more accurate treatment is summarized below.
In the detailed cooling treatment, described in Tesileanu et al. (2008),
28 additional evolutionary equations are solved for
the non-equilibrium ionization fractions X (of H, He, C,
N, O, Ne and S).
The loss term accounts for energy lost in lines as well as in the ionization
and recombination processes. Line emissions include contributions
from transitions of the 29 ion species.
The metal abundances are the ones adopted by Bacciotti et al. (1999),
in particular
![]() ,
,
![]() ,
,
![]() and the abundance of
and the abundance of ![]() is 10% of the solar one.
is 10% of the solar one.
To carry out comparisons between the observed and computed line intensity
ratios, we have determined the populations of the atomic levels relevant for
[SII], [NII] and [OI] emission, solving the excitation - de-excitation equilibrium
equations for five energy levels, according to Osterbrock & Ferland (2006).
The line emissions reported in Bacciotti et al. (1999) for the HH 30 jet
are: [SII]]
![]() ,
[NII]
,
[NII]
![]() and [OI]
and [OI]
![]() ,
and the corresponding intensity ratios [OI]/[NII] and [SII]/[OI].
,
and the corresponding intensity ratios [OI]/[NII] and [SII]/[OI].
3 The case of the HH 30 jet
To illustrate the astrophysical application of the above methodology, we will apply it to the numerical simulation of some of the physical properties of the HH 30 jet.
We have integrated the magneto-fluid equations employing the AMR method
described previously with eight levels of refinement, using the PLUTO code
(Mignone et al. 2007).
As in Paper I, in order to obtain values directly comparable with observations,
we have space averaged all post-shock quantities at each evolutionary time point:
\} \ {\rm d}x}
\end{displaymath}](/articles/aa/full_html/2009/44/aa12262-09/img37.png)
|
(3) |
where Q(x,t) is a physical quantity such as electron density or ionization fraction or temperature. This procedure is applied because by processing the observational data, we only have access to the physical parameters of the line-emitting regions, so this weighting is implicit. Differently from Paper I, where we averaged the line intensity ratios using the total line emissivity of the corresponding emitters as weighting functions, in the present paper we find the unweighted average of the line emissivity and calculate the ratio of the average lines afterward. This procedure does not lead to results that differ qualitatively from the previous ones, but appears closer to the actual observation process. To calculate the line emissivities, the atomic transition rates and collision strengths adopted are the ones described in Tesileanu et al. (2008). The collision strengths have been interpolated using a Lagrangian scheme to account for their temperature dependence.
The main free parameters of the model are: the
particle density (at x=0) n0, x0, the velocity perturbation amplitude u0 and
initial transverse magnetic field B0. Taking advantage of the peculiar efficiency of
the AMR method, we have widely explored this parameter space to find good agreement with the
observed line ratios. We have set the (uniform)
preshock temperature T0=1000 K and the initial ionization fraction
![]() ,
i.e. due to the metal contribution only.
,
i.e. due to the metal contribution only.
Both radiative cooling treatments were employed in the simulations, searching for the best agreement of the model results with the observations for each one. A discussion of the differences in the results follows.
3.1 Simplified cooling
The simplicity of this cooling model allows for rapid simulations, and thus the
very efficient exploration of the parameter space.
The root mean square deviations of the simulated line ratios with respect to
the observational ones were computed (a few examples are shown in Table 1)
in order to quantitatively estimate how close each simulation is to observations.
The simulations presented in the table have base densities of
![]() cm-3
(n2e4) or
cm-3
(n2e4) or
![]() cm-3 (n5e4), transverse magnetic field 300
cm-3 (n5e4), transverse magnetic field 300 ![]() G (b300)
or 500
G (b300)
or 500 ![]() G (b500), and amplitude of the perturbation in velocity 50 (v50), 55 (v50)
and 70 km s-1 (v70).
G (b500), and amplitude of the perturbation in velocity 50 (v50), 55 (v50)
and 70 km s-1 (v70).
Table 1: Root mean square deviations of line ratios with simplified cooling.
A combination of the parameters that yielded a reasonably good agreement with the observed
line intensity ratios, employing the simplified cooling model, was
![]() cm-3,
cm-3,
![]() G,
G,
![]() and
u0=50 km s-1. In Paper I for the DG Tau jet we set p=2, in the present
case a better agreement is obtained setting p=1, i.e. for a less steep decrease of the
preshock density with distance, i.e. a slower expansion rate for the jet as it propagates into
the ambient medium. This can be explained by the higher degree of collimation of the HH 30 jet.
A comparison with Paper I shows also that u0 is lower in this case
with respect to the DG Tau parameters, i.e. u0=50 km s-1 instead of u0=70 km s-1; this
is reflected in the value of the ionization fraction, considerably lower for HH 30.
Moreover, we note
a higher value of B0 that must be assumed in the present case with respect to DG Tau.
The results are shown in Fig. 3, where we plot the
observed line intensity ratios of [OI]/[NII] (bullets) and [SII]/[OI] (circles)
(as reported by Bacciotti et al. 1999) and, superimposed, the corresponding
model curves (
and
u0=50 km s-1. In Paper I for the DG Tau jet we set p=2, in the present
case a better agreement is obtained setting p=1, i.e. for a less steep decrease of the
preshock density with distance, i.e. a slower expansion rate for the jet as it propagates into
the ambient medium. This can be explained by the higher degree of collimation of the HH 30 jet.
A comparison with Paper I shows also that u0 is lower in this case
with respect to the DG Tau parameters, i.e. u0=50 km s-1 instead of u0=70 km s-1; this
is reflected in the value of the ionization fraction, considerably lower for HH 30.
Moreover, we note
a higher value of B0 that must be assumed in the present case with respect to DG Tau.
The results are shown in Fig. 3, where we plot the
observed line intensity ratios of [OI]/[NII] (bullets) and [SII]/[OI] (circles)
(as reported by Bacciotti et al. 1999) and, superimposed, the corresponding
model curves (![]() OI
OI![]() /
/![]() NII
NII![]() dot-dashed line
and
dot-dashed line
and ![]() SII
SII![]() /
/![]() OI
OI![]() solid line).
Since the model proposed is extremely simple, we mainly aim, as
shown in Fig. 3, to obtain values of the intensity
ratios and trends with distance that are reasonably close to the ones observed,
and we cannot account for the knots of emission visible along the HH 30 jet, resulting in
ample spatial oscillations of the line intensity ratios, especially in the [OI]/[NII] ratio.
solid line).
Since the model proposed is extremely simple, we mainly aim, as
shown in Fig. 3, to obtain values of the intensity
ratios and trends with distance that are reasonably close to the ones observed,
and we cannot account for the knots of emission visible along the HH 30 jet, resulting in
ample spatial oscillations of the line intensity ratios, especially in the [OI]/[NII] ratio.
Note also that a different choice of the metal abundances can
shift the model lines of Fig. 3 by some percent; e.g. Lodders (2003) reports
![]() ,
,
![]() and
and
![]() .
.
![\begin{figure}
\par\includegraphics[width=9cm,clip]{12262fg3.eps}
\end{figure}](/articles/aa/full_html/2009/44/aa12262-09/img47.png)
|
Figure 3:
Intensity ratios of [SII]]
|
| Open with DEXTER | |
In Fig. 4 we plot the physical parameters that are derived with a special
diagnostic technique from observations
by Bacciotti et al. (1999) (symbols) compared to the outcome of the present model (lines).
We note that the electron density derived from the shock model
(dashed line) exceeds the one derived by Bacciotti et al. (1999) (circles)
for distances below ![]() 1''. As discussed in
Paper I, however, when the electron density is above the critical density, the ratio
of observed [SII] lines, from which
1''. As discussed in
Paper I, however, when the electron density is above the critical density, the ratio
of observed [SII] lines, from which ![]() is derived, saturates, and
the diagnostic in this condition, as reported in the aforementioned paper,
yields only lower limits to the electron density. The discrepancy in the
electron density affects the diagnostics of temperature (diamonds)
that differs from the model one (solid line).
is derived, saturates, and
the diagnostic in this condition, as reported in the aforementioned paper,
yields only lower limits to the electron density. The discrepancy in the
electron density affects the diagnostics of temperature (diamonds)
that differs from the model one (solid line).
![\begin{figure}
\par\includegraphics[width=9cm,clip]{12262fg4.eps}
\end{figure}](/articles/aa/full_html/2009/44/aa12262-09/img49.png)
|
Figure 4: Average physical parameters of the jet derived from observations following Bacciotti et al. (1999) (symbols) and from the model with simplified cooling (curves). Temperature (diamonds, solid line), electron density (circles, dashed) and ionization fraction (bullets, dot-dashed). |
| Open with DEXTER | |
3.2 Detailed cooling
The previous cooling model might be an oversimplified approximation in the case of moderately powerful shocks such as the ones we are dealing with here. This leads to one of the motivations of this paper: a comparative study of the differences between and advantages of each of the two approaches to radiative cooling treatment.
Employing the detailed cooling model, we have explored the parameter space for the
same setup as in the previous case.
The same method of estimating the root mean square deviation with respect to observations
was employed. The best agreement with the observed
line intensity ratios was obtained for the following parameters:
![]() cm-3,
cm-3,
![]() G,
G,
![]() ,
u0=55 km s-1 and p=1. The resulting line ratios are plotted in
Fig. 5 and the evolution of the physical parameters in
Fig. 6. In this scheme, the full ionization state of the plasma is
computed at each step, allowing for non-equilibrium states. This of course also has
a serious impact on the simulation speed, because of the supplementary
equations in the system.
,
u0=55 km s-1 and p=1. The resulting line ratios are plotted in
Fig. 5 and the evolution of the physical parameters in
Fig. 6. In this scheme, the full ionization state of the plasma is
computed at each step, allowing for non-equilibrium states. This of course also has
a serious impact on the simulation speed, because of the supplementary
equations in the system.
![\begin{figure}
\par\includegraphics[width=9cm,clip]{12262fg5.eps}
\end{figure}](/articles/aa/full_html/2009/44/aa12262-09/img51.png)
|
Figure 5:
Intensity ratios of [SII]]
|
| Open with DEXTER | |
The spatial profile of the physical parameters is similar to the one obtained in the best agreement case employing the simplified cooling. The same considerations of the underestimation of the electron density close to the source apply.
By applying the set of simulation parameters resulting from the simulations with detailed cooling to the setup employing simplified cooling, important differences appear. Due to the higher overall density of the plasma and the much simpler chemistry in the simplified cooling case, the electron density remains at values above the ones derived from observations by a factor of 3 along the evolution of the shock. This is also reflected in the line ratios that depart from the observed ones by a factor of 2 for the [OI]/[NII] and 20% for the [SII]/[OI] ratios, triggered by the higher maximum temperatures attained.
3.3 On the importance of numerical resolution
It is important to understand the resolution needed for these simulations,
before moving to 2D configurations (Tesileanu et al. 2009).
A rough estimation of the resolution needed in order to resolve the post-shock zone
can be done as follows: for a maximum peak temperature of about 105 K and densities of ![]() 105 cm-3, the internal energy density of the gas is of the order of
10-6 erg cm-3.
According to previous computations (see Tesileanu et al. 2008), the maximum
energy loss rate in radiative cooling processes in these conditions is
105 cm-3, the internal energy density of the gas is of the order of
10-6 erg cm-3.
According to previous computations (see Tesileanu et al. 2008), the maximum
energy loss rate in radiative cooling processes in these conditions is ![]() 10-12 erg cm-3 s-1.
Allowing for a maximum relative change in internal energy of 1% in a timestep, the size of
the timestep is restricted to about 104 s, which combined with the jet velocity of a
few hundreds km s-1 leads to a space scale of
10-12 erg cm-3 s-1.
Allowing for a maximum relative change in internal energy of 1% in a timestep, the size of
the timestep is restricted to about 104 s, which combined with the jet velocity of a
few hundreds km s-1 leads to a space scale of ![]() 1011 cm.
Even higher resolutions, of a few times 1010cm, are needed to accurately resolve the
ionization/recombination processes (with timescales of
1011 cm.
Even higher resolutions, of a few times 1010cm, are needed to accurately resolve the
ionization/recombination processes (with timescales of ![]() 103 s). For the setups used
in this work, this spatial resolution is attained with 8 levels of refinement.
103 s). For the setups used
in this work, this spatial resolution is attained with 8 levels of refinement.
We have studied the effect of increasing resolution on the line ratios and found it to be
important up to a saturation value above which the line ratios do not change significantly.
For this, we have computed the root mean square deviations between the simulated values
of the line ratios with an increasing number of refinement levels. The results are presented in
Table 2, where the first column shows the number of refinement levels in the simulations
between which the rms deviations were computed. Each refinement level doubles the
resolution. Three configurations are presented: one with base density
![]() cm-3,
transverse magnetic field 300
cm-3,
transverse magnetic field 300 ![]() G, perturbation amplitude in velocity 50 km s-1; the second
one has
G, perturbation amplitude in velocity 50 km s-1; the second
one has
![]() cm-3,
cm-3, ![]() G, velocity perturbation 40 km s-1; the third one
has
G, velocity perturbation 40 km s-1; the third one
has
![]() cm-3,
cm-3, ![]() G, velocity perturbation 55 km s-1. The convergence
of the results can be inferred from these data.
G, velocity perturbation 55 km s-1. The convergence
of the results can be inferred from these data.
![\begin{figure}
\par\includegraphics[width=9cm,clip]{12262fg6.eps}
\end{figure}](/articles/aa/full_html/2009/44/aa12262-09/img55.png)
|
Figure 6: Average physical parameters of the jet derived from observations following Bacciotti et al. (1999) (symbols) and from the model with detailed cooling (curves). Temperature (diamonds, solid line), electron density (circles, dashed) and total ionization fraction (bullets, dot-dashed). |
| Open with DEXTER | |
Table 2: Root mean square deviations of line ratios (R1 is [OI]/[NII], R2 is [SII]/[OI]) obtained with simulations of increasing resolution.
Presented in Fig. 7 are four cases of increasing resolution for the first configuration in Table 2 (n2e4b300v50): one employing only the base grid (1536 zones), a second one with three levels of refinement (equivalent resolution 12 288 cells), one using six levels of refinement (equivalent resolution 98 304 cells), and one with 10 levels of refinement (equivalent resolution 1 572 864 cells). It can be seen that the line ratios converge to the results of Fig. 3, obtained in a simulation with 8 levels of refinement. The simulations presented in Fig. 7 use the simplified cooling model, but similar effects were obtained when using the detailed cooling model. In Fig. 7, the line ratios obtained employing 8 levels of refinement almost perfectly overlapped the ones obtained with 10 levels of refinement, so they were not shown.
![\begin{figure}
\par\includegraphics[width=9cm,clip]{12262fg7.eps}
\end{figure}](/articles/aa/full_html/2009/44/aa12262-09/img56.png)
|
Figure 7:
Effect of the simulation resolution on the line ratios of [SII]]
|
| Open with DEXTER | |
The physical spatial resolution in a simulation with 8 levels of refinement in the present
setup is about
![]() cm, and should be enough to adequately resolve the post-shock zone,
with its rapid variation of physical parameters. The resolution for 6 levels of
refinement is
cm, and should be enough to adequately resolve the post-shock zone,
with its rapid variation of physical parameters. The resolution for 6 levels of
refinement is ![]()
![]() cm, it drops to
cm, it drops to
![]() cm for three levels
of refinement and to
cm for three levels
of refinement and to
![]() cm at the base grid resolution.
cm at the base grid resolution.
The line ratios are very sensitive to resolution variations, making it important to reach an adequate (high) resolution for reliable results. This is a critical aspect for future 2D simulations, that will have to employ AMR to reach these extremely high resolutions with the available computational power.
![\begin{figure}
\par\includegraphics[width=7.2cm,clip]{12262fg8.eps}
\end{figure}](/articles/aa/full_html/2009/44/aa12262-09/img61.png)
|
Figure 8:
Three simulations of shockwaves with density
|
| Open with DEXTER | |
In order to see how the resolution requirements depend on the parameters of the shock, in Fig. 8 we present the evolution of the temperature at the same age for three shockwaves with different amplitudes of the initial perturbation (decreasing from left to right). The x axis does not represent the actual position of the shocks but only a distance scale, the front of the shockwaves being plotted close to each other for convenience. We see that with the increase of the perturbation amplitude (and thus the shock strength), the evolution after the shock steepens. In the same way, in Fig. 9 three shockwaves with different initial densities are plotted, with decreasing density from left to right. The evolution of the temperature after the shock steepens when increasing the density. Typically, as the dependence steepens, the resolution needed increases. All the cited plots were made for the same average velocity of the underlying jets. When decreasing this velocity, the spatial resolution needed for an accurate analysis of the post-shock zone increases.
![\begin{figure}
\par\includegraphics[width=7.2cm,clip]{12262fg9.eps}
\end{figure}](/articles/aa/full_html/2009/44/aa12262-09/img62.png)
|
Figure 9:
Three simulations of shockwaves with transverse magnetic fields 300 |
| Open with DEXTER | |
3.4 Comparison and discussion
The parameter sets for the best agreement obtained
in the previous paragraphs were not the only ones that well interpret the observations,
but other possible ``successful'' combinations do not depart from these values
of the parameters. As an example, setting U0=95 km s-1 for
the bulk jet velocity, we obtained model curves very similar to those of
Figs. 5 and 6 with the same p=1,
![]() but with
but with
![]() cm-3,
cm-3,
![]() G, and u0=58 km s-1. The
same considerations apply for the simplified cooling simulations.
G, and u0=58 km s-1. The
same considerations apply for the simplified cooling simulations.
The jet bulk speeds U0 were chosen in such a way that the total shock speed in the rest reference frame would be approximately equal to 150 km s-1 in all cases - this being an approximate average knot speed derived from observations of Doppler shifts and proper motions (Hartigan & Morse 2007).
Comparing the results obtained with the two approaches to radiative cooling, identical or similar values of the model parameters can be inferred (Table 3). Parameters such as velocity amplitude of the perturbation (determining the shock strength) and transverse magnetic field (resulting in shock compression) are similar in the two cases. The total density of the jet is however one of the most difficult parameters to estimate from observations, and the different results in our two cases come from the different evolution of the total radiative losses and ionization in the post-shock zone.
Table 3: Comparison of the model parameters that gave the best agreement with the observations of HH30.
The simplified radiative cooling treatment appear to be suited for a rapid exploration of the parameter space, giving results (parameters of the model) close to the ones obtained with more sophisticated cooling.
4 Conclusions and summary
We have demonstrated in previous works that numerical integration of time-dependent radiating (shocked) flows can substantially benefit from the employment of adaptive mesh refinement methods, and the present work supports this conclusion. By computing the cooling time scale according to the algorithm described in Mignone et al. (2009), one could take full advantage of the time adaptation process. The use of this method allows us to tackle simulations of radiating shocks in 2D as they propagate along a cylindrical supersonic jet.
Our results applied to the DG Tau jet (Paper I) as well as the HH 30 jet (present paper) revealed a good agreement between the observed and calculated line intensity ratios of different transitions and for different elements (Figs. 3 and 5), and also of derived physical parameters, including the ionization fraction (Figs. 4 and 6).
An accurate treatment of the radiative losses allows us to more realistically compute the full ionization state of the plasma, and thus accurate line emission for each ion, in the approximation of a five-level atom. This, however, requires significant additional computing power that is not always available. An alternative is the use of the simplified cooling model, following only the ionization state of hydrogen, that proved to give good indications on the perturbation amplitude and transverse magnetic field of our model. This simpler but much faster strategy may be used for a preliminary exploration of the parameter space, being followed by simulations with detailed cooling only in the areas of interest. Both cooling models were discussed and compared in Tesileanu et al. (2008), and in the present work we extended the comparison to line ratio diagnostics and application to a real HH object.
Grid resolution proved to be a critical parameter for the line ratios estimations from MHD simulations. The physical dimensions of the computational zones have to not exceed about 1011 cm in order to accurately capture the evolution of the physical parameters and emission properties in the post-shock zones. This is a crucial aspect for future 2D simulations that will have to fulfill these requirements. This result can be generalized for the typical conditions encountered in shocks traveling through protostellar jets, as the variability in these conditions could not change the numbers by an order of magnitude. Weaker shocks (shocks evolving from smaller initial perturbations) or lighter shocks (lower initial density) will be less stringent on the resolution requirements, while stronger and/or denser shocks will add a factor to the present results.
We can summarize the general picture as follows: i) when one is interested in the distribution in space of the jet physical parameters such as density, temperature, etc., the details of the assumed cooling function matter very little (Tesileanu et al. 2008) provided the numerical resolution suffices to minimize numerical dissipation effects; ii) when one considers the detailed shock structure, numerical resolution is more important, but less so for the behavior of the integrated emission line luminosities (Raga et al. 2007); iii) when one discusses the line intensity ratios, a finer resolution must be achieved, while the details of the cooling function have effects that differ according to the line considered, in the present case from about 10% up to a factor of two.
AcknowledgementsWe acknowledge the Italian MIUR for financial support, grants Nos. 2002.028843 and 2004.025227. The present work was supported in part by the European Community Marie Curie Actions - Human resource and mobility within the JETSET network under contract MRTN-CT-2004 005592. OT acknowledges the support from the Romanian Research Agency CNCSIS, contract RP number 4/1.07.2009. We thank the anonymous referee for valuable observations and suggestions.
References
- Bacciotti, F., Eislöffel, J., & Ray, T. P. 1999, A&A, 350, 917 [NASA ADS]
- Berger, M. J., & Colella, P. 1989, J. Comp. Phys., 82, 64 [CrossRef] [NASA ADS]
- Berger, M. J., & Oliger, J. 1984, J. Comp. Phys., 53, 484 [CrossRef] [NASA ADS]
- Cox, D., & Raymond, J. 1985, ApJ, 298, 651 [CrossRef] [NASA ADS]
- Garcia, P. J. V., Ferreira, J., Cabrit, S., & Binette, L. 2001a, A&A, 377, 589 [EDP Sciences] [CrossRef] [NASA ADS]
- Garcia, P. J. V., Cabrit, S., Ferreira, J., & Binette, L. 2001b, A&A, 377, 609 [EDP Sciences] [CrossRef] [NASA ADS]
- Hartigan, P., & Morse, J. 2007, ApJ, 660, 426 [CrossRef] [NASA ADS]
- Hartigan, P., Morse, J. A., & Raymond, J. 1994, ApJ, 436, 125 [CrossRef] [NASA ADS]
- Hyman, J. M. 1983, SIAM J. Sci. Stat. Comput., 4(4), 645
- Lavalley-Fouquet, C., Cabrit, S., & Dougados, C. 2000, A&A, 356, L41 [NASA ADS]
- Lodders, K. 2003, ApJ, 591, 1220 [CrossRef] [NASA ADS]
- Lohner, R. 1987, Comp. Meth. App. Mech. Eng., 61, 323 [CrossRef]
- Massaglia, S., Mignone, A., & Bodo, G. 2005a, A&A, 442, 549 [EDP Sciences] [CrossRef] [NASA ADS] (Paper I)
- Massaglia, S., Mignone, A., & Bodo, G. 2005b, Mem. S. A. It., 76, 378 [NASA ADS]
- Mignone, A., Bodo, G., Massaglia, S., et al. 2007, ApJS, 170, 228 [CrossRef] [NASA ADS]
- Mignone, A., et al. 2009, in preparation
- O'Brien, D., & Garcia, P. 2003, APSS, 287, 3
- Osterbrock, D. E., & Ferland, G. J. 2006, Astrophysics of Gaseous Nebulae and Active Galactic Nuclei, 2nd edn. (Sausalito - California: University Science Books)
- Raga, A. C., De Colle, F., Kajdic, P., Esquivel, A., & Cantó, J. 2007, A&A, 465, 879 [EDP Sciences] [CrossRef] [NASA ADS]
- Shang, H., Glassgold, A. E., Shu, F. H., & Lizano, S. 2002, ApJ, 564, 853 [CrossRef] [NASA ADS]
- Strang, G. 1968, SIAM J. Num. Anal., 5, 506 [CrossRef]
- Tesileanu, O., Mignone, A., & Massaglia, S. 2008, A&A, 488, 429 [EDP Sciences] [CrossRef] [NASA ADS]
- Tesileanu, O., Mignone, A., & Massaglia, S. 2009, Procs. Protostellar Jets in Context, ed. T. P. Ray, & K. Tsinganos, 7-12 July 2008 (Rhodes, Greece: Springer), in press
All Tables
Table 1: Root mean square deviations of line ratios with simplified cooling.
Table 2: Root mean square deviations of line ratios (R1 is [OI]/[NII], R2 is [SII]/[OI]) obtained with simulations of increasing resolution.
Table 3: Comparison of the model parameters that gave the best agreement with the observations of HH30.
All Figures
|
|
Figure 1: Snapshot of the temperature behavior vs. distance for the uniform grid, for a propagating shock in a stratified medium. |
| Open with DEXTER | |
| In the text | |
|
|
Figure 2: The same as in Fig. 1 but for the AMR integration and five levels of refinement, for an equivalent resolution of 49 152 cells, with a zoom on the shock region. The histogram in the lower part of the plot (with the right vertical scale) represents the refinement level employed in each cell of the simulation. |
| Open with DEXTER | |
| In the text | |
|
|
Figure 3:
Intensity ratios of [SII]]
|
| Open with DEXTER | |
| In the text | |
|
|
Figure 4: Average physical parameters of the jet derived from observations following Bacciotti et al. (1999) (symbols) and from the model with simplified cooling (curves). Temperature (diamonds, solid line), electron density (circles, dashed) and ionization fraction (bullets, dot-dashed). |
| Open with DEXTER | |
| In the text | |
|
|
Figure 5:
Intensity ratios of [SII]]
|
| Open with DEXTER | |
| In the text | |
|
|
Figure 6: Average physical parameters of the jet derived from observations following Bacciotti et al. (1999) (symbols) and from the model with detailed cooling (curves). Temperature (diamonds, solid line), electron density (circles, dashed) and total ionization fraction (bullets, dot-dashed). |
| Open with DEXTER | |
| In the text | |
|
|
Figure 7:
Effect of the simulation resolution on the line ratios of [SII]]
|
| Open with DEXTER | |
| In the text | |
|
|
Figure 8:
Three simulations of shockwaves with density
|
| Open with DEXTER | |
| In the text | |
|
|
Figure 9:
Three simulations of shockwaves with transverse magnetic fields 300 |
| Open with DEXTER | |
| In the text | |
Copyright ESO 2009
Current usage metrics show cumulative count of Article Views (full-text article views including HTML views, PDF and ePub downloads, according to the available data) and Abstracts Views on Vision4Press platform.
Data correspond to usage on the plateform after 2015. The current usage metrics is available 48-96 hours after online publication and is updated daily on week days.
Initial download of the metrics may take a while.