| Issue |
A&A
Volume 507, Number 2, November IV 2009
|
|
|---|---|---|
| Page(s) | 1023 - 1040 | |
| Section | Planets and planetary systems | |
| DOI | https://doi.org/10.1051/0004-6361/200810682 | |
| Published online | 15 September 2009 | |
A&A 507, 1023-1040 (2009)
Collisional evolution of dust aggregates. From compaction to catastrophic destruction
D. Paszun1 - C. Dominik1,2
1 - Sterrenkundig Instituut ``Anton Pannekoek'', Kruislaan 403,
1098 SJ Amsterdam, The Netherlands
2 - Afdeling Sterrenkunde, Radboud Universiteit Nijmegen,
Postbus 9010, 6500 GL Nijmegen, The Netherlands
Received 26 July 2008 / Accepted 15 August 2009
Abstract
The coagulation of dust aggregates occurs in various
astrophysical environments. Each one is characterized by different
conditions that influence the growth, e.g., relative velocities,
composition, and size of the smallest constituents (monomers). Here
we study the microphysics of collisions of dust aggregates in a
four-dimensional parameter space. The parameters are the collision
energy, the initial compactness of agglomerates, the mass ratio of
collision partners, and the impact parameter. For this purpose we
employ a state of the art molecular dynamics type of model
that has been extensively and successfully tested against laboratory
experiments. It simulates the motion of individual monomers
interacting dynamically via van der Waals surface forces. The
structure of aggregates is quantified by the filling factor that
provides information about the internal structure, the packing
density of monomers, and the projected surface area of
aggregates.
Our results show the importance of the impact parameter that causes
formation of elongated particles, due to tensile forces acting in
offset collisions. In head-on impacts, aggregates are compacted at
lower energies. A sufficiently high energy causes restructuring to
reach maximum compaction. If more energy is provided, pancake-like
structures are formed. We find that the outcome of collisions can
be represented in a simple way. A highly pronounced large fragment
component coexists with a power-law distribution of small fragments.
The structural parameter of these small fragments is described very
well by a simple relation, largely independent of the initial
compactness, impact energy or impact parameter. The simulations
show that erosion by collisions with high mass-ratio can be
significant. The ejected mass can be several orders of magnitude
higher than the impactor mass. This contrasts with collisions of
equal mass aggregates, where the same impact energy can lead to
perfect sticking.
These findings are summarized in the form of a simple collision
recipe. The recipe specifies the outcome of a collision, averaged
over the impact parameter. It is provided in tabular form for a
range of physical parameters such as impact energy and pre-collision
filling factor. The dependence on the mass ratio of impactor and
target is taken into account by providing both a local and a global
branch of the recipe.
Key words: planets and satellites: formation
1 Introduction
Dust plays an important role in many astrophysical environments,
and it is also the building material of planets. Small grains
can stick to each other thanks to van der Waals forces
(Derjaguin et al. 1975; Johnson et al. 1971). Depending
on the growth mechanism, the aggregates can acquire different
structures. In low velocity collisions, which are dominant in the
regime where particle velocities are dominated by Brownian
motion, the narrow size distribution primarily leads to collisions
between particles of a similar size, in turn leading to fractal
aggregates.
(Paszun & Dominik 2006; Kempf et al. 1999; Krause & Blum 2004; Blum et al. 2000).
Fractals produced by Brownian growth have a typical fractal dimension
of
![]() (Paszun & Dominik 2006; Krause & Blum 2004),
and higher gas densities shorten the mean free path of particles and
result in even more fluffy structures. In the limiting case
of very high densities, aggregates formed this way may be very
elongated with the fractal dimension approaching unity
(Paszun & Dominik 2006).
(Paszun & Dominik 2006; Krause & Blum 2004),
and higher gas densities shorten the mean free path of particles and
result in even more fluffy structures. In the limiting case
of very high densities, aggregates formed this way may be very
elongated with the fractal dimension approaching unity
(Paszun & Dominik 2006).
Velocities induced by turbulent gas motions and by radial drift in protoplanetary disks can be much higher. Furthermore, the dependence of velocities on particle size can become reversed, with larger particles moving faster than smaller particles. For a discussion of the relative velocities in protoplanetary disks, we refer the reader to a review article by Beckwith et al. (2000). Relative motion that emphasizes collisions between particles of different sizes leads to the production of aggregates with very different structures, because then the particles also grow by collecting smaller projectiles. In this case, the results are porous, non-fractal aggregates (Ball & Witten 1984; Paszun et al. 2009).
Low-impact velocities generally result in sticking. However, the
growth of dust usually causes an increase in collision velocities when
the particle start to decouple from the surrounding gas. When the
collision energy becomes higher than the energy needed to roll
monomers over each other (later referred to as rolling energy
![]() ), restructuring begins. Very fluffy and fractal
aggregates are compacted upon collision
(Blum & Wurm 2000; Dominik & Tielens 1997). A further increase
in the impact velocity leads to compaction. However, eventually the
kinetic energy is high enough to break contacts between individual
monomers. Erosion then starts to remove parts of colliding
aggregates. As the relative velocity increases further, erosion also
becomes stronger, ultimately leading to the destruction of the
aggregates.
), restructuring begins. Very fluffy and fractal
aggregates are compacted upon collision
(Blum & Wurm 2000; Dominik & Tielens 1997). A further increase
in the impact velocity leads to compaction. However, eventually the
kinetic energy is high enough to break contacts between individual
monomers. Erosion then starts to remove parts of colliding
aggregates. As the relative velocity increases further, erosion also
becomes stronger, ultimately leading to the destruction of the
aggregates.
Fragmentation of aggregates is a major obstacle in planet formation theory. Dust cannot grow all the way to form planetesimals because it gets destroyed once relative velocities become violent enough to disrupt aggregates. Similarly, radial drift may prevent growth by removing particles from the disk once they grow to a certain size and spiral towards the central star.
Johansen et al. (2006) show that, in the presence of turbulence, planetesimals might be produced by gravitational collapse of clumps of meter sized boulders. These clumps are generated by high-pressure turbulent eddies that trap and concentrate particles, which then become gravitationally bound. Before this process can take place, particles must already have grown by 18 orders of magnitude in mass. The only feasible way to do that is by collisional sticking. Because collisional fragmentation of aggregates may prevent growth of large, meter sized aggregates, it is crucial to fully understand mechanisms involved in collisions of porous aggregates.
Recently, Brauer et al. (2008) have studied the growth of dust
particles in a local density maximum caused by the evaporation front at
the snow line. This local pressure maximum in the disk can accumulate
dust particles and reduce relative velocities considerably. In the
midplane of the disk, weaker turbulence (Ciesla 2007)
results in lower relative velocities. Brauer et al. (2008) have
shown that for the fragmentation threshold velocity of at least 5 m/s,
the growth can proceed to large boulders of up to several 100 m
in size. However, a more realistic value of the threshold velocity,
for aggregates made of micron-sized grains, is ![]() 1 m/s
(Langkowski et al. 2008; Blum & Muench 1993; Poppe et al. 2000).
1 m/s
(Langkowski et al. 2008; Blum & Muench 1993; Poppe et al. 2000).
Blum & Wurm (2000) performed laboratory experiments of collisions of dust aggregates. They studied impacts at a wide range of energies, from low energy (perfect sticking), through restructuring to fragmentation of microscopic aggregates. Their results with respect to restructuring threshold are in agreement with theoretical findings of Dominik & Tielens (1997). The fragmentation energy, however, differs, which is a consequence of the discrepancy in sticking velocity. Poppe et al. (2000) measured the sticking velocity of micron-sized silica grains and found 1.2 m/s. Chokshi et al. (1993) and Dominik & Tielens (1997) on the other hand derived theoretically a much lower velocity, inconsistent with experiments. This problem was addressed by Paszun & Dominik (2008), who included an additional energy dissipation channel in order to match the experimental results. For details see Sect. 2.
Blum & Muench (1993) studied collisions of macroscopic,
mm-sized, aggregates at velocities between 1 and a few m/s. In this
case, however, a different behavior was observed. Although particles
were very porous (up to ![]() filling factor) they did not observe
restructuring. Instead, aggregates were bouncing off each other or,
for faster impacts, fragmenting.
filling factor) they did not observe
restructuring. Instead, aggregates were bouncing off each other or,
for faster impacts, fragmenting.
Very energetic collisions between large mm-sized and cm-sized
aggregates were studied by Wurm et al. (2005). They showed
that the fragmentation observed at high velocity impacts turns into a
net growth of ![]() at velocities above 13 m/s. The distribution of
fragments at velocities of about 20 m/s followed a power-law with a
slope of
at velocities above 13 m/s. The distribution of
fragments at velocities of about 20 m/s followed a power-law with a
slope of
![]() for larger fragments and was flat for the
smallest ejecta.
for larger fragments and was flat for the
smallest ejecta.
Fujiwara et al. (1977) experimented with solid basalt rocks. High
velocity impacts of a few km s-1 result in a power-law
distribution of small fragments
![]() .
The slope of the
distribution was found to be k=-1.83. They distinguished several
collisional outputs, depending on the target size:
.
The slope of the
distribution was found to be k=-1.83. They distinguished several
collisional outputs, depending on the target size:
- 1.
- complete destruction;
- 2.
- remaining core;
- 3.
- transition from core to cratering;
- 4.
- crater formation.
Although collisions of dust particles have been studied experimentally and theoretically, no one has formulated a quantitative recipe describing both mass distribution and structural properties of the collisional output, using a model based on empirical results. Both the distribution of masses and the compactness of fragments is required to fully understand the growth of dust. Here we present an extensive parameter study of many collisions of small dust aggregates. We provide a recipe for mass distribution and compactness of fragments.
In Sect. 2 we briefly present the model we adopt to simulate collisions of dust aggregates, it's strengths and limitations. In Sect. 3 we present findings of our study and discuss them qualitatively. Section 4 provides quantitative description of our results in a form of a collision recipe. We end this paper with interesting conclusions in Sect. 5.
2 The model
The simulations presented in this work are done using the N-body
dynamics code SAND![]() . Our
model treats all monomers (also referred to as grains or particles) in
the agglomerates (also referred to as aggregates, clusters, or
particles) individually. Since we are currently not interested in
long range interactions, electrostatic, magnetic and gravitational
forces are not included even though the code can handle them
(Dominik & Nübold 2002). We calculate motion of individual
monomers that interact with each other via attractive van der Waals
surface forces (Johnson et al. 1971).
. Our
model treats all monomers (also referred to as grains or particles) in
the agglomerates (also referred to as aggregates, clusters, or
particles) individually. Since we are currently not interested in
long range interactions, electrostatic, magnetic and gravitational
forces are not included even though the code can handle them
(Dominik & Nübold 2002). We calculate motion of individual
monomers that interact with each other via attractive van der Waals
surface forces (Johnson et al. 1971).
The presence of the attractive surface on deformable particles inevitably leads to several energy dissipation mechanisms. The particles, when in contact, may roll over each other. This rolling motion is countered by a rolling friction force (Dominik & Tielens 1995), causing an energy loss. The same happens in the case of a sliding motion. The contacts may shift which again is work done against the sliding friction force (Dominik & Tielens 1996). Beside that, every time a contact between two monomers is broken, the elastic energy stored in it is partially lost (Johnson et al. 1971; Dominik & Tielens 1997; Chokshi et al. 1993). Some energy may also be lost due to a twisting motion of particles in contact (Dominik & Tielens 1997).
We also include an additional energy dissipation channel in order to
fit the experimental results by Poppe et al. (2000). This
process increases the sticking velocity from about
![]() (Dominik & Tielens 1997; Chokshi et al. 1993) to about
(Dominik & Tielens 1997; Chokshi et al. 1993) to about
![]() (Poppe et al. 2000). Since the
measured attractive force agrees well with the theory provided by
Johnson et al. (1971) and
Derjaguin et al. (1975), the difference in sticking
velocity points to additional energy losses in collisions. While our
model does not specify what this mechanism is, a candidate would be
plastic deformation of surface asperities on nm scales. In order to
achieve agreement with the experimental results, a mechanism
dissipating the energy upon the first contact of two particles was
introduced (Paszun & Dominik 2008). For details regarding the
implementation, we refer the reader to Dominik & Nübold (2002) and
Paszun & Dominik (2008).
(Poppe et al. 2000). Since the
measured attractive force agrees well with the theory provided by
Johnson et al. (1971) and
Derjaguin et al. (1975), the difference in sticking
velocity points to additional energy losses in collisions. While our
model does not specify what this mechanism is, a candidate would be
plastic deformation of surface asperities on nm scales. In order to
achieve agreement with the experimental results, a mechanism
dissipating the energy upon the first contact of two particles was
introduced (Paszun & Dominik 2008). For details regarding the
implementation, we refer the reader to Dominik & Nübold (2002) and
Paszun & Dominik (2008).
Although Paszun & Dominik (2008) tested the model extensively against the laboratory experiments and found a good agreement, this model has limitations as discussed below.
2.1 Limitations
Although our model presents a new approach to study collision dynamics of aggregates, the following limitations apply.- aggregate size Two monomers in contact oscillate in relative
distance due to the competition between attractive forces
that hold them together, and the elastic force that pushes them
apart. For micron-sized grains (the monomers we consider here have
radii of 0.5
 )
the vibration frequency is on the order of GHz.
A correct simulation of this dynamical system requires that we must
resolve the shortest timescales. These very short simulation time
steps limit the number of monomers in the system we can model. The
largest aggregates we can simulate are made of 105 grains and
take several hundreds of hours of a CPU time. In this study we
model aggregates made of up to 1000 monomers.
)
the vibration frequency is on the order of GHz.
A correct simulation of this dynamical system requires that we must
resolve the shortest timescales. These very short simulation time
steps limit the number of monomers in the system we can model. The
largest aggregates we can simulate are made of 105 grains and
take several hundreds of hours of a CPU time. In this study we
model aggregates made of up to 1000 monomers.
The collisional outcome depends foremost on the strength of individual contacts in the impacting aggregates, thus the properties of monomers (size, composition). The aggregate size determines the amount of energy that can be dissipated (
 times the number of monomers). Note, however, that laboratory
experiments of much larger aggregates (about 100 micron in size),
made of billions of monomers, show phenomena not seen in the
smallest aggregates. An example is bouncing
(Langkowski et al. 2008). Although this is an important effect
that significantly affects the growth of dust aggregates, it is
still poorly understood;
times the number of monomers). Note, however, that laboratory
experiments of much larger aggregates (about 100 micron in size),
made of billions of monomers, show phenomena not seen in the
smallest aggregates. An example is bouncing
(Langkowski et al. 2008). Although this is an important effect
that significantly affects the growth of dust aggregates, it is
still poorly understood;
- irregular grains
Our model assumes spherical monomers, as the simulation of irregular grains is computationally very expensive and, therefore, is impractical. Moreover, we can directly compare our findings to the results of laboratory experiments (Blum & Wurm 2000). Here we briefly introduce the possible effect irregular grains may have on the collision outcome.The strength of an aggregate strongly depends on the size of the contact between monomers. In the case of randomly shaped grains, contact is established between surface asperities and is very much limited. This reduces the strength of an aggregate and leads to disruption at lower impact energies. Moreover, irregular monomers can form more than one contact with each other, which means that individual contact points must break before restructuring can occur. In this way, chains of irregular particles can be more rigid than those made of spherical particles.
Poppe et al. (2000) performed laboratory experiments on both spherical and irregular grains. They showed that irregular particles can stick to a flat surface at much higher velocities than spherical grains (1.5 to 2.3 m s-1 for spherical silica grains and 5 to 25 m s-1 for irregular enstatite monomers). This suggests that additional energy dissipation may occur during a collision. The mechanism, however, is still unclear.
As the physical processes involved in collisions of irregular grains are unknown, we leave them for a future investigation. However, experiments have shown that the overall effects off collisions are well reproduced between experiments with spherical or round monomers (Langkowski et al. 2008). Therefore, we believe that the general conclusions of our study here will also hold for less perfect monomers.
2.2 Setup
A few examples of our aggregates, made of 1000 monomers each, are presented in Fig. 1. These particles consist of equal size monomers.![\begin{figure}
\par\includegraphics[width=14cm,clip]{10682fg01.eps}
\end{figure}](/articles/aa/full_html/2009/44/aa10682-08/img35.png)
|
Figure 1:
Sample aggregates used in our
parameter study. Each of particles is made of 1000 monomers.
Annotations show
|
| Open with DEXTER | |
These aggregates are constructed using two different techniques.
The first method, developed by
Filippov et al. (2000), allows to create fractal
aggregates of any specified fractal dimension ![]() .
This
sequential tunable particle-cluster aggregation method forms
agglomerates by successive addition of identical spherical
particles. The fractal aggregates made according to this algorithm
strictly obey the fractal scaling law
(Filippov et al. 2000)
.
This
sequential tunable particle-cluster aggregation method forms
agglomerates by successive addition of identical spherical
particles. The fractal aggregates made according to this algorithm
strictly obey the fractal scaling law
(Filippov et al. 2000)

where
The second method we use to produce aggregates is particle cluster
aggregation (PCA). We successively add monomers from random
directions. This method produces aggregates that, in the limit
of very large sizes, have a filling factor of
![]() .
An
aggregate made of 1000 monomers has, however, a lower filling factor
of
.
An
aggregate made of 1000 monomers has, however, a lower filling factor
of
![]() .
This is an effect of high porosity of the surface
layer. In very large aggregates, this region will be negligibly thin
compared to the size of an aggregate
(Paszun et al. 2009).
.
This is an effect of high porosity of the surface
layer. In very large aggregates, this region will be negligibly thin
compared to the size of an aggregate
(Paszun et al. 2009).
2.3 Parameter space and expected scaling
To provide a qualitative and quantitative description of aggregate collisions, we explore an extensive parameter space. This provides an insight into the effects of different parameters on the outcome of a collision. As the final purpose is to provide a recipe for a collision between two aggregates, we limit the range of our parameters to realistic values.The relevant parameters influencing the outcome of a collision are:
- collision energy;
- pre-collision compactness of the aggregate;
- mass ratio of colliding particles;
- impact parameter;
- material properties of monomers.
Table 1: Impact parameters and aggregate properties explored in this study.
2.3.1 Collision energy
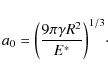
The basic effect of impact energy is intuitive: The more energy is provided to the system, the more violent the outcome is. Dominik & Tielens (1997) and later Wada et al. (2007) provide a simple recipe of collisional output as a function of energy. Both these studies were limited to two dimensional aggregates. Their recipe predicts energy thresholds for processes such as erosion, compression, and fragmentation. To understand them, one needs to define the rolling energy and the breaking energy of a contact. The first one is the energy needed to roll two monomers over each other by 90 degrees, and it represents energy the related to restructuring of an aggregate. It is defined as (Dominik & Tielens 1997)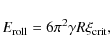
where
The second important quantity is the energy needed to separate two
connected monomers and is defined as
Here
where

with the equilibrium contact radius
Putting these equations together we see that the critical energy is given by
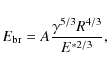
with the dimensionless constant A=43.
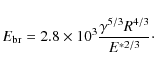
The recipe of Dominik & Tielens (1997) is confirmed experimentally with one
important modification (Blum & Wurm 2000). The energy scaling should be
applied according to values determined empirically (i.e.
![]() and
and
![]() corresponding to the experimental results). In
order to satisfy this requirement, we introduce a scaled version of
corresponding to the experimental results). In
order to satisfy this requirement, we introduce a scaled version of
![]() .
In this case the constant A is higher such that the sticking
threshold in our model is in agreement with experiments
(Poppe et al. 2000). This energy is given by
.
In this case the constant A is higher such that the sticking
threshold in our model is in agreement with experiments
(Poppe et al. 2000). This energy is given by
The recipe by Dominik & Tielens (1997) is summarized in Table 2.
Table 2: The collision recipe from Dominik & Tielens (1997) for a 2D case.
Low energies are insufficient to cause any visible restructuring. Before any restructuring occurs, contacts between monomers are displaced elastically. Only when the critical displacement is exceeded, an irreversible motion (i.e. rolling or sliding) follows. When the energy is sufficient to roll several contacts by a significant angle (Monomers begin to be removed of an aggregate when the energy per contact reaches 3 times the breaking energy. A large fraction of the energy is then dissipated by rolling, but the excess is used to remove a few grains. As the impact energy increases, the amount of erosion increases and becomes catastrophic when each contact can access over 10 times the breaking energy.
Although this recipe is reasonable, it may differ when particles collide at an impact parameter other than b=0 or when the mass ratio of the two collision partners is not 1. The latter case was also considered by Dominik & Tielens (1997). They provided a recipe for collisions of a small grain with a cluster.
In this study we also explore the energy range from the hit-and-stick regime up to catastrophic destruction. This range of energies can be found by looking at a variety of astrophysical environments. For example, in protoplanetary disks, small particles are well coupled to the gas and have rather low relative velocities. In the cores of molecular clouds, however, low gas densities make it possible for particles to decouple from the gas even at small sizes. In this case, turbulent gas motions may lead to collisions velocities beyond the fragmentation limit (Ormel et al. 2009).
2.3.2 Mass ratio
The mass ratio is sampled within the available range of our model ( 10-3 < m1/m2 < 1). As the largest aggregate simulated in this study is made of 1000 monomers, the lowest mass ratio we consider is m1/m2=10-3 (a collision of a big aggregate with a monomer). Although we simulate collisions between particles with different mass ratios, we present only two limiting cases to illustrate the importance of the mass ratio.This parameter influences the energy distribution during a collision. In the case of equal-mass impactors, the energy is spread over most of the monomers, causing a global effect. However, small projectiles act locally and concentrate the energy into a small volume close to the impact site. Thus, restructuring will be local and erosion can be expected at relatively low energies.
2.3.3 Impact parameter
Our sampling of the impact parameterThe impact parameter is important as it can significantly change the outcome of a collision. In the case of a central impact, aggregates are pushed towards each other and are compressed. Collisions with large impact parameters on the other hand cause aggregates to connect in the outer regions only and result in stretching of aggregates as they move apart again. In this way, large impact parameters tend to cause tensile forces acting on the aggregates, while central impacts are dominated by compressive stresses.
The importance of the off-center collisions should not be underestimated. Due to the geometrical arrangement, impacts with large impact parameter are considerably more frequent than head-on collisions. In impact parameter averaging, grazing impacts have a lot of weight.
2.3.4 Compactness parameter
To describe the structural changes of aggregates we define a compactness parameter
where N is the number of monomers in the aggregate, r0 is a monomer radius, and

with
We sample the compactness parameter well within the applicable range.
Random close packing (RCP) of spheres produces aggregates with
the filling factor of about![]()
![]() (Onoda & Liniger 1990) that is the densest form one can expect,
given the assumption of spherical monomers. However,
Blum et al. (2006) and later Paszun & Dominik (2008)
have shown that aggregates being compressed can reach a maximum
filling factor of about
(Onoda & Liniger 1990) that is the densest form one can expect,
given the assumption of spherical monomers. However,
Blum et al. (2006) and later Paszun & Dominik (2008)
have shown that aggregates being compressed can reach a maximum
filling factor of about
![]() .
Higher compaction cannot be
achieved in a static experiment of uni-axial compression. As upper
limit for the filling factor we use a slightly lower value of
.
Higher compaction cannot be
achieved in a static experiment of uni-axial compression. As upper
limit for the filling factor we use a slightly lower value of
![]() .
As lower limit, on the other hand, we use aggregates
formed in the Brownian growth phase, where in the presence of rotation
aggregates with the fractal dimension of about
.
As lower limit, on the other hand, we use aggregates
formed in the Brownian growth phase, where in the presence of rotation
aggregates with the fractal dimension of about
![]() are
formed (Paszun & Dominik 2006; Krause & Blum 2004). Our largest
aggregate of fractal dimension 1.5 has a filling factor
are
formed (Paszun & Dominik 2006; Krause & Blum 2004). Our largest
aggregate of fractal dimension 1.5 has a filling factor
![]() .
.
It is important to note the discrepancy between the radii used in the
definition of the impact parameter space and the filling factor
![]() .
The impact parameter is defined in terms of the outer radius
.
The impact parameter is defined in terms of the outer radius
![]() ,
that is the radius of a sphere enclosing an entire
aggregate and centered in its center of mass. The filling factor,
however, uses the projected surface-equivalent radius
,
that is the radius of a sphere enclosing an entire
aggregate and centered in its center of mass. The filling factor,
however, uses the projected surface-equivalent radius ![]() .
For
compact aggregates, these two radii are very similar, while the outer
radius
.
For
compact aggregates, these two radii are very similar, while the outer
radius
![]() becomes higher as the filling factor of an
aggregate decreases. For completeness, we empirically determine the
relation between the two radii. Figure 2 shows how the ratio
becomes higher as the filling factor of an
aggregate decreases. For completeness, we empirically determine the
relation between the two radii. Figure 2 shows how the ratio
![]() influences the filling factor
influences the filling factor
![]() .
.
![\begin{figure}
\par\includegraphics[width=8.5cm,clip]{10682fg02.eps}
\end{figure}](/articles/aa/full_html/2009/44/aa10682-08/img81.png)
|
Figure 2:
he filling factor as a function
of the ratio
|
| Open with DEXTER | |
2.3.5 Properties of monomers
The composition of monomers and their size strongly affect the strength of an aggregate. Both these parameters determine the breaking energy of two grains in contact and thus regulate the energy dissipation during a collision. Since normalization of the impact energy by the breaking energy puts monomer properties out of the equation, we study here only one monomer size and material. The physical parameters of Quartz used in our model are presented in Table 3. Other materials will be the subject of a future study.Table 3: Properties of monomers used in this study.
Our monomers are silica spheres with a diameter of 1.2
where Ei and
3 Results and discussion
In this section we present results of our parameter study. We describe the collisional outcome in terms of the fragment mass distribution - growth versus fragmentation. Moreover, we keep track of the structure of the fragments formed in such a collision and present the collisional evolution of the structure of dust aggregates.Our study spans a wide range of parameters. Here we select two
specific cases for a detailed discussion of the effects seen in our
study![]() . Collisions of
compact aggregates (filling factor of
. Collisions of
compact aggregates (filling factor of
![]() for smaller
aggregates and
for smaller
aggregates and
![]() for larger particles) are presented and
compared with fluffy, fractal aggregates (filling factor of
for larger particles) are presented and
compared with fluffy, fractal aggregates (filling factor of
![]() for small aggregates and
for small aggregates and
![]() for bigger
ones). We use these two cases to illustrate the influence of
compactness on the collisional outcome.
for bigger
ones). We use these two cases to illustrate the influence of
compactness on the collisional outcome.
3.1 Fragment distribution
The products of a collision are generally quantified in terms of the fragment mass distribution. In the case of sticking, the resulting mass distribution contains one single element, with the mass given by the sum of impactor and projectile. With the onset of erosion, a second component appears - the distribution of small fragments, usually represented as a power-law of particle mass. While these are initially two clearly separated components, they can connect in increasingly destructive collisions.
3.1.1 The effect of impact energy
Basic mass distribution components
Although the impact energy seems to be the main quantity setting the
mass spectrum after the collision, the collisional outcome depends
very much on all parameters presented in Sect. 2.3. The largest
collisional remnant is presented as a function of the impact energy in
Fig. 3. At low collision energies, aggregates stick perfectly
and the largest fragment contains the mass of both colliding
particles. An increasing impact energy causes onset of erosion at the
energy of about
![]() .
The fragmentation occurs at the
energy of about
.
The fragmentation occurs at the
energy of about
![]() ,
and depends also on the internal
structure of the colliding aggregates and the impact parameter.
,
and depends also on the internal
structure of the colliding aggregates and the impact parameter.
Compact aggregates with densely packed monomers (
![]() )
can
sustain higher energies regardless of the impact parameter. Grains
packed close to each other undergo more interaction, resulting in
internal energy dissipation that is more efficient than in the
case of loosely packed monomers (
)
can
sustain higher energies regardless of the impact parameter. Grains
packed close to each other undergo more interaction, resulting in
internal energy dissipation that is more efficient than in the
case of loosely packed monomers (
![]() ).
).
![\begin{figure}
\par\includegraphics[width=8.5cm,clip]{10682fg03.eps}
\end{figure}](/articles/aa/full_html/2009/44/aa10682-08/img96.png)
|
Figure 3: The mass of the largest collision remnant for central and offset collisions as a function of the impact energy. Diamonds correspond to compact aggregates, while triangles correspond to fluffy particles. Error bars indicate standard deviation and each point represents a mean value from 6 individual simulations (see Sect. 2.2). |
| Open with DEXTER | |
Interestingly, erosion occurs in off-center collisions already much
earlier than in central collisions, while shattering has the opposite
behavior: It occurs more readily in central collisions. Central
impacts can cause catastrophic destruction at energies above
![]() ,
while off-center collisions at this same energy
usually cause two large fragments to remain and therefore must be
classified as be classified as erosion. Both effects are caused by
the distribution of the available impact energy within the
colliding aggregates. In off-center collisions, the energy is
concentrated into a small region of the aggregates and does break
grain-grain connections locally near the point of impact. The
remaining kinetic energy is then carried away by two massive
fragments. In the limiting case of
,
while off-center collisions at this same energy
usually cause two large fragments to remain and therefore must be
classified as be classified as erosion. Both effects are caused by
the distribution of the available impact energy within the
colliding aggregates. In off-center collisions, the energy is
concentrated into a small region of the aggregates and does break
grain-grain connections locally near the point of impact. The
remaining kinetic energy is then carried away by two massive
fragments. In the limiting case of
![]() the interaction
of the two aggregates occurs between only two monomers, if at all.
the interaction
of the two aggregates occurs between only two monomers, if at all.
The degree of fragmentation during off-center impacts depends then on
the packing density of grains in the two aggregates. Porous
aggregates (
![]() )
show that even at very high energies, the
energy is not efficiently absorbed by the aggregates, saving them from
being shattered. However, in the case of compact aggregates, the mass
of the largest collision remnant is significantly higher than in the
case of central impact, but it decreases with an increasing impact
energy.
)
show that even at very high energies, the
energy is not efficiently absorbed by the aggregates, saving them from
being shattered. However, in the case of compact aggregates, the mass
of the largest collision remnant is significantly higher than in the
case of central impact, but it decreases with an increasing impact
energy.
The full mass distribution
A more complete picture is presented by studying the full distribution of fragment masses. This is illustrated for central impacts in Fig. 4. Collisions at
![\begin{figure}
\par\includegraphics[width=8.5cm,clip]{10682fg04.eps}
\end{figure}](/articles/aa/full_html/2009/44/aa10682-08/img99.png)
|
Figure 4:
Mass distribution resulting from head-on collisions of A&C -
fluffy (
|
| Open with DEXTER | |
The distribution of small particles is defined as
with the slope q depending on several parameters, including the internal structure of aggregates and the impact energy. Initially, too few small particles are produced and the power-law cannot be determined (e.g., for off-set impacts see Fig. 7a,b). In such a case we assume that the distribution is flat with the slope q=0, meaning equal mass per logarithmic mass interval. As the erosion progresses with increasing impact energy, the fitted slope remains at an approximately constant low value. Small particles slightly dominate the mass within this power-law distribution, since the slope is about
Although a similar trend is observed for compact particles
(
![]() ), the fragmentation is not as effective as in the case
of aggregates with
), the fragmentation is not as effective as in the case
of aggregates with
![]() (see Fig. 4d). A head-on
impact of compact particles at the energy of
(see Fig. 4d). A head-on
impact of compact particles at the energy of
![]() can still be classified as erosion. The large fragment component
is still present and contains a significant fraction of the mass.
This component is broader and is connected with the power-law
distribution of small fragments, an effect which affects the
determination of the slope. The slope appears to decrease to
about
can still be classified as erosion. The large fragment component
is still present and contains a significant fraction of the mass.
This component is broader and is connected with the power-law
distribution of small fragments, an effect which affects the
determination of the slope. The slope appears to decrease to
about
![]() .
However, an increase in the collision energy
to
.
However, an increase in the collision energy
to
![]() shatters the aggregates, leaving only the
power-law component with a steeper slope of about
shatters the aggregates, leaving only the
power-law component with a steeper slope of about
![]() (see
Fig. 4d).
(see
Fig. 4d).
The relation of the energy and the slope of the power-law distribution
in central collisions is presented in Fig. 5. The left panel (a)
shows the results for aggregates with compactness parameter
![]() .
The initially shallow and constant slope begins
to steepen once the impact energy increases above
.
The initially shallow and constant slope begins
to steepen once the impact energy increases above
![]() .
This behavior is similar for aggregates of different masses or for
different mass ratio impacts. Note that for very weak erosion, the
slope of the power-law cannot be determined and a value of q=0 is
assumed. Shattering becomes catastrophic when the impact
energy is increased by an order of magnitude. The slope steepens
beyond q=-1, meaning that small particles dominate the mass
spectrum. For small aggregates the distribution may be as steep as
q=-2.5.
.
This behavior is similar for aggregates of different masses or for
different mass ratio impacts. Note that for very weak erosion, the
slope of the power-law cannot be determined and a value of q=0 is
assumed. Shattering becomes catastrophic when the impact
energy is increased by an order of magnitude. The slope steepens
beyond q=-1, meaning that small particles dominate the mass
spectrum. For small aggregates the distribution may be as steep as
q=-2.5.
| Figure 5:
Slopes of the power-law size
distribution of small fragments as a function of impact
energy. Different symbols correspond to different masses of the
colliding aggregates. The left panel (A) corresponds to fluffy
aggregates (
|
|
| Open with DEXTER | |
Compact particles behave in a similar manner (see Fig. 5b). In
this case, however, the steepening occurs at slightly higher energies
of about
![]() .
Moreover, the steepening is limited in
the explored energy range, and reaches values of q=-1.7. In this
case, low energies also result in shallow slopes of the distribution
and are again assumed to be q=0 when the data was too scarce to
make a fit.
.
Moreover, the steepening is limited in
the explored energy range, and reaches values of q=-1.7. In this
case, low energies also result in shallow slopes of the distribution
and are again assumed to be q=0 when the data was too scarce to
make a fit.
![\begin{figure}
\par\includegraphics[width=8.5cm,clip]{10682fg06.eps}
\vspace*{4mm}
\end{figure}](/articles/aa/full_html/2009/44/aa10682-08/img112.png)
|
Figure 6:
Mass distribution resulting from central collisions between a
monomer and an aggregate made of 1000 grains. The presented
distributions result from collisions with compact aggregate with the
filling factor of
|
| Open with DEXTER | |
3.1.2 The effect of impactor-to-target mass ratio
Below we discuss the effect of the mass ratio on the collision
outcome. Although intermediate energies are required to erode
particles in collisions of equal mass aggregates, this is not the case
for impacts with high mass ratios, where the impact energy is localized to a small region, leading to
erosion even in slow collisions. Figure 6 shows
the fragment distribution produced in collision of a monomer with an
aggregate made of 103 grains. In these cases, the energy is
sufficient to break only a low number of contacts![]() and results
in erosion. That same energy applied in a collision of equal mass
aggregates results in a perfect sticking without any mass loss
(cf. Fig. 3). This difference is a consequence of very
localized energy input. The small particle (in this case a monomer)
carries sufficient energy to break a number of contacts. This energy
is transmitted locally to a limited number of grains rather than
distributed over the entire target aggregate. The resulting
ejecta can, due to the small physical size of the projectile, easily
escape.
and results
in erosion. That same energy applied in a collision of equal mass
aggregates results in a perfect sticking without any mass loss
(cf. Fig. 3). This difference is a consequence of very
localized energy input. The small particle (in this case a monomer)
carries sufficient energy to break a number of contacts. This energy
is transmitted locally to a limited number of grains rather than
distributed over the entire target aggregate. The resulting
ejecta can, due to the small physical size of the projectile, easily
escape.
Similarly, off-center collisions (see Fig. 7) are
characterized by distributions that resemble the erosion case. A
highly pronounced large fragment component coexists with a power-law
distribution of small fragments. The slope of the power-law is
independent of the impact energy. It remains at about
![]() for fluffy aggregates and
for fluffy aggregates and
![]() for compact particles even at
very high energies above
for compact particles even at
very high energies above
![]() .
At low impact energies,
the resulting distribution are
.
At low impact energies,
the resulting distribution are
![\begin{figure}
\par\includegraphics[width=8.5cm,clip]{10682fg07.eps}
\end{figure}](/articles/aa/full_html/2009/44/aa10682-08/img115.png)
|
Figure 7:
Mass distribution as
resulted from off-center (
|
| Open with DEXTER | |
Fluffy aggregates, when colliding at an energy of
![]() and above, produce two large fragments that contribute
to the big particles component and a few small particles. Compact
aggregates can still grow at an energy of
and above, produce two large fragments that contribute
to the big particles component and a few small particles. Compact
aggregates can still grow at an energy of
![]() ,
producing one large fragment containing most of the mass. At energies
of about
,
producing one large fragment containing most of the mass. At energies
of about
![]() the erosion increases and the growth
is stopped. The large fragment component contains now two large
remnants of the initial aggregates. An increase of the collision
energy causes mainly an increase in the mass in the power-law
component, while the largest fragment remains weakly affected. In the
case of compact aggregates (
the erosion increases and the growth
is stopped. The large fragment component contains now two large
remnants of the initial aggregates. An increase of the collision
energy causes mainly an increase in the mass in the power-law
component, while the largest fragment remains weakly affected. In the
case of compact aggregates (
![]() ), only very high energy
impacts can significantly reduce the mass of the largest fragments
(see Figs. 3 and 7d). For aggregates with
lower packing density (
), only very high energy
impacts can significantly reduce the mass of the largest fragments
(see Figs. 3 and 7d). For aggregates with
lower packing density (
![]() ), the mass of the largest
collision remnant seems to stabilize at a value of about
), the mass of the largest
collision remnant seems to stabilize at a value of about
![]() once the impact energy exceeds
once the impact energy exceeds
![]() .
Very high energies influence the fragment distribution
very weakly (see Figs. 3 and 7c).
.
Very high energies influence the fragment distribution
very weakly (see Figs. 3 and 7c).
The main effect of the impact parameter is that the energy is not transported very efficiently into aggregates. In the case of a central collision the kinetic energy is naturally transported efficiently into both aggregates, as the interaction spreads from the center (i.e., region right in between the aggregates) outwards. The monomers are pushed closer together, actively taking part in the energy dissipation. An increase in the impact parameter results in a decrease in the number of actively interacting grains. This means that fewer grains actually collide resulting in less fragmentation.
![\begin{figure}
\par\includegraphics[width=8.5cm,clip]{10682fg08.eps}
\end{figure}](/articles/aa/full_html/2009/44/aa10682-08/img119.png)
|
Figure 8: Schematic plot of the evolution of the fragment distribution as a function of different parameters. |
| Open with DEXTER | |
Our results show that the main factor determining the collisional
outcome is the impact energy E. Other parameters influence the way
this energy is transported to and distributed over the available
monomers. Figure 8 shows a schematic picture
of how the fragment distribution changes with variation of impact
energy E, compactness parameter
![]() ,
impact
parameter b, and the mass ratio m1/m2. The arrows indicate
schematically how the position and scaling of the different components
of the fragment mass distributions shift as parameters vary.
,
impact
parameter b, and the mass ratio m1/m2. The arrows indicate
schematically how the position and scaling of the different components
of the fragment mass distributions shift as parameters vary.
3.2 Aggregate structure
3.2.1 Central collisions
The outcome of a collision can also be quantified in terms of the internal structure of the resulting aggregates. This quantity is very important as it determines the aerodynamic properties of aggregates and thus their relative velocities. Figure 9 shows examples of the effect of collisions involving aggregates withThis picture depends also on the initial compactness of the colliding aggregates. Particles with open structures (Fig. 9) are subject to drastic restructuring, while more compact ones are characterized by higher strength against compacting and tensile forces. For comparison we present the results
![\begin{figure}
\par\includegraphics[width=14cm,clip]{10682fg09.eps}
\end{figure}](/articles/aa/full_html/2009/44/aa10682-08/img120.png)
|
Figure 9:
Images of aggregates formed in
collisions at different impact energies E and at different impact
parameters b. The aggregates have an initial filling factor
of
|
| Open with DEXTER | |
![\begin{figure}
\par\includegraphics[width=14cm,clip]{10682fg10.eps}
\end{figure}](/articles/aa/full_html/2009/44/aa10682-08/img121.png)
|
Figure 10:
Images of aggregates formed in collisions at
different impact energies E and at different impact parameters b. Aggregates
have the filling factor of
|
| Open with DEXTER | |
The quantitative picture is presented in Fig. 11. The
geometrical filling factor is plotted as a function of the impact
energy for central and off-center
collisions. All post-impact aggregates are in the hit and stick
energy regime, below a few times the rolling energy
![]() .
This is consistent with the description provided
by Dominik & Tielens (1997), where the visible restructuring occurs
at impact energies above
.
This is consistent with the description provided
by Dominik & Tielens (1997), where the visible restructuring occurs
at impact energies above
![]() .
However, the structure
of the produced aggregate is different than that of the initial
particles. Aggregates stick, forming dimer-like structure.
Thus, they expose more surface area resulting in a decrease in the
geometrical filling factor. This decrease depends on the initial
structure of aggregates and appears to be more severe for
compacter aggregates. In this case, particles cannot penetrate
each other contrary to more open structure aggregates, where partial
overlap hides some surface area. In fact, the difference is rather
small, on the order of 20%, for both filling factors presented in
Fig. 11.
.
However, the structure
of the produced aggregate is different than that of the initial
particles. Aggregates stick, forming dimer-like structure.
Thus, they expose more surface area resulting in a decrease in the
geometrical filling factor. This decrease depends on the initial
structure of aggregates and appears to be more severe for
compacter aggregates. In this case, particles cannot penetrate
each other contrary to more open structure aggregates, where partial
overlap hides some surface area. In fact, the difference is rather
small, on the order of 20%, for both filling factors presented in
Fig. 11.
Further increase in the impact energy, beyond
![]() ,
results in an increase of the filling factor. In the case of
central collision aggregates undergo compression up to energy of about
,
results in an increase of the filling factor. In the case of
central collision aggregates undergo compression up to energy of about
![]() .
At this energy, the maximum compaction is
reached and this energy is close to threshold predicted by
Dominik & Tielens (1997) and confirmed experimentally by
Blum & Wurm (2000). The degree of compression depends on the
initial compactness, as compact aggregates are more difficult to
compress further. An aggregate with
.
At this energy, the maximum compaction is
reached and this energy is close to threshold predicted by
Dominik & Tielens (1997) and confirmed experimentally by
Blum & Wurm (2000). The degree of compression depends on the
initial compactness, as compact aggregates are more difficult to
compress further. An aggregate with
![]() reaches its maximum
compression of about
reaches its maximum
compression of about
![]() ,
more compact than the
pre-impact particles. A more compact aggregate with pre-impact
filling factor
,
more compact than the
pre-impact particles. A more compact aggregate with pre-impact
filling factor
![]() does not exceed it's initial compactness
after impact. The maximum compression obtained in our study is
somewhat lower than obtained in a quasi-static compression
(Blum et al. 2006; Paszun & Dominik 2008). This, however, can
be an effect of small aggregate sizes, where the filling factor is
strongly affected by the porous outer layers
(Paszun et al. 2009).
does not exceed it's initial compactness
after impact. The maximum compression obtained in our study is
somewhat lower than obtained in a quasi-static compression
(Blum et al. 2006; Paszun & Dominik 2008). This, however, can
be an effect of small aggregate sizes, where the filling factor is
strongly affected by the porous outer layers
(Paszun et al. 2009).
A further increase in the collision energy causes flattening and,
formally, a decompaction of aggregates. Even thought the
filled regions of the aggregates continue to show low porosity, the
non-spherical global shape exposes more surface than a spherical
structure would, leading to a decrease in the geometrical filling
factor. In the case of fluffy aggregates with
![]() ,
the
flattening results in a small decrease in the compactness. At a
collision energy of about
,
the
flattening results in a small decrease in the compactness. At a
collision energy of about
![]() the maximum decompaction
is reached and any further increase in the impact energy would lead to
fragmentation. For more compact aggregates with initial
the maximum decompaction
is reached and any further increase in the impact energy would lead to
fragmentation. For more compact aggregates with initial
![]() ,
however, the flattening is stronger, as the filling factor drops to
about
,
however, the flattening is stronger, as the filling factor drops to
about
![]() .
This filling factor can is similar to
what we have seen earlier in fluffy aggregates. Fragmentation is now
only be reached at about
.
This filling factor can is similar to
what we have seen earlier in fluffy aggregates. Fragmentation is now
only be reached at about
![]() .
.
3.2.2 The influence of the impact parameter
Off-center collisions, on the other hand, show different results.
Energies that lead to compaction in central impacts also cause
restructuring at large impact parameters. In this case, however,
particles are pulled apart and stretched. Thus, more surface area is
exposed resulting in a strong decrease in the geometrical filling
factor
![]() .
The stretching energy regime extends, however, to lower
energies than the compression regime. Aggregates connect with
a lower number of contacts that are pulled off. Therefore,
lower energy is sufficient to disconnect the two colliding aggregates.
The critical energy is about
.
The stretching energy regime extends, however, to lower
energies than the compression regime. Aggregates connect with
a lower number of contacts that are pulled off. Therefore,
lower energy is sufficient to disconnect the two colliding aggregates.
The critical energy is about
![]() ,
and may be
slightly higher for compact aggregates. Above that energy, two
particles of similar mass are produced, accompanied by erosion. All
small fragments produced both in central and off-center collisions
closely follow a single power-law relation of
,
and may be
slightly higher for compact aggregates. Above that energy, two
particles of similar mass are produced, accompanied by erosion. All
small fragments produced both in central and off-center collisions
closely follow a single power-law relation of
The reason for this consistent behavior lies in the fact that the fragments are produced in highly dynamical events with energies close to breakup energies, allowing internal restructuring to lead to a scale-free structure.
3.2.3 Schematic representation
Figure 12 sketches a general picture of the structural evolution
of aggregates. On the two axes, in arbitrary units, it shows filling
factor and mass. We assume that initially, both impactor and target
have equal properties, located at the center of the plot where the
solid black curve starts. Along that curve, the impact energy
increases in steps, and the position of points on that curve shows
possible structures of the largest post-impact aggregate. The first
segment shows the effect of a hit-and-stick collision, to double mass
and lower filling factor, independently of impact parameter. At that
point, the curve splits into two, for central (solid black) and
grazing (gray) collisions. Higher impact energies can then, with
equal mass, either increase or decrease the filling factor. Even
higher energies move to the third point on each path. Grazing
collisions return to the initial pre-impact properties, while
central collisions go through a maximum compression point onto the
fragmentation powerlaw
![]() .
.
![\begin{figure}
\par\includegraphics[width=8.5cm,clip]{10682fg11.eps}
\end{figure}](/articles/aa/full_html/2009/44/aa10682-08/img131.png)
|
Figure 11:
The geometrical filling factor
|
| Open with DEXTER | |
Small arrows in the sketch indicate how the different points shift around as model parameters are modified.
4 The recipe
In this section we put together the information regarding the collisional output in a form of a quantitative recipe. We provide the recipe in a form of tables that contain parameters needed to reconstruct appropriate distributions. Since the recipe is provided as discrete parameters, the intermediate cases should be interpolated. Our recipe describes two limiting cases separately. Equal mass collisions affect aggregates globally. Therefore we refer to this sub-recipe as the global recipe. On the other hand we have high mass ratio impacts that result in localized changes. This sub-recipe is referred to as the local recipe. In the case of large mass ratio collisions, we used impacts of monomers onto aggregates composed of 1000 grains. In this case, only central collisions were used to predict also the outcome of offset impacts, because the effects are extremely similar. This assumes that the geometry of the impact of small projectile onto a larger target depends on a local surface. Thus central and offset collisions should be indistinguishable. The only necessary correction is to exclude missed collisions that are more likely at larger impact parameters. The distinction between the two sub-recipes is described later in Sect. 4.5.
![\begin{figure}
\par\includegraphics[width=8.5cm,clip]{10682fg12.eps}
\end{figure}](/articles/aa/full_html/2009/44/aa10682-08/img132.png)
|
Figure 12: Sketch of the compactness evolution dependence on different parameters. See text. |
| Open with DEXTER | |
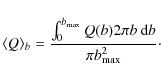
4.1 Average over the impact parameter
We present our recipe for aggregate collisions in an impact-parameter-averaged way. In this way, the recipe can be easily used in models that deal with size and structure distributions rather than individual particles. It is also possible to rewrite the recipe, keeping the impact parameter as one of the collisional parameters. This can be useful in a Monte-Carlo approach (Ormel et al. 2009) where individual collisions are treated.
Since we know the products of collisions at different offsets, we
apply proper weights to the results. The weight for each impact
parameter b is related to the fractional surface area of the ring
with the radius b and width ![]() .
Thus, grazing collisions get
the highest weight, while the central impact has the lowest
weight. The quantity Q averaged over the impact parameter is then
given as
.
Thus, grazing collisions get
the highest weight, while the central impact has the lowest
weight. The quantity Q averaged over the impact parameter is then
given as
4.2 Hit and stick recipe
Although our simulations include the hit-and-stick energy regime, this growth mechanism strongly depends on the mass ratio and should be treated separately. The hit-and-stick growth is of little importance when only an insignificant mass is added before any restructuring occurs. Otherwise, an analytical prescription may be applied as in Ormel et al. (2009); Ossenkopf (1993); Ormel et al. (2007); Paszun et al. (2009).4.3 Distribution of fragment masses
The simulation results have shown that collisions produce two components. The first component - the power-law of small fragments - is produced in high energy, head-on impacts resulting in erosion and fragmentation. The second component - the distribution of the largest fragments - is formed during low energy impacts, and also by grazing collisions at all energies. We model this component using (somewhat arbitrarily) a Gaussian distribution of particle masses. The overall effects seen in the previous chapter indicate that, as the energy increases, the Gaussian component will move its peak position to smaller masses, the powerlaw component will gain relative importance and will eventually steepen.
![\begin{figure}
\par\includegraphics[width=14cm,clip]{10682fg13.eps}
\end{figure}](/articles/aa/full_html/2009/44/aa10682-08/img135.png)
|
Figure 13:
Distributions averaged over the
impact parameter. Results for fluffy and compact aggregates at energies A:
|
| Open with DEXTER | |
The total set of parameters needed to reproduce such a distribution is presented in Table 4. The power-law component is determined by fitting a
Table 4: Quantities provided by the recipe to reproduce the mass distribution.
power-law to the first part of the distribution, which contains small fragments. That power-law is then subtracted from the distribution. The power-law slope and mass ratio of the two components is known at this point. The remaining part of the distribution is then used to determine the last two quantities, namely the mean and the width of the Gaussian component. The mean mass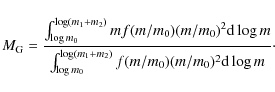
The width of the Gaussian is chosen to obey two constraints:
- 1.
- the Gaussian should have a sharp cut-off at masses larger than the total mass of colliding aggregates;
- 2.
- the power-law component must dominate the low mass part of the distribution.
![\begin{figure}
\par\includegraphics[width=8.5cm,clip]{10682fg14.eps}
\end{figure}](/articles/aa/full_html/2009/44/aa10682-08/img140.png)
|
Figure 14:
The filling factor
|
| Open with DEXTER | |
4.4 Compactness evolution
The filling factorFluffy aggregates also increase porosity in low energy collisions.
The increasing energy, however, causes both a decrease in the mass of
the largest fragment and compaction of the aggregates. Grazing
collisions at a high energy produce aggregates with only weakly
changed structure. Therefore, the structural change is dominated by
compressing head-on impacts. A further increase in the collision
energy results in stronger compression. The maximum filling factor of
about
![]() is reached at
is reached at
![]() .
Any
further increase in the energy does not affect the porosity. Particles
are completely disrupted and the filling factor is dominated by small,
fluffy fragments.
.
Any
further increase in the energy does not affect the porosity. Particles
are completely disrupted and the filling factor is dominated by small,
fluffy fragments.
Small fragments produced by erosion or fragmentation are easily described by a single power-law. Regardless of initial porosity of the impact energy, small particles have the filling factor given by Eq. (14).
4.5 Format
Our recipe provides parameters required to reconstruct mass
distributions averaged over impact parameter. The distribution of
fragment masses is given by
![]() ,
where
,
where
![]() provides the number of
particles of mass m in mass interval between m and
provides the number of
particles of mass m in mass interval between m and
![]() .
Thus, the functional form of our recipe consists of the two components
and is given by
.
Thus, the functional form of our recipe consists of the two components
and is given by
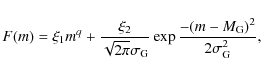
where
Our recipe is provided in tabulated form. The parameters required to
reproduce the collisional outcome may be interpolated linearly. Our
parameter space is covered very well and spans from very fluffy
aggregates of fractal dimension
![]() through fluffy
fractal (
through fluffy
fractal (
![]() )
and non fractal PCA aggregates to very
compact particles of
)
and non fractal PCA aggregates to very
compact particles of
![]() .
The energy space is also well
sampled. Our recipe is based on simulations from hit-and-stick regime
up to a catastrophic destruction.
.
The energy space is also well
sampled. Our recipe is based on simulations from hit-and-stick regime
up to a catastrophic destruction.
![\begin{figure}
\par\includegraphics[width=8.5cm,clip]{10682fg15.eps}
\end{figure}](/articles/aa/full_html/2009/44/aa10682-08/img149.png)
|
Figure 15: Algorithm to choose between local and global recipes. |
| Open with DEXTER | |
The main difference between the local and the global sub-recipes stems
from the mass ratio between impactor and target. However, small
projectiles, when carrying sufficient energy (i.e., impacting with very
high speeds), may also shatter an entire large target aggregate,
i.e. causing a global effect. Therefore, the global recipe must be
used not only at mass ratio close to unity, but also at impact
energies sufficient to globally affect the entire
aggregate. Figure 15 presents an algorithm used to
distinguish between the local and the global
recipes. When a collision of aggregates characterized by their masses
mi, filling factors ![]() ,
and some material properties, occurs
at a given impact energy, one must check whether the collision is in
the recipe domain (restructuring or fragmentation) or in the
hit-and-stick regime. The test checks whether the energy is
sufficient to cause any restructuring. If the condition
,
and some material properties, occurs
at a given impact energy, one must check whether the collision is in
the recipe domain (restructuring or fragmentation) or in the
hit-and-stick regime. The test checks whether the energy is
sufficient to cause any restructuring. If the condition
![]() is satisfied, the hit-and-stick
mechanism is applied (for details see Ormel et al. 2007;
Ormel et al. 2009). Otherwise, a second check is
performed. The global recipe is applied if any of the two following
conditions is true:
is satisfied, the hit-and-stick
mechanism is applied (for details see Ormel et al. 2007;
Ormel et al. 2009). Otherwise, a second check is
performed. The global recipe is applied if any of the two following
conditions is true:

or
If none of the above is true, the local recipe must be used.
![\begin{figure}
\par\includegraphics[width=14cm,clip]{10682fg16.eps}
\end{figure}](/articles/aa/full_html/2009/44/aa10682-08/img154.png)
|
Figure 16: Parameters as a function of the filling factor and impact energy. Clockwise: mean mass of the Gaussian component, width of the Gaussian component, mass ratio of the power-law to Gaussian component, slope of the power-law. |
| Open with DEXTER | |
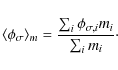
Therefore, the filling factor that should be used is dominated by that of the more massive aggregate. In particular, the outcome of a collision between particles of different masses depends very much on the porosity of the target aggregates and how deep it can be penetrated. Collisions of equal mass particles, on the other hand, are not dominated by one species. Therefore, the contribution from both aggregates should be about equal. The compression or decompression is expected to be weaker than for fluffy particles, as compact aggregates are more resistant to restructuring (see Sect. 3).
4.6 A complete quantitative description
The mass distribution of the collisional outcome for equal mass colliding projectiles can be constructed using parameters read from Tables 6, 7. Figure 16 shows contour plots of the required 4 parameters. Intuitively, the mean mass of the large component (upper left panel) decreases with increasing energy. Similarly, the width of this component (upper right panel) decreases with increasing energy as a result of fragmentation and grazing collisions. Therefore, faster impacts cause formation of the largest fragments with the lower mass, and the tail of the Gaussian component decreases. This shattered mass shifts then to the small fragments power-law component. The power-law component does not exist at low energies and only large aggregates are produced in this stage due to growth and grazing collisions. Thus, the slope of this component (lower left panel) starts to decrease only at larger energies. Note that for a weak erosion, where the slope of the power-law cannot be determined we assume without loss of generality q=0.![\begin{figure}
\par\includegraphics[width=8.5cm,clip]{10682fg17.eps}
\end{figure}](/articles/aa/full_html/2009/44/aa10682-08/img156.png)
|
Figure 17:
The change in the filling factor relative to the
initial filling factor
|
| Open with DEXTER | |
Figure 17 shows compression of aggregates in the global recipe. This
contour plot
illustrates Table 9. The low-energy collisions cause
a decrease in the filling factor
![]() for all aggregates. The
effect of decompaction is similar for all particles, although the
strongest decrease in
for all aggregates. The
effect of decompaction is similar for all particles, although the
strongest decrease in
![]() is observed for the most compact
aggregates. Faster impacts result in compression and an increase in
the filling factor. Aggregates with the lowest filling factor
is observed for the most compact
aggregates. Faster impacts result in compression and an increase in
the filling factor. Aggregates with the lowest filling factor
![]() show the lowest structural change. The density increases only by a
factor of about
show the lowest structural change. The density increases only by a
factor of about
![]() at the highest
energies. For very compact aggregates, at the same energy, this change
is somewhat higher (
at the highest
energies. For very compact aggregates, at the same energy, this change
is somewhat higher (
![]() ). This value is
strongly affected by fragmentation. The average largest collision
remnant in this case consists of only 0.16 of the total mass. The
maximum compression observed for head-on collisions at an energy
of about
). This value is
strongly affected by fragmentation. The average largest collision
remnant in this case consists of only 0.16 of the total mass. The
maximum compression observed for head-on collisions at an energy
of about
![]() reaches only about 0.89 of the initial
filling factor. This means that the average largest fragment is
decompressed. Fluffy aggregates, both fractal and non fractal, show
similar behavior. For these fluffy particles the boundary between
decompaction and compression is at the energies of about
reaches only about 0.89 of the initial
filling factor. This means that the average largest fragment is
decompressed. Fluffy aggregates, both fractal and non fractal, show
similar behavior. For these fluffy particles the boundary between
decompaction and compression is at the energies of about
![]() .
The filling factor increases further at higher
energies. The maximum compression is reached at highest energies.
The largest fragment at this energy is about a quarter of the total
mass, except of the most fluffy aggregates, that are very difficult to
disrupt completely.
.
The filling factor increases further at higher
energies. The maximum compression is reached at highest energies.
The largest fragment at this energy is about a quarter of the total
mass, except of the most fluffy aggregates, that are very difficult to
disrupt completely.
4.6.1 Global recipe
In this section we present tables containing the global recipe. They
describe both the distribution of fragments (Tables 5-8) and the change in the filling factor of the
largest fragment, relative to the initial
![]() (Table 9).
(Table 9).
The shape of the distribution of fragment masses depends on the number
of contacts that can be broken. The higher the energy is, the
stronger and steeper the power-law component is. Therefore, the
collision energy is normalized to the breaking energy
![]() .
Moreover, the energy is distributed globally in the aggregates (hence
the name global recipe). Therefore, the energy is also scaled
with the total number of particles N (this is approximately
equal to the number of contacts). The first column in each of
Tables 5-8 shows
the normalized energy
.
Moreover, the energy is distributed globally in the aggregates (hence
the name global recipe). Therefore, the energy is also scaled
with the total number of particles N (this is approximately
equal to the number of contacts). The first column in each of
Tables 5-8 shows
the normalized energy
![]() .
The following four columns
indicate the recipe output quantity (see Table 4) for
aggregates with different initial filling factors
.
The following four columns
indicate the recipe output quantity (see Table 4) for
aggregates with different initial filling factors
![]() .
Table 5 presents the slope q of the
power-law component of small fragments. The mass normalization can be
done with the total mass of colliding aggregates m1+m2 and the
ratio
.
Table 5 presents the slope q of the
power-law component of small fragments. The mass normalization can be
done with the total mass of colliding aggregates m1+m2 and the
ratio ![]() of the mass in this power-law component over the
Gaussian component given in Table 6.
of the mass in this power-law component over the
Gaussian component given in Table 6.
Table 5: The slope of the power-law component.
Table 6: Mass ratio of the small fragments component (power-law) to the largest fragment component (the Gaussian).
The Gaussian component can be reconstructed using three quantities;
the ratio of the mass in the two components ![]() ,
the mean mass
,
the mean mass
![]() ,
and the width
,
and the width
![]() .
Table 7
provides the mean mass, and the width is given in
Table 8.
.
Table 7
provides the mean mass, and the width is given in
Table 8.
Table 7: Mean mass of the Gaussian component normalized to the total mass.
Table 8: Width of the large fragments component (Gaussian) normalized to the total mass.
The change in porosity of aggregates depends on the number of contacts
that can roll, as the rolling is the main mechanism responsible for
the restructuring. Therefore, the energy in the first column of
Table 9 is normalized to the rolling energy
![]() .
The restructuring also affects the structure of
aggregates globally. Thus, the collision energy is also normalized to
the total number of monomers, which approximates the initial number of
contacts. Table 9 shows the change in the
geometrical filling factor
.
The restructuring also affects the structure of
aggregates globally. Thus, the collision energy is also normalized to
the total number of monomers, which approximates the initial number of
contacts. Table 9 shows the change in the
geometrical filling factor
![]() relative to the initial density
relative to the initial density
![]()
![]() .
This new filling factor represents large fragments
from the Gaussian component. The power-law component is simply
described by Eq. (14).
.
This new filling factor represents large fragments
from the Gaussian component. The power-law component is simply
described by Eq. (14).
The difference in energy scaling applied to the part of the recipe
describing the fragment distribution and to the part of the recipe
providing the compaction, respectively, accounts for cases of
different material properties, where the ratio of the rolling
energy
![]() to the breaking energy
to the breaking energy
![]() may be different than
for Quartz. Therefore, different physical processes
(compaction/decompaction and erosion/fragmentation) are selected
by different scalings, i.e., restructuring scales with the rolling
energy, while the fragmentation scales with the breaking energy.
may be different than
for Quartz. Therefore, different physical processes
(compaction/decompaction and erosion/fragmentation) are selected
by different scalings, i.e., restructuring scales with the rolling
energy, while the fragmentation scales with the breaking energy.
Table 9:
A fractional change in the geometrical filling factor
![]() ,
averaged over the impact parameter.
,
averaged over the impact parameter.
4.6.2 Local recipe
The local recipe describes the outcome of a collision between a small aggregate and a large target. For high energy impacts, erosion occurs, resulting in what is basically the large target aggregate accompanied by a distribution of small fragments. The energy is locally distributed over monomers of the small impactor and some surface grains of the target. Thus, in this case we scale the energy with the reduced number of monomersTable 10: Mean ejected mass relative to the projectile mass. The mass ratio of the colliding particles is 0.001.
Table 10 shows the mean mass that is ejected during a
collision, relative to the mass of a smaller aggregate. The first
column indicates the scaled energy, and the following four columns
show the mean ejected mass for collisions of aggregates of different
initial filling factors
![]()
![]() .
The mass of the cratered
target aggregate can then be immediately calculated.
.
The mass of the cratered
target aggregate can then be immediately calculated.
The structure modification in the local recipe applies to the large
target aggregate only, as the filling factor of small fragments
follows a simple relation (see Eq. (14)). Bombarding large
aggregates with small projectiles results in very small relative
change in the filling factor (that of the target particle), as the
filling factor quantifies the global structure of the large target
aggregate. In this case, the energy scaling should thus be done in
respect to the total number of monomers N, which is almost equal
to the number of particles in the larger aggregate. Moreover, the
restructuring mechanisms is determined by the number of monomers that
can roll. Thus the energy is scaled by the rolling energy
![]() .
.
Table 11 presents the relative change in the geometrical
filling factor for the target particle. The energy listed in the first
column is normalized to the rolling energy
![]() and to the
total number of monomers N.
and to the
total number of monomers N.
Table 11:
Relative change in the filling factor
![]() .
Mass
ratio of the two colliding particle is 10-3.
.
Mass
ratio of the two colliding particle is 10-3.
5 Conclusions and future work
In this work we present results of the extensive parameter study of collisions of three-dimensional aggregates. The outcome of a collision is provided in terms of the mass distribution of fragments as well as the structure of the produced particles. These simulations agree with the experimental results in this size regime and provide scaling that allows for extrapolation to slightly larger sizes as well as different material properties of monomers (i.e., composition and size of individual grains).
Our simulations indicate new important mechanisms that influence both the structure and the mass distribution of aggregates:
- The restructuring of aggregates depends mainly on the collision energy. The compaction is reserved for head-on impacts, while offset collisions produce elongated and decompacted particles.
- In the case of erosion and shattering, the structure of small fragments can be written in a very simple form (see Eq. (14)), regardless of the initial compactness of colliding aggregates or the impact energy.
- The mass distribution of particles produced in a collision consists of two individual components. The power-law distribution of small fragments is accompanied by a strongly pronounced component of large fragments.
- The shape of the mass distribution for the collision outcome averaged over the impact parameter is generally independent of the impact energy for slow collisions. At high energies, however, the shape of the distribution is almost independent of the structure of the colliding particles.
We thank J. Blum for useful discussions and hospitality during several visits. We also thank M. Min for providing us with the program to produce the fractal aggregates and C. Ormel and A. Tielens for useful discussions that significantly improved the final shape of the recipe. The anonymous referee's careful review has lead to a useful resturcturing and compaction of the paper. We acknowledge SARA super computer center for access to the Lisa computer cluster, which made this parameter study possible. We also acknowledge financial support of Leids Kerkhoven-Bosscha Fonds. This work was supported by the Nederlandse Organisatie voor Wetenschapelijk Onderzoek, Grant 614.000.309.
References
- Ball, R. C., & Witten, T. A. 1984, Phys. Rev. A, 29, 2966 [CrossRef] [NASA ADS]
- Beckwith, S. V. W., Henning, T., & Nakagawa, Y. 2000, Protostars and Planets IV, 533
- Blum, J., & Muench, M. 1993, Icarus, 106, 151 [CrossRef] [NASA ADS]
- Blum, J., & Wurm, G. 2000, Icarus, 143, 138 [CrossRef] [NASA ADS]
- Blum, J., Wurm, G., Kempf, S., et al. 2000, Phys. Rev. Lett., 85, 2426 [CrossRef] [NASA ADS]
- Blum, J., Schräpler, R., Davidsson, B. J. R., & Trigo-Rodríguez, J. M. 2006, ApJ, 652, 1768 [CrossRef] [NASA ADS]
- Brauer, F., Henning, T., & Dullemond, C. P. 2008, A&A, 487, L1 [EDP Sciences] [CrossRef] [NASA ADS]
- Chokshi, A., Tielens, A. G. G. M., & Hollenbach, D. 1993, ApJ, 407, 806 [CrossRef] [NASA ADS]
- Ciesla, F. J. 2007, ApJ, 654, L159 [CrossRef] [NASA ADS]
- Derjaguin, B. V., Muller, V. M., & Toporov, Y. P. 1975, J. Colloid Interface Sci., 53, 314 [CrossRef]
- Dominik, C., & Nübold, H. 2002, Icarus, 157, 173 [CrossRef] [NASA ADS]
- Dominik, C. & Tielens, A. G. G. M. 1995, Philos. Mag. A, 72, 783 [CrossRef] [NASA ADS]
- Dominik, C. & Tielens, A. G. G. M. 1996, Philos. Mag. A, 73, 1279 [CrossRef] [NASA ADS]
- Dominik, C., & Tielens, A. G. G. M. 1997, ApJ, 480, 647 [CrossRef] [NASA ADS]
- Filippov, A., Zurita, M., & Rosner, D. 2000, J. Colloid Interface Sci., 229, 261 [CrossRef]
- Fujiwara, A., Kamimoto, G., & Tsukamoto, A. 1977, Icarus, 31, 277 [CrossRef] [NASA ADS]
- Heim, L., Blum, J., Preuss, M., & Butt, H. 1999, Phys. Rev. Lett., 83, 3328 [CrossRef] [NASA ADS]
- Johansen, A., Klahr, H., & Henning, T. 2006, ApJ, 636, 1121 [CrossRef] [NASA ADS]
- Johnson, K., Kendall, K., & Roberts, A. 1971, Proc. Roy. Soc. A, 324, 301 [CrossRef] [NASA ADS]
- Kempf, S., Pfalzner, S., & Henning, T. K. 1999, Icarus, 141, 388 [CrossRef] [NASA ADS]
- Krause, M., & Blum, J. 2004, Phys. Rev. Lett., 93, 021103 [CrossRef] [NASA ADS]
- Langkowski, D., Teiser, J., & Blum, J. 2008, ApJ, 675, 764 [CrossRef] [NASA ADS]
- Onoda, G. Y., & Liniger, E. G. 1990, Phys. Rev. Lett., 64, 2727 [CrossRef] [NASA ADS]
- Ormel, C. W., Spaans, M., & Tielens, A. G. G. M. 2007, A&A, 461, 215 [EDP Sciences] [CrossRef] [NASA ADS]
- Ormel, C. W., Paszun, D., Dominik, C., & Tielens, A. G. G. M. 2009, A&A, in press
- Ossenkopf, V. 1993, A&A, 280, 617 [NASA ADS]
- Paszun, D., & Dominik, C. 2006, Icarus, 182, 274 [CrossRef] [NASA ADS]
- Paszun, D., & Dominik, C. 2008, A&A, 484, 859 [EDP Sciences] [CrossRef] [NASA ADS]
- Paszun, D., Borel, H., & Dominik, C. 2009, A&A, submitted
- Poppe, T., Blum, J., & Henning, T. 2000, ApJ, 533, 454 [CrossRef] [NASA ADS]
- Schäfer, C., Speith, R., & Kley, W. 2007, A&A, 470, 733 [EDP Sciences] [CrossRef] [NASA ADS]
- Sirono, S.-I. 2004, Icarus, 167, 431 [CrossRef] [NASA ADS]
- Wada, K., Tanaka, H., Suyama, T., Kimura, H., & Yamamoto, T. 2007, ApJ, 661, 320 [CrossRef] [NASA ADS]
- Wurm, G., Paraskov, G., & Krauss, O. 2005, Icarus, 178, 253 [CrossRef] [NASA ADS]
Footnotes
- ... SAND
![[*]](/icons/foot_motif.png)
- Soft Aggregate Numerical Dynamics.
- ... about
- Although the value of 0.635 correspond to filling factor defined in respect to the outer radius
 and not
  ,
both radii are equal for these
compact aggregates.
,
both radii are equal for these
compact aggregates.
- ...
study
- The quantitative recipe presented in Sect. 4 does of course make use of the entire parameter study.
- ... contacts
- Note that
in Fig. 6 the energy is normalized to the
reduced number of monomers
 .
Therefore, the energy per contact is a factor of 103 lower than
in the case of a collision of particles of equal mass.
.
Therefore, the energy per contact is a factor of 103 lower than
in the case of a collision of particles of equal mass.
All Tables
Table 1: Impact parameters and aggregate properties explored in this study.
Table 2: The collision recipe from Dominik & Tielens (1997) for a 2D case.
Table 3: Properties of monomers used in this study.
Table 4: Quantities provided by the recipe to reproduce the mass distribution.
Table 5: The slope of the power-law component.
Table 6: Mass ratio of the small fragments component (power-law) to the largest fragment component (the Gaussian).
Table 7: Mean mass of the Gaussian component normalized to the total mass.
Table 8: Width of the large fragments component (Gaussian) normalized to the total mass.
Table 9:
A fractional change in the geometrical filling factor
![]() ,
averaged over the impact parameter.
,
averaged over the impact parameter.
Table 10: Mean ejected mass relative to the projectile mass. The mass ratio of the colliding particles is 0.001.
Table 11:
Relative change in the filling factor
![]() .
Mass
ratio of the two colliding particle is 10-3.
.
Mass
ratio of the two colliding particle is 10-3.
All Figures
|
|
Figure 1:
Sample aggregates used in our
parameter study. Each of particles is made of 1000 monomers.
Annotations show
|
| Open with DEXTER | |
| In the text | |
|
|
Figure 2:
he filling factor as a function
of the ratio
|
| Open with DEXTER | |
| In the text | |
|
|
Figure 3: The mass of the largest collision remnant for central and offset collisions as a function of the impact energy. Diamonds correspond to compact aggregates, while triangles correspond to fluffy particles. Error bars indicate standard deviation and each point represents a mean value from 6 individual simulations (see Sect. 2.2). |
| Open with DEXTER | |
| In the text | |
|
|
Figure 4:
Mass distribution resulting from head-on collisions of A&C -
fluffy (
|
| Open with DEXTER | |
| In the text | |
| |
Figure 5:
Slopes of the power-law size
distribution of small fragments as a function of impact
energy. Different symbols correspond to different masses of the
colliding aggregates. The left panel (A) corresponds to fluffy
aggregates (
|
| Open with DEXTER | |
| In the text | |
|
|
Figure 6:
Mass distribution resulting from central collisions between a
monomer and an aggregate made of 1000 grains. The presented
distributions result from collisions with compact aggregate with the
filling factor of
|
| Open with DEXTER | |
| In the text | |
|
|
Figure 7:
Mass distribution as
resulted from off-center (
|
| Open with DEXTER | |
| In the text | |
|
|
Figure 8: Schematic plot of the evolution of the fragment distribution as a function of different parameters. |
| Open with DEXTER | |
| In the text | |
|
|
Figure 9:
Images of aggregates formed in
collisions at different impact energies E and at different impact
parameters b. The aggregates have an initial filling factor
of
|
| Open with DEXTER | |
| In the text | |
|
|
Figure 10:
Images of aggregates formed in collisions at
different impact energies E and at different impact parameters b. Aggregates
have the filling factor of
|
| Open with DEXTER | |
| In the text | |
|
|
Figure 11:
The geometrical filling factor
|
| Open with DEXTER | |
| In the text | |
|
|
Figure 12: Sketch of the compactness evolution dependence on different parameters. See text. |
| Open with DEXTER | |
| In the text | |
|
|
Figure 13:
Distributions averaged over the
impact parameter. Results for fluffy and compact aggregates at energies A:
|
| Open with DEXTER | |
| In the text | |
|
|
Figure 14:
The filling factor
|
| Open with DEXTER | |
| In the text | |
|
|
Figure 15: Algorithm to choose between local and global recipes. |
| Open with DEXTER | |
| In the text | |
|
|
Figure 16: Parameters as a function of the filling factor and impact energy. Clockwise: mean mass of the Gaussian component, width of the Gaussian component, mass ratio of the power-law to Gaussian component, slope of the power-law. |
| Open with DEXTER | |
| In the text | |
|
|
Figure 17:
The change in the filling factor relative to the
initial filling factor
|
| Open with DEXTER | |
| In the text | |
Copyright ESO 2009
Current usage metrics show cumulative count of Article Views (full-text article views including HTML views, PDF and ePub downloads, according to the available data) and Abstracts Views on Vision4Press platform.
Data correspond to usage on the plateform after 2015. The current usage metrics is available 48-96 hours after online publication and is updated daily on week days.
Initial download of the metrics may take a while.