| Issue |
A&A
Volume 507, Number 2, November IV 2009
|
|
|---|---|---|
| Page(s) | 621 - 634 | |
| Section | Cosmology (including clusters of galaxies) | |
| DOI | https://doi.org/10.1051/0004-6361/200809774 | |
| Published online | 08 September 2009 | |
A&A 507, 621-634 (2009)
Intracluster light in the Virgo cluster: large scale distribution![[*]](/icons/foot_motif.png)
N. Castro-Rodriguéz1 - M. Arnaboldi2,3 - J. A. L. Aguerri1 - O. Gerhard4 - S. Okamura5 - N. Yasuda6 - K. C. Freeman7
1 - Instituto de Astrofísica de Canarias, C/O Vía
Láctea s/n, 38200 La Laguna, Spain
2 - European Southern Observatory, Karl-Schwarzschild-Strasse 2,
85748 Garching, Germany
3 - INAF, Osservatorio Astronomico di Pino Torinese, 10025 Pino
Torinese, Italy
4 - Max-Planck-Institut, Institut für Extraterrestrische Physik,
Giessenbachstrasse, 85741 Garching, Germany
5 - Department of Astronomy and Research Center for the Early
Universe, School of Science, University of Tokyo, Tokyo 113-0033,
Japan
6 -
Institute for Cosmic Ray Research, University of Tokyo, Kashiwa,
Chiba 277-8582, Japan
7 - Research School of Astronomy and Astrophysics, Mount Stromlo
Observatory, Cotter Road, Weston Creek, ACT 2611, Australia
Received 13 March 2008 / Accepted 11 August 2009
Abstract
Aims. The intracluster light (ICL) is a faint diffuse
stellar component of clusters made of stars that are not bound to
individual galaxies. We have carried out a large scale study of this
component in the nearby Virgo cluster.
Methods. The diffuse light is traced using planetary nebulae
(PNe). The surveyed areas were observed with a narrow-band filter
centered on the [OIII]
![]() Å
emission line redshifted to the Virgo cluster distance (the on-band
image), and a broad-band filter (the off-band image). For some fields,
additional narrow band imaging data corresponding to the H
Å
emission line redshifted to the Virgo cluster distance (the on-band
image), and a broad-band filter (the off-band image). For some fields,
additional narrow band imaging data corresponding to the H![]() emission were also obtained. The PNe are detected in the on-band image due to their strong emission in the [OIII]
emission were also obtained. The PNe are detected in the on-band image due to their strong emission in the [OIII]
![]() Å line, but disappear in the off-band image. The contribution of Ly-
Å line, but disappear in the off-band image. The contribution of Ly-![]() emitters at z=3.14 are corrected statistically using blank field surveys, when the H
emitters at z=3.14 are corrected statistically using blank field surveys, when the H![]() image at the field position is not available.
image at the field position is not available.
Results. We have surveyed a total area of 3.3 square
degrees in the Virgo cluster with eleven fields located at different
radial distances. Those fields located at smaller radii than
80 arcmin from the cluster center contain most of the detected
diffuse light. In this central region of the cluster, the ICL has a
surface brightness in the range
![]() mag arsec-2,
it is not uniformly distributed, and represents about 7% of the total
galaxy light in this area. At distances larger than 80 arcmin the
ICL is confined to single fields and individual sub-structures, e.g. in
the sub-clump B, the M 60/M 59 group. For several fields at 2
and 3 degrees from the Virgo cluster center we set only upper
limits.
mag arsec-2,
it is not uniformly distributed, and represents about 7% of the total
galaxy light in this area. At distances larger than 80 arcmin the
ICL is confined to single fields and individual sub-structures, e.g. in
the sub-clump B, the M 60/M 59 group. For several fields at 2
and 3 degrees from the Virgo cluster center we set only upper
limits.
Conclusions. These results indicate that the ICL is not
homogeneously distributed in the Virgo core, and it is concentrated in
the high density regions of the Virgo cluster, e.g. the cluster core
and other sub-structures. Outside these regions, the ICL is confined
within areas of ![]() 100 kpc
in size, where tidal effects may be at work. These observational
results link the formation of the ICL with the formation history of the
most luminous cluster galaxies.
100 kpc
in size, where tidal effects may be at work. These observational
results link the formation of the ICL with the formation history of the
most luminous cluster galaxies.
Key words: galaxies: clusters: individual: Virgo - galaxies: halos - planetary nebulae: general
1 Introduction
Galaxy clusters are the most massive gravitationally bound structures known in the Universe. In a volume of a few Mpc3, they contain a large number of galaxies that interact with each other, the hot gas and with the global cluster gravitational potential. Thus, in these high density regions the evolution of galaxies may be influenced by the environment.
With new numerical algorithms and fast computers, we are able to simulate large volumes of the Universe and follow the evolution of galaxies in different environments as a function of redshift. These simulations show that galaxies undergo transformations over time in cluster environments. They can evolve over short timescales (less than 1 Gyr) due to different mechanisms such as fast interactions between galaxies and with the cluster gravitational potential (Moore et al. 1996; Merritt 1984), gas stripping (Gunn & Gott 1972; Quilis et al. 2000) and starvation (Bekki et al. 2002; Larson et al. 1980). Moreover, in the cluster central region, where the galaxy density is high, galaxies can also undergo important transformations over larger timescales due to galaxy mergers (Mihos 2004, and references therein). According to these results, galaxy evolution is not frozen at the earliest phases of the cluster formation, as described in earlier works (Richstone & Malumuth 1983; Merritt 1984), but is still active today.
Hierarchical structure formation theories predict that massive galaxy clusters are built through the infall of matter, i.e. galaxies, groups and sub-clusters, along large scale filaments (White & Rees 1978; West et al. 1995). Since mass accretion is still active today, nearby galaxy clusters may be at different epochs of their mass assembly, and they may still be in a un-mixed state. The dynamical state of a galaxy cluster has been traditionally measured by determining the amount of substructure in the galaxy distribution and in the X-ray emitting hot intracluster medium, but the inferred results do not always agree (see Ramella et al. 2007, and references therein).
Table 1: Summary of the field positions, filter characteristics and exposure times for the narrow-band (on-band) images.
Table 2: Summary of the filter characteristics and exposure times for the broad-band (off-band) images in the various fields.
The gravitational forces acting on galaxies during cluster formation and its evolution unbind a fraction of their stars, which then end-up orbiting in the intracluster region. This unbound diffuse stellar component is the so-called intracluster light (ICL). Numerical simulations show that the amount of ICL in clusters depends on the cluster mass and dynamical state (Willman et al. 2004; Murante et al. 2004; Sommer-Larsen et al. 2005) . A more massive, older, dynamically evolved cluster may contain a larger amount of ICL than a less massive or a dynamically younger system (Rudick et al. 2006; Murante et al. 2007). Furthermore, in a highly evolved dynamically old cluster the ICL morphology would be more diffuse, with relative few streams, while a dynamically young cluster dominated by groups still in the process of merging is likely to be dominated by ICL found in streams (Rudick et al. 2009). Therefore the study of the amount, distribution and kinematics of the ICL may provide information on the cluster accretion history and evolutionary state, as well as about the evolution of cluster galaxies.
The ICL has been mapped using several observational techniques, e.g. deep broadband imaging (Krick & Bernstein 2007; Mihos et al. 2005; Zibetti et al. 2005; Feldmeier et al. 2004b,2002), and the detection of individual stars associated with the diffuse stellar component, both red giant branch stars (Williams et al. 2007; Ferguson et al. 1998; Durrell et al. 2002) and intracluster planetary nebulae (ICPNe Feldmeier et al. 2004a; Aguerri et al. 2006; Arnaboldi et al. 1996; Feldmeier et al. 2003; Arnaboldi et al. 2002; Aguerri et al. 2005; Feldmeier et al. 1998; Arnaboldi et al. 2003). In particular, ICPNe are the only component of the ICL whose kinematics can be measured (Freeman et al. 2000; Arnaboldi et al. 2004; Gerhard et al. 2007,2005; Doherty et al. 2009).
Several studies investigate the properties of the ICL in the core
of the nearby Virgo cluster. Expanding on our earlier imaging work in
the Virgo cluster core
(Okamura et al. 2002; Arnaboldi et al. 2002; Aguerri et al. 2005; Arnaboldi et al. 2003), we have now
completed a survey campaign of the ICL distribution on larger
scales, outside the center of the Virgo cluster. In total, we have
now covered more than 3 square degrees in Virgo, at eleven different
positions in the cluster and at distances between 80 arcmin and some
100 arcmin from the Virgo cluster center. In several of the new fields,
the ICL is at least two magnitudes fainter than in the core region.
These new results are in agreement with observations of intermediate
redshift clusters (Zibetti et al. 2005), and with the results of recent
high resolution hydrodynamical simulations of cluster formation in a
![]() CDM universe (Murante et al. 2004; Rudick et al. 2006; Murante et al. 2007), which
predict that the ICL is more centrally concentrated than cluster
galaxies and that the largest portion of the ICL is formed during the
assembly of the most luminous cluster galaxies.
CDM universe (Murante et al. 2004; Rudick et al. 2006; Murante et al. 2007), which
predict that the ICL is more centrally concentrated than cluster
galaxies and that the largest portion of the ICL is formed during the
assembly of the most luminous cluster galaxies.
In the following, we will present the results of a systematic and
homogeneous ICPNe survey in regions outside the Virgo core and discuss
the results jointly with ICPN survey data available for the Virgo
cluster. In Sect. 2 we will present the data for the new fields in
the Virgo cluster. The technique for the selection of ICPNe will be
summarized in Sect. 3. The possible contamination of the ICPN
catalog by background emission-line objects is quantified in
Sect. 4. In Sect. 5 we use the number of detected ICPNe to infer
the surface brightness of the light at the fields' position and
compare our results with previous works. We discuss the distribution
of the ICL from the Virgo core to the outer distant fields at ![]() 200' = 0.8 Mpc, and its implications for current models for the
formation of ICL in clusters, in Sect. 6. In Sect. 7 we set limits
on the contribution from a possible homogeneous luminous density in
the nearby Universe to our PN sample, and summarize our
conclusions in Sect. 8.
200' = 0.8 Mpc, and its implications for current models for the
formation of ICL in clusters, in Sect. 6. In Sect. 7 we set limits
on the contribution from a possible homogeneous luminous density in
the nearby Universe to our PN sample, and summarize our
conclusions in Sect. 8.
In what follows we consider the center of the Virgo cluster at the
position of Cluster A (Binggeli et al. 1987), at the peak of the luminosity
density of all galaxies in the Virgo cluster, e.g.
![]() :27:49.95
:27:49.95
![]() :01:24.57. We adopt a distance of 15 Mpc to the Virgo cluster center, thus
1'' = 72.7 pc.
:01:24.57. We adopt a distance of 15 Mpc to the Virgo cluster center, thus
1'' = 72.7 pc.
2 Observations and data reduction
![\begin{figure}
\par\includegraphics[width=7cm,clip]{09774fg1.eps} \end{figure}](/articles/aa/full_html/2009/44/aa09774-08/img26.png)
|
Figure 1:
Finding chart of the Virgo fields discussed in this
paper. The circles indicate radial distances of 1, 2, 3 and 3.5 degrees from the Virgo cluster center identified by Binggeli et al. (1987):
|
| Open with DEXTER | |
Previous ICPN surveys in the Virgo cluster were carried out mostly in the Virgo core (Feldmeier et al. 2004a,2003; Arnaboldi et al. 2002; Aguerri et al. 2005; Feldmeier et al. 1998; Arnaboldi et al. 2003) and around M 49 (Feldmeier et al. 2004a).
We have now collected additional data in several fields located at larger radial distances from the center of the Virgo cluster. In total we have now six new fields, which in addition to those surveyed in Aguerri et al. (2005) cover a total area of 3.3 square degrees. The Virgo cluster SDSS image and the location of the eleven fields (five fields surveyed in previous studies by our group and the six new ones) are shown in Fig. 1. We indicate also the areas surveyed by Feldmeier et al. (2004a,2003,1998) and the name of the brightest Virgo galaxies. The results of the survey for ICPNe in the LPRX, LPE, LPS, LSF, SUB2, SUB3 field are presented here for the first time. In Tables 1 and 2 we give the eleven fields' IDs and locations.
Three of the new fields were observed during two observing runs in
March 2002 and 2004 with the Wide Field Camera (WFC) on the 2.5 m
Isaac Newton Telescope (INT) at Roque de los Muchachos Observatory (La
Palma, see Tables 1 and 2). We refer to them hereafter as the LPRX,
LPE and LPS fields. The images from this camera consists of a mosaic
of four CCDs with a total field of view of
![]() .
The
pixel scale is 0
.
The
pixel scale is 0
![]() 333, and the mean readout noise and gain of the
detectors are 6.1 ADU pixel-1 and 2.8 e- ADU-1,
respectively. We imaged these fields through a 60
333, and the mean readout noise and gain of the
detectors are 6.1 ADU pixel-1 and 2.8 e- ADU-1,
respectively. We imaged these fields through a 60 ![]() wide filter
centred at 5027
wide filter
centred at 5027 ![]() ,
which contains the wavelength of the
[OIII]
,
which contains the wavelength of the
[OIII]
![]() emission at the redshift of the Virgo
cluster. We will refer to this narrow-band filter as the ''on-band''
filter (see Table 1). We also took an additional broad-band image per
field through a filter centred on the B band (4407
emission at the redshift of the Virgo
cluster. We will refer to this narrow-band filter as the ''on-band''
filter (see Table 1). We also took an additional broad-band image per
field through a filter centred on the B band (4407 ![]() )
and 1022
)
and 1022 ![]() wide. The broad-band filter is referred to as the ''off-band'' (see
Table 2). The total exposures were 27 000 s for the on-band images
and 15 600 s for the off-band.
wide. The broad-band filter is referred to as the ''off-band'' (see
Table 2). The total exposures were 27 000 s for the on-band images
and 15 600 s for the off-band.
In April 2004 we acquired another field (LSF) with the Wide Field
Imager (WFI) on the ESO/MPI 2.2 m telescope located at La Silla
Observatory (Chile). The full image from this camera consists of a
mosaic of eight CCD images, covering 34
![]() on the sky. Each
CCD has a pixel scale of
on the sky. Each
CCD has a pixel scale of
![]() ,
and an average readout noise and
gain of 4.5 ADU pixel-1 and 2.2 e- ADU-1,
respectively. The field was imaged through an on-band 80
,
and an average readout noise and
gain of 4.5 ADU pixel-1 and 2.2 e- ADU-1,
respectively. The field was imaged through an on-band 80 ![]() wide
filter, centred at 5023
wide
filter, centred at 5023 ![]() .
In addition we also imaged this field
through an off-band V-band 894
.
In addition we also imaged this field
through an off-band V-band 894 ![]() wide filter, centred at 5395
wide filter, centred at 5395 ![]() (see Tables 1 and 2).
(see Tables 1 and 2).
From January to April 2004 two fields in the Virgo Cluster (SUB2 and
SUB3) were imaged with the Suprime-Cam 10 k ![]() 8 k mosaic camera, at
the prime focus of the 8.2 m Subaru telescope
(Miyazaki et al. 2002). The field of view of these images covers an
area of 34
8 k mosaic camera, at
the prime focus of the 8.2 m Subaru telescope
(Miyazaki et al. 2002). The field of view of these images covers an
area of 34
![]() ,
with a pixel size of
,
with a pixel size of
![]() .
The fields
were imaged through two on-band and two off-band filters, the
standard V and R filters (see Tables 1 ands 2).
.
The fields
were imaged through two on-band and two off-band filters, the
standard V and R filters (see Tables 1 ands 2).
The new fields at larger cluster distances from M 87 are complementary
to those studied in the Virgo cluster core; their parameters are
reported in Tables 1 and 2. The data reduction and calibration of the
new fields, LPRX, LPE, LPS and LSF, follow the procedure described in
Arnaboldi et al. (2002, hereafter Paper I). The data reduction is
performed using the MSCRED package in IRAF![]() . Calibrations are done using several Landolt
fields for the off-band filters, and spectrophotometric stars for the
on-bands. Fluxes are normalized to the AB magnitude system, following
Theuns & Warren (1997). A detailed description of the calibration
steps and the relation between the AB magnitudes and the m(5007)
[OIII] magnitude introduced by Jacoby (1989) is given in
Paper I. Table 3 shows the conversion constant (K) between the two
magnitude systems:
. Calibrations are done using several Landolt
fields for the off-band filters, and spectrophotometric stars for the
on-bands. Fluxes are normalized to the AB magnitude system, following
Theuns & Warren (1997). A detailed description of the calibration
steps and the relation between the AB magnitudes and the m(5007)
[OIII] magnitude introduced by Jacoby (1989) is given in
Paper I. Table 3 shows the conversion constant (K) between the two
magnitude systems:
![]() .
.
The data for the additional fields observed with the SuprimeCam at
the SUBARU telescope (SUB2 and SUB3) are processed using the standard
data reduction package developed for SuprimeCam data. The photometric
calibrations for the SUB2 and SUB3 data are obtained using Landolt
fields for the broad bands, and spectrophotometric stars for the
narrow bands![]() .
.
For completeness, Tables 1 and 2 provide a summary of the field
positions, filter characteristics and exposure times for on-band and
off band exposures for the surveyed areas in the Virgo core. Throughout this
work we will use the notation ![]() and
and ![]() to refer the on-band
and off-band magnitudes of the objects in the AB photometric system.
to refer the on-band
and off-band magnitudes of the objects in the AB photometric system.
3 Detection and selection of ICPN candidates
In this work, the diffuse light in a Virgo cluster field is measured
by the number density of detected PNe. The PNe are identified via
their strong emission in the [OIII]
![]() line and, in the
two SUB2, SUB3 field, may be confirmed by the additional detection
of the associated H
line and, in the
two SUB2, SUB3 field, may be confirmed by the additional detection
of the associated H![]() emission. The observational techniques
used for PNe detection have been successfully applied in the Virgo
cluster, in nearby groups (Leo; Castro-Rodríguez et al. 2003), and in
compact groups (HCG44; Aguerri et al. 2006). In a few Virgo fields we
carried out spectroscopic follow-up, resulting in a large fraction
(up to 80
emission. The observational techniques
used for PNe detection have been successfully applied in the Virgo
cluster, in nearby groups (Leo; Castro-Rodríguez et al. 2003), and in
compact groups (HCG44; Aguerri et al. 2006). In a few Virgo fields we
carried out spectroscopic follow-up, resulting in a large fraction
(up to 80![]() for some fields) of spectroscopically confirmed PNe
(Arnaboldi et al. 2004; Doherty et al. 2009).
for some fields) of spectroscopically confirmed PNe
(Arnaboldi et al. 2004; Doherty et al. 2009).
![\begin{figure}
\par\includegraphics[width=14cm,clip]{09774fg2.eps} \end{figure}](/articles/aa/full_html/2009/44/aa09774-08/img40.png)
|
Figure 2:
Color-magnitude diagrams (CMDs) for all sources in the
LPRX, LPE, LPS and LSF fields. The horizontal lines
indicate the color excess of emission line objects with an
observed
|
| Open with DEXTER | |
Table 3: Limiting magnitudes of the fields in the on-band, off-band filter, and the K constant.
3.1 [OIII] ``on-off'' band survey of ICPNe - Catalog selection with the color magnitude diagram (CMD)
The ICPN candidates in the fields LPRX, LPE, LPS and LSF were
identified using the on-off band technique, pioneered by Ciardullo
et al. (1989) and automated for large areas by Arnaboldi et al. (2002, Paper
I), using selection criteria based on color excess
discussed by Theuns & Warren (1997). On the basis of the strong line emission
of a PN at the [OIII]
![]() line, the photometric ICPN
candidates can be identified as point-like sources detected in the
[OIII] image, the on-band and, because of their faint continuum, they
cannot be detected in the off-band image. The on-band filter is a few
tens of Å wide (60 or 80 Å, see Tables 1 and 2) centred at
the wavelength of the redshifted [OIII]5007 Å emission of the PN
population at a given distance. In Paper I, this technique was
standardized and automatized to select ICPNe in wide field images. We
give a brief summary here.
line, the photometric ICPN
candidates can be identified as point-like sources detected in the
[OIII] image, the on-band and, because of their faint continuum, they
cannot be detected in the off-band image. The on-band filter is a few
tens of Å wide (60 or 80 Å, see Tables 1 and 2) centred at
the wavelength of the redshifted [OIII]5007 Å emission of the PN
population at a given distance. In Paper I, this technique was
standardized and automatized to select ICPNe in wide field images. We
give a brief summary here.
We detect all objects in the on-band images. We then perform aperture
photometry with SExtractor (Bertin & Arnouts 1996) on the on-band image at
the sources' position, and in the corresponding aperture in the
off-band image. All point-like sources detected in the on-band image
are placed in a color-magnitude diagram (CMD),
![]() vs.
vs.
![]() ,
and are classified according to positions in this
diagram. The ICPN candidates are point-like objects with no detected
continuum emission and observed EW greater than the color excess curve
corresponding to
,
and are classified according to positions in this
diagram. The ICPN candidates are point-like objects with no detected
continuum emission and observed EW greater than the color excess curve
corresponding to
![]() and convolved with the photometric error,
see Paper I for more details. Figure 2 shows the CMDs for the LPRX,
LPE, LPS, and LSF fields; the selected ICPN candidates are indicated
by asterisk and square symbols.
and convolved with the photometric error,
see Paper I for more details. Figure 2 shows the CMDs for the LPRX,
LPE, LPS, and LSF fields; the selected ICPN candidates are indicated
by asterisk and square symbols.
The magnitude limit of our emission-line catalog is evaluated using
Monte Carlo simulations. We distribute a large sample of point-like
objects (![]() 10 000) randomly on the scientific images. We then
perform the photometry of the objects using the same procedure as for
the real emission sources. The limiting magnitude is then defined as
the magnitude at which 50
10 000) randomly on the scientific images. We then
perform the photometry of the objects using the same procedure as for
the real emission sources. The limiting magnitude is then defined as
the magnitude at which 50![]() of the simulated population is
retrieved. In Table 3 we list the limiting magnitudes for the on-band
image in the m(5007) photometric system, and for the off-band
magnitude in the Johnson system. We list also the conversion constant K between the AB-system and m(5007). According to Table 3 the
``shallowest'' field is RCN1 (
of the simulated population is
retrieved. In Table 3 we list the limiting magnitudes for the on-band
image in the m(5007) photometric system, and for the off-band
magnitude in the Johnson system. We list also the conversion constant K between the AB-system and m(5007). According to Table 3 the
``shallowest'' field is RCN1 (
![]() )
and the deepest
field is LSF (
)
and the deepest
field is LSF (
![]() ), with
), with
![]() fainter
than 27.0 for all the other survey fields.
fainter
than 27.0 for all the other survey fields.
At the distance of 15 Mpc, the bright cut-off of the PN luminosity
function (PNLF) falls at the apparent magnitude of
m(5007)=26.38![]() which is
brighter than the limiting magnitude in all surveyed fields.
which is
brighter than the limiting magnitude in all surveyed fields.
On the basis of the CMD selection, we detect 9, 20, 7 and 23
emission-line point-like objects brighter than the
![]() in
LPRX, LPE, LPS, and LSF, respectively. These emission sources include
ICPN candidates and background galaxies. In Appendix A we give the
coordinates and m(5007) magnitudes of these sources.
in
LPRX, LPE, LPS, and LSF, respectively. These emission sources include
ICPN candidates and background galaxies. In Appendix A we give the
coordinates and m(5007) magnitudes of these sources.
3.2 [OIII] and H survey of ICPNe - Catalog selection with the 2-color diagram (2-CD)
A more secure selection of the ICPN candidates is possible in the in
the SUB2 and SUB3 fields, using the additional information from the
H![]() images which eliminates the contamination from background
galaxies (Okamura et al. 2002; Mihos et al. 2009). The selection procedure is
described in Arnaboldi et al. (2003, hereafter Paper II), on the basis of
the instrumental magnitudes measured for sources in the fields,
normalized to 1 sec exposure.
images which eliminates the contamination from background
galaxies (Okamura et al. 2002; Mihos et al. 2009). The selection procedure is
described in Arnaboldi et al. (2003, hereafter Paper II), on the basis of
the instrumental magnitudes measured for sources in the fields,
normalized to 1 sec exposure.
We use SExtractor for the detection of point-like objects in SUB2 and
SUB3 [OIII] on band images. Once the objects are extracted, we
measure fluxes at the sources' positions in the H![]() ,
V and R band images in matching apertures. We then use a two-color diagram
(2-CD), [OIII]-H
,
V and R band images in matching apertures. We then use a two-color diagram
(2-CD), [OIII]-H![]() vs. [OIII]-(V+R), for the selection of the
ICPN candidates. In this 2-CD, continuum sources, single-line and
two-line emitters, either PNe or compact HII regions
(Gerhard et al. 2002), occupy different regions of the plane. We establish
some ad-hoc selection rules for this specific set of images, and the
detection/photometry described above. Simulated populations of PNe,
single line emitters, and continuum sources are constructed in the
2-CD, and are used to outline the regions inhabited by the different
kind of objects. Differently from Paper II, we have the zero points of
the photometric calibration for the narrow bands, [OIII] and
H
vs. [OIII]-(V+R), for the selection of the
ICPN candidates. In this 2-CD, continuum sources, single-line and
two-line emitters, either PNe or compact HII regions
(Gerhard et al. 2002), occupy different regions of the plane. We establish
some ad-hoc selection rules for this specific set of images, and the
detection/photometry described above. Simulated populations of PNe,
single line emitters, and continuum sources are constructed in the
2-CD, and are used to outline the regions inhabited by the different
kind of objects. Differently from Paper II, we have the zero points of
the photometric calibration for the narrow bands, [OIII] and
H![]() ,
and for the broad band images, V and R, and the selection
criteria for the different classes of objects translate into these
color constraints:
,
and for the broad band images, V and R, and the selection
criteria for the different classes of objects translate into these
color constraints:
- the simulated PN population consists of point-like objects with
a color excess in [OIII], e.g.
 ,
and have line
ratios
,
and have line
ratios
![$\rm [OIII]/(H\alpha+[NII])$](/articles/aa/full_html/2009/44/aa09774-08/img47.png) larger than 3 (Ciardullo et al. 2002a), because they populate the brighter part of the
PNLF. This line ratio translates into an [OIII] vs. H
color
excess of
larger than 3 (Ciardullo et al. 2002a), because they populate the brighter part of the
PNLF. This line ratio translates into an [OIII] vs. H
color
excess of
 .
Therefore, the ICPN-like candidates
are point-like sources detected in both [OIII] and H
images,
whose colors are
and
;
the
simulated objects are plotted as open squares in Fig. 3;
.
Therefore, the ICPN-like candidates
are point-like sources detected in both [OIII] and H
images,
whose colors are
and
;
the
simulated objects are plotted as open squares in Fig. 3;
- the continuum sources are simulated with a flat spectral energy
distribution which translates into
 colors; these are plotted as open triangles in Fig. 3;
- single line emitters in [OIII] are those objects detected in the
[OIII] image, have upper limits in either H
or
in the V+R continuum image, or have no detections in those
images. These are plotted as asterisks in Fig. 3. Bright
 sources without H
emission are background, large EW Ly-
emitters, while fainter
sources without H
emission can be either PNe or background objects. Because of the
different detection limits and noise in the H
and V+R images,
they are scattered in the different regions of the 2-CD. See
Paper II for additional details;
sources without H
emission are background, large EW Ly-
emitters, while fainter
sources without H
emission can be either PNe or background objects. Because of the
different detection limits and noise in the H
and V+R images,
they are scattered in the different regions of the 2-CD. See
Paper II for additional details;
- compact HII regions are sources with faint continuum,
 and
and
 ,
because of the stronger
H line emission.
,
because of the stronger
H line emission.
The limiting magnitude of the [OIII], H![]() ,
V and R band images
are listed in Table 3. The
,
V and R band images
are listed in Table 3. The
![]() for the on-band [OIII] images of the SUB2 and SUB3 fields is 1.5 mag fainter than the
apparent magnitude of the PNLF bright cut-off at 15 Mpc distance. The
2-CDs and CMDs of the emission objects in SUB2 and SUB3 images are shown in
Fig. 4.
for the on-band [OIII] images of the SUB2 and SUB3 fields is 1.5 mag fainter than the
apparent magnitude of the PNLF bright cut-off at 15 Mpc distance. The
2-CDs and CMDs of the emission objects in SUB2 and SUB3 images are shown in
Fig. 4.
3.3 Comparison between the two selection procedures
![\begin{figure}
\par\includegraphics[width=6.8cm,clip]{09774fg3.eps}
\end{figure}](/articles/aa/full_html/2009/44/aa09774-08/img52.png)
|
Figure 3:
Color-color diagrams (
|
| Open with DEXTER | |
For the SUB2/SUB3 fields, we can compare the two methods for
detecting ICPNe either with CMD and 2-CDs. Figure 4 shows the
CMD for these two fields: we have obtained 13 and 11 objects in SUB2
and SUB3 brighter than the
![]() in these fields, that are
classified as ICPNe on the basis of color excess criteria in the
CMD. Figure 4 also shows the distribution of those objects in
the 2-CDs. It turns out that most of the objects classified as ICPNe
in the CMDs are located in the region occupied by single line emitter
in the 2-CDs, i.e. they do have a detectable H
in these fields, that are
classified as ICPNe on the basis of color excess criteria in the
CMD. Figure 4 also shows the distribution of those objects in
the 2-CDs. It turns out that most of the objects classified as ICPNe
in the CMDs are located in the region occupied by single line emitter
in the 2-CDs, i.e. they do have a detectable H![]() emission at the
position of the [OIII] source on the H
emission at the
position of the [OIII] source on the H![]() image. Four objects,
one in SUB2 and three in SUB3, which are ICPN candidates according to
the CMDs, are also two-line emitters according to the 2-CD.
image. Four objects,
one in SUB2 and three in SUB3, which are ICPN candidates according to
the CMDs, are also two-line emitters according to the 2-CD.
From the 2-CDs, we conclude that we detect one ICPN in SUB2 and three
ICPNe in SUB3 brighter than the limiting magnitudes in [OIII] and
H![]() ;
the four ICPNe are indicated by open diamonds in the right
panel of Fig. 4. Furthermore, no HII compact regions are
detected in these two fields.
;
the four ICPNe are indicated by open diamonds in the right
panel of Fig. 4. Furthermore, no HII compact regions are
detected in these two fields.
In empty fields, the sources selected on the basis of a color excess
in a narrow band, e.g. in the
4500-5000 Å wavelength interval,
vs. a broad band filter selected catalog, are most probably
Ly-![]() background galaxies at redshift
background galaxies at redshift ![]() 3.1. The
identification of these sources as Ly-
3.1. The
identification of these sources as Ly-![]() emitters has been
confirmed with spectroscopic follow-up
(Rauch et al. 2008; Castro-Rodríguez et al. 2003; Kudritzki et al. 2000; Gawiser et al. 2007). Therefore
when only a single deep [OIII] image is available to produce the
catalog of point-like emission line objects for a given Virgo field,
we need to statistically subtract the background population of the
Ly-
emitters has been
confirmed with spectroscopic follow-up
(Rauch et al. 2008; Castro-Rodríguez et al. 2003; Kudritzki et al. 2000; Gawiser et al. 2007). Therefore
when only a single deep [OIII] image is available to produce the
catalog of point-like emission line objects for a given Virgo field,
we need to statistically subtract the background population of the
Ly-![]() emitters to select the over-density of objects associated
with the PN population.
emitters to select the over-density of objects associated
with the PN population.
We now discuss the statistical subtraction of such a background population in the Virgo cluster fields in Sect. 4.
![\begin{figure}
\par\includegraphics[width=13.5cm,clip]{09774fg4.eps}
\end{figure}](/articles/aa/full_html/2009/44/aa09774-08/img54.png)
|
Figure 4:
CMD ( left panels) and 2-CD ( right panels) of the
sources in the SUB2 field ( top panels) and SUB3 field ( bottom
panels) images. On the left: the squares and asterisks
represent objects classified as ICPNe with CMDs. On the right:
all CMD-identified ICPNe are indicated with open squares; open
diamonds show the ICPNe selected from the 2-CD. The continuum
and/or H |
| Open with DEXTER | |
4 On the nature of the emission-line sources in the Virgo outer fields
In addition to a population of ICPNe at the Virgo cluster distance, in
the CMD-selected source list with color excess, we expect a
contribution from misclassified faint continuum objects, [OII]
emitters at intermediate redshift and Ly-![]() background galaxies
at
background galaxies
at
![]() .
We discuss the contribution from faint continuum
sources in Sect. 4.1, and background galaxies in
Sect. 4.2 with the goal of selecting the most likely PN
population at these field positions.
.
We discuss the contribution from faint continuum
sources in Sect. 4.1, and background galaxies in
Sect. 4.2 with the goal of selecting the most likely PN
population at these field positions.
4.1 Contamination by faint continuum objects
It is possible that our catalogs contain misclassified faint continuum
objects. Because of the photometric errors and a steeply rising
luminosity function, a non-negligible number of faint continuum
objects, which would have ![]() fainter than the limiting magnitude in
the on-band image, may end up having a measured
fainter than the limiting magnitude in
the on-band image, may end up having a measured ![]() brighter than
brighter than
![]() .
As the same time, due to the photometric errors, the
measured off-band magnitude may be fainter than expected, resulting in
a color excess for these continuum sources as for the ICPNe. Given the
large number of stars in the field, the number of such sources can be
significant, if the off-band is not sufficiently deep.
.
As the same time, due to the photometric errors, the
measured off-band magnitude may be fainter than expected, resulting in
a color excess for these continuum sources as for the ICPNe. Given the
large number of stars in the field, the number of such sources can be
significant, if the off-band is not sufficiently deep.
We call this the ''spillover'' effect in Paper III (see for additional
details). The number of continuum objects that ``spilled over'' can be
estimated from simulations of point-like continuum objects with a LF
extrapolated to 3 mag fainter than
![]() and
distributed randomly on the scientific frames. We then detect the
simulated objects with the same criteria as for the real ones, and
determine the number of simulated objects brighter than
and
distributed randomly on the scientific frames. We then detect the
simulated objects with the same criteria as for the real ones, and
determine the number of simulated objects brighter than
![]() in regions of the CMD where the ICPN photometric
candidates are located. After scaling the simulations to the number
of observed continuum objects, the final numbers of spilled-over
contaminants brighter than
in regions of the CMD where the ICPN photometric
candidates are located. After scaling the simulations to the number
of observed continuum objects, the final numbers of spilled-over
contaminants brighter than
![]() of the image are found to
be zero in all fields. This result comes about because of the very
deep off-band images acquired for these fields (see the discussion in
Paper III).
of the image are found to
be zero in all fields. This result comes about because of the very
deep off-band images acquired for these fields (see the discussion in
Paper III).
4.2 Contribution from background galaxies
Background emission-line galaxies are detected in [OIII] on-band
photometric surveys
(Gronwall et al. 2007; Castro-Rodríguez et al. 2003; Ciardullo et al. 2002b). According to the
central wavelength and limiting flux of the on-band images, the
surveys are sensitive to the
[OII] 3727Å emission line of star-burst galaxies at z=0.35 and the
Ly-![]() line of young galaxies at z=3.1.
line of young galaxies at z=3.1.
[OII] emission line at ![]() :
we do not expect a
significant contamination by [OII] emitters at medium redshifts in the
final source catalogs because the emission-line objects have a color
excess which implies observed EWs greater than 100
:
we do not expect a
significant contamination by [OII] emitters at medium redshifts in the
final source catalogs because the emission-line objects have a color
excess which implies observed EWs greater than 100 ![]() .
Previous
studies of [OII] emitters at z=0.35 have not found objects with
observed EWs greater than 95
.
Previous
studies of [OII] emitters at z=0.35 have not found objects with
observed EWs greater than 95 ![]() (Hogg et al. 1998; Hammer et al. 1997; Colless et al. 1990). The long-slit search for low surface brightness Ly-
(Hogg et al. 1998; Hammer et al. 1997; Colless et al. 1990). The long-slit search for low surface brightness Ly-![]() with fluxes of a few
with fluxes of a few
![]() erg s-1 cm-2 by
Rauch et al. (2008) also reports a low density of [OII] emitters
at these faint fluxes.
erg s-1 cm-2 by
Rauch et al. (2008) also reports a low density of [OII] emitters
at these faint fluxes.
Ly-![]() line emitters at z=3.1: on-band/off-band
photometric surveys of blank fields provide a non-negligible density
of emission objects (Gronwall et al. 2007; Ciardullo et al. 2002b). The spectroscopic
follow-up of these emission line objects showed that they are
Ly-
line emitters at z=3.1: on-band/off-band
photometric surveys of blank fields provide a non-negligible density
of emission objects (Gronwall et al. 2007; Ciardullo et al. 2002b). The spectroscopic
follow-up of these emission line objects showed that they are
Ly-![]() emitters at z=3.1 (Gawiser et al. 2007).
emitters at z=3.1 (Gawiser et al. 2007).
In what follows, we adopt a statistical approach to correct for the
contribution of the z=3.1 Ly-![]() background objects, by comparing
the number density of the ``PN-like'' objects in the outer Virgo
fields with those measured in ``blank-fields''
(Gronwall et al. 2007; Kudritzki et al. 2000; Castro-Rodríguez et al. 2003; Ciardullo et al. 2002b),
normalized by the effective sampled volume.
background objects, by comparing
the number density of the ``PN-like'' objects in the outer Virgo
fields with those measured in ``blank-fields''
(Gronwall et al. 2007; Kudritzki et al. 2000; Castro-Rodríguez et al. 2003; Ciardullo et al. 2002b),
normalized by the effective sampled volume.
4.3 Are ICPNe detected in the Virgo fields outside the cluster core?
![\begin{figure}
\par\includegraphics[width=13cm,clip]{09774fg5.eps}
\end{figure}](/articles/aa/full_html/2009/44/aa09774-08/img58.png)
|
Figure 5:
The luminosity function (LF) of the emission-line
objects detected in LPRX, LPE, LPS, LSF, SUB2 and SUB3 is
indicated by large full red squares. For comparison, the
Ly- |
| Open with DEXTER | |
We thus estimate the fraction of background galaxies present in the
current catalogs of point-like sources by comparing their LF and
number densities with those of Ly-![]() emitters detected in
similar [OIII] on band surveys for objects brighter than
m(5007)=27.0 and normalized to the effective sampled volumes. We
shall compare the different sample for magnitudes brighter than
m(5007)=27.0; at fainter magnitudes, the automatic classification of
pont-like(unresolved) vs. extended(resolved) based on total magnitude
vs. small central aperture magnitude plot (see Paper I) becomes
unreliable and not uniform among the fields' ICPN catalogs and the
comparison blank field catalogs.
emitters detected in
similar [OIII] on band surveys for objects brighter than
m(5007)=27.0 and normalized to the effective sampled volumes. We
shall compare the different sample for magnitudes brighter than
m(5007)=27.0; at fainter magnitudes, the automatic classification of
pont-like(unresolved) vs. extended(resolved) based on total magnitude
vs. small central aperture magnitude plot (see Paper I) becomes
unreliable and not uniform among the fields' ICPN catalogs and the
comparison blank field catalogs.
Figure 5 compares the LFs of the point-like emission-line
objects detected in the LPRX, LPE, LPS, LSF, SUB2 and SUB3 fields with
the LF of the Ly-![]() population from different surveys.
We then evaluate the number of expected Ly-
population from different surveys.
We then evaluate the number of expected Ly-![]() emitters in our
field brighter than
m(5007)=27.0 from the
Castro-Rodríguez et al. (2003); Kudritzki et al. (2000); Ciardullo et al. (2002b) surveys, normalized
to the same sampled volume. Thus, the expected number of Ly-
emitters in our
field brighter than
m(5007)=27.0 from the
Castro-Rodríguez et al. (2003); Kudritzki et al. (2000); Ciardullo et al. (2002b) surveys, normalized
to the same sampled volume. Thus, the expected number of Ly-![]() galaxies are 65/15/6 in LPRX, 65/15/6 in LPE, 66/16/6 in LPS and
86/20/8 in LSF field.
galaxies are 65/15/6 in LPRX, 65/15/6 in LPE, 66/16/6 in LPS and
86/20/8 in LSF field.
The blank field survey of Castro-Rodríguez et al. (2003) selected
point-like emission line sources with same criteria as the current
sample, and it provides a lower inferred number density of Ly-![]() than either the Ciardullo et al. (2002b) or Kudritzki et al. (2000) surveys.
By statistically subtracting the contribution from the background
population estimated from Castro-Rodríguez et al. (2003) to the outer Virgo
fields, we derive an upper limit to the number of ICPNe. The number of
emission-line objects detected in the different fields, and the
expected number of Ly-
than either the Ciardullo et al. (2002b) or Kudritzki et al. (2000) surveys.
By statistically subtracting the contribution from the background
population estimated from Castro-Rodríguez et al. (2003) to the outer Virgo
fields, we derive an upper limit to the number of ICPNe. The number of
emission-line objects detected in the different fields, and the
expected number of Ly-![]() objects from the
Castro-Rodríguez et al. (2003) survey brighter than
m(5007)=27.0 are 6/6,
14/6, 6/6, 3/8 for LPRX, LPE, LPS, and LSF fields, respectively. The
LPE field shows an excess of
objects from the
Castro-Rodríguez et al. (2003) survey brighter than
m(5007)=27.0 are 6/6,
14/6, 6/6, 3/8 for LPRX, LPE, LPS, and LSF fields, respectively. The
LPE field shows an excess of ![]() emission-line objects over the
expected number of background galaxies in this field, while the LSF
field shows a lower density than expected, by
emission-line objects over the
expected number of background galaxies in this field, while the LSF
field shows a lower density than expected, by ![]() .
We may
therefore conclude that the emission-line objects detected in the
LPRX, LPS, and LSF fields are compatible with all being Ly-
.
We may
therefore conclude that the emission-line objects detected in the
LPRX, LPS, and LSF fields are compatible with all being Ly-![]() background galaxies. The emission-line objects detected in LPE are
compatible with containing a few ICPNe at the
background galaxies. The emission-line objects detected in LPE are
compatible with containing a few ICPNe at the ![]() level, as in
the SUB2/3 fields.
level, as in
the SUB2/3 fields.
An over-density of emission-line unresolved sources is detected at the
RCN1 field position; here we select 28 candidates using the
color excess criteria in the CMD, using a deeper off-band image than
in Paper I, and we expect a population of 8 Ly-![]() emitters
from Castro-Rodríguez et al. (2003) scaled number counts.
emitters
from Castro-Rodríguez et al. (2003) scaled number counts.
On the basis of the previous results, the properties of the unresolved
emission line objects in these outer fields are those of the
Ly-![]() population at z=3.14. Within our sample, we find that
the flux of the brightest emission sources may vary by a factor 2 in
different fields, i.e. from 26.0 in LSF field to 26.7 in SUB2 field.
The Kudritzki et al. (2000), Ciardullo et al. (2002b),
Castro-Rodríguez et al. (2003) and Gronwall et al. (2007) samples show similar
field-to-field variation of the Ly-
population at z=3.14. Within our sample, we find that
the flux of the brightest emission sources may vary by a factor 2 in
different fields, i.e. from 26.0 in LSF field to 26.7 in SUB2 field.
The Kudritzki et al. (2000), Ciardullo et al. (2002b),
Castro-Rodríguez et al. (2003) and Gronwall et al. (2007) samples show similar
field-to-field variation of the Ly-![]() LF bright end. Since these
samples come from surveys that may adopt different selection criteria,
we believe that our current results on the field-to-field variations
of the Ly-
LF bright end. Since these
samples come from surveys that may adopt different selection criteria,
we believe that our current results on the field-to-field variations
of the Ly-![]() LF in the six Virgo fields are more robust because they
are based on homogeneously selected samples of point-like objects, with
deep off-band control images. The variation of the Ly-
LF in the six Virgo fields are more robust because they
are based on homogeneously selected samples of point-like objects, with
deep off-band control images. The variation of the Ly-![]() properties may be related to the cosmic variance: recent observations
by Ouchi et al. (2003) show that Ly-
properties may be related to the cosmic variance: recent observations
by Ouchi et al. (2003) show that Ly-![]() galaxies are already
clustered at z=4.86, which implies even greater clustering at
galaxies are already
clustered at z=4.86, which implies even greater clustering at
![]() .
.
5 ICPN number density and ICL surface brightness in the Virgo cluster
On the basis of the statistical subtraction of the contribution from
Ly-![]() emitters at z=3.14, we can conclude that:
emitters at z=3.14, we can conclude that:
- in the SUB2 and SUB3 fields, we detected 4 ICPNe in both [OIII]
and H.
These are all brighter than
m(5007) = 27.0,
i.e. within 0.5 mag of the PNLF bright cut-off at the distance
of the Virgo cluster;
- the number densities and LFs of the emission-line objects
detected in the outer Virgo fields - LPRX, LPS, and LSF - are
statistically consistent with those of the population of Ly-background galaxies;
- we detect over-densities in LPE (at the
 level) and
in RCN1 (larger than
level) and
in RCN1 (larger than  )
Virgo fields.
)
Virgo fields.
5.1 From ICPN number density to ICL surface brightness
Since PNe closely follow the distribution of starlight in galaxies
(Coccato et al. 2009), the bolometric luminosity of the parent stars of
the PN population can be obtained as
![]() ,
where
,
where
![]() is the number of PNs in each field and
is the number of PNs in each field and ![]() is the
luminosity-specific PN density. We follow the procedure detailed
below:
is the
luminosity-specific PN density. We follow the procedure detailed
below:
- the
 for a given field is scaled by a factor:
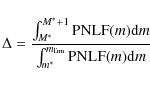
(1)
where PNLF(m) is the analytic expression for the PNLF (Ciardullo et al. 1989), M* and m* denote the absolute and apparent magnitude of its bright cutoff, respectively, and is the m(5007) limiting magnitude in each field. This scaling
ensures that we account for all PNs within 1 mag of M*. We then
use the corresponding value
is the m(5007) limiting magnitude in each field. This scaling
ensures that we account for all PNs within 1 mag of M*. We then
use the corresponding value
 to infer the amount of
bolometric luminosity in our fields.
to infer the amount of
bolometric luminosity in our fields.
- Doherty et al. (2009) computed the
 for the halo of
M 87 and the ICL directly. The value of
for the halo of
M 87 and the ICL directly. The value of
 is
is
 PN
PN
 ;
for the ICL
;
for the ICL
 PN
;
we refer to Doherty et al. (2009) for
further details on their computation and uncertainties.
PN
;
we refer to Doherty et al. (2009) for
further details on their computation and uncertainties.
- From the analytical expression of the PNLF, we can scale the
value of the luminosity-specific PN density at 2.5 mag fainter then
the PNLF bright cut off to 1 mag as
 .
.
- parameter for the FCJ field - The results of the
spectroscopic follow-up by Arnaboldi et al. (2004) and Doherty et al. (2009)
show that the halo of M 87 is extended out to about 35 arcmin from the
galaxy center. Within that radius, the M 87 halo contributes 70% of
the light as sampled by the number of PNe detected at the position of
the FCJ field. For this field position, we use a value of
 PN
which is the
average value of
PN
which is the
average value of
 and
and
 ,
weighted
by the fractions of PNs that are bound to M 87 (70%) and those
unbound (30%). Because the FCJ field is at a distance of about
14 arcmin from the center of M 87, we can check the derived surface
brightness value at this field position with the V band surface
brightness measurements of Kormendy et al. (2009).
,
weighted
by the fractions of PNs that are bound to M 87 (70%) and those
unbound (30%). Because the FCJ field is at a distance of about
14 arcmin from the center of M 87, we can check the derived surface
brightness value at this field position with the V band surface
brightness measurements of Kormendy et al. (2009).
- parameter for the SUBC field - we use
 PN
,
which is the
average of
and
PN
,
which is the
average of
and
 .
Here we assume
that M 84 has the same
value as M 87 and the fractions of
bound and unbound PNs in this photometric sample is 50% each.
.
Here we assume
that M 84 has the same
value as M 87 and the fractions of
bound and unbound PNs in this photometric sample is 50% each.
- parameter for the outer fields - For the fields
at larger distances, we use
 PN
.
PN
.
- Errors on the inferred luminosities and surface brightness are estimated from Poisson statistics.
5.2 ICL measurements in the Virgo cluster from previous work: the Feldmeier (20004b) sample
Table 4:
![]() within m*+1, B band luminosity density and surface
brightness values in the Virgo fields. In LPC, LPRX, LPS and LSF we
list the upper limits.
within m*+1, B band luminosity density and surface
brightness values in the Virgo fields. In LPC, LPRX, LPS and LSF we
list the upper limits.
Table 5: Surface brightness measurements in the Feldmeier et al. (2004a) fields.
Several regions in the Virgo core and around M 49 were surveyed by
Feldmeier et al. (2004a,2003,1998) for ICPNe, covering a
total area of 0.89 deg2. The positions of these fields are shown
in Fig. 1, and a summary of their ![]() measurements is
provided in Table 5. They find an excess of emission line
sources in all fields, at about 5 times the density of line emitters
in blank fields, but for Field F04-8, where the emission-line object
number density is consistent with the galaxy background population. To
compare these measurements with ours, we take their
measurements is
provided in Table 5. They find an excess of emission line
sources in all fields, at about 5 times the density of line emitters
in blank fields, but for Field F04-8, where the emission-line object
number density is consistent with the galaxy background population. To
compare these measurements with ours, we take their ![]() and add a
(B-V) color term determined from the color of the continuum light of
the nearest bright galaxy; the computed values are shown in Col. #4,
in Table 5.
and add a
(B-V) color term determined from the color of the continuum light of
the nearest bright galaxy; the computed values are shown in Col. #4,
in Table 5.
The field with the brightest surface brightness measurement is F04-3
(FCJ in this work; see also Paper I) at 60 kpc from the center of M 87.
This field is within the M 87 halo, as shown by the deep
photometry of the Virgo core by Mihos et al. (2005) and the PN kinematics
(Arnaboldi et al. 2004). The
![]() measurement for F04-3 agrees with the
independently derived
measurement for F04-3 agrees with the
independently derived
![]() for FCJ in Table 4 and with
the surface brightness profile of M 87 measured by Kormendy et al. (2009)
at the FCJ distance from the center of M 87. The spectroscopic
follow-up indicates that the M 87 halo contributes 70% of the light at
this field position, and 30% of the sample is made up of free-floating
stars, i.e. the true ICL component. The surface brightness of the ICL
at the position of the FCJ field is then
for FCJ in Table 4 and with
the surface brightness profile of M 87 measured by Kormendy et al. (2009)
at the FCJ distance from the center of M 87. The spectroscopic
follow-up indicates that the M 87 halo contributes 70% of the light at
this field position, and 30% of the sample is made up of free-floating
stars, i.e. the true ICL component. The surface brightness of the ICL
at the position of the FCJ field is then
![]() mag arcsec-2.
mag arcsec-2.
5.3 How well do ICPNe follow light
Mihos et al. (2009) investigated the correlation between the ICPN distribution and the diffuse light in the Virgo core (Mihos et al. 2005). Their results indicate that there is a correspondence on large scales (The procedure adopted in this work maps the over-density of point-like
emitters with respect to a statistically averaged background
population, in fields whose area is about
![]() kpc2. As
described in Sect. 5.1, the number of PNe from each
over-density is mapped into a bolometric luminosity according to the
most appropriate luminosity-specific PN density parameter value for
that field. Our comparison with the Mihos et al. (2009) results indicate that
the luminosities computed in this work are robust with respect to the
variety of effects that can act to wash out the correlation between PN
number density distribution and light.
kpc2. As
described in Sect. 5.1, the number of PNe from each
over-density is mapped into a bolometric luminosity according to the
most appropriate luminosity-specific PN density parameter value for
that field. Our comparison with the Mihos et al. (2009) results indicate that
the luminosities computed in this work are robust with respect to the
variety of effects that can act to wash out the correlation between PN
number density distribution and light.
6 Discussion
6.1 The diffuse light in the Virgo cluster
Several fields outside the Virgo core region contain a population of
emission sources consistent with background Ly-![]() objects.
Clear over-density of emission line objects of at least a factor of 5
with respect to the averaged Ly-
objects.
Clear over-density of emission line objects of at least a factor of 5
with respect to the averaged Ly-![]() emitters are detected in the
Virgo core region, around M 49 (Feldmeier et al. 2004a,2003), and in RCN1
and LPE, at a lower
emitters are detected in the
Virgo core region, around M 49 (Feldmeier et al. 2004a,2003), and in RCN1
and LPE, at a lower ![]() level.
level.
The ICL and the extended halos from bright galaxies - The diffuse light observed in the core of a galaxy cluster contains several luminous stellar components that add up along the line-of-sight (LOS) to the cluster center: the extended faint halos of the brightest galaxies and the ICL contribution, defined as the light coming from stars not bound to individual galaxies. When computing the ICL fraction in the Virgo core, the surface brightness measurements must be corrected for the fraction of stars bound to the extended halos of individual galaxies. The results from Arnaboldi et al. (2004) and Doherty et al. (2009) on the LOS velocity distribution of the PNe indicate that the halos of M 84, M 86 and M 87 are extended, out to 150 kpc in the case of M 87.
When we select only true ICPNe, we measure a surface brightness for
the ICL of about
![]() mag arcsec-2 in FCJ and
29.0-29.5 in Core/SUBC. These surface brightness values are similar to
those inferred from the detection of IC RGB stars
(Williams et al. 2007; Ferguson et al. 1998; Durrell et al. 2002).
mag arcsec-2 in FCJ and
29.0-29.5 in Core/SUBC. These surface brightness values are similar to
those inferred from the detection of IC RGB stars
(Williams et al. 2007; Ferguson et al. 1998; Durrell et al. 2002).
The results from the spectroscopic follow-up imply that the
measurements of the ICL based on a surface brightness threshold,
e.g.
![]() ,
will lead to an overestimate of the ICL, since it
includes the light contributions from extended galaxy halos.
,
will lead to an overestimate of the ICL, since it
includes the light contributions from extended galaxy halos.
6.2 On the elongated distribution of the ICL
The Feldmeier et al. (2004a)'s ``smooth'' elongated distribution for the ICL, of about 4 Mpc along the LOS to the Virgo core, was derived from the following observational results:
- the relative brighter cut-off of the IC PNLF in sub-clump A, around M 87, vs. sub-clump B, around M 49, placing the sub-clump A at 4 Mpc in front of sub-clump B;
- same number density of ICPNe in these fields.
The upper limits in the LPC, LPS and LPRX fields from this work, and no-PN detection in F04-8 (Feldmeier et al. 2003) show that there is not a uniform distribution of ICL all across the region from sub-clump A-M 87 to subclump B-M 49 (Binggeli et al. 1987). The ICL drops below the detection limit in the region of the sky between these two Virgo sub-clumps. The current results indicate that the ICL is mostly associated with, and confined to, these high density regions.
6.3 The ICL surface brightness radial profile
![\begin{figure}
\par\includegraphics[width=7cm,clip]{09774fg6.eps}
\vspace*{-3mm}
\end{figure}](/articles/aa/full_html/2009/44/aa09774-08/img92.png)
|
Figure 6:
Surface brightness measurement of diffuse light in the
Virgo fields (points) compared with the surface brightness
profile of the Virgo galaxies averaged in annuli (lines); radial
distances are computed with respect to M 87. The green line
represents the radial surface brightness profile from light in
Virgo galaxies from Binggeli et al. (1987). The dotted-dashed and
double dotted-dashed lines correspond to the surface brightness
profile associated with giants and dwarf galaxies,
respectively. The full blue dots show the surface brightness
measurements in the FCJ, Core, SUBC and LPC fields. The open
circles at the FCJ, SUBC field position indicates the ICL
surface brightness computed from the ICPNe not bound to galaxy
halos. The triangles represent the surface brightness of the
ICL based on IC RGB star counts (Williams et al. 2007; Ferguson et al. 1998; Durrell et al. 2002). The full red dots show the surface brightness
measurements in the RCN1, LPE, SUB2, and SUB3 fields. The arrows
indicate the upper limits for the measurements in LPRX, LPS and
LSF. The magenta open squares indicate the surface brightness
average values
|
| Open with DEXTER | |
In Fig. 6 we now plot the surface brightness values from Tables 4 and 5 as a function of the field distances from M 87, for an easier comparison with the Mihos et al. (2005) and Kormendy et al. (2009) photometry.
Properties of the ICL distribution in the Virgo cluster - the ICPN survey in the Virgo cluster indicates that the ICL is not homogeneously distributed in the core and at larger cluster radii. In the core, we have an upper limit for the LPC field, and in Field F04-8 (Feldmeier et al. 2004a,2003). Furthermore the deep image of the central region of the Virgo cluster shows the presence of complex structures at all scales (Mihos et al. 2005). Both results indicate that the distribution of the diffuse light in the central region is inhomogeneous, further supporting the evidence that the core is not relaxed, see Binggeli et al. (1993), Paper III, and Doherty et al. (2009).
The comprehensive summary of all surface brightness measurements in Fig. 6 indicates that most of the diffuse light is detected in fields located in the core, within a distance of about 80 arcmin from M 87. Outside this region, the mean surface brightness decreases sharply, and the ICL is present in isolated pointings, e.g. RCN1 and LPE.
Diffuse stellar light is also measured in ``sub-structures'', around M 49 and in the M 60/M 59 sub-group. The fields F04-2 and F04-6 from Feldmeier et al. (2004a) are situated in the outer regions of M 49, at about 150 kpc from the galaxy center. These fields may contain PNe from the halo of M 49 and the ICL component, which may have formed within sub-clump B of the Virgo cluster (Binggeli et al. 1987). Because the spectroscopic follow-up in not yet available for these PN candidates, we cannot quantify the fraction of light in the M 49 halo and ICL for these fields.
Using a technique similar to Durrell et al. (2002) and Williams et al. (2007), Yan et al. (2008) serendipitously detected an excess of point-like objects in two ACS fields from M 60 at 7 and 15 arcmin . The number density of the excess field population shows a decreasing gradient with increasing distance from M 60. This population starts at mi775 = 26.2 and the average surface brightness is 26.6 mag arcsec-2 in the I band in the field at 7 arcmin from M 60. These values are very similar to those measured by the Durrell et al. (2002) observations of the IC RGB in the Virgo core. Yan et al. (2008) argue that they detected a stellar population associated with the M 60/M 59 pair. This result may indicate that the M 60/M 59 sub-group is yet another region of the Virgo cluster where the intra-group-light and diffuse halos are being assembled.
The current result on the slope of the radial profile of the ICL is somewhat different from the slow decline in ICPN number density described by Feldmeier et al. (2004a). A steeper radial ICPN density profile is now derived because the current survey probes areas between the sub-clump A and sub-clump B in the Virgo cluster, where only upper limits are set.
6.4 Fraction of the ICL light vs. galaxy light in the Virgo core
When we average the measurements of the ICL in the core region defined
as the circular area of 80 arcmin radius![]() centred on the Virgo cluster center
given by Binggeli et al. (1987), we obtain a measurement of
centred on the Virgo cluster center
given by Binggeli et al. (1987), we obtain a measurement of
![]() mag arcsec-2. The ICL luminosity in this area is
mag arcsec-2. The ICL luminosity in this area is
![]() .
From
Binggeli et al. (1987) the cumulative luminosity from all galaxy types
within 1.3 deg = 80 arcmin radius of the Virgo cluster center is
.
From
Binggeli et al. (1987) the cumulative luminosity from all galaxy types
within 1.3 deg = 80 arcmin radius of the Virgo cluster center is
![]() .
Our best estimate
of the fraction of ICL, defined as the un-bound stellar component in
the Virgo cluster core, amounts to
.
Our best estimate
of the fraction of ICL, defined as the un-bound stellar component in
the Virgo cluster core, amounts to ![]() 7% of the total light in
Virgo cluster galaxies.
7% of the total light in
Virgo cluster galaxies.
The current fraction is lower than the recent measurement from
Feldmeier et al. (2004a), using a very similar technique. This is not
unexpected: we have corrected the surface brightness measurements in
the inner Virgo core fields by subtracting a significant fraction of
PN bound to bright galaxy halos, which is between 70% and 50%, of
the total
![]() measured in those fields. We think that the current
(conservative) ICL fraction is a robust estimate of the light from
true-unbound stars within 80 arcmin centred on M 87.
measured in those fields. We think that the current
(conservative) ICL fraction is a robust estimate of the light from
true-unbound stars within 80 arcmin centred on M 87.
6.5 Implications for the formation of the ICL in the Virgo cluster
We can summarize the current results as follows:
- the ICL in Virgo is concentrated in the core, with
 in the
range 28.8-30 mag arcsec-2;
in the
range 28.8-30 mag arcsec-2;
- in several fields at R > 80' = 340 kpc we can set only upper limits to the ICL surface brightness;
- at R > 80', the ICL signal is confined to isolated fields (RCN1,LPE);
- diffuse stellar light defined as extended halo plus ICL is present in other Virgo sub-structures (central region of sub-clump B, M 60/M 59 sub-group).
The ICL distribution shows a high degree of substructures both in the Virgo core and at larger radii. This result is supported by deep surface brightness photometry (Mihos et al. 2005), and ICPN number counts. The presence of sub-structures is predicted by cosmological simulations of structure formation (Napolitano et al. 2003; Murante et al. 2007; Sommer-Larsen et al. 2005). The detection of extended halos and intracluster/intra-group light in Virgo sub-structures supports a hierarchical formation mechanism for the ICL as described by Rudick et al. (2006): we are observing the ICL component in sub-structures, which may then become completely unbound as these sub-structures fall into the densest part of the cluster.
Current data are consistent with most ICL being associated with the formation history of the brightest cluster galaxies, which explains the central concentration of the ICL in the core and to sub-structures. Tidal effects are indeed at work at larger distances from the center and they can generate some ICL. The ICPNe detected in RCN1, LPE and SUB2/3 would likely come from such processes, but the amount of light detected in these fields is small compared with that sampled close to the big ellipticals, as supported by the observational results of this work.
7 The local mean luminous density
From the lack of PN detections in several of our fields in the Virgo
cluster, we can derive a limit on the luminosity density in an assumed
homogeneous distribution of stars in the local volume.
Fukugita et al. (1998) compiled measurements of the mean luminous density
contributed by high surface brightness galaxies at moderately low
redshift, and adopted
![]() Mpc-3. In what follows, we make the assumption that the mean
luminous density is distributed uniformly in the local volume and
compute the number of PNe associated with this diffuse component in
the surveyed area of the Virgo outer fields and at the [OIII] limiting
magnitude
Mpc-3. In what follows, we make the assumption that the mean
luminous density is distributed uniformly in the local volume and
compute the number of PNe associated with this diffuse component in
the surveyed area of the Virgo outer fields and at the [OIII] limiting
magnitude
![]() .
.
Each volume element along the LOS to the Virgo fields contributes the
following number of PNe
where L(r) is the luminosity associated with the volumetric luminous density
|
(3) |
The total number of PNe associated with the volumetric density is then
given by the integral of Eq. (2)
and
The luminosity-specific planetary nebula number ![]() - the
PN population (
- the
PN population (
![]() )
associated with a stellar population with
luminosity LT is :
)
associated with a stellar population with
luminosity LT is :
where M*=-4.5 is the absolute magnitude of the bright cut-off of the PNLF, and
Predicted number of PNe - we use Eq. (4) to compute the
number of PNe we would predict if the Fukugita et al. (1998) density was
homogeneously distributed. The number of PNe that we would detect by
surveying 1.75 deg2 (total area covered by the L* fields plus SUB2
and SUB3 fields) down to
![]() ,
is
,
is
![]() with an
expected m(5007) magnitude distribution that peaks at
with an
expected m(5007) magnitude distribution that peaks at ![]() 26.0. We
conclude that we cannot set limits on the homogeneously distributed
luminous density in the local universe, and surveys of several
hundred square degrees are required to detect a statistically
significant numbers of the brighter PNe.
26.0. We
conclude that we cannot set limits on the homogeneously distributed
luminous density in the local universe, and surveys of several
hundred square degrees are required to detect a statistically
significant numbers of the brighter PNe.
8 Conclusions
We have surveyed several regions of the Virgo cluster located at different distances from M 87, covering a total area of 3.3 square degrees. These outer fields in the Virgo cluster were imaged through off- and on-band filters designed for detecting PNe at the distance of the Virgo cluster. The result of this survey provides a homogeneous large scale study of the diffuse stellar light in Virgo.The results from the current study indicate that the diffuse stellar
component is present in the central region of the cluster, within a
radial distance of 80 arcmin from the cluster center. The intracluster
light in the core has a surface brightness of
![]() mag arcsec-2, and on average it amounts to
mag arcsec-2, and on average it amounts to ![]()
![]() of the
total galaxy light in this region. The distribution of the ICL in the
cluster central region is not homogeneous, with areas where
only upper limits on the number of PNe can be set. This non-uniformity
indicates that the ICL is not relaxed in the core.
of the
total galaxy light in this region. The distribution of the ICL in the
cluster central region is not homogeneous, with areas where
only upper limits on the number of PNe can be set. This non-uniformity
indicates that the ICL is not relaxed in the core.
At distances of more than 80 arcmin from M 87, the surface brightness profile of the diffuse light has a sharp cut-off of about 2 mag. At these larger radii the detection of ICL is confined in single fields, e.g. RCN1, LPE and SUB2/3, or is associated with local substructures, e.g. sub-clump B, the M 60/M 59 sub-group. The observations indicate that the ICL in Virgo is more centrally concentrated than cluster galaxies, and does not support a homogeneous elongated distribution of the ICL similar to late-type Virgo galaxies (Solanes et al. 2002; Yasuda et al. 1997).
The concentration of the ICL toward the cluster high density regions links the formation of the ICL with the formation and evolution of the most luminous cluster galaxies (Rudick et al. 2006; Murante et al. 2007).
AcknowledgementsThe authors would like to thank the anonymous referee for the careful reading of the manuscript and the extensive report. J.A.L.A. acknowledges the travel support from ESO Director Discretionary Funds 2008 during the writing of this manuscript. This article is based on observations made with 1) the Isaac Newton Telescope operated on the island of La Palma by the Isaac Newton Group in the Spanish del Roque de los Muchachos Observatory; 2) the ESO/MPI 2.2 m telescope at La Silla (Chile); and 3) the Subaru Telescope, which is operated by the National Astronomical Observatory of Japan. NCR and JALA were founded by the grant AYA2007-67965-C03-01.
Appendix A: Catalog of the point-like emission line objects detected in the current survey
Table A.1: Emission-line objects detected in the LPRX field.
Table A.2: Emission-line objects detected in the LPRX field.
Table A.3: Emission-line objects detected in the LPS field.
Table A.4: Emission-line objects in the LPE field.
Table A.5: Emission-line objects detected in the LSF field.
Table A.6: Emission-line objects detected in the SUB2 field.
Table A.7: Emission-line objects detected in the SUB3 field.
References
- Aguerri, J. A. L., Gerhard, O. E., Arnaboldi, M., et al. 2005, AJ, 129, 2585 [CrossRef] [NASA ADS]
- Aguerri, J. A. L., Castro-Rodríguez, N., Napolitano, N., Arnaboldi, M., & Gerhard, O. 2006, A&A, 457, 771 [EDP Sciences] [CrossRef] [NASA ADS]
- Alcala, J. M., Radovich, M., Silvotti, R., et al. 2002, in SPIE Conf. Ser. 4836, ed. J. A. Tyson, & S. Wolff, 406
- Arnaboldi, M., Freeman, K. C., Mendez, R. H., et al. 1996, ApJ, 472, 145 [CrossRef] [NASA ADS]
- Arnaboldi, M., Aguerri, J. A. L., Napolitano, N. R., et al. 2002, AJ, 123, 760 [CrossRef] [NASA ADS]
- Arnaboldi, M., Freeman, K. C., Okamura, S., et al. 2003, AJ, 125, 514 [CrossRef] [NASA ADS]
- Arnaboldi, M., Gerhard, O., Aguerri, J. A. L., et al. 2004, ApJ, 614, L33 [CrossRef] [NASA ADS] (In the text)
- Arnaboldi, M., Doherty, M., Gerhard, O., et al. 2008, ApJ, 674, L17 [CrossRef] [NASA ADS]
- Bekki, K., Couch, W. J., & Shioya, Y. 2002, ApJ, 577, 651 [CrossRef] [NASA ADS] (In the text)
- Bertin, E., & Arnouts, S. 1996, A&AS, 117, 393 [EDP Sciences] [CrossRef] [NASA ADS] (In the text)
- Binggeli, B., Tammann, G. A., & Sandage, A. 1987, AJ, 94, 251 [CrossRef] [NASA ADS] (In the text)
- Binggeli, B., Popescu, C. C., & Tammann, G. A. 1993, A&AS, 98, 275 [NASA ADS] (In the text)
- Buzzoni, A., Arnaboldi, M., & Corradi, R. L. M. 2006, MNRAS, 368, 877 [CrossRef] [NASA ADS] (In the text)
- Castro-Rodríguez, N., Aguerri, J. A. L., Arnaboldi, M., et al. 2003, A&A, 405, 803 [EDP Sciences] [CrossRef] [NASA ADS] (In the text)
- Ciardullo, R., Jacoby, G. H., Ford, H. C., & Neill, J. D. 1989, ApJ, 339, 53 [CrossRef] [NASA ADS] (In the text)
- Ciardullo, R., Feldmeier, J. J., Jacoby, G. H., et al. 2002a, ApJ, 577, 31 [CrossRef] [NASA ADS]
- Ciardullo, R., Feldmeier, J. J., Krelove, K., Jacoby, G. H., & Gronwall, C. 2002b, ApJ, 566, 784 [CrossRef] [NASA ADS]
- Ciardullo, R., Sigurdsson, S., Feldmeier, J. J., & Jacoby, G. H. 2005, ApJ, 629, 499 [CrossRef] [NASA ADS] (In the text)
- Coccato, L., Gerhard, O., Arnaboldi, M., et al. 2009, MNRAS, 217
- Colless, M., Ellis, R. S., Taylor, K., & Hook, R. N. 1990, MNRAS, 244, 408 [NASA ADS]
- Doherty, M., Arnaboldi, M., Das, P., et al. 2009, A&A, 502, 771 [EDP Sciences] [CrossRef] [NASA ADS]
- Durrell, P. R., Ciardullo, R., Feldmeier, J. J., Jacoby, G. H., & Sigurdsson, S. 2002, ApJ, 570, 119 [CrossRef] [NASA ADS]
- Feldmeier, J. J., Ciardullo, R., & Jacoby, G. H. 1998, ApJ, 503, 109 [CrossRef] [NASA ADS]
- Feldmeier, J. J., Mihos, J. C., Morrison, H. L., Rodney, S. A., & Harding, P. 2002, ApJ, 575, 779 [CrossRef] [NASA ADS]
- Feldmeier, J. J., Ciardullo, R., Jacoby, G. H., & Durrell, P. R. 2003, ApJS, 145, 65 [CrossRef] [NASA ADS]
- Feldmeier, J. J., Ciardullo, R., Jacoby, G. H., & Durrell, P. R. 2004a, ApJ, 615, 196 [CrossRef] [NASA ADS]
- Feldmeier, J. J., Mihos, J. C., Morrison, H. L., et al. 2004b, ApJ, 609, 617 [CrossRef] [NASA ADS]
- Ferguson, H. C., Tanvir, N. R., & von Hippel, T. 1998, Nature, 391, 461 [CrossRef] [NASA ADS]
- Freeman, K. C., Arnaboldi, M., Capaccioli, M., et al. 2000, in Dynamics of Galaxies: from the Early Universe to the Present, ed. F. Combes, G. A. Mamon, & V. Charmandaris, ASP Conf. Ser., 197, 389 (In the text)
- Fukugita, M., Hogan, C. J., & Peebles, P. J. E. 1998, ApJ, 503, 518 [CrossRef] [NASA ADS]
- Gawiser, E., Francke, H., Lai, K., et al. 2007, ApJ, 671, 278 [CrossRef] [NASA ADS] (In the text)
- Gerhard, O., Arnaboldi, M., Freeman, K. C., & Okamura, S. 2002, ApJ, 580, L121 [CrossRef] [NASA ADS]
- Gerhard, O., Arnaboldi, M., Freeman, K. C., et al. 2005, ApJ, 621, L93 [CrossRef] [NASA ADS]
- Gerhard, O., Arnaboldi, M., Freeman, K. C., et al. 2007, A&A, 468, 815 [EDP Sciences] [CrossRef] [NASA ADS]
- Gronwall, C., Ciardullo, R., Hickey, T., et al. 2007, ApJ, 667, 79 [CrossRef] [NASA ADS]
- Gunn, J. E., & Gott, J. R. I. 1972, ApJ, 176, 1 [CrossRef] [NASA ADS]
- Hammer, F., Flores, H., Lilly, S. J., et al. 1997, ApJ, 481, 49 [CrossRef] [NASA ADS]
- Hogg, D. W., Cohen, J. G., Blandford, R., & Pahre, M. A. 1998, ApJ, 504, 622 [CrossRef] [NASA ADS] (In the text)
- Jacoby, G. H. 1989, ApJ, 339, 39 [CrossRef] [NASA ADS] (In the text)
- Kormendy, J., Fisher, D. B., Cornell, M. E., & Bender, R. 2009, ApJS, 182, 216 [CrossRef] [NASA ADS]
- Krick, J. E. & Bernstein, R. A. 2007, AJ, 134, 466 [CrossRef] [NASA ADS]
- Kudritzki, R.-P., Méndez, R. H., Feldmeier, J. J., et al. 2000, ApJ, 536, 19 [CrossRef] [NASA ADS]
- Larson, R. B., Tinsley, B. M., & Caldwell, C. N. 1980, ApJ, 237, 692 [CrossRef] [NASA ADS]
- Merritt, D. 1984, ApJ, 276, 26 [CrossRef] [NASA ADS]
- Mihos, C. J., Janowiecki, S., Feldmeier, J. J., Harding, P., & Morrison, H. 2009, ApJ, 698, 1879 [CrossRef] [NASA ADS] (In the text)
- Mihos, J. C. 2004, in Clusters of Galaxies: Probes of Cosmological Structure and Galaxy Evolution, ed. J. S. Mulchaey, A. Dressler, & A. Oemler, 277
- Mihos, J. C., Harding, P., Feldmeier, J., & Morrison, H. 2005, ApJ, 631, L41 [CrossRef] [NASA ADS] (In the text)
- Miyazaki, S., Komiyama, Y., Sekiguchi, M., et al. 2002, PASJ, 54, 833 [NASA ADS]
- Moore, B., Katz, N., Lake, G., Dressler, A., & Oemler, A. 1996, Nature, 379, 613 [CrossRef] [NASA ADS]
- Murante, G., Arnaboldi, M., Gerhard, O., et al. 2004, ApJ, 607, L83 [CrossRef] [NASA ADS]
- Murante, G., Giovalli, M., Gerhard, O., et al. 2007, MNRAS, 377, 2 [CrossRef] [NASA ADS]
- Napolitano, N. R., Pannella, M., Arnaboldi, M., et al. 2003, ApJ, 594, 172 [CrossRef] [NASA ADS]
- Okamura, S., Yasuda, N., Arnaboldi, M., et al. 2002, PASJ, 54, 883 [NASA ADS] (In the text)
- Ouchi, M., Shimasaku, K., Furusawa, H., et al. 2003, ApJ, 582, 60 [CrossRef] [NASA ADS]
- Quilis, V., Moore, B., & Bower, R. 2000, Science, 288, 1617 [CrossRef] [NASA ADS] (In the text)
- Ramella, M., Biviano, A., Pisani, A., et al. 2007, A&A, 470, 39 [EDP Sciences] [CrossRef] [NASA ADS]
- Rauch, M., Haehnelt, M., Bunker, A., et al. 2008, ApJ, 681, 856 [CrossRef] [NASA ADS]
- Richstone, D. O., & Malumuth, E. M. 1983, ApJ, 268, 30 [CrossRef] [NASA ADS]
- Rudick, C. S., Mihos, J. C., & McBride, C. 2006, ApJ, 648, 936 [CrossRef] [NASA ADS] (In the text)
- Rudick, C. S., Christopher Mihos, J., Frey, L. H., & McBride, C. K. 2009, ApJ, 699, 1518 [CrossRef] [NASA ADS]
- Solanes, J. M., Sanchis, T., Salvador-Solé, E., Giovanelli, R., & Haynes, M. P. 2002, AJ, 124, 2440 [CrossRef] [NASA ADS]
- Sommer-Larsen, J., Romeo, A. D., & Portinari, L. 2005, MNRAS, 357, 478 [CrossRef] [NASA ADS] (In the text)
- Theuns, T., & Warren, S. J. 1997, MNRAS, 284, L11 [NASA ADS]
- West, M. J., Jones, C., & Forman, W. 1995, ApJ, 451, L5 [CrossRef] [NASA ADS]+
- White, S. D. M., & Rees, M. J. 1978, MNRAS, 183, 341 [NASA ADS]
- Willman, B., Governato, F., Wadsley, J., & Quinn, T. 2004, MNRAS, 355, 159 [CrossRef] [NASA ADS]
- Williams, B. F., Ciardullo, R., Durrell, P. R., et al. 2007, ApJ, 656, 756 [CrossRef] [NASA ADS] (In the text)
- Yan, H., Hathi, N. P., & Windhorst, R. A. 2008, ApJ, 675, 136 [CrossRef] [NASA ADS]
- Yasuda, N., Fukugita, M., & Okamura, S. 1997, ApJS, 108, 417 [CrossRef] [NASA ADS]
- Zibetti, S., White, S. D. M., Schneider, D. P., & Brinkmann, J. 2005, MNRAS, 358, 949 [CrossRef] [NASA ADS]
Footnotes
- ... distribution
- Based on data collected with the 2.5 m Isaac Newton Telescope on La Palma, the Subaru telescope, operated by the National Astronomical Observatory of Japan, and the ESO/MPI 2.2 m telescope at La Silla, Chile, operated by ESO during observing runs 62.N-0248 and 70.B-0086(A).
- ... IRAF
- For a detailed discussion of the mosaic data reduction, we refer the reader to Alcala et al. (2002).
- ... bands
- Zero points for the Subaru data are
 ,
,
![$z_{0,[{\rm OIII}]} = 24.6$](/articles/aa/full_html/2009/44/aa09774-08/img37.png) ,
and z0,V+R=27.8
for a 1 s exposure.
,
and z0,V+R=27.8
for a 1 s exposure.
- ...(5007)=26.38
- This is computed using the absolute magnitude for the PNLF bright cut-off of M*5007=-4.5 (Ciardullo et al. 2002a) and a distance modulus of 30.88.
- ... radius
- Because this circular area includes regions with only upper limits, our average surface brightness is lower than that measured by Mihos et al. (2005) in the region between M 87 and M 86.
All Tables
Table 1: Summary of the field positions, filter characteristics and exposure times for the narrow-band (on-band) images.
Table 2: Summary of the filter characteristics and exposure times for the broad-band (off-band) images in the various fields.
Table 3: Limiting magnitudes of the fields in the on-band, off-band filter, and the K constant.
Table 4:
![]() within m*+1, B band luminosity density and surface
brightness values in the Virgo fields. In LPC, LPRX, LPS and LSF we
list the upper limits.
within m*+1, B band luminosity density and surface
brightness values in the Virgo fields. In LPC, LPRX, LPS and LSF we
list the upper limits.
Table 5: Surface brightness measurements in the Feldmeier et al. (2004a) fields.
Table A.1: Emission-line objects detected in the LPRX field.
Table A.2: Emission-line objects detected in the LPRX field.
Table A.3: Emission-line objects detected in the LPS field.
Table A.4: Emission-line objects in the LPE field.
Table A.5: Emission-line objects detected in the LSF field.
Table A.6: Emission-line objects detected in the SUB2 field.
Table A.7: Emission-line objects detected in the SUB3 field.
All Figures
|
|
Figure 1:
Finding chart of the Virgo fields discussed in this
paper. The circles indicate radial distances of 1, 2, 3 and 3.5 degrees from the Virgo cluster center identified by Binggeli et al. (1987):
|
| Open with DEXTER | |
| In the text | |
|
|
Figure 2:
Color-magnitude diagrams (CMDs) for all sources in the
LPRX, LPE, LPS and LSF fields. The horizontal lines
indicate the color excess of emission line objects with an
observed
|
| Open with DEXTER | |
| In the text | |
|
|
Figure 3:
Color-color diagrams (
|
| Open with DEXTER | |
| In the text | |
|
|
Figure 4:
CMD ( left panels) and 2-CD ( right panels) of the
sources in the SUB2 field ( top panels) and SUB3 field ( bottom
panels) images. On the left: the squares and asterisks
represent objects classified as ICPNe with CMDs. On the right:
all CMD-identified ICPNe are indicated with open squares; open
diamonds show the ICPNe selected from the 2-CD. The continuum
and/or H |
| Open with DEXTER | |
| In the text | |
|
|
Figure 5:
The luminosity function (LF) of the emission-line
objects detected in LPRX, LPE, LPS, LSF, SUB2 and SUB3 is
indicated by large full red squares. For comparison, the
Ly- |
| Open with DEXTER | |
| In the text | |
|
|
Figure 6:
Surface brightness measurement of diffuse light in the
Virgo fields (points) compared with the surface brightness
profile of the Virgo galaxies averaged in annuli (lines); radial
distances are computed with respect to M 87. The green line
represents the radial surface brightness profile from light in
Virgo galaxies from Binggeli et al. (1987). The dotted-dashed and
double dotted-dashed lines correspond to the surface brightness
profile associated with giants and dwarf galaxies,
respectively. The full blue dots show the surface brightness
measurements in the FCJ, Core, SUBC and LPC fields. The open
circles at the FCJ, SUBC field position indicates the ICL
surface brightness computed from the ICPNe not bound to galaxy
halos. The triangles represent the surface brightness of the
ICL based on IC RGB star counts (Williams et al. 2007; Ferguson et al. 1998; Durrell et al. 2002). The full red dots show the surface brightness
measurements in the RCN1, LPE, SUB2, and SUB3 fields. The arrows
indicate the upper limits for the measurements in LPRX, LPS and
LSF. The magenta open squares indicate the surface brightness
average values
|
| Open with DEXTER | |
| In the text | |
Copyright ESO 2009
Current usage metrics show cumulative count of Article Views (full-text article views including HTML views, PDF and ePub downloads, according to the available data) and Abstracts Views on Vision4Press platform.
Data correspond to usage on the plateform after 2015. The current usage metrics is available 48-96 hours after online publication and is updated daily on week days.
Initial download of the metrics may take a while.