| Issue |
A&A
Volume 507, Number 1, November III 2009
|
|
|---|---|---|
| Page(s) | 261 - 276 | |
| Section | Interstellar and circumstellar matter | |
| DOI | https://doi.org/10.1051/0004-6361/20066262 | |
| Published online | 27 August 2009 | |
A&A 507, 261-276 (2009)
Mid-IR observations of circumstellar disks![[*]](/icons/foot_motif.png)
Part III. A mixed sample of PMS stars and Vega-type objects
O. Schütz1 - G. Meeus2 - M. F. Sterzik1 - E. Peeters3,4,5
1 - European Southern Observatory, Alonso de Cordova 3107, Santiago 19,
Chile
2 - Astrophysikalisches Institut Potsdam, An der
Sternwarte 16, 14482 Potsdam, Germany
3 - NASA Ames Research Center, MS 245-6, Moffett Field, CA 94035, USA
4 - SETI Institute, 515 N. Whisman Road, Mountain View, CA
94043, USA
5 - The University of Western Ontario, London, ON N6A 3K7, Canada
Received 18 August 2006 / Accepted 17 April 2009
Abstract
We present new mid-infrared spectra of 15 targets (1
FU Orionis object, 4 Herbig Ae stars, 5
T Tauri stars, and 5 Vega-type stars), obtained with the
TIMMI2 camera at La Silla Observatory (ESO). Three targets are
members of the ![]() Pic
moving group (HD 155 555, HD
181 296, and HD 319 139). PAH bands
are observed towards the T Tauri star HD
34 700 and the Herbig Ae star PDS 144
N. For HD 34 700, the band profiles indicate
processed PAHs. The spectrum of the Vega-type object
Pic
moving group (HD 155 555, HD
181 296, and HD 319 139). PAH bands
are observed towards the T Tauri star HD
34 700 and the Herbig Ae star PDS 144
N. For HD 34 700, the band profiles indicate
processed PAHs. The spectrum of the Vega-type object ![]() Corvi
(HD 109 085), for which a resolved disk at sub-mm
wavelengths is known, appears stellar between 8-13
Corvi
(HD 109 085), for which a resolved disk at sub-mm
wavelengths is known, appears stellar between 8-13 ![]() m, but a
small excess emission was
reported by Spitzer observations. Similarly, no indication of
circumstellar matter at mid-infrared wavelengths is found towards the
Vega-like stars HD 3003, HD 80 951,
HD 181 296, and, surprisingly, the T Tauri
system HD 155 555. The silicate emission features of
the remaining eight sources are modelled with a mixture of silicates of
different grain sizes and composition. Unprocessed dust dominates
FU Ori, HD 143 006, and CD-43
344. Large amorphous grains are the main dust component around
HD 190 073, HD 319 139,
KK Oph, and PDS 144 S. Both small grains and
crystalline
dust is found for the Vega-type HD 123 356, with a
dominance of small amorphous grains. We show that the infrared emission
of the binary HD 123 356 is dominated by
its late-type secondary, but optical spectroscopy is still
required to confirm the age of the system and the spectral class of the
companion. For most targets, this is their first mid-infrared
spectroscopic observation. We investigate trends between stellar, disk,
and silicate properties and confirm correlations identified
in previous studies. Several objects present an exciting potential for
follow-up high-resolution disk studies.
m, but a
small excess emission was
reported by Spitzer observations. Similarly, no indication of
circumstellar matter at mid-infrared wavelengths is found towards the
Vega-like stars HD 3003, HD 80 951,
HD 181 296, and, surprisingly, the T Tauri
system HD 155 555. The silicate emission features of
the remaining eight sources are modelled with a mixture of silicates of
different grain sizes and composition. Unprocessed dust dominates
FU Ori, HD 143 006, and CD-43
344. Large amorphous grains are the main dust component around
HD 190 073, HD 319 139,
KK Oph, and PDS 144 S. Both small grains and
crystalline
dust is found for the Vega-type HD 123 356, with a
dominance of small amorphous grains. We show that the infrared emission
of the binary HD 123 356 is dominated by
its late-type secondary, but optical spectroscopy is still
required to confirm the age of the system and the spectral class of the
companion. For most targets, this is their first mid-infrared
spectroscopic observation. We investigate trends between stellar, disk,
and silicate properties and confirm correlations identified
in previous studies. Several objects present an exciting potential for
follow-up high-resolution disk studies.
Key words: methods: observational - techniques: spectroscopic - stars: circumstellar matter - infrared: stars - stars: planetary systems: protoplanetary disks - stars: pre-main sequence
1 Introduction
Until now a full understanding of dust evolution in pre-main sequence (PMS) disks and the survival of debris disks is lacking. In terms of their dust evolution, we need to distinguish between the two disk types. For an in-depth discussion of gas and dust evolution in circumstellar disks, we refer the reader to the review by Meyer et al. (2007).
Primordial PMS disks largely reflect the grain size distribution of the
interstellar medium (ISM), while more evolved PMS disks experience
grain growth and crystallisation. However, there is no global
correlation between dust properties and age, not even for individual
spectral types. Schegerer et al. (2006)
re-analysed the mid-infrared silicate emission features of
27 T Tauri stars (TTS) and found that the overall
degree of crystallinity in T Tauri disks correlates neither
with stellar age nor luminosity. By resolved interferometric
observations, van Boekel et al. (2004) showed
that a higher amount of crystalline dust is seen in close proximity to
the star than in the outer disk regions. In an analysis of 40 TTS and 7
HAeBe stars, Kessler-Silacci et al. (2006) found a
correlation with spectral type for the ratio of strength-to-shape in
the N-band silicate feature, but no relationship
with stellar age or disk evolutionary status. Therefore, the observed
grain sizes in PMS disks must also depend on other factors such as,
e.g., close companions, or turbulence and gas content in the disk,
while the exact dependencies thereof remain unknown. Kessler-Silacci
et al. (2007)
demonstrated that the disk region probed by the 10 ![]() m silicate
emission features, is related to stellar luminosity, which could
explain the correlation of grain size with spectral type.
m silicate
emission features, is related to stellar luminosity, which could
explain the correlation of grain size with spectral type.
Debris disks - also referred to as Vega-type objects - are often
characterised by their lack of gas, so that the dust dynamics is no
longer influenced by that of the gas. The presence of small dust
particles in these disks points towards a continuous replenishment of
the dust grains, e.g., by collisions between planetesimals, asteroids,
or comets. By means of collisional cascades significant amounts of
small grains can be produced, down to grain sizes that are easily
removed by radiation pressure on short timescales, and therefore,
without replenishment would not
be expected to be present in the disk. Song et al. (2005) found a
surprisingly strong silicate feature for the ![]() 300 Myr old star BD+20 307,
which they explained by the release of secondary dust after the
destruction of asteroids. The emission peak shortward of 10
300 Myr old star BD+20 307,
which they explained by the release of secondary dust after the
destruction of asteroids. The emission peak shortward of 10![]() m in its
spectrum indicates rather small grains. In Schütz et al. (2005b,
hereafter Paper II), we discussed a similar - but much younger
- main-sequence object, HD 113 766, which shows
large amounts of crystalline secondary dust, possibly released by
collisions in a planetesimal belt. By applying spatially resolved
spectroscopy to
m in its
spectrum indicates rather small grains. In Schütz et al. (2005b,
hereafter Paper II), we discussed a similar - but much younger
- main-sequence object, HD 113 766, which shows
large amounts of crystalline secondary dust, possibly released by
collisions in a planetesimal belt. By applying spatially resolved
spectroscopy to ![]() Pic,
Okamoto et al. (2004) were
able to trace the origin of secondary dust towards the location of
putative planetesimal belts. HD 69 830 is another
system with secondary debris dust in the form of warm, small,
crystalline silicates (Beichman et al. 2005),
possibly resulting from the disruption of an asteroid within
1 AU from the star (Lisse et al. 2007).
Interestingly, this system is also known to host three Neptune-sized
planets (Lovis et al. 2006).
Pic,
Okamoto et al. (2004) were
able to trace the origin of secondary dust towards the location of
putative planetesimal belts. HD 69 830 is another
system with secondary debris dust in the form of warm, small,
crystalline silicates (Beichman et al. 2005),
possibly resulting from the disruption of an asteroid within
1 AU from the star (Lisse et al. 2007).
Interestingly, this system is also known to host three Neptune-sized
planets (Lovis et al. 2006).
The present paper continues our previous mid-infrared (MIR) spectroscopic studies of circumstellar disks. In Schütz et al. (2005a, hereafter Paper I), we described our strategy and dust emission models, and analysed a sample of pre-main sequence stars. Vega-type objects with debris disks were studied with the same methods in Schütz et al. (2005b, Paper II).
This contribution describes new mid-infrared spectra of circumstellar
disks. We selected targets with infrared excess that have not yet been
discussed in depth in the literature, i.e., objects which were
suspected to be disk candidates, but for which no MIR spectroscopy had
been obtained before. Several isolated targets were unobserved by
Spitzer, since they were not included in the surveys of open clusters
and moving groups. We re-observed targets where newer or higher SNR
data were required, as for HD 34 700. A MIR spectrum
of KK Oph had already been published, however, it was not
analysed with the methods that we present here. We included the well
studied object FU Ori to enable a comparison with other FU
Orionis targets from Paper I. Table 1
summarises our targets and their stellar parameters. In Sect. 2, we
describe the observations and data reduction. Section 3
discusses the spectral energy distributions (SEDs) and methods for
analysing the emission feature in the 8-13 ![]() m spectra.
In Sect. 4,
we describe observed trends in the dust
properties. A summary of our results is given in Sect. 6.
The known properties of each target are described in detail in the
Appendix. It is our goal to contribute a piece to the puzzle of disk
and dust evolution around young stars.
m spectra.
In Sect. 4,
we describe observed trends in the dust
properties. A summary of our results is given in Sect. 6.
The known properties of each target are described in detail in the
Appendix. It is our goal to contribute a piece to the puzzle of disk
and dust evolution around young stars.
2 Observations and data reduction
TIMMI2.
The principal data described in this work were obtained with the ESO
TIMMI2 camera (Käufl et al. 2003) at
La Silla Observatory. We performed
most of the observations during run 077.C-0054(A) in June 2006,
supported by further data retrieved from the ESO/ST-ECF Science Archive![]() , which was originally
observed in March 2003 (targets HD 109 085, HD
123 356
and HD 143 006; ESO program 070.C-0743(A); PI
J.-C. Augereau) and July 2003 (target KK Oph; ESO
program 071.C-0438(A); PI H. Linz). Further data were
collected during TIMMI2 technical nights in October 2005 and January
2006. Table 2 summarises the origin of all data.
, which was originally
observed in March 2003 (targets HD 109 085, HD
123 356
and HD 143 006; ESO program 070.C-0743(A); PI
J.-C. Augereau) and July 2003 (target KK Oph; ESO
program 071.C-0438(A); PI H. Linz). Further data were
collected during TIMMI2 technical nights in October 2005 and January
2006. Table 2 summarises the origin of all data.
Imaging data were obtained with a 0.20''/pixel scale, corresponding to
a ![]() field of view. For most targets, the nodding direction
was perpendicular to the chop throw, resulting in four images of the
source
in the coadded frame, each carrying 25% of the flux. Some archive data,
however, had the nod parallel to the chop, giving three images of the
source, with the central one carrying 50% of the flux.
We applied aperture photometry with radii
field of view. For most targets, the nodding direction
was perpendicular to the chop throw, resulting in four images of the
source
in the coadded frame, each carrying 25% of the flux. Some archive data,
however, had the nod parallel to the chop, giving three images of the
source, with the central one carrying 50% of the flux.
We applied aperture photometry with radii ![]() between 2.6 pixel and 4.7 pixel, depending on the target. The optimal
radii were derived from curves of growth and averaged over the radii
obtained for each of the beams, to account for detector
inhomogeneities. We estimate the error in the photometry by calculating
the mean of the measurement errors for each beam. The background level
was determined by measuring the mean sky value per pixel around each
beam in an annulus centred on the star with inner radius
between 2.6 pixel and 4.7 pixel, depending on the target. The optimal
radii were derived from curves of growth and averaged over the radii
obtained for each of the beams, to account for detector
inhomogeneities. We estimate the error in the photometry by calculating
the mean of the measurement errors for each beam. The background level
was determined by measuring the mean sky value per pixel around each
beam in an annulus centred on the star with inner radius ![]() pixel
and outer radius
pixel
and outer radius ![]() pixel
(resulting in a maximum outer radius of 5'', while the chopping
amplitude is 10''). Photometric standard stars
were selected from a list of MIR standards by Cohen (1998) and
observed approximately each 2 h.
pixel
(resulting in a maximum outer radius of 5'', while the chopping
amplitude is 10''). Photometric standard stars
were selected from a list of MIR standards by Cohen (1998) and
observed approximately each 2 h.
N-band spectra were obtained between 8-13 ![]() m by
applying a standard chopping and nodding technique along the 1.2'' slit
(for archive data and technical time) or the 3'' slit (run
077.C-0054(A)) with a throw of 10''. The spectral resolution of the
used 10
m by
applying a standard chopping and nodding technique along the 1.2'' slit
(for archive data and technical time) or the 3'' slit (run
077.C-0054(A)) with a throw of 10''. The spectral resolution of the
used 10 ![]() m
low-resolution grism is 0.02
m
low-resolution grism is 0.02 ![]() m / pixel
(
m / pixel
(![]() /
/
![]() ).
Airmass and on-source integration times of the observations are listed
in Table 2. Standard stars for telluric correction and flux
calibration were selected from the list of Cohen (1998) and
observed close in time and airmass.
).
Airmass and on-source integration times of the observations are listed
in Table 2. Standard stars for telluric correction and flux
calibration were selected from the list of Cohen (1998) and
observed close in time and airmass.
The spectroscopic frames were debiased and checked for correct slit
alignment along the detector, i.e., whether the spectrum is aligned
with
the x-axis. After coadding the positive and negative nodding positions,
the extraction profile was determined from the cross dispersion
profile: the target spectrum was extracted along a profile width where
the SNR exceeds 2.5 times the noise of the background. We
furthermore applied an airmass correction described in Schütz &
Sterzik (2005) and
correlated the spectrophotometric calibration with the obtained N-band
photometry. The wavelength calibration was optimised using the
atmospheric absorption features of ozone (9.58 ![]() m) and CO2
(11.73
m) and CO2
(11.73 ![]() m,
12.55
m,
12.55 ![]() m)
in addition to the given TIMMI2 wavelength calibration table, i.e.,
shifts were applied to minimise the residual division between the
atmospheric features in standard
stars and target spectra. When atmospheric conditions were unstable
between observations of target and standard star, leaving uncorrectable
ozone features around 9.5
m)
in addition to the given TIMMI2 wavelength calibration table, i.e.,
shifts were applied to minimise the residual division between the
atmospheric features in standard
stars and target spectra. When atmospheric conditions were unstable
between observations of target and standard star, leaving uncorrectable
ozone features around 9.5 ![]() m, we removed these remnant features from the
spectra. By comparing data from different nights and applying several
standard stars for comparison, the exact position of the ozone remnant
feature can be identified. Depending on the atmospheric quality, this
leaves gaps of different sizes up to a maximum range of
between 9.4 and 9.9
m, we removed these remnant features from the
spectra. By comparing data from different nights and applying several
standard stars for comparison, the exact position of the ozone remnant
feature can be identified. Depending on the atmospheric quality, this
leaves gaps of different sizes up to a maximum range of
between 9.4 and 9.9 ![]() m.
The SNR in our target spectra, averaged
between 8-12
m.
The SNR in our target spectra, averaged
between 8-12 ![]() m,
ranges between 10 and about 70 for all objects,
with a minimum SNR in the spectra of HD 3003 and HD
319 139, while the highest SNR is obtained for FU
Ori and KK Oph.
m,
ranges between 10 and about 70 for all objects,
with a minimum SNR in the spectra of HD 3003 and HD
319 139, while the highest SNR is obtained for FU
Ori and KK Oph.
Spitzer.
HD 34 700 is also observed with the IRS onboard the
Spitzer Space
Telescope (Werner et al. 2004) (AOR key
= 3 584 768, GTO program of J. Houck). The spectra
were taken with the Short-Low (SL, 5-15 ![]() m) and Short-High (SH, 10-20
m) and Short-High (SH, 10-20 ![]() m) modules
(Houck et al. 2004) with a
resolving power of R = 60-128 and 600,
respectively. The basic data reduction was performed by the standard
IRS pipeline S13 at the Spitzer Science Center (SSC). Subsequently, bad
pixels were removed with IRSCLEAN (available from the SSC website
m) modules
(Houck et al. 2004) with a
resolving power of R = 60-128 and 600,
respectively. The basic data reduction was performed by the standard
IRS pipeline S13 at the Spitzer Science Center (SSC). Subsequently, bad
pixels were removed with IRSCLEAN (available from the SSC website![]() ) and a standard
point-source extraction was performed using SMART (Higdon
et al. 2004): tapered
column extraction for SL data (i.e., the width of the extraction scales
with wavelength and equals 7.2'' at 6
) and a standard
point-source extraction was performed using SMART (Higdon
et al. 2004): tapered
column extraction for SL data (i.e., the width of the extraction scales
with wavelength and equals 7.2'' at 6 ![]() m); full aperture extraction for SH data (
m); full aperture extraction for SH data (
![]() ).
).
Further auxiliary data. During the discussion of two targets - HD 109 085 and HD 123 356 - we refer to individual data obtained either with VISIR (Lagage et al. 2004) or SOFI (Moorwood et al. 1998).
3 Analysis
Table 1: Stellar parameters and known fluxes of our target sample.
Table 2: Results from TIMMI2 photometry and spectroscopy.
3.1 Spectral energy distributions
Together with fluxes from the literature in the passbands UBVRI, JHK
(2MASS), 12, 25, 60 and 100 ![]() m (IRAS), we used the TIMMI2 photometry in
Table 2 to construct a spectral energy
distribution (SED) for our targets. In Figs. 1-3, the
resulting optical to mm spectral energy distributions are displayed. To
emphasise the non-stellar contribution to the SED, we plotted a Kurucz
atmosphere model (Kurucz 1994) with the
stellar parameters from Table 1,
normalised to the V-band flux. For FU
Ori, we did not plot a Kurucz model, since for this kind of object
the V-band flux most likely originates in the star
and the hot inner part of the outbursting disk (cf. Sect. A.1).
Where required, we reddened the Kurucz model with the extinction Av
given in Table 1.
The photometry to
construct the SEDs was taken from Hutchinson et al. (1990),
Henning et al. (1994),
Sylvester et al. (1996),
Coulson et al. (1998), Malfait
et al. (1998),
Mannings & Barlow (1998),
Sylvester & Mannings (2000),
Sylvester et al. (2001),
Jayawardhana et al. (2001),
Mamajek et al. (2004), Natta
et al. (2004), Sheret
et al. (2004), Wyatt
et al. (2005), Perrin
et al. (2006), and the
catalogs JP11, 2MASS, IRAS, and SIMBAD.
m (IRAS), we used the TIMMI2 photometry in
Table 2 to construct a spectral energy
distribution (SED) for our targets. In Figs. 1-3, the
resulting optical to mm spectral energy distributions are displayed. To
emphasise the non-stellar contribution to the SED, we plotted a Kurucz
atmosphere model (Kurucz 1994) with the
stellar parameters from Table 1,
normalised to the V-band flux. For FU
Ori, we did not plot a Kurucz model, since for this kind of object
the V-band flux most likely originates in the star
and the hot inner part of the outbursting disk (cf. Sect. A.1).
Where required, we reddened the Kurucz model with the extinction Av
given in Table 1.
The photometry to
construct the SEDs was taken from Hutchinson et al. (1990),
Henning et al. (1994),
Sylvester et al. (1996),
Coulson et al. (1998), Malfait
et al. (1998),
Mannings & Barlow (1998),
Sylvester & Mannings (2000),
Sylvester et al. (2001),
Jayawardhana et al. (2001),
Mamajek et al. (2004), Natta
et al. (2004), Sheret
et al. (2004), Wyatt
et al. (2005), Perrin
et al. (2006), and the
catalogs JP11, 2MASS, IRAS, and SIMBAD.
The SED of HD 155 555 can be explained entirely by
stellar emission, while for HD 3003, HD
80 951, HD 109 085, and HD
181 296, the IR excess begins longward of 25 ![]() m. We,
therefore, do not consider those objects in our dust analysis. For the
other targets, a near-infrared (NIR) excess is seen, starting longward
of the L-band for HD 34 700 as
well as HD 319 139, and around 1
m. We,
therefore, do not consider those objects in our dust analysis. For the
other targets, a near-infrared (NIR) excess is seen, starting longward
of the L-band for HD 34 700 as
well as HD 319 139, and around 1 ![]() m for the
remaining eight
targets.
m for the
remaining eight
targets.
For HD 109 085 (alias ![]() Crv), we obtained Q1 band (17.7
Crv), we obtained Q1 band (17.7 ![]() m) imaging
with VISIR during run 076.C-0634(A) in March 2006. Using a standard
chopping technique
m) imaging
with VISIR during run 076.C-0634(A) in March 2006. Using a standard
chopping technique ![]() Crv was observed with a throw of 10
Crv was observed with a throw of 10
![]() at an airmass of 1.03, while the standard star (HD
99 167) was obtained at airmass 1.35. Standard data
reduction and photometric extraction was applied, including a
correction for the atmospheric extinction. The derived photometric flux
was 1.59 Jy (
at an airmass of 1.03, while the standard star (HD
99 167) was obtained at airmass 1.35. Standard data
reduction and photometric extraction was applied, including a
correction for the atmospheric extinction. The derived photometric flux
was 1.59 Jy (![]() 0.10 Jy).
Subtraction of the PSF showed that the source was not resolved at
17.7
0.10 Jy).
Subtraction of the PSF showed that the source was not resolved at
17.7 ![]() m:
the FWHM was 6.7 pixel (0.50
m:
the FWHM was 6.7 pixel (0.50
![]() )
for the standard star, while only 6.8 pixel (0.51
)
for the standard star, while only 6.8 pixel (0.51
![]() )
for
)
for ![]() Crv.
Crv.
We determined from which component of HD 123 356 the excess emission arises. The 2MASS photometry gives the combined fluxes of both sources but interestingly, the corresponding 2MASS coordinates seem to be centered on the secondary. With SOFI images obtained during thick clouds in May 2006, we were able to separate the emission components and found that the secondary dominates the IR. The relative NIR brightness difference between secondary and primary amounts to 3.3 mag in filter NB1.19, 4.0 mag in NB1.71 and FeII-H, and 4.2 mag in NB2.09. With this information, it was possible to divide the 2MASS fluxes between both components and to plot a resolved SED (see Fig. 3). From the VJHK colors of both stars, the primary appears to be a F7-G1 star, in agreement with the SIMBAD classification, while the secondary seems to be either a very late M-type or it suffers extinction. In TIMMI2 MIR data, we only could detect one isolated source. Although astrometry is not possible using TIMMI2 data, with the observations discussed above, we can safely assume that we only see the secondary in the MIR. In the SED, we plot Kurucz models for both components.
3.2 Dust properties
In Figs. 4-6 and 8, we show the N-band spectra for our targets. To quantify the differences between the sources and determine the composition of the circumstellar dust, we adopted the same procedure as described in Sect. 4 of Paper I, which is summarised below in Sect. 3.2.1. For further details, we refer to Paper I. Since two objects exhibit strong PAH emission, a description of PAH classes is given in Sect. 3.2.4.
3.2.1 Silicates
When stars form out of their parental cloud, the material in
their disks is assumed to have a similar initial
composition as in the
interstellar medium, in which amorphous silicates are the main
component observed at 10 ![]() m (e.g., Kemper et al. 2004). Changes
in the composition, structure, and size are expected to occur during
the subsequent evolution of the star+disk system, possibly leading to a
planetary system. Laboratory experiments have suggested that, because
of
thermal annealing, amorphous silicates gradually turn into crystalline
forsterite and silica (e.g., Rietmeijer 1989;
Hallenbeck
& Nuth 1997).
Bouwman et al. (2001) found
a correlation between the amount of forsterite and silica in the disks
of Herbig Ae/Be (HAeBe) stars, indicating that thermal annealing indeed
takes place in these objects. A similar correlation was also found for
the lower-mass T Tauri stars (e.g. Meeus et al. 2003). These
authors also concluded that the dust around HAeBe stars and
T Tauri stars
has very similar characteristics. In Paper II, we successfully
modelled a sample of Vega-type stars with the same dust species as
those found in young stellar objects. The above-mentioned dust species
emit in the N band, making this an
excellent window to study dust evolution in the inner parts of the
circumstellar disk.
m (e.g., Kemper et al. 2004). Changes
in the composition, structure, and size are expected to occur during
the subsequent evolution of the star+disk system, possibly leading to a
planetary system. Laboratory experiments have suggested that, because
of
thermal annealing, amorphous silicates gradually turn into crystalline
forsterite and silica (e.g., Rietmeijer 1989;
Hallenbeck
& Nuth 1997).
Bouwman et al. (2001) found
a correlation between the amount of forsterite and silica in the disks
of Herbig Ae/Be (HAeBe) stars, indicating that thermal annealing indeed
takes place in these objects. A similar correlation was also found for
the lower-mass T Tauri stars (e.g. Meeus et al. 2003). These
authors also concluded that the dust around HAeBe stars and
T Tauri stars
has very similar characteristics. In Paper II, we successfully
modelled a sample of Vega-type stars with the same dust species as
those found in young stellar objects. The above-mentioned dust species
emit in the N band, making this an
excellent window to study dust evolution in the inner parts of the
circumstellar disk.
![\begin{figure}
\par\includegraphics[scale=0.60, angle=90]{06262fg1.ps}
\end{figure}](/articles/aa/full_html/2009/43/aa6262-06/img32.png)
|
Figure 1: Spectral energy distributions for FU Ori and the Herbig Ae stars. A Kurucz model is overplotted for all targets to represent the stellar contribution to the SED, apart from FU Ori as justified in the text. The profile of the N-band spectrum is indicated in the SEDs (at the position of the arrow) to show their agreement with the photometry. For PDS 144 N and S all IR fluxes are taken from Perrin et al. (2006). |
| Open with DEXTER | |
![\begin{figure}
\par\includegraphics[scale=0.60, angle=90]{06262fg2.ps}
\end{figure}](/articles/aa/full_html/2009/43/aa6262-06/img33.png)
|
Figure 2: The spectral energy distributions for the T Tauri stars. Remarkably, HD 155 555 shows no excess emission in the infrared. |
| Open with DEXTER | |
![\begin{figure}
\par\includegraphics[scale=0.60, angle=90]{06262fg3.ps}
\end{figure}](/articles/aa/full_html/2009/43/aa6262-06/img34.png)
|
Figure 3: Spectral energy distributions of the Vega-type stars. For the binary HD 123 356 the SED of the primary ( black curve) is entirely stellar, while the excess emission is dominated by the secondary ( grey curve and stars). |
| Open with DEXTER | |
![\begin{figure}
\par\includegraphics[scale=1.02, angle=90]{06262fg4.ps}
\end{figure}](/articles/aa/full_html/2009/43/aa6262-06/img35.png)
|
Figure 4: Dust decomposition for FU Ori and the Herbig Ae stars. The different linestyles - or colours in the online version - represent small amorphous silicates ( dash-triple-dots, orange), large amorphous silicates ( dashed, red), both small and large grains of crystalline forsterite ( dash-dots, blue), silica (SiO2, dotted, purple) and enstatite ( long curved dashes, green). The very thick black curve corresponds to the observed spectrum. The sum of the different model components is given by the overplotted grey curve. |
| Open with DEXTER | |
Our analysis is based on a method that is commonly used when analysing
the dust features around 10 ![]() m: fitting a continuum to the spectral range
outside the feature, and then decomposing the continuum-subtracted
emission feature by fitting a linear combination of absorption
coefficients of different dust species, for a few selected sizes. For a
deeper discussion of this method, we refer to Bouwman et al. (2001) and
van Boekel et al. (2005).
To derive the composition of the circumstellar dust, we model the
spectra in Figs. 4-5
with a linear combination of emission features from the following dust
species, which have been identified in the disks of pre-main sequence
stars:
m: fitting a continuum to the spectral range
outside the feature, and then decomposing the continuum-subtracted
emission feature by fitting a linear combination of absorption
coefficients of different dust species, for a few selected sizes. For a
deeper discussion of this method, we refer to Bouwman et al. (2001) and
van Boekel et al. (2005).
To derive the composition of the circumstellar dust, we model the
spectra in Figs. 4-5
with a linear combination of emission features from the following dust
species, which have been identified in the disks of pre-main sequence
stars:
![\begin{figure}
\par\includegraphics[scale=1.04, angle=90]{06262fg5.ps}
\end{figure}](/articles/aa/full_html/2009/43/aa6262-06/img36.png)
|
Figure 5: Dust decomposition for the T Tauri stars (first three panels). See the caption of Fig. 4 for an explanation of the linestyles. The bottom panel shows HD 123 356, the only Vega-type object in our sample that shows a silicate feature. |
| Open with DEXTER | |
- Amorphous olivine ([Mg,Fe]2SiO4)
with grain sizes of 0.1 and
2.0
 m,
which we refer to as ``small'' and ``large'' grains.
We used absorption coefficients of spherical grains based on laboratory
experiments by Dorschner et al. (1995).
m,
which we refer to as ``small'' and ``large'' grains.
We used absorption coefficients of spherical grains based on laboratory
experiments by Dorschner et al. (1995).
- Amorphous pyroxene ([Mg,Fe]SiO3)
with grain sizes of 0.1 and 2.0 m. These absorption coefficients are also based
on Dorschner et al. (1995).
- Crystalline silicates: magnesium forsterite (Mg2SiO4)
and enstatite (MgSiO3). The latter silicate,
however, is rare even in young sources (cf. Paper I).
Coefficients for forsterite are
from Servoin & Piriou (1973), and for
enstatite from Jaeger et al. (1998). Each of
these silicates was modelled with both ``small'' and ``large'' grains.
- Silica (SiO2) coefficients were
taken from Spitzer & Kleinman (1961).
3.2.2 Shape and size of the dust grains
Astronomical dust grains probably have various shapes and structures
(compact/fractal), as reflected in their different spectral signatures,
which complicates the spectral
analysis. Min et al. (2003, 2005) showed that mass absorption
coefficients,
calculated with a distribution of hollow spheres (DHS), provide a
reliable
identification of solid state components. In this work, we used mass
absorption
coefficients ![]() from van Boekel et al. (2005). More
specifically,
for the crystalline grains and silica,
from van Boekel et al. (2005). More
specifically,
for the crystalline grains and silica, ![]() was calculated with DHS,
while for the amorphous olivine and pyroxene grains, Mie theory was
applied
because here shape effects are less significant. For a more extensive
discussion of
shape and structure effects on spectral signatures, we refer to Min
et al.
(2003, 2005).
was calculated with DHS,
while for the amorphous olivine and pyroxene grains, Mie theory was
applied
because here shape effects are less significant. For a more extensive
discussion of
shape and structure effects on spectral signatures, we refer to Min
et al.
(2003, 2005).
In circumstellar disks, dust grains grow and become destroyed by
various
processes. As a result, the dust grains do not have a single size, but
a wide
range in size. Since the grains are not always compact, but can be
fluffy as
well, the term ``volume equivalent radius'', rV
is introduced, which is the
radius of a sphere with the same material volume as the particle. This
means
that fluffy particles have a much smaller rV
than for their true size. Van
Boekel et al. (2005)
showed that the size distribution of grains radiating in the
10 ![]() m
region can be represented by two grain sizes: ``small'' (rV
=
0.1
m
region can be represented by two grain sizes: ``small'' (rV
=
0.1 ![]() m)
and ``large'' (rV
= 1.5
m)
and ``large'' (rV
= 1.5 ![]() m).
It is this approach that we
follow when modelling our spectra.
m).
It is this approach that we
follow when modelling our spectra.
3.2.3 Fitting procedure
We used absorption coefficients from van Boekel et al. (2005)
and Bouwman (2008), which
are based on the laboratory
data cited above. For the compositional fit, we perform an error
analysis as described in Sect. 5.1.3 of van Boekel
et al. (2005),
by minimising the expression for the reduced ![]()
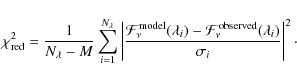
|
(1) |
Since
We caution against overinterpreting our fitting results. Significant systematic errors could indeed be introduced by either an imperfect calibration or the limited wavelength range and SNR, both inherent to ground-based observations (see Juhász et al. 2009 for a thorough discussion on this topic). Since we cannot quantify these systematic errors, we were also unable to take them into account in the fitting procedure. Nevertheless, the results are capable of distinguishing between small and large grains, but probably only indicative for the crystalline species.
The modelling results for the emission spectra, and the contribution of
each dust component are shown in
Figs. 4-5.
We note that,
while we model the spectra with the 10 (grain and size) dust types and
PAH as
explained above, we plot only 6 components for clearer
visibility. In particular, we added amorphous olivine and pyroxene at
0.1 ![]() m,
plotting them as ``small amorphous silicates''. Similarly, ``large
amorphous silicates''
contain the 2.0
m,
plotting them as ``small amorphous silicates''. Similarly, ``large
amorphous silicates''
contain the 2.0 ![]() m
pyroxene and 2.0
m
pyroxene and 2.0 ![]() m
olivine grains. For silica,
forsterite, and enstatite, we plot the sum of the 0.1 and 2.0
m
olivine grains. For silica,
forsterite, and enstatite, we plot the sum of the 0.1 and 2.0 ![]() m grains.
m grains.
When deriving the amount of the different dust species present, the
linear coefficients of the fit - which are proportional to the
radiating surface of the grains, assuming optically thin emission -
need to be converted into mass. However, it is not possible to
determine the absolute amount of mass for each species present, since
we have no spatially resolved data for deriving the particles' size,
density, or temperature distribution as a function of radius within the
disk. Therefore, we derived mass fractions of the different species
based on the assumptions that the particles (1) are spherical and (2)
have the same density. The mass fractions are meaningful for
comparing the objects in our sample and to establish the relative
amount of processed dust that we observe at 10 ![]() m. In
Table 3,
we list the derived mass fractions, which is the ratio of the mass of a
particular dust species to the total dust mass. We note that for a
given mass, small particles have a larger total emitting surface than
large ones. In contrast, a similar amount of observed radiation will
result in a much smaller mass when caused by small grains than if
caused by larger grains. We also note that our results are valid only
for warm dust, which is located in the inner part of the disk
atmosphere (r<10 AU) and radiates in
the 10
m. In
Table 3,
we list the derived mass fractions, which is the ratio of the mass of a
particular dust species to the total dust mass. We note that for a
given mass, small particles have a larger total emitting surface than
large ones. In contrast, a similar amount of observed radiation will
result in a much smaller mass when caused by small grains than if
caused by larger grains. We also note that our results are valid only
for warm dust, which is located in the inner part of the disk
atmosphere (r<10 AU) and radiates in
the 10 ![]() m
region. If the disk atmosphere and midplane are well-mixed, the
relative abundances should reflect
the bulk composition of the inner disk, but if there is vertical
settling the interpretation is more complex.
m
region. If the disk atmosphere and midplane are well-mixed, the
relative abundances should reflect
the bulk composition of the inner disk, but if there is vertical
settling the interpretation is more complex.
3.2.4 PAH
Polycyclic Aromatic Hydrocarbons (PAHs) show N-band
emission features at 7.7, 8.6, 11.0, 11.2, and 12.7 ![]() m. A key
result in observational studies of the PAH bands is that their profiles
show clear variations in their peak positions, profile shape, and
relative intensities (Peeters et al. 2004a and
references therein). HII regions, reflection nebulae, and the ISM all
exhibit the same PAH band profiles (called ``class A''), while
planetary nebulae and post-AGB stars have clearly different,
red-shifted profiles, which are most noticeable for the 6.2 and
7.7
m. A key
result in observational studies of the PAH bands is that their profiles
show clear variations in their peak positions, profile shape, and
relative intensities (Peeters et al. 2004a and
references therein). HII regions, reflection nebulae, and the ISM all
exhibit the same PAH band profiles (called ``class A''), while
planetary nebulae and post-AGB stars have clearly different,
red-shifted profiles, which are most noticeable for the 6.2 and
7.7 ![]() m
emission bands (class B/C). Figures 7 and 9 show
these PAH profiles for two of our targets. We note that in contrast to
class A, in which the PAH profiles in all objects are almost
identical, class B comprises a wide variety of profiles for the 6.2 and
7.7
m
emission bands (class B/C). Figures 7 and 9 show
these PAH profiles for two of our targets. We note that in contrast to
class A, in which the PAH profiles in all objects are almost
identical, class B comprises a wide variety of profiles for the 6.2 and
7.7 ![]() m
PAH bands (Peeters et al. 2002). The
latter class is based on the spectra of evolved stars, where PAH
formation and processing is actively taking place. HAeBe stars also
exhibit large variations in their PAH profiles (Peeters et al.
2002;
van Diedenhoven et al. 2004;
Sloan et al. 2005). HAeBes
with profiles similar to those found in the ISM (class A) are embedded
in their parental cloud and PAHs from this cloud dominate the emission.
Thus, the initial characteristics of the PAH family in the
protoplanetary disks of HAeBe stars are the same as in the ISM. On the
other hand, those HAeBes exhibiting significantly different PAH
profiles (class B) are isolated HAeBe stars, and spatial studies show
that their PAH emission originates in the disk (e.g. Habart
et al. 2004, 2006; Geers
et al. 2007b; Lagage
et al. 2006;
Doucet et al. 2007), implying
that PAH processing is actively
occurring in these disks. In addition, the presence of PAH emission is
related to the disk geometry (Meeus et al. 2001; Acke
& van den
Ancker 2004): PAH
emission is observed in flaring disks where the PAH molecules can be
excited by UV photons from the central star, while it is much weaker
(if present) in stars with a flat disk. A study of Spitzer-IRS
observations of a sample of HAeBe stars and Post-AGB stars identified a
correlation between the position of the 7.7 and 11.2
m
PAH bands (Peeters et al. 2002). The
latter class is based on the spectra of evolved stars, where PAH
formation and processing is actively taking place. HAeBe stars also
exhibit large variations in their PAH profiles (Peeters et al.
2002;
van Diedenhoven et al. 2004;
Sloan et al. 2005). HAeBes
with profiles similar to those found in the ISM (class A) are embedded
in their parental cloud and PAHs from this cloud dominate the emission.
Thus, the initial characteristics of the PAH family in the
protoplanetary disks of HAeBe stars are the same as in the ISM. On the
other hand, those HAeBes exhibiting significantly different PAH
profiles (class B) are isolated HAeBe stars, and spatial studies show
that their PAH emission originates in the disk (e.g. Habart
et al. 2004, 2006; Geers
et al. 2007b; Lagage
et al. 2006;
Doucet et al. 2007), implying
that PAH processing is actively
occurring in these disks. In addition, the presence of PAH emission is
related to the disk geometry (Meeus et al. 2001; Acke
& van den
Ancker 2004): PAH
emission is observed in flaring disks where the PAH molecules can be
excited by UV photons from the central star, while it is much weaker
(if present) in stars with a flat disk. A study of Spitzer-IRS
observations of a sample of HAeBe stars and Post-AGB stars identified a
correlation between the position of the 7.7 and 11.2 ![]() m PAH bands
and the effective temperature of the central star (Sloan et al. 2005, 2007).
m PAH bands
and the effective temperature of the central star (Sloan et al. 2005, 2007).
![\begin{figure}
\par\includegraphics[scale=0.46, angle=0]{06262fg6.ps}
\end{figure}](/articles/aa/full_html/2009/43/aa6262-06/img45.png)
|
Figure 6:
The TIMMI2 spectrum of PDS 144 N, showing the 8.6, 11.0 and
11.2 |
| Open with DEXTER | |
Table 3: Relative mass fractions in percent derived from the model fits to the N-band spectra.
![\begin{figure}
\par\includegraphics[scale=0.58, angle=0]{06262fg7.ps} \medskip
\end{figure}](/articles/aa/full_html/2009/43/aa6262-06/img84.png)
|
Figure 7:
A comparison of the 8.6 and 11.2 |
| Open with DEXTER | |
PDS 144 N.
Our TIMMI2 spectrum of PDS 144 N clearly shows PAH emission
at 8.6, 11.0, and 11.2 ![]() m (see Fig. 6).
Comparison of the 8.6 and 11.2
m (see Fig. 6).
Comparison of the 8.6 and 11.2 ![]() m PAH profiles with the different PAH classes
(see Fig. 7)
indicates that for PDS 144 N the 8.6
m PAH profiles with the different PAH classes
(see Fig. 7)
indicates that for PDS 144 N the 8.6 ![]() m PAH band
belongs to class A and hence is similar to the ISM. In
contrast, its 11.2
m PAH band
belongs to class A and hence is similar to the ISM. In
contrast, its 11.2 ![]() m
PAH profile is distinct from both class A and B in that its
peak wavelength is redshifted compared to both classes. Van Diedenhoven
et al. (2004)
examined the 11.2
m
PAH profile is distinct from both class A and B in that its
peak wavelength is redshifted compared to both classes. Van Diedenhoven
et al. (2004)
examined the 11.2 ![]() m
PAH band profile for a handful of HAeBe stars (other spectra were not
adequate because of the presence of
crystalline silicates at this wavelength or insufficient SNR). All but
one of these stars belong to class A for all of their PAH
bands. Sloan et al. (2005,
2007)
reported class B characteristics for four HAeBe and a
T Tauri star. In addition, these authors found a range of peak
positions for the 11.2
m
PAH band profile for a handful of HAeBe stars (other spectra were not
adequate because of the presence of
crystalline silicates at this wavelength or insufficient SNR). All but
one of these stars belong to class A for all of their PAH
bands. Sloan et al. (2005,
2007)
reported class B characteristics for four HAeBe and a
T Tauri star. In addition, these authors found a range of peak
positions for the 11.2 ![]() m
band and related this to the effective temperature of the star, i.e.,
the central wavelength shifts to longer wavelengths as the effective
temperature decreases. Tielens (2008) pointed
out that this relationship can also be interpreted as a step function
instead of a continuous dependence. In this respect, the deviation from
class A seems to be connected to the presence of circumstellar
material (Van Kerckhoven 2002;
Boersma et al. 2008).
However, the underlying cause of these variations in the
11.2
m
band and related this to the effective temperature of the star, i.e.,
the central wavelength shifts to longer wavelengths as the effective
temperature decreases. Tielens (2008) pointed
out that this relationship can also be interpreted as a step function
instead of a continuous dependence. In this respect, the deviation from
class A seems to be connected to the presence of circumstellar
material (Van Kerckhoven 2002;
Boersma et al. 2008).
However, the underlying cause of these variations in the
11.2 ![]() m
band is not well understood (see e.g., van Diedenhoven et al. 2004). For
a ``central wavelength'' (the wavelength with half the emitted flux to
either side, as defined by Sloan et al. 2007) of
11.289
m
band is not well understood (see e.g., van Diedenhoven et al. 2004). For
a ``central wavelength'' (the wavelength with half the emitted flux to
either side, as defined by Sloan et al. 2007) of
11.289 ![]() m
and an effective temperature of 8750 K, this star supports
this relationship (note that because of the asymmetry of the profile,
the ``central wavelength'' does not correspond to the peak position).
Given the class A 8.6
m
and an effective temperature of 8750 K, this star supports
this relationship (note that because of the asymmetry of the profile,
the ``central wavelength'' does not correspond to the peak position).
Given the class A 8.6 ![]() m PAH emission, it seems that changes
have affected the present PAH family in this source compared to that of
the ISM and that these changes only seem to influence the 11.2
m PAH emission, it seems that changes
have affected the present PAH family in this source compared to that of
the ISM and that these changes only seem to influence the 11.2 ![]() m
and not the 8.6
m
and not the 8.6 ![]() m
PAH bands. Observations of the CC modes (6.2 and ``7.7''
m
PAH bands. Observations of the CC modes (6.2 and ``7.7'' ![]() m
PAH bands, which are not observable from the ground) and a study of PAH
emission in a larger sample of YSOs is needed to clarify this issue.
m
PAH bands, which are not observable from the ground) and a study of PAH
emission in a larger sample of YSOs is needed to clarify this issue.
No N-band silicate emission is seen for the
northern component, which can be explained if the silicate grains
located in the inner parts of the disk are either (1) too
cold, e.g., the disk lacks a hot optically thin surface, or
(2) too large to emit at 10 ![]() m, as shown by Meeus et al. (2002). Our
spectrum with the prominent PAH features can be explained by a flared
disk model (e.g., Acke & van den Ancker 2004), which is
also clearly recognised in the resolved images by Perrin
et al. (2006),
who showed that the
disk is optically thick in the NIR.
m, as shown by Meeus et al. (2002). Our
spectrum with the prominent PAH features can be explained by a flared
disk model (e.g., Acke & van den Ancker 2004), which is
also clearly recognised in the resolved images by Perrin
et al. (2006),
who showed that the
disk is optically thick in the NIR.
HD 34 700.
A comparison between our TIMMI2 observation and a Spitzer-IRS
observation of HD 34 700 is shown in Fig. 8,
and clearly illustrates the presence of the 6.2, ``7.7'' and
11.2 ![]() m
PAH emission bands. A hint of the 8.6 and 12.7
m
PAH emission bands. A hint of the 8.6 and 12.7 ![]() m PAH bands
is
also present in the Spitzer-IRS observations, while the weaker 12.0,
13.2, and 14.2
m PAH bands
is
also present in the Spitzer-IRS observations, while the weaker 12.0,
13.2, and 14.2 ![]() m
bands (e.g. Hony et al. 2001) and a
possible 15-20
m
bands (e.g. Hony et al. 2001) and a
possible 15-20 ![]() m
PAH plateau/complex (e.g. Van Kerckhoven et al. 2000;
Peeters et al. 2004b) are
not observed in either spectrum.
m
PAH plateau/complex (e.g. Van Kerckhoven et al. 2000;
Peeters et al. 2004b) are
not observed in either spectrum.
A detailed comparison of the PAH band profiles is shown in
Fig. 9.
The PAH bands exhibited by the TTS HD 34 700 are
clearly distinct. In particular, its 6.2 ![]() m band peaks at a similar wavelength as that of
the representative of class B, the Red Rectangle, but also shows excess
emission shortwards of 6.1
m band peaks at a similar wavelength as that of
the representative of class B, the Red Rectangle, but also shows excess
emission shortwards of 6.1 ![]() m and the long-wavelength tail is much weaker. A
similar profile is observed towards the HAeBe star HD
141 569 (Sloan et al. 2005), both
sources showing a very strong 6.0
m and the long-wavelength tail is much weaker. A
similar profile is observed towards the HAeBe star HD
141 569 (Sloan et al. 2005), both
sources showing a very strong 6.0 ![]() m PAH band (6.0/6.2 band ratio of
m PAH band (6.0/6.2 band ratio of ![]() 0.33 and
0.42 for HD 141 569 and HD
34 700, respectively). Its ``7.7''
0.33 and
0.42 for HD 141 569 and HD
34 700, respectively). Its ``7.7'' ![]() m complex
peaks around 8.05
m complex
peaks around 8.05 ![]() m,
redshifted compared to the Red Rectangle but, as noted above, class B
shows a large variety and other evolved stars such as, e.g. IRAS
17 347-3139, peak close to 8
m,
redshifted compared to the Red Rectangle but, as noted above, class B
shows a large variety and other evolved stars such as, e.g. IRAS
17 347-3139, peak close to 8 ![]() m. However,
its profile is very broad, starting at similar wavelengths compared to
that of the Red Rectangle, but extending up to 9
m. However,
its profile is very broad, starting at similar wavelengths compared to
that of the Red Rectangle, but extending up to 9 ![]() m, thus it
is more similar but blue-shifted to the class C profile. The latter
class shows very weak, if any, 8.6
m, thus it
is more similar but blue-shifted to the class C profile. The latter
class shows very weak, if any, 8.6 ![]() m emission, which is also very weak in
HD 34 700. Similar broad but unique PAH profiles are
also seen around the HAeBe stars HD 141 569 and
HD 135 344 (Sloan et al. 2005),
suggesting a smooth transition in profiles between class B and
C. The 11.2
m emission, which is also very weak in
HD 34 700. Similar broad but unique PAH profiles are
also seen around the HAeBe stars HD 141 569 and
HD 135 344 (Sloan et al. 2005),
suggesting a smooth transition in profiles between class B and
C. The 11.2 ![]() m
PAH band in HD 34 700 peaks at a longer wavelength
and also shows excess emission longwards, compared to the profile of
the Red Rectangle. We note that the 11.0
m
PAH band in HD 34 700 peaks at a longer wavelength
and also shows excess emission longwards, compared to the profile of
the Red Rectangle. We note that the 11.0 ![]() m PAH band, usually attributed to ionised PAHs
(Hudgins & Allamandola 1999; Sloan
et al. 1999; Hony
et al. 2001),
is not observed in HD 34 700. The TIMMI2 and
Spitzer-IRS profiles are rather similar with only small differences in
the blue wing of the 11.2
m PAH band, usually attributed to ionised PAHs
(Hudgins & Allamandola 1999; Sloan
et al. 1999; Hony
et al. 2001),
is not observed in HD 34 700. The TIMMI2 and
Spitzer-IRS profiles are rather similar with only small differences in
the blue wing of the 11.2 ![]() m band. The ``central wavelengths'' (the
wavelength with half the emitted flux on either side, as defined by
Sloan et al. 2007)
are 8.06, 11.35, and 11.37
m band. The ``central wavelengths'' (the
wavelength with half the emitted flux on either side, as defined by
Sloan et al. 2007)
are 8.06, 11.35, and 11.37 ![]() m for the 7.7
m for the 7.7 ![]() m
complex, the 11.2
m
complex, the 11.2 ![]() m
band in the IRS-SH observations, and the 11.2
m
band in the IRS-SH observations, and the 11.2 ![]() m
band in the TIMMI2 observations, respectively. While this is consistent
with the results of Sloan et
al. (2007)
for the 11.2
m
band in the TIMMI2 observations, respectively. While this is consistent
with the results of Sloan et
al. (2007)
for the 11.2 ![]() m
band, the ``central wavelength'' of the 7.7
m
band, the ``central wavelength'' of the 7.7 ![]() m
complex is considerably shorter for an effective temperature of
6000 K.
m
complex is considerably shorter for an effective temperature of
6000 K.
| Figure 8: TIMMI2 (grey) and Spitzer-IRS (thin black and thick black) observations of HD 34 700 are shown. PAH emission bands are clearly present on top of the dust continuum. Atmospheric variations may have influenced the spectrophotometric accuracy of the TIMMI2 data. |
|
| Open with DEXTER | |
![\begin{figure}
\par\includegraphics[scale=0.6, angle=0]{06262fg9.ps}
\end{figure}](/articles/aa/full_html/2009/43/aa6262-06/img86.png)
|
Figure 9:
A comparison of the 6.2, ``7.7'', 8.6 and 11.2 |
| Open with DEXTER | |
Summarising, the PAH band profiles of the T Tauri star HD 34 700 are clearly unique and indicate that PAH processing has occurred in this source. This is similar to PAH observations towards isolated HAeBe stars and a few other T Tauri stars and suggests that similar PAH processing occurs in protoplanetary disks around low-mass and intermediate-mass stars.
As for PDS 144 N, the absence of silicate emission in HD
34 700 can be explained if the silicate grains located in
the inner parts of the disk are either too cold or too large to emit at
10 ![]() m.
The shallow sub-mm slope of the SED in Fig. 2
suggests grain growth for those particles located in the outer disk and
emitting at (sub-)mm wavelengths, but this does not necessarily imply
the same evolution in the
more inward disk regions. Although a far lower IR excess is seen in
this SED, the prominent PAH emission suggests that the disk is still
flared to some extent, and not self-shadowed. Alternatively,
and taking into account that this system is a spectroscopic binary, the
lack of warm dust could also be explained by an inner hole in a
circumbinary disk, while the PAHs may be located further outwards and
still emit at 10
m.
The shallow sub-mm slope of the SED in Fig. 2
suggests grain growth for those particles located in the outer disk and
emitting at (sub-)mm wavelengths, but this does not necessarily imply
the same evolution in the
more inward disk regions. Although a far lower IR excess is seen in
this SED, the prominent PAH emission suggests that the disk is still
flared to some extent, and not self-shadowed. Alternatively,
and taking into account that this system is a spectroscopic binary, the
lack of warm dust could also be explained by an inner hole in a
circumbinary disk, while the PAHs may be located further outwards and
still emit at 10 ![]() m.
m.
4 Relations between stellar, disk, and silicate properties
We discuss the silicate shapes and study the silicate properties as a
function of: (1) stellar luminosity, between ![]() 0.5 and
0.5 and ![]() 500
500 ![]() ;
(2) binarity,
with separations from approximately 0.1 to 5000 AU; and
(3) infrared SED slope. To obtain more meaningful relations,
we also consider the targets presented in Papers I
and II. Apart from the three debris
disks HD 113 766, HD 123 356, and
HD 172 555, all other targets are PMS objects. We
distinguish both disk types in the following discussion, when required.
;
(2) binarity,
with separations from approximately 0.1 to 5000 AU; and
(3) infrared SED slope. To obtain more meaningful relations,
we also consider the targets presented in Papers I
and II. Apart from the three debris
disks HD 113 766, HD 123 356, and
HD 172 555, all other targets are PMS objects. We
distinguish both disk types in the following discussion, when required.
4.1 Silicate shape as function of peak strength
The silicate mass fractions (Table 3) show no
clear dependence on stellar parameters. As a function of age, we
observe a decrease in amorphous silicates and an increase in
crystalline forsterite and enstatite, in agreement with expectations,
but no trend of grain
growth with disk lifetime. To derive more robust conclusions, we use
spectral indices because they are more robust and model independent.
The silicate shape, i.e., the ratio of the flux at 11.3 to that at
9.8 ![]() m
in the continuum normalised spectra, constitutes a good probe to study
trends and correlations, and can be seen as a direct indicator of the
grain size (Bouwman et al. 2001; van
Boekel et al. 2003).
m
in the continuum normalised spectra, constitutes a good probe to study
trends and correlations, and can be seen as a direct indicator of the
grain size (Bouwman et al. 2001; van
Boekel et al. 2003).
The silicate shape as a function of the peak strength is shown in
Fig. 10.
To compare our results with previous studies, we follow the same
definition of the silicate peak strength and shape as given in
Sect. 4.2 of van Boekel et al. (2005). In a
weighted linear fit with relation y
= a + bx, where x
is the feature strength and y the flux ratio,
values of b between
![]() have been reported (van Boekel et al. 2003;
Przygodda et al. 2003;
Kessler-Silacci et al. 2007). We
cannot present a mathematical relation for our sample, because it lacks
sources of very pristine dust (which would populate the middle bottom
in Fig. 10).
To compare with a larger sample, we added data from Sicilia-Aguilar
et al. (2007). The
Vega-type HD 113 766 (label number ``3'')
has an isolated position in our plot, because of its second generation
dust and its double peak in the spectrum. Besides this object, our
sample of PMS disks agrees qualitatively well with the correlations
found in the cited works: a decrease in the peak strength correlates
with an increase in the dust processing (i.e., with a higher 11.3/9.8
ratio).
have been reported (van Boekel et al. 2003;
Przygodda et al. 2003;
Kessler-Silacci et al. 2007). We
cannot present a mathematical relation for our sample, because it lacks
sources of very pristine dust (which would populate the middle bottom
in Fig. 10).
To compare with a larger sample, we added data from Sicilia-Aguilar
et al. (2007). The
Vega-type HD 113 766 (label number ``3'')
has an isolated position in our plot, because of its second generation
dust and its double peak in the spectrum. Besides this object, our
sample of PMS disks agrees qualitatively well with the correlations
found in the cited works: a decrease in the peak strength correlates
with an increase in the dust processing (i.e., with a higher 11.3/9.8
ratio).
4.2 Grain processing as a function of stellar luminosity
![\begin{figure}
\par\includegraphics[scale=0.49, angle=0]{06262fg10.ps}
\end{figure}](/articles/aa/full_html/2009/43/aa6262-06/img89.png)
|
Figure 10: Silicate shape (the 11.3/9.8 ratio) as a function of peak strength. While HD 113 766 (data point ``3'') is distinctive because of its secondary generation dust, and sources of very pristine dust are missing in our sample, the data follow the same trend as found in previous studies. The target number labels are explained in Table 4. Typical error bars are given in the top right corner. For comparison, data from Sicilia-Aguilar et al. (2007) is included (small diamonds). |
| Open with DEXTER | |
No correlation of the crystalline mass fractions (Table 3) with
either stellar luminosity or derived grain size is found in our sample.
Kessler-Silacci et al. (2007)
identified a correlation of the silicate shape with stellar luminosity,
in the form of an observed larger grain size (as inferred by the
11.3/9.8 ratio) with lower luminosity. This trend can be understood by
considering that the 10 ![]() m silicate emission region lies further inward
for stars with lower luminosity, assuming that the grain size
distribution with radius is the same in all disks, and grain growth is
most efficient in the inner, denser regions. Our sample is much smaller
than that presented by Kessler-Silacci et al. (2007), and
we cannot give a mathematical relation because of the scatter in our
data points, but Fig. 11
suggests a similar trend with luminosity.
m silicate emission region lies further inward
for stars with lower luminosity, assuming that the grain size
distribution with radius is the same in all disks, and grain growth is
most efficient in the inner, denser regions. Our sample is much smaller
than that presented by Kessler-Silacci et al. (2007), and
we cannot give a mathematical relation because of the scatter in our
data points, but Fig. 11
suggests a similar trend with luminosity.
Table 4: Labels and luminosities (with errors when they were given in the literature) used in Figs. 10-12.
4.3 Influence of companions
We see no correlation of the degree of dust processing with stellar binarity in our sample, i.e., whether the time spans of dust processing and disk lifetime in binary systems would differ from those of isolated stars of the same age. Binaries or multiple systems represent 75% of our targets. These include systems without N-band silicate emission (e.g., HD 3003, HD 80 951, HD 155 555, HD 181 296), objects with mainly unprocessed dust (FU Ori) or large dust grains (KK Oph, HD 319 139), and sources with all types of silicates present (especially HD 123 356).
For most binaries in our sample, the separation (cf. Table 1)
is around 200 AU (apart from PDS 144 with ![]() 5000 AU),
while dust in very different processing stages is found. In case of the
three
spectroscopic binary (SB) systems, silicate dust is either seen in
small
amounts or is absent, which can be explained by the removal of dust
inside the circumbinary disk. Pascucci et al. (2008)
demonstrated
that companions at
separations of tens of AU have no impact on the dust evolution, which
would be interesting to study for a carefully defined target sample
with closer companions.
5000 AU),
while dust in very different processing stages is found. In case of the
three
spectroscopic binary (SB) systems, silicate dust is either seen in
small
amounts or is absent, which can be explained by the removal of dust
inside the circumbinary disk. Pascucci et al. (2008)
demonstrated
that companions at
separations of tens of AU have no impact on the dust evolution, which
would be interesting to study for a carefully defined target sample
with closer companions.
![\begin{figure}
\par\includegraphics[scale=0.49, angle=0]{06262fg11.ps}
\end{figure}](/articles/aa/full_html/2009/43/aa6262-06/img97.png)
|
Figure 11: Silicate shape as a function of stellar luminosity. Objects with uncertain luminosity are excluded in this plot. Typical error bars are shown in the top right corner. The luminosities are listed in Table 4. |
| Open with DEXTER | |
4.4 Silicate strength as a function of SED slope
With ongoing grain growth and subsequent settling, an initially flared
PMS disk is understood to evolve into a flat disk (Dullemond &
Dominik 2004),
accompanied by a change in the slope of the SED, i.e., the
initially positive 2-25 ![]() m slope will decrease. During the evolution into
a debris disk, the IR emission from the inner disk decreases when the
disk is cleared from the inside out. This results
in a steeper negative SED slope with progressive evolution into a
debris
disk. When the dust has nearly completely disappeared, the slope will
approach that of a blackbody with the stellar temperature. A dependence
of silicate emission on inner disk evolution would be recognisable as a
correlation between silicate strength and SED slope. There is a
tendency for more flared (and therefore redder) disks to have stronger
silicate features. We used an average extinction curve (Savage
& Mathis 1979) for R
= 3.1 and the values of Av
given in
Table 1
to calculate the dereddening of the SEDs. The slope between
2-25
m slope will decrease. During the evolution into
a debris disk, the IR emission from the inner disk decreases when the
disk is cleared from the inside out. This results
in a steeper negative SED slope with progressive evolution into a
debris
disk. When the dust has nearly completely disappeared, the slope will
approach that of a blackbody with the stellar temperature. A dependence
of silicate emission on inner disk evolution would be recognisable as a
correlation between silicate strength and SED slope. There is a
tendency for more flared (and therefore redder) disks to have stronger
silicate features. We used an average extinction curve (Savage
& Mathis 1979) for R
= 3.1 and the values of Av
given in
Table 1
to calculate the dereddening of the SEDs. The slope between
2-25 ![]() m
was calculated as
m
was calculated as
|
(2) |
where F is the flux in Jansky at the indicated wavelengths. Sicilia-Aguilar et al. (2007) noticed a very weak to absent correlation between silicate strength and SED slope, with which our data agree (see Fig. 12). Vega-type and pre-main sequence stars can be clearly distinguished by their different slopes, but a convincing dependence on the silicate strength is not seen. In this plot, CD-43 344 has an unusual position for a PMS source, but as noted earlier, its classification is not certain.
![\begin{figure}
\par\includegraphics[scale=0.49, angle=0]{06262fg12.ps}
\end{figure}](/articles/aa/full_html/2009/43/aa6262-06/img99.png)
|
Figure 12:
Silicate peak strength versus infrared 2-25 |
| Open with DEXTER | |
5 Discussion
We have presented new N-band spectra of 15 PMS and
Vega-type stars. Besides FU Ori, these spectra were either
previously unpublished or not yet available in a high quality to permit
the analysis of the PAH bands or a dust decomposition of the silicate
emission. HD 155 555 AB is the only
T Tauri star in our sample without an IR excess, while four of
the five Vega-like stars only show photospheric emission at 10 ![]() m, with
excess emission only at longer wavelengths. For the remaining targets,
we analysedtheir silicate and PAH features:
m, with
excess emission only at longer wavelengths. For the remaining targets,
we analysedtheir silicate and PAH features:
- Silicate dust. Unprocessed dust
dominates the circumstellar matter around FU Ori, HD
123 356, HD 143 006 and
CD-43 344. HD 123 356 is considered to be
a Vega-type object, and we show for the first time that the dust
emission originates from its secondary. No firm age estimation is
available and we do not exclude the possibility that this system may be
younger than currently believed. The N-band profile
of HD 123 356 B is rather
unusual, dominated by small amorphous silicates with all types of
processed dust being present. High-resolution NIR and MIR studies are
required to learn more about this system. Similarly, the classification
of CD-43 344 as a T Tauri star remains ambiguous. No
distance, luminosity class, or age estimation is available. Its dust
properties could also be explained by it being an evolved Mira-type
star. Optical spectroscopy is required to determine the stellar class.
Large amorphous silicates are the main dust component towards HD 190 073, HD 319 139, KK Oph, and PDS 144 S. No source in our sample shows the presence of highly processed dust, i.e., a spectrum dominated by crystalline silicates, as we found for some targets presented in Paper I and II (e.g., the Herbig Ae star HD 72 106 B or the Vega-type HD 113 766 A). In agreement with previous studies, we found no correlation of dust processing with stellar age in our samples. Although HD 181 296 and HD 172 555 have a similar age and spectral type, the first source has no excess emission in the N-band, while the last, presented in Paper II, shows dust in an early stage of processing. This could be explained by a cleared inner disk region of different sizes, where the disk region sensitive to N-band observations (<10 AU) has already been cleared in HD 181 296.
We see no correlation between the dust evolution and binarity in our sample, i.e., whether the dust processing in binary systems is retarded or accelerated in relation to isolated stars.
- PAH emission.
PAH bands are observed towards the HAeBe star PDS 144 N and
the TTS HD 34 700. Their presence is often observed
in HAeBe stars and commonly explained with the excitation of PAH
molecules by UV photons. However, Li & Draine (2002)
demonstrated that PAH molecules around cool stars can also be excited.
Laboratory experiments by Mattioda et al. (2005)
detected electronic absorption bands of PAH ions up to the NIR. Thus,
PAH emission can also be found in UV-poor environments. In
5-35 m
spectra of a sample of 38 TTS, Geers et al. (2006) found
PAHs for 3 targets (with possible further tentative detections). In
their sample, T Cha of spectral type G8 represents the lowest
mass source with PAH emission. Furlan et al. (2006) found 2
cool stars with PAH emission in 5-36 m spectra of 111 targets in the Taurus-Auriga
star-forming region. They show UX Tau A as the coolest TTS
with PAH until now, of spectral type K5, but the PAH feature in this
source is rather marginal. The latest-type PAH-emitting TTS found to
date is IRS 48, studied by
Geers et al. (2007a), who
emphasise that its apparent spectral type (M0) has varied significantly
in the past decade, possibly because of a FUOR-type accretion event.
The PAH profiles of HD 34 700 show that PAH processing occurs in a similar way to PAHs observed towards isolated HAeBe stars, suggesting that similar PAH processing exists in the protoplanetary disks around low-mass and intermediate-mass stars. The case is less clear for the HAeBe star PDS 144 N. Although the 8.6
m PAH band
profile is identical to that in the ISM, the 11.2 m PAH band
is clearly distinct.
PDS 144 constitutes a very interesting system, which has prominent PAH bands towards the Northern source, while the Southern component is dominated by silicate emission. Although it is commonly believed that both objects form a binary, this remains to be proven. Perrin et al. (private communication) obtained optical spectra to determine more accurate spectral types and an improved distance estimate, and attempt to provide a more robust answer to this question.
6 Conclusions
We have presented new N-band spectroscopy of
15 PMS and Vega-type stars, and modelled the 10 ![]() m emission
features, to characterise the circumstellar dust in each
object of our sample. We also discovered previously unknown
circumstellar disks. Our main conclusions are:
m emission
features, to characterise the circumstellar dust in each
object of our sample. We also discovered previously unknown
circumstellar disks. Our main conclusions are:
-
- 1.
- We characterised the PAH emission in PDS 144 N
and HD 34 700. PDS 144 N exhibits mixed
PAH class characteristics, while HD 34 700 clearly
belongs to class B. The latter points towards processing of
PAHs, suggesting a similar PAH evolution in the disks of Herbig and
T Tauri stars.
- 2.
- The emission spectrum of FU Ori resembles that of
BBW 76 in Paper I, while the FUORs V346
Nor, V883 Ori and Z CMa of Paper I
show silicate absorption features. This could be an effect of the disk
orientation (pole-on vs. face-on) or represent the two FUOR categories
defined by Quanz et al. (2007).
- 3.
- We showed the first N-band spectrum of
CD-43 344, a star that hosts only pristine silicates and had
been poorly studied. However,
its luminosity and stellar class remain uncertain.
- 4.
- Silicate dust with mixed properties (sizes and
crystallinity) is found towards HD 123 356 B, while
high-resolution imaging is required to
achieve a deeper understanding of this particular system.
- 5.
- Within our sensitivities, no N-band
silicate emission is seen for the T Tauri star
HD 155 555 AB and the Vega-type objects
 Corvi, HD 3003, HD 80 951, and
HD 181 296.
Corvi, HD 3003, HD 80 951, and
HD 181 296.
- 6.
- We failed to detect HD 158 153 and
SAO 185 668, despite their alleged high IRAS flux
and the sufficient integration times of their
data. We attribute this to other sources being present in the IRAS
beam, causing erroneous fluxes for our target. There are many other
stars for which an IRAS flux had been measured in the 1990s, but these
measurements were later revised, when higher spatial resolution became
possible in the IR.
- 7.
- We find no dependence of dust processing on either age or
stellar binarity, for a companion separation of typically
>100 AU.
G.M. acknowledges financial support by the Deutsche Forschungsgemeinschaft (DFG) under grants ME2061/3-1 and /3-2. We would like to thank Alexis Brandeker for the analysis and discussion of the photometric VISIR data of
Appendix A: Comments on individual sources
A.1 FU Ori stars
FU Orionis objects (FUORs) show a variability characterised by dramatic outbursts in optical light, followed by a fading phase that can last decades. The origin of this phenomenon is not clear but it is often associated with enhanced accretion in low-mass pre-main sequence stars (Hartmann & Kenyon 1996).
FU Ori
is the prototype of the FU Orionis phenomenon. While the SIMBAD database lists a spectral type of G3Iavar, Kenyon et al. (2000) changed it to G0II. In contrast to Hanner et al. (1998), who measured an increasing MIR flux shortward of 10Compared to the four FUOR spectra shown in Paper I, we see that FU Ori agrees well with the spectral profile of BBW 76, while the other 3 FUORs V346 Nor, V883 Ori, and Z CMa exhibit very different profiles because they are in absorption. The appearance of FUOR MIR spectra could be a geometrical effect: pole-on (emission feature) versus edge-on (absorption feature) view of the disk. However, given the large number of FUORs with silicate absorption features, this difference cannot be explained by disk orientation alone. Therefore, Quanz et al. (2007) defined two categories of FUORs: (1) objects for which the silicate feature is in absorption probably remain embedded in a circumstellar envelope; and (2) objects where the silicate band is in emission, which are understood to have largely shed their envelope, and the feature arises in the surface layer of their accretion disks.
A.2 Herbig Ae/Be objects
HD 190073 has been discussed in the literature for more than 70 years and had various classifications. Being previously considered a post-main sequence giant, van den Ancker et al. (1998) described HD 190 073 as a Herbig Ae/Be star, which is now generally accepted. Considering its large distance, for which only a lower limit is known due to an imprecise Hipparcos parallax (van den Ancker et al. 1998), this unusual object must be far more luminous than other Herbig stars of similar spectral type. The optical spectrum is also quite peculiar (Pogodin et al. 2005).
The SED shows an IR excess that begins in the NIR and rises to the far-IR. The decomposition of the N-band silicate feature shows a strong dominance of large amorphous silicates. Silica and enstatite are present in much smaller amounts, while no forsterite is found.
KK Oph
is a PMS binary with a 1.6The N-band spectrum discussed here was
already shown in Leinert et al. (2004), but
the silicate feature had not yet been analysed
in terms of dust composition. In the TIMMI2 images, we see one isolated
source, most likely just the HAe star itself, but we note that the MIR
sensitivities were not good during that night. The ESO/ST-ECF Science
Archive contains another TIMMI2 spectrum of KK Oph, which is
described in Geers et al. (2005). These
two spectra differ by about 10% in the 8 ![]() m flux, while being in agreement longward of
10
m flux, while being in agreement longward of
10 ![]() m.
Both spectra, as well as the standard stars, were observed at an
airmass close to 1.0. The distance in time between object and closest
standard star was approximately one hour in both cases. We selected the
first mentioned spectrum, since it matches more closely the
TIMMI2 N1 photometry from the Science Archive.
m.
Both spectra, as well as the standard stars, were observed at an
airmass close to 1.0. The distance in time between object and closest
standard star was approximately one hour in both cases. We selected the
first mentioned spectrum, since it matches more closely the
TIMMI2 N1 photometry from the Science Archive.
The decomposition into dust components illustrates its diverse composition. Large amorphous silicates dominate, but silica and forsterite are also found in significant amounts, while enstatite is not detected.
PDS 144 N.
During the Pico dos Dias Survey, Torres et al. (1995) discovered the binarity of this Herbig Ae/Be star with a 5PDS 144 S.
Resolved circumstellar emission from the more luminous component
PDS 144 S was not detected in our and previous N-band
images, but had been found by Perrin et al. (private
communication) at 18 ![]() m
(0.57'' diameter). In the N-band spectrum, we see
silicate features of mainly large amorphous silicate grains, in
addition to small amorphous grains and silica. Forsterite and enstatite
are absent, which is indicative of unprocessed dust, while small
amounts of PAHs might be present as well. We note that our spectrum was
taken during a night with strong variations in the MIR transparency,
but great care was taken in its calibration by applying a close
standard star at similar airmass observed immediately after the science
exposure.
m
(0.57'' diameter). In the N-band spectrum, we see
silicate features of mainly large amorphous silicate grains, in
addition to small amorphous grains and silica. Forsterite and enstatite
are absent, which is indicative of unprocessed dust, while small
amounts of PAHs might be present as well. We note that our spectrum was
taken during a night with strong variations in the MIR transparency,
but great care was taken in its calibration by applying a close
standard star at similar airmass observed immediately after the science
exposure.
Both components of PDS 144 have a similar spectral type and, assuming that they formed together, a similar age, but show different emission features, PAH compared to silicates. The presence/absence of PAH bands could be explained by the disk geometry, since we would observe far lower amounts of PAH emission from a flat, self-shadowed disk, which prevents the UV photons from reaching the PAH molecules (e.g. Dullemond & Dominik 2004). On the other hand, we do not want to exclude the trivial explanation that the amounts of PAH in both disks could be different, despite the similarity of both sources.
A.3 T Tauri targets
HD 34 700 constitutes a quadruple
T Tauri system. For the inner, short-period (
![]() days) spectroscopic
binary, Torres (2004) had
performed an orbital solution and showed that both stars are of similar
mass and luminosity. Sterzik et al. (2005) found
two more, faint, late-type components of PMS nature. Despite several
indicators of stellar youth (IR excess, X-ray emission, H
days) spectroscopic
binary, Torres (2004) had
performed an orbital solution and showed that both stars are of similar
mass and luminosity. Sterzik et al. (2005) found
two more, faint, late-type components of PMS nature. Despite several
indicators of stellar youth (IR excess, X-ray emission, H![]() emission), the precise age has not yet been established, since the
Hipparcos parallax is very uncertain (0.86
emission), the precise age has not yet been established, since the
Hipparcos parallax is very uncertain (0.86 ![]() 1.84 mas).
1.84 mas).
Sub-mm observations of HD 34 700 were reported by,
e.g., Sylvester et al. (2001) and
Sheret et al. (2004).
An N-band spectrum was shown in Sylvester &
Mannings (2000),
but its low SNR did not permit a detailed study. Our TIMMI2 spectrum is
also of higher quality than the ISO-SWS and ISO-PHOT data of Acke
& van den Ancker (2004).
As can be seen from the Kurucz model, excess emission starts around
5 ![]() m
and becomes dominant at MIR to mm wavelengths. A PAH band feature at
3.3
m
and becomes dominant at MIR to mm wavelengths. A PAH band feature at
3.3 ![]() m
was shown by Smith et al. (2004).
m
was shown by Smith et al. (2004).
HD 143 006.
As for several other PMS objects, this star was also previously erroneously classified as a pre-planetary nebula, but now is commonly considered to be a TTS (see, e.g., Mamajek et al. 2004). In contrast to the assumption of a disk-like distribution of the circumstellar dust, Dent et al. (2005) found single-peaked, narrow CO lines, which are more consistent with emission from an envelope rather than a disk.
Our SED shows a large NIR excess attributable to hot dust emission. Such a large NIR excess is often associated with polarised emission from the circumstellar matter (Yudin 2000), but Hales et al. (2006) did not find any polarised emission and concluded that the disk may be too small to be resolved in their UKIRT observations.
The decomposition of the N-band spectrum shows
evidence of dust at a very early stage of processing. Small amorphous
silicate grains dominate the N-band feature, and
there are smaller amounts of silica, enstatite, and forsterite.
Moderate PAH emission is seen on top of the silicate feature, causing
small peaks in the spectrum between 8-9 ![]() m and at 11.2
m and at 11.2 ![]() m.
m.
HD 155 555
(alias V824 Arae) is a member of theHD 319 139.
The spectroscopic binary TTS and member of the ![]() Pic moving group
(Torres et al. 2006)
HD 319 139 (alias V4046 Sgr) has been known to be an
emission-line star since the year 1938. For a summary of its ``early
history'' see, e.g., Byrne (1986).
Hutchinson et al. (1990)
performed photometry from the UV to the mid-IR Q-band.
From the absence of a NIR excess, Jensen & Mathieu (1997) concluded
that there is an inner hole in its circumbinary disk. Quast
et al. (2000) refined
the orbital period to 2.421 days and determined the spectral
types of both components to K5Ve and K7Ve. All the
afore mentioned authors provided distance estimates in the range
42-83 pc. In this work, we assume 83 pc (Quast
et al. 2000),
since this is the most recent estimate.
Pic moving group
(Torres et al. 2006)
HD 319 139 (alias V4046 Sgr) has been known to be an
emission-line star since the year 1938. For a summary of its ``early
history'' see, e.g., Byrne (1986).
Hutchinson et al. (1990)
performed photometry from the UV to the mid-IR Q-band.
From the absence of a NIR excess, Jensen & Mathieu (1997) concluded
that there is an inner hole in its circumbinary disk. Quast
et al. (2000) refined
the orbital period to 2.421 days and determined the spectral
types of both components to K5Ve and K7Ve. All the
afore mentioned authors provided distance estimates in the range
42-83 pc. In this work, we assume 83 pc (Quast
et al. 2000),
since this is the most recent estimate.
Our N11.9 flux (central wavelength 11.6 ![]() m) of HD 319 139 is about 20%
below the corresponding IRAS flux, but it matches the 11.5
m) of HD 319 139 is about 20%
below the corresponding IRAS flux, but it matches the 11.5 ![]() m flux
determined by Hutchinson et al. (1990) very
well. We see a rising dust continuum, on top of which large amorphous
silicates
dominate the emission feature, in addition to small amorphous grains
and some forsterite and silica. The N-band spectrum
published by Honda et al. (2006), who
observed a sample of 30 low-mass stars with COMICS at the Subaru
Telescope, agrees with our data.
m flux
determined by Hutchinson et al. (1990) very
well. We see a rising dust continuum, on top of which large amorphous
silicates
dominate the emission feature, in addition to small amorphous grains
and some forsterite and silica. The N-band spectrum
published by Honda et al. (2006), who
observed a sample of 30 low-mass stars with COMICS at the Subaru
Telescope, agrees with our data.
CD-43 344.
Mannings & Barlow (1998) proposed that the F6V star HD 7151 is a debris disk candidate, by cross-correlating the ``Michigan Catalog of Two-dimensional Spectral Types for the HD Stars'' with the ``IRAS Faint Source Survey Catalog'', and associated IRAS F01089-4257 with this star. Sylvester & Mannings (2000), however, showed that the more closely located M2 star CPD-43 142, primarily known as CD-43 344, could explain the emission of this IRAS FSC source more precisely. Despite a significant MIR excess, this object was not targeted by previous studies. Here we consider this target to be a TTS, based on its spectral type and pristine status of dust processing, but this classification is not a unique solution since, e.g., an evolved Mira-type star could show the same dust emission. Currently the distance to CD-43 344 and its luminosity class are undetermined.
The 2MASS fluxes in the SED might be influenced by other sources, since the attributed NIR excess seems extraordinarily high. In the MIR, however, the target appears isolated. The decomposition of the silicate emission feature is dominated by small amorphous silicates with a less prominent contribution of larger grains. We did not find evidence of crystalline dust.
A.4 Vega-type stars
HD 3003 is a proposed member of the
Tucana/Horologium Association (Zuckerman & Song 2004). In
the ``Catalog of Components of Double & Multiple stars''
(Dommanget & Nys 2002), it is
listed as a binary system with 0.1
![]() separation and almost equal visual brightness of the components. Since
this measurement is listed as being obtained in 1925, we interpret this
information with care. In our TIMMI2 data (with
separation and almost equal visual brightness of the components. Since
this measurement is listed as being obtained in 1925, we interpret this
information with care. In our TIMMI2 data (with ![]() 0.2
0.2
![]() pixel resolution), only one isolated point-like emission source is
seen. Song et al. (2001) estimated
an age of 50 Myr with an upper limit of 247 Myr.
The SED for this target shows no IR excess emission up to the N-band,
with little excess seen at 25
pixel resolution), only one isolated point-like emission source is
seen. Song et al. (2001) estimated
an age of 50 Myr with an upper limit of 247 Myr.
The SED for this target shows no IR excess emission up to the N-band,
with little excess seen at 25 ![]() m.
m.
HD 80 951
constitutes a quadruple system (Dommanget & Nys 2002). Oudmaijer et al. (1992), as well as Mannings & Barlow (1998) characterised it as a system with excess emission in the IRAS passbands, but no further indication of circumstellar matter has been described in the literature. Our TIMMI2 N-band spectrum is consistent with the presence of photospheric emission. From the SED, we see an IR excess starting around 25HD 109 085.
Stencel & Backman (1991) and
later Mannings & Barlow (1998)
characterised HD 109 085 (alias ![]() Corvi)
as a Vega-type object. At 850
Corvi)
as a Vega-type object. At 850 ![]() m, a disk is found and resolved with a size of
m, a disk is found and resolved with a size of ![]() 100 AU
(Wyatt et al. 2005).
As shown by the SED of this target, excess emission is insignificant at
10
100 AU
(Wyatt et al. 2005).
As shown by the SED of this target, excess emission is insignificant at
10 ![]() m
and starts longward of
m
and starts longward of ![]() 17
17 ![]() m, extending
into the sub-mm regime. Our TIMMI2 N-band spectrum
appears stellar. In Spitzer IRS data, Chen et al. (2006) detected a
faint silicate feature around 10
m, extending
into the sub-mm regime. Our TIMMI2 N-band spectrum
appears stellar. In Spitzer IRS data, Chen et al. (2006) detected a
faint silicate feature around 10 ![]() m.
m.
HD 123 356.
There is not much information about HD 123 356. In
``The Washington Visual Double Star Catalog'' (Worley &
Douglass 1997), it is
listed as having a companion 2.2 mag fainter in V-band,
separated by 2.5
![]() at a position angle of 126
at a position angle of 126
![]() .
Mannings & Barlow (1998)
identified HD 123 356 as a candidate main-sequence
debris disk object, by cross-correlating the ``Michigan Catalog of
Two-dimensional Spectral Types for the HD Stars'' with the ``IRAS Faint
Source Survey Catalog''. Sylvester et al. (2000)
presented a moderate-SNR N-band spectrum, which
appeared quite different from ours. The authors, however, clarified
that their CGS3 beam of 5.5
.
Mannings & Barlow (1998)
identified HD 123 356 as a candidate main-sequence
debris disk object, by cross-correlating the ``Michigan Catalog of
Two-dimensional Spectral Types for the HD Stars'' with the ``IRAS Faint
Source Survey Catalog''. Sylvester et al. (2000)
presented a moderate-SNR N-band spectrum, which
appeared quite different from ours. The authors, however, clarified
that their CGS3 beam of 5.5
![]() was pointing at the position of the primary (the secondary being at the
edge of the beam) and that not all of
the IR signal would have been detected if a substantial part of the
emission originates from the secondary. No significant CO emission
(Dent et al. 2005)
and only a very small amount of NIR polarimetric emission (Hales
et al. 2006)
was found.
was pointing at the position of the primary (the secondary being at the
edge of the beam) and that not all of
the IR signal would have been detected if a substantial part of the
emission originates from the secondary. No significant CO emission
(Dent et al. 2005)
and only a very small amount of NIR polarimetric emission (Hales
et al. 2006)
was found.
Compared to the other emission feature sources, the TIMMI2 N-band
spectrum of HD 123 356 appears atypical, since the
flux remains rather constant between 8 and 11 ![]() m. However,
our N-band spectra were acquired in three separate
observing runs (March 2003, February 2005 and January 2006), always
exhibiting the same spectral shape. From the modelling of the
circumstellar emission, the dust seems to be at a rather early
processing stage (or mainly unprocessed). As shown in Fig. 5,
the emission is dominated by small amorphous silicates, in addition to
small amounts of forsterite, silica, enstatite, and PAH.
m. However,
our N-band spectra were acquired in three separate
observing runs (March 2003, February 2005 and January 2006), always
exhibiting the same spectral shape. From the modelling of the
circumstellar emission, the dust seems to be at a rather early
processing stage (or mainly unprocessed). As shown in Fig. 5,
the emission is dominated by small amorphous silicates, in addition to
small amounts of forsterite, silica, enstatite, and PAH.
While the currently available data of HD 123 356 are consistent with it being a Vega-type star and circumstellar dust in a retarded stage of processing, the true nature of this system can only be revealed with high-resolution NIR- and MIR-observations.
HD 181 296.
Mannings & Barlow (1998)
identified HD 181 296
(alias HR 7329, or ![]() Tel)
as a Vega-like
star. A brown dwarf companion at a projected distance of
200 AU was found by Lowrance et al. (2000). This
target is also part of the
Tel)
as a Vega-like
star. A brown dwarf companion at a projected distance of
200 AU was found by Lowrance et al. (2000). This
target is also part of the ![]() Pic
moving group (Torres et al. 2006).
Pic
moving group (Torres et al. 2006).
From our TIMMI2 N1 photometry at central wavelength 8.6 ![]() m, the
reported 12
m, the
reported 12 ![]() m
IRAS flux appears overestimated, while our photometry and N-band
spectral profile are in excellent agreement with the fluxes that
Mamajek et al. (2004)
reported for 10.3
m
IRAS flux appears overestimated, while our photometry and N-band
spectral profile are in excellent agreement with the fluxes that
Mamajek et al. (2004)
reported for 10.3 ![]() m
and 11.6
m
and 11.6 ![]() m.
m.
A.5 Non-detections
Two objects for which a significant MIR flux was reported by IRAS remain undetected in our observations, although the stated fluxes should have been easily observable. This was probably caused by other sources being inside the large IRAS beam. We report these non-detections to clarify the situation for these targets in the literature.
HD 158 153.
In the SIMBAD database, an IRAS flux of 3.83 Jy at 12 ![]() m is given.
This source was also mentioned in the work by Oudmaijer et al.
(1992).
With a 10
m is given.
This source was also mentioned in the work by Oudmaijer et al.
(1992).
With a 10![]() sensitivity of 25 mJy/h, we did not detect a source at this
position within 3 min of integration time, suggesting a flux
limit <110 mJy. Several IRAS sources are located
nearby, of which the 11
sensitivity of 25 mJy/h, we did not detect a source at this
position within 3 min of integration time, suggesting a flux
limit <110 mJy. Several IRAS sources are located
nearby, of which the 11
![]() close object IRAS 17 251-2320 seems to emit the
highest flux. We find an increasing dust continuum for that source, but
do not present this in detail here, since its nature (stellar or not)
remains unclear.
close object IRAS 17 251-2320 seems to emit the
highest flux. We find an increasing dust continuum for that source, but
do not present this in detail here, since its nature (stellar or not)
remains unclear.
SAO 185 668
is listed in SIMBAD with an IRAS flux of 1.61 Jy at 12
References
- Acke, B., & van den Ancker, M. E. 2004, A&A, 426, 151 [EDP Sciences] [CrossRef] [NASA ADS]
- Acke, B., van den Ancker, M. E., & Dullemond, C. P. 2005, A&A, 436, 209 [EDP Sciences] [CrossRef] [NASA ADS]
- Beichman, C. A., Bryden, G., Gautier, T. N., et al. 2005, ApJ, 626, 1061 [CrossRef] [NASA ADS]
- Boersma, C., Bouwman, J., Lahuis, F., et al. 2008, A&A, 484, 241 [EDP Sciences] [CrossRef] [NASA ADS]
- Bouwman, J., Meeus, G., de Koter, A., et al. 2001, A&A, 375, 950 [EDP Sciences] [CrossRef] [NASA ADS]
- Bouwman, J., Henning, Th., Hillenbrand, L. A., et al. 2008, ApJ, 683, 479 [CrossRef] [NASA ADS]
- Byrne, P. B. 1986, IrAJ, 17, 294 [NASA ADS]
- Carmona, A., van den Ancker, M. E., & Henning, Th. 2007, A&A, 464, 687 [EDP Sciences] [CrossRef] [NASA ADS]
- Catala, C., Alecian, E., Donati, J.-F., et al. 2007, A&A, 462, 293 [EDP Sciences] [CrossRef] [NASA ADS]
- Chen, C. H., Sargent, B. A, Bohac, C., et al. 2006, ApJ Supp., 166, 351 [CrossRef] [NASA ADS]
- Cohen, M. 1998, AJ, 115, 2092 [CrossRef] [NASA ADS]
- Coulson, I. M., Walther, D. M., & Dent, W. R. F. 1998, MNRAS, 296, 934 [CrossRef] [NASA ADS]
- D'Angelo, G., Errico, L., Gomez, M. T., et al. 2000, A&A, 356, 888 [NASA ADS]
- Dent, W. R. F., Greaves, J. S., & Coulson, I. M. 2005, MNRAS, 359, 663 [CrossRef] [NASA ADS]
- Dommanget, J., & Nys, O. 2002, yCat, I/274
- Dorschner, J., Begemann, B., Henning, Th., Jaeger, C., & Mutschke, H. 1995, A&A, 300, 503 [NASA ADS]
- Doucet, C., Habart, E., Pantin, E., et al. 2007, A&A, 470, 625 [EDP Sciences] [CrossRef] [NASA ADS]
- Dullemond, C. P., & Dominik, C. 2004, A&A, 417, 159 [EDP Sciences] [CrossRef] [NASA ADS]
- Dunkin, S. K., Barlow, M. J., Ryan, S. G. 1997, MNRAS, 290, 165 [NASA ADS]
- Folsom, C. P. 2007, Magnetic, chemical and rotational properties of the Herbig Ae/Be binary HD 72106, Thesis at Queen's University; Kingston, Ontario, Canada
- Furlan, E., Hartmann, L., Calvet, N., et al. 2006, ApJ Supp., 165, 568 [CrossRef] [NASA ADS]
- Geers, V. C., Augereau, J.-C., Pontoppidan, K. M., et al. 2005, in High Resolution Infrared Spectroscopy in Astronomy, ed. H. U., Käufl, R. Siebenmorgen, & A. Moorwood (Springer), 239
- Geers, V. C., Augereau, J.-C., Pontoppidan, K. M., et al. 2006, A&A, 459, 545 [EDP Sciences] [CrossRef] [NASA ADS]
- Geers, V. C., Pontoppidan, K. M., van Dishoeck, E. F., et al. 2007a, A&A, 469, L35 [EDP Sciences] [CrossRef] [NASA ADS]
- Geers, V. C., van Dishoeck, E. F., Visser, R., et al. 2007b, A&A, 476, 279 [EDP Sciences] [CrossRef] [NASA ADS]
- Green, J. D., Hartmann, L., Calvet, N., et al. 2006, ApJ, 648, 1099 [CrossRef] [NASA ADS]
- Habart, E., Testi, L., Natta, A., & Carbillet, M. 2004, ApJ, 614, L129 [CrossRef] [NASA ADS]
- Habart, E., Natta, A., Testi, L., & Carbillet, M. 2006, A&A, 449, 1067 [EDP Sciences] [CrossRef] [NASA ADS]
- Hales, A. S., Gledhill, T. M., Barlow, M. J., & Lowe, K. T. E. 2006, MNRAS, 365, 1348 [NASA ADS]
- Hallenbeck, S., & Nuth, J. 1997, Ap&SS, 255, 427 [CrossRef] [NASA ADS]
- Hanner, M. S., Brooke, T. Y., & Tokunaga, A. T. 1998, ApJ, 502, 871 [CrossRef] [NASA ADS]
- Hartmann, L., & Kenyon, S. J. 1996, ARA&A, 34, 207 [CrossRef] [NASA ADS]
- Henning, Th., Launhardt, R., Steinacker, J., & Thamm, E. 1994, A&A, 291, 546 [NASA ADS]
- Herbig, G. H. 2005, AJ, 130, 815 [CrossRef] [NASA ADS]
- Hernández, J., Calvet, N., Briceño, C., Hartmann, L., & Berlind, P. 2004, AJ, 127, 1682 [CrossRef] [NASA ADS]
- Higdon, S. J. U., Devost, D., Higdon, J. L., et al. 2004, PASP, 116, 975 [CrossRef] [NASA ADS]
- Hillenbrand, L. A., Strom, S. E., Vrba, F. J., & Keene, J. 1992, ApJ, 397, 613 [CrossRef] [NASA ADS]
- Honda, M., Kataza, H., Okamoto, Y. K., et al. 2006, ApJ, 646, 1024 [CrossRef] [NASA ADS]
- Hony, S., Van Kerckhoven, C., Peeters, E., et al. 2001, A&A, 370, 1030 [EDP Sciences] [CrossRef] [NASA ADS]
- Houck, J. R., Roellig, T. L., van Cleve, J., et al. 2004, ApJS, 154, 18 [CrossRef] [NASA ADS]
- Hudgins, D. M., & Allamandola, L. J. 1999, ApJ, 516, L41 [CrossRef] [NASA ADS]
- Hutchinson, M. G., Evans, A., Winkler, H., & Spencer Jones, J. 1990, A&A, 234, 230 [NASA ADS]
- Jaeger, C., Molster, F. J., Dorschner, J., et al. 1998, A&A, 339, 904 [NASA ADS]
- Jayawardhana, R., Fisher, R. S., Telesco, C. M., et al. 2001, AJ, 122, 2047 [CrossRef] [NASA ADS]
- Jensen, E. L. N., & Mathieu, R. D. 1997, AJ, 114, 301 [CrossRef] [NASA ADS]
- Juhász, A., Henning, Th., Bouwman, J., et al. 2009, ApJ, in press [arXiv:0902.0405]
- Käufl, H.-U., Sterzik, M. F., Siebenmorgen, R., et al. 2003, SPIE, 4841, 117 [NASA ADS]
- Kemper, F., Vriend, W. J., & Tielens, A. G. G. M. 2004, ApJ, 609, 826 [CrossRef] [NASA ADS]
- Kenyon, S. J., Hartmann, L., & Hewett, R. 1988, ApJ, 325, 231 [CrossRef] [NASA ADS]
- Kenyon, S. J., Kolotilov, E. A., Ibragimov, M. A., & Mattei, J. A. 2000, ApJ, 531, 1028 [CrossRef] [NASA ADS]
- Kessler-Silacci, J. E., Augereau, J.-C., Dullemond, C. P., et al. 2006, ApJ, 639, 275 [CrossRef] [NASA ADS]
- Kessler-Silacci, J. E., Dullemond, C. P., Augereau, J.-C., et al. 2007, ApJ, 659, 680 [CrossRef] [NASA ADS]
- Kurucz, R. L. 1994, Solar abundance model atmospheres for 0, 1, 2, 4, 8 km/s, CD-ROM No. 19. (Cambridge, Mass.: Smithsonian Astrophysical Observatory)
- Lagage, P. O., Pel, J. W., Authier, M., et al. 2004, Msngr, 117, 12 [NASA ADS]
- Lagage, P. O., Doucet, C., Pantin, E., et al. 2006, Science, 314, 621 [CrossRef] [NASA ADS]
- Leinert, C., Richichi, A., & Haas, M. 1997, A&A, 318, 472 [NASA ADS]
- Leinert, Ch., van Boekel, R., Waters, L. B. F. M., et al. 2004, A&A, 423, 537 [EDP Sciences] [CrossRef] [NASA ADS]
- Li, A., & Draine, B. T. 2002, ApJ, 572, 232 [CrossRef] [NASA ADS]
- Lisse, C. M., Beichman, C. A., Bryden, G., & Wyatt, M. C. 2007, ApJ, 658, 584 [CrossRef] [NASA ADS]
- Lisse, C. M., Chen, C. H., Wyatt, M. C., & Morlok, A. 2008, ApJ, 673, 1106 [CrossRef] [NASA ADS]
- Lovis, C., Mayor, M., Pepe, F., et al. 2006, Nature, 441, 305 [CrossRef] [NASA ADS]
- Lowrance, P. J., Schneider, G., Kirkpatrick, J. D., et al. 2000, ApJ, 541, 390 [CrossRef] [NASA ADS]
- Malfait, K., Bogaert, E., & Waelkens, C. 1998, A&A, 331, 211 [NASA ADS]
- Mamajek, E. E., Meyer, M. R., Hinz, P. M., et al. 2004, ApJ, 612, 496 [CrossRef] [NASA ADS]
- Mannings, V., & Barlow, M. J. 1998, ApJ, 497, 330 [CrossRef] [NASA ADS]
- Mattioda, A. L., Hudgins, D. M., & Allamandola, L. J. 2005, ApJ, 629, 1188 [CrossRef] [NASA ADS]
- Meeus, G., Waters, L. B. F. M., Bouwman, J., et al. 2001, A&A, 365, 476 [EDP Sciences] [CrossRef] [NASA ADS]
- Meeus, G., Bouwman, J., Dominik, C., Waters, L. B. F. M., & de Koter, A. 2002, A&A, 392, 1039 [EDP Sciences] [CrossRef] [NASA ADS]
- Meeus, G., Sterzik, M., Bouwman, J., & Natta, A. 2003, A&A, 409, L25 [EDP Sciences] [CrossRef] [NASA ADS]
- Meyer, M. R., Backman, D. E., Weinberger, A. J., & Wyatt, M. C. 2007, in Protostars and Planets V, ed. B. Reipurth, D. Jewitt, & K. Keil (University of Arizona Press Tucson), 573
- Moorwood, A., Cuby, J. G., & Lidman, C. 1998, Msngr, 91, 9 [NASA ADS]
- Natta, A., Testi, L., Neri, R., Shepherd, D. S., Wilner, D. J. 2004, A&A, 416, 179 [EDP Sciences] [CrossRef] [NASA ADS]
- Okamoto, Y. K., Kataza, H., Honda, M., et al. 2004, Nature, 431, 660 [CrossRef] [NASA ADS]
- Oudmaijer, R. D., van der Veen, W. E. C. J., Waters, L. B. F. M., et al. 1992, A&A Supp., 96, 625 [NASA ADS]
- Pascucci, I., Apai, D., Hardegree-Ullman, E. E., et al. 2008, ApJ, 673, 477 [CrossRef] [NASA ADS]
- Pasquini, L., Cutispoto, G., Gratton, R., & Mayor, M. 1991, A&A, 248, 72 [NASA ADS]
- Peeters, E., Hony, S., Van Kerckhoven, C., et al. 2002, A&A, 390, 1089 [EDP Sciences] [CrossRef] [NASA ADS]
- Peeters, E., Allamandola, L. J., Hudgins, D. M., Hony, S., & Tielens, A. G. G. M. 2004a, in Astrophysics of Dust, ed. A. N. Witt, G. C. Clayton, & B. T. Draine, ASP Conf. Ser., 309, 141
- Peeters, E., Mattioda, A. L., Hudgins, D. M., & Allamandola, L. J. 2004b, ApJ, 617, L65 [CrossRef] [NASA ADS]
- Perrin, M. D., Duchene, G., Kalas, P., & Graham, J.R. 2006, ApJ, 645, 1272 [CrossRef] [NASA ADS]
- Pogodin, M. A., Franco, G. A. P., & Lopes, D. F. 2005, A&A, 438, 239 [EDP Sciences] [CrossRef] [NASA ADS]
- Prato, L., Ghez, A. M., Piña, R. K., et al. 2001, ApJ, 549, 590 [CrossRef] [NASA ADS]
- Przygodda, F., van Boekel, R., Àbrahàm, P., et al. 2003, A&A, 412, L43 [EDP Sciences] [CrossRef] [NASA ADS]
- Quanz, S. P., Henning, Th., Bouwman, J., Ratzka, Th., & Leinert, Ch. 2006, ApJ, 648, 472 [CrossRef] [NASA ADS]
- Quanz, S. P., Henning, Th., Bouwman, J., et al. 2007, ApJ, 668, 359 [CrossRef] [NASA ADS]
- Quast, G. R., Torres, C. A. O., de La Reza, R., da Silva, L., & Mayor, M. 2000, IAUS, 200, 28 [NASA ADS]
- Rietmeijer, F. J. M. 1989, in Lunar and Planetary Science Conference, 19th, Proceedings A89-36486 15-91 (Cambridge University Press / Lunar and Planetary Institute), p. 513
- Savage, B. D., & Mathis, J. S. 1979, ARA&A, 17, 73 [CrossRef] [NASA ADS]
- Schegerer, A., Wolf, S., Voshchinnikov, N. V., Przygodda, F., & Kessler-Silacci, J. E. 2006, A&A, 456, 535 [EDP Sciences] [CrossRef] [NASA ADS]
- Schütz, O., & Sterzik, M. F. 2005, in High Resolution Infrared Spectroscopy in Astronomy, ed. H. U. Käufl, R. Siebenmorgen, & A. Moorwood, (Springer), 104
- Schütz, O., Meeus, G., & Sterzik, M. F. 2005a, A&A, 431, 165 [EDP Sciences] [CrossRef] [NASA ADS]
- Schütz, O., Meeus, G., & Sterzik, M. F. 2005b, A&A, 431, 175 [EDP Sciences] [CrossRef] [NASA ADS]
- Servoin, J. L., & Piriou, B. 1973, Phys. Stat. Sol. B, 55, 677 [CrossRef]
- Sheret, I., Dent, W. R. F., & Wyatt, M. C. 2004, MNRAS, 348, 1282 [CrossRef] [NASA ADS]
- Sicilia-Aguilar, A., Hartmann, L. W., Watson, D., et al. 2007, ApJ, 659, 1637 [CrossRef] [NASA ADS]
- Sloan, G. C., Hayward, T. L., Allamandola, L. J., et al. 1999, ApJ, 513, L65 [CrossRef] [NASA ADS]
- Sloan, G. C., Keller, L. D., Forrest, W. J., et al. 2005, ApJ, 632, 956 [CrossRef] [NASA ADS]
- Sloan, G. C., Jura, M., Duley, W. W., et al. 2007, ApJ, 664, 1144 [CrossRef] [NASA ADS]
- Smith, T. L., Clayton, G. C., & Valencic, L. 2004, AJ, 128, 357 [CrossRef] [NASA ADS]
- Song, I., Caillault, J.-P., Barrado y Navascués, D., & Stauffer, J. R. 2001, ApJ, 546, 352 [CrossRef] [NASA ADS]
- Song, I., Zuckerman, B., Weinberger, A. J., & Becklin, E. E. 2005, Nature, 436, 363 [CrossRef] [NASA ADS]
- Spitzer, W. G., & Kleinman, D. A. 1961, Phys. Rev., 121, 1324 [CrossRef] [NASA ADS]
- Stencel, R. E., & Backman, D. E. 1991, ApJS, 75, 905 [CrossRef] [NASA ADS]
- Sterzik, M. F., Melo, C. H. F., Tokovinin, A. A., & van der Bliek, N. 2005, A&A, 434, 671 [EDP Sciences] [CrossRef] [NASA ADS]
- Strassmeier, K. G., & Rice, J. B. 2000, A&A, 360, 1019 [NASA ADS]
- Sylvester, R. J., Skinner, C. J., Barlow, M. J., & Mannings, V. 1996, MNRAS, 279, 915 [NASA ADS]
- Sylvester, R. J., & Mannings, V. 2000, MNRAS, 313, 73 [CrossRef] [NASA ADS]
- Sylvester, R. J., Dunkin, S. K., & Barlow, M. J. 2001, MNRAS, 327, 133 [CrossRef] [NASA ADS]
- Tielens, A. G. G. M. 2008, ARA&A, 46, 289 [CrossRef] [NASA ADS]
- Torres, C. A. O., Quast, G., de la Reza, R., Gregorio-Hetem, J. & Lépine, J. R. D. 1995, AJ, 109, 2146 [CrossRef] [NASA ADS]
- Torres, G. 2004, AJ, 127, 1187 [CrossRef] [NASA ADS]
- Torres, C. A. O., Quast, G. R., da Silva, L., et al. 2006, A&A, 460, 695 [EDP Sciences] [CrossRef] [NASA ADS]
- van Boekel, R., Waters, L. B. F. M., Dominik, C., et al. 2003, A&A, 400, L21 [EDP Sciences] [CrossRef] [NASA ADS]
- van Boekel, R., Min, M., Leinert, Ch., et al. 2004, Nature, 432, 479 [CrossRef] [NASA ADS]
- van Boekel, R., Min, M., Waters, L. B. F. M., et al. 2005, A&A, 437, 189 [EDP Sciences] [CrossRef] [NASA ADS]
- van den Ancker, M. E., de Winter, D., & Tjin A Djie, H. R. E. 1998, A&A, 330, 145 [NASA ADS]
- van Diedenhoven, B., Peeters, E., Van Kerckhoven, C., et al. 2004, ApJ, 611, 928 [CrossRef] [NASA ADS]
- Van Kerckhoven, C. 2002, Ph.D. thesis at Catholic University of Leuven, Belgium
- Van Kerckhoven, C., Hony, S., Peeters, E., et al. 2000, A&A, 357, 1013 [NASA ADS]
- Vieira, S. L. A., Corradi, W. J. B., Alencar, S. H. P., et al. 2003, AJ, 126, 2971 [CrossRef] [NASA ADS]
- Wang, H., Apai, D., Henning, T., & Pascucci, I. 2004, ApJ, 601, L83 [CrossRef] [NASA ADS]
- Werner, M. W., Roellig, T. L., Low, F. J., et al. 2004, ApJS, 154, 1 [CrossRef] [NASA ADS]
- Worley C. E., & Douglass G. G. 1997, A&AS, 125, 523 [EDP Sciences] [CrossRef] [NASA ADS]
- Wyatt, M. C., Greaves, J. S., Dent, W. R. F., & Coulson, I. M. 2005, ApJ, 620, 492 [CrossRef] [NASA ADS]
- Yudin, R. V. 2000, A&AS, 144, 285 [EDP Sciences] [CrossRef] [NASA ADS]
- Zuckerman, B., & Song, I. 2004, ARA&A, 42, 685 [CrossRef] [NASA ADS]
- Zuckerman, B., Song, I., Bessell, M. S., & Webb, R. A. 2001, ApJ, 562, L87 [CrossRef] [NASA ADS]
Footnotes
- ... disks
- Based on observations made at the European Southern Observatory, obtained under program IDs 076.C-0634(A) and 077.C-0054(A), during TIMMI2 technical time as well as collected from the ESO/ST-ECF Science Archive Facility.
- ...
Archive
- http://archive.eso.org
- ...
website
- http://ssc.spitzer.caltech.edu
All Tables
Table 1: Stellar parameters and known fluxes of our target sample.
Table 2: Results from TIMMI2 photometry and spectroscopy.
Table 3: Relative mass fractions in percent derived from the model fits to the N-band spectra.
Table 4: Labels and luminosities (with errors when they were given in the literature) used in Figs. 10-12.
Current usage metrics show cumulative count of Article Views (full-text article views including HTML views, PDF and ePub downloads, according to the available data) and Abstracts Views on Vision4Press platform.
Data correspond to usage on the plateform after 2015. The current usage metrics is available 48-96 hours after online publication and is updated daily on week days.
Initial download of the metrics may take a while.