| Issue |
A&A
Volume 507, Number 1, November III 2009
|
|
|---|---|---|
| Page(s) | 283 - 300 | |
| Section | Interstellar and circumstellar matter | |
| DOI | https://doi.org/10.1051/0004-6361/200912179 | |
| Published online | 03 September 2009 | |
A&A 507, 283-300 (2009)
Properties of M31![[*]](/icons/foot_motif.png)
I. Dust. Basic properties and a discussion about age-dependent dust heating
M. Montalto1,2 - S. Seitz1,2 - A. Riffeser1 - U. Hopp1,2 - C.-H. Lee1 - R. Schönrich1
1 - University Observatory Munich, Scheinerstrasse 1, 81679
Munich, Germany
2 - Max-Planck Institute for Extraterrestrial Physics,
Giessenbachstrasse, 85748 Garching, Germany
Received 25 March 2009 / Accepted 4 July 2009
Abstract
Aims. Observations acquired by the Spitzer Space
Telescope and improvements to theoretical modeling of dust emission
properties are used to discuss the distribution of dust and its
characteristics in the closest neighbor spiral galaxy M31.
These data are then used with GALEX FUV, NUV, and SDSS images
to study the age dependence of the dust heating process.
Methods. Spitzer IRAC/MIPS maps of M31
were matched together and compared to dust emission models allowing us
to constrain the dust mass, the intensity of the mean radiation field,
the abundance of polycyclic aromatic hydrocarbon (PAH)
particles. The total infrared emission (TIR) was analyzed as a
function of UV and optical colors and compared to predictions
of models that consider age-dependent dust heating.
Results. We demonstrate that cold-dust component
emission dominates the infrared spectral energy distribution of
M31. The mean intensity of the radiation field heating the
dust is low (typically U < 2, where U
= 1 is the value in the solar neighborhood). Because of a lack of
submillimeter observations, the dust mass (
![]() )
is only weakly constrained by the infrared spectrum, but we derived a
lower limit of
)
is only weakly constrained by the infrared spectrum, but we derived a
lower limit of
![]() with
a best-fit model value of
with
a best-fit model value of
![]() ,
in good agreement with expectations from CO and
HI measurements. Across the spiral-ring structure of
M31, we show that a fraction >3% of the total dust
mass is in
PAHs. UV and optical colors are correlated with the total
infrared to far ultraviolet (TIR/FUV) ratios in
,
in good agreement with expectations from CO and
HI measurements. Across the spiral-ring structure of
M31, we show that a fraction >3% of the total dust
mass is in
PAHs. UV and optical colors are correlated with the total
infrared to far ultraviolet (TIR/FUV) ratios in ![]() 670 pc-sized regions
over the disk of M31, although deviating from the
relationship between infrared excess and ultraviolet spectral slope
(referred as IRX-
670 pc-sized regions
over the disk of M31, although deviating from the
relationship between infrared excess and ultraviolet spectral slope
(referred as IRX-![]() relationship) for starburst galaxies. In particular, redder regions
have lower values of the TIR/FUV ratio for a fixed color. Considering
the predictions of models that account for the dust-heating age
dependence, we found that in 83% of the regions analyzed
across the 10 kpc ring, more than 50% of the energy
absorbed by the dust is rediated at
relationship) for starburst galaxies. In particular, redder regions
have lower values of the TIR/FUV ratio for a fixed color. Considering
the predictions of models that account for the dust-heating age
dependence, we found that in 83% of the regions analyzed
across the 10 kpc ring, more than 50% of the energy
absorbed by the dust is rediated at
![]() Å
and that dust in M31 appears mainly heated by populations a
few Gyr old even across the star-forming ring. We also found that the
attenuation varies radially peaking close to 10 kpc and
decreases more rapidly with radius in the inner regions of
M31 than in the outer regions in agreement with previous
studies. We finally derived the attenuation map of M31 at 6''/px
resolution (
Å
and that dust in M31 appears mainly heated by populations a
few Gyr old even across the star-forming ring. We also found that the
attenuation varies radially peaking close to 10 kpc and
decreases more rapidly with radius in the inner regions of
M31 than in the outer regions in agreement with previous
studies. We finally derived the attenuation map of M31 at 6''/px
resolution (![]() 100 pc/px
along the plane of M31).
100 pc/px
along the plane of M31).
Key words: dust, extinction
1 Introduction
The presence of the dust affects astrophysical observations in different ways. In the UV-optical spectral region, the dust absorbs the stellar radiation field, while it re-emits the absorbed energy in the IR-FIR and sub-millimetric spectral regions. It is thus essential to determine the dust properties a given system as accurately as possible. Although in our own Galaxy we can complete observations of very high spatial resolutions and accuracies, our particular location inside the galaxy restricts the objectivity of our analysis.
Being the closest large spiral similar to the Milky Way, M31 offers a fascinating view of the dust distribution across the disk of a galaxy and a unique opportunity to study the properties of a major disk galaxy in detail. Previous studies focused on the dust in this galaxy, but new observational results and theoretical improvements now allow some issues to be revisited and critically discussed and allow us to shed new light on unresolved problems. In particular, GALEX UV observations (Gil de Paz et al. 2007), SDSS optical images (York et al. 2000), and Spitzer Space Telescope observations (Barmby et al. 2006; Gordon et al. 2006) in the infrared and far infrared are now available for M31. Together with recent CO and HI observations (Nieten et al. 2006; Braun et al. 2009), this new wealth of data allows a much more detailed exploration of the dust properties than previous studies. Spitzer data allow us to study the far-infrared emission on significantly smaller scales than in the IRAS era.
Important progress has also been made in the theoretical understanding of dust properties, which has enabled new parameters to be derived from the data (Weingartner & Draine 2001; Draine & Li 2007; Draine et al. 2007). This work is thus devoted to an analysis of data presently available for M31 using examples of the latest theoretical models. We focus on the mean radiation field heating the dust, on the dust mass determination, and on the amount and distribution of polycyclic aromatic hydocarbon particles (PAHs) in M31.
M31 is an invaluable target for studying a problem
that has
attracted a great deal of attention in recent studies: what is the main
heating source of dust in a galaxy? The dust certainly tends to
preferentially absorb UV photons, so naively one would of
course
expect UV radiation, especially from the young populations detected in
the
GALEX images of M31, to be the main source responsible for
the
observed dust emission. This idea clearly holds for
starburst and very actively star-forming galaxies (see e.g., Buat 1992;
Meurer et al. 1995)
and led to the discovery of the IRX-![]() relation (Meurer
et al. 1999). However, in galaxies hosting older stellar
populations, the bulk of the radiation is emitted at longer
wavelengths. Studies have demonstrated that in systems with relatively
low
star-formation rates, old stars can contribute significantly to
the dust heating (Cortese et al. 2008; Kong
et al. 2004;
Buat et al. 2005;
Gordon et al. 2000),
and we demonstrate in this paper that the
latter also applies to M31. This difference is crucial when
one
attempts to derive accurate dust attenutations and, consequently,
star-formation rates in any galactic system.
relation (Meurer
et al. 1999). However, in galaxies hosting older stellar
populations, the bulk of the radiation is emitted at longer
wavelengths. Studies have demonstrated that in systems with relatively
low
star-formation rates, old stars can contribute significantly to
the dust heating (Cortese et al. 2008; Kong
et al. 2004;
Buat et al. 2005;
Gordon et al. 2000),
and we demonstrate in this paper that the
latter also applies to M31. This difference is crucial when
one
attempts to derive accurate dust attenutations and, consequently,
star-formation rates in any galactic system.
The structure of this paper is as follows: In Sect. 2, we
present the analyzed data and the calibration procedure. In
Sect. 3,
we describe the dust models and their
application to determine the dust mass, the mean intensity of the
radiation field responsible for dust heating, and the PAHs
abundances in M31. In Sect. 4, we discuss
the
age
dependency of dust heating, deriving the
![]() attenuation
across
the spiral-ring structure of M31. Finally, in
Sects. 5
and 6
we discuss and
summarize our results.
attenuation
across
the spiral-ring structure of M31. Finally, in
Sects. 5
and 6
we discuss and
summarize our results.
2 The data
2.1 IR
In this work we used the IR images of M31 described in Barmby
et al. (2006)
and Gordon et al. (2006),
obtained with the
IRAC/MIPS instruments onboard of the Spitzer Space Telescope
(SST). In particular, we retrieved from the SST archive the ![]() m,
m, ![]() m IRAC, and
the 24
m IRAC, and
the 24 ![]() m,
70
m,
70 ![]() m
and
m
and
![]() m MIPS Basic
Calibrated Data (BCDs) processed
by the SST's archive pipeline (v.14). The BCDs were then stacked
together using the MOPEX software (version 18.1).
m MIPS Basic
Calibrated Data (BCDs) processed
by the SST's archive pipeline (v.14). The BCDs were then stacked
together using the MOPEX software (version 18.1).
For IRAC observations, we applied an overlap correction before
mosaiking
to match the background between adjacent images, and discarded
the first frame of each observing run because it was typically acquired
with a lower bias level than subsequent images (first-frame effect).
The background was evaluated in the external regions and subtracted
from the images with the IRAF imsurfit task using a
low-order
polynomial (first or second order depending on the map). We then
applied the IRAC photometric corrections to infinite sources as
reported in the IRAC documentation multiplying the ![]() m
image by 0.91 and the
m
image by 0.91 and the ![]() m
image by 0.74 to
account for the scattering of incident light in the array focal planes.
We
applied the correction to extended sources because in this work we
focus on the diffuse dust emission, not on point-like sources.
m
image by 0.74 to
account for the scattering of incident light in the array focal planes.
We
applied the correction to extended sources because in this work we
focus on the diffuse dust emission, not on point-like sources.
For MIPS ![]() m
and
m
and ![]() m
data, we used our customized
software for background subtraction by means of fitting and subtracting
a
first order polynomial along the scan direction excluding the
M31 region. The final MIPS mosaic images have a resolution
of
m
data, we used our customized
software for background subtraction by means of fitting and subtracting
a
first order polynomial along the scan direction excluding the
M31 region. The final MIPS mosaic images have a resolution
of ![]() ,
,
![]() ,
and
,
and ![]() at
at
![]() m,
70
m,
70 ![]() m
and 160
m
and 160 ![]() m,
respectively.
m,
respectively.
Because our purpose was to directly compare the fluxes in each
band on
a pixel-by-pixel basis we had to resample the images to the same
astrometric reference system. We created two sets of images:
in the first one, the IRAC ![]() m and
m and ![]() m images were
placed on the reference system of the
m images were
placed on the reference system of the ![]() m mosaic
(
m mosaic
(
![]() ),
and in the second, the IRAC
),
and in the second, the IRAC ![]() m and
8
m and
8 ![]() m
and the MIPS 24
m
and the MIPS 24 ![]() m
and 70
m
and 70 ![]() m
images were placed on the reference system of the 160
m
images were placed on the reference system of the 160 ![]() m mosaic
(
m mosaic
(
![]() ).
These two sets will be considered separately in
the following. To ensure that the different instrument images are
comparable, we
first matched the PSF of the input instrument to that of the
target instrument (MIPS
).
These two sets will be considered separately in
the following. To ensure that the different instrument images are
comparable, we
first matched the PSF of the input instrument to that of the
target instrument (MIPS ![]() m
or MIPS
m
or MIPS ![]() m).
This
was achieved with the help of the transformation kernels provided by
Gordon
m).
This
was achieved with the help of the transformation kernels provided by
Gordon![]() (Gordon et al. 2008). These
kernels provide the transformation between the PSFs of each couple of
IRAC-IRAC, IRAC-MIPS, and MIPS-MIPS instruments dependent on the dust
temperature. After the convolution, we resampled the images on to the
same astrometric grid, in such a way that each pixel in a given band
corresponded to the same physical region of the same pixel in the
other bands. We estimated the uncertainty in the resampling step by
means of a comparison of the integrated photometry on the entire galaxy
before and after this procedure, as shown in Table 1 where:
the second column presents the percentual variation for the images
resampled to the 24
(Gordon et al. 2008). These
kernels provide the transformation between the PSFs of each couple of
IRAC-IRAC, IRAC-MIPS, and MIPS-MIPS instruments dependent on the dust
temperature. After the convolution, we resampled the images on to the
same astrometric grid, in such a way that each pixel in a given band
corresponded to the same physical region of the same pixel in the
other bands. We estimated the uncertainty in the resampling step by
means of a comparison of the integrated photometry on the entire galaxy
before and after this procedure, as shown in Table 1 where:
the second column presents the percentual variation for the images
resampled to the 24 ![]() m
resolution, the third column for images resampled to
m
resolution, the third column for images resampled to ![]() m. The total
integrated flux was measured in the same area in all the images, which
corresponds to an ellipse centered on M31, with a semi-major
axis of
m. The total
integrated flux was measured in the same area in all the images, which
corresponds to an ellipse centered on M31, with a semi-major
axis of ![]() ,
a semi-minor axis of
,
a semi-minor axis of ![]() ,
and a position angle of
,
and a position angle of
![]() .
We found that in the worst case the
relative variation in flux was 3%. The uncertainty in the
background subtraction was estimated by evaluating the scatter in the
background subtracted mosaics in the outermost regions, and found to be
negligible.
.
We found that in the worst case the
relative variation in flux was 3%. The uncertainty in the
background subtraction was estimated by evaluating the scatter in the
background subtracted mosaics in the outermost regions, and found to be
negligible.
Table 1: Percentual variation in the total integrated flux of M31 due to the resampling procedure.
Table 2: Measurements of M31 infrared integrated fluxes.
While creating the mosaics with MOPEX![]() (MOsaicker and Point source EXtractor), we also derived the
associated
error map, which provides the error related to the entire reduction
procedure performed by the pipeline. To account for other sources
of error (resampling, background subtraction, and BCDs calibration) we
simply added a constant term equal to 10%, with the exception
the
(MOsaicker and Point source EXtractor), we also derived the
associated
error map, which provides the error related to the entire reduction
procedure performed by the pipeline. To account for other sources
of error (resampling, background subtraction, and BCDs calibration) we
simply added a constant term equal to 10%, with the exception
the
![]() m map for
which we would have obtained
unrealistically large values of the error. In reality, our approach can
be considered rather conservative, because as stated in the SST
documentation, the standard deviation maps account for the error of the
pipeline in a conservative way. Table 2
presents
infrared integrated flux measurements of M31 obtained by IRAC
(Barmby et al. 2006),
MIPS (Gordon et al. 2006),
COBE (Odenwald et al. 1998),
IRAS (Rice et al. 1988),
MSX (Kraemer et al. 2002),
and ISO (Haas et al. 1998)
instruments. The fourth columns shows our own measurements derived
from IRAC and MIPS observations. We measured the integrated
flux in an ellipse of semi-major axis
m map for
which we would have obtained
unrealistically large values of the error. In reality, our approach can
be considered rather conservative, because as stated in the SST
documentation, the standard deviation maps account for the error of the
pipeline in a conservative way. Table 2
presents
infrared integrated flux measurements of M31 obtained by IRAC
(Barmby et al. 2006),
MIPS (Gordon et al. 2006),
COBE (Odenwald et al. 1998),
IRAS (Rice et al. 1988),
MSX (Kraemer et al. 2002),
and ISO (Haas et al. 1998)
instruments. The fourth columns shows our own measurements derived
from IRAC and MIPS observations. We measured the integrated
flux in an ellipse of semi-major axis
![]() and
semi-minor
axis
and
semi-minor
axis ![]() ,
centered on M31 with a position
angle of
,
centered on M31 with a position
angle of ![]() .
In particular, with respect to the measurements quoted by Barmby
et al. (2006)
and Gordon et al. (2006),
our integrated fluxes are
0.6
.
In particular, with respect to the measurements quoted by Barmby
et al. (2006)
and Gordon et al. (2006),
our integrated fluxes are
0.6![]() smaller, 0.1
smaller, 0.1![]() smaller, 1
smaller, 1![]() larger,
0.8
larger,
0.8![]() larger, and 0.4
larger, and 0.4![]() smaller than their own measurements
at
smaller than their own measurements
at ![]() m,
8
m,
8 ![]() m,
24
m,
24 ![]() m,
m,
![]() m, and
m, and
![]() m
respectively, and our estimated error is 9% smaller,
and 30%, 54%, 36% and 50% larger, respectively, than their given
uncertainties. We conclude that our measurements are consistent within
m
respectively, and our estimated error is 9% smaller,
and 30%, 54%, 36% and 50% larger, respectively, than their given
uncertainties. We conclude that our measurements are consistent within
![]() and our
errors are in general equivalent to or larger
than the values derived by Barmby et al. (2006) and
Gordon
et al. (2006).
and our
errors are in general equivalent to or larger
than the values derived by Barmby et al. (2006) and
Gordon
et al. (2006).
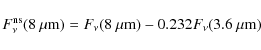
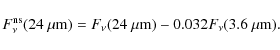
We finally subtracted from the 8 ![]() m and the
24
m and the
24 ![]() m
maps
the stellar continuum, which was assumed to be described by the
3.6
m
maps
the stellar continuum, which was assumed to be described by the
3.6 ![]() m
map following Helou et al. (2004):
m
map following Helou et al. (2004):
2.2 Ultraviolet
The UV maps of M31 were retrieved directly from the NASA
Extragalactic Database (NED) and were obtained as part of the survey
of nearby galaxies performed with the GALaxy Evolution
eXplorer
(GALEX) satellite (Gil de Paz et al. 2007). We
retrieved and used both
the far ultraviolet (FUV) and the near ultraviolet (NUV) images.
These maps have a pixel scale of
![]() ,
a total
integration time of 800 s, and are given in units of counts
per
pixel per second (CPS). The background in these images can be assumed
to be constant and was accurately measured by Gil de Paz
et al. (2007),
who
inferred a mean value of
,
a total
integration time of 800 s, and are given in units of counts
per
pixel per second (CPS). The background in these images can be assumed
to be constant and was accurately measured by Gil de Paz
et al. (2007),
who
inferred a mean value of
![]() CPS
and
CPS
and ![]() CPS
for the FUV and NUV, respectively. We
subtracted the background from the maps and then converted the CPS
units in Jy by multiplying the factors
CPS
for the FUV and NUV, respectively. We
subtracted the background from the maps and then converted the CPS
units in Jy by multiplying the factors
![]() Jy/CPS
and
Jy/CPS
and ![]()
![]() Jy/CPS, as
given by
the GALEX documentation. We then accounted for the foreground Galactic
extinction by assuming E(B-V)=0.062
in the direction of M31 as
reported by Schlegel et al. (1998) with
Jy/CPS, as
given by
the GALEX documentation. We then accounted for the foreground Galactic
extinction by assuming E(B-V)=0.062
in the direction of M31 as
reported by Schlegel et al. (1998) with
![]() and
and
![]() as
given by Gil de Paz et al. (2007). Two
series of maps were finally derived to compare UV observations
with MIPS 24
as
given by Gil de Paz et al. (2007). Two
series of maps were finally derived to compare UV observations
with MIPS 24 ![]() m
and MIPS 160
m
and MIPS 160 ![]() m
data. Both the FUV and the NUV maps were convolved to the
corresponding MIPS PSFs and resampled onto pixel grids of
m
data. Both the FUV and the NUV maps were convolved to the
corresponding MIPS PSFs and resampled onto pixel grids of
![]() and
and
![]() .
The global uncertainty of the final maps was estimated to be
.
The global uncertainty of the final maps was estimated to be ![]() 10% in flux
for both maps.
10% in flux
for both maps.
2.3 Optical
We retrieved and stacked together the SDSS images of M31
obtained in the SDSS survey. In this work, we used only the
SDSS i band (hereafter
![]() )
images of M31. First,
we subtracted the SOFTBIAS in every single frame. SOFTBIAS was
originally added automatically by the SDSS pipeline to avoid negative
pixel values. We aligned each single frame to a large reference image
(
)
images of M31. First,
we subtracted the SOFTBIAS in every single frame. SOFTBIAS was
originally added automatically by the SDSS pipeline to avoid negative
pixel values. We aligned each single frame to a large reference image
(
![]() square degree) using the IRAF
task wregister. We
then
reconstructed each stripe. The final mosaic image contains
7 stripes (3366-2, 3367-3, 3366-3, 3367-4, 3366-4, 3367-5, and
3366-5,
from left to right in the mosaic image). We first tested for
photometric variation, but detented no zeropoint difference
between the stripes. Nevertheless, we found sky variations in
y-direction in different stripes when combining them
into the mosaic
image. Therefore, we applied an alignment in the y-direction
for each
stripe. Using our customized written software (mupipe/skycalc),
we calculated the gradient
square degree) using the IRAF
task wregister. We
then
reconstructed each stripe. The final mosaic image contains
7 stripes (3366-2, 3367-3, 3366-3, 3367-4, 3366-4, 3367-5, and
3366-5,
from left to right in the mosaic image). We first tested for
photometric variation, but detented no zeropoint difference
between the stripes. Nevertheless, we found sky variations in
y-direction in different stripes when combining them
into the mosaic
image. Therefore, we applied an alignment in the y-direction
for each
stripe. Using our customized written software (mupipe/skycalc),
we calculated the gradient ![]() and the offset b in flux of
the overlapping areas between two adjacent stripes,
e.g.,
and the offset b in flux of
the overlapping areas between two adjacent stripes,
e.g.,
![]() and
applied the y-dependent sky correction to the entire stripe. The
map was convolved with the Spitzer
and
applied the y-dependent sky correction to the entire stripe. The
map was convolved with the Spitzer ![]() m PSF and resampled to a
40
m PSF and resampled to a
40
![]() /px
resolution.
/px
resolution.
We then calibrated the images using catalogued surrounding stars with SDSS photometry and masked out all the sources with i < 17 mag, since most of the point-like sources in this magnitude range are foreground contaminants and, excluding the brightest M31 objects (e.g., globular clusters, red supergiants), does not affect our analysis, which is focused on regions dominated by the dust diffuse emission.
![\begin{figure}
\par\includegraphics[width=8cm,clip]{12179f1.eps}
\end{figure}](/articles/aa/full_html/2009/43/aa12179-09/img73.png)
|
Figure 1:
Two color diagram used to isolate the regions with dust diffuse
emission. Labels and dashed lines indicate different sources of
emission in function of the colors. S/N
> 1 in all maps and each region corresponds to 6
|
| Open with DEXTER | |
To select an uncontaminated sample of regions from the
infrared and UV maps, we used the two-color diagram shown in
Fig. 1.
We corrected the 8 ![]() m
and 24
m
and 24 ![]() m
maps for the stellar continuum using Eqs. (1) and
(2) and analyzed our data at 6
m
maps for the stellar continuum using Eqs. (1) and
(2) and analyzed our data at 6
![]() resolution. We limited the
anaysis to regions with S/N>1
by excluding from the analysis the inner bulge region (<
resolution. We limited the
anaysis to regions with S/N>1
by excluding from the analysis the inner bulge region (<
![]() from the center of
M31), partially the interarm regions
between the inner spiral-arm and the outermost regions of the galaxy.
While the bulk of the data points have colors with
from the center of
M31), partially the interarm regions
between the inner spiral-arm and the outermost regions of the galaxy.
While the bulk of the data points have colors with
![]() and
and
![]() ,
and appear after visual inspection to be associated with the diffuse
dust emission, some deviant points are visible in Fig. 1. In
our
maps, bright point-like sources in the 24
,
and appear after visual inspection to be associated with the diffuse
dust emission, some deviant points are visible in Fig. 1. In
our
maps, bright point-like sources in the 24 ![]() m map have
m map have
![]() ,
and are thus lower than the ratios found in the diffuse component of
the dust. Different studies have demonstrated that the emission from
point-like sources at 24
,
and are thus lower than the ratios found in the diffuse component of
the dust. Different studies have demonstrated that the emission from
point-like sources at 24 ![]() m is associated with emission from HII regions in
the UV and optical spectral regions (Calzetti et al. 2007;
Prescott
et al. 2007). The PAHs emission at
7.7
m is associated with emission from HII regions in
the UV and optical spectral regions (Calzetti et al. 2007;
Prescott
et al. 2007). The PAHs emission at
7.7 ![]() m
is also expected to be significantly lower than
the diffuse dust emission in these environments (e.g., Calzetti
et al. 2005; Thilker et al. 2007; Bendo
et al. 2008). On the other hand, regions with
m
is also expected to be significantly lower than
the diffuse dust emission in these environments (e.g., Calzetti
et al. 2005; Thilker et al. 2007; Bendo
et al. 2008). On the other hand, regions with
![]() or
or
![]() appear
to be associated with bright
foreground stars. We thus adopt the selection criteria for regions:
appear
to be associated with bright
foreground stars. We thus adopt the selection criteria for regions:
![]() and
and
![]() .
In addition to using the SDSS optical map, we added the selection for
excluding bright foreground stars as described above.
.
In addition to using the SDSS optical map, we added the selection for
excluding bright foreground stars as described above.
In Fig. 2,
we show for each of the analyzed regions of M31 the minimum
signal-to-noise ratio (S/N) when
considering all the above-mentioned observational maps together. The S/N
is in general higher than 3 along the 10 kpc ring and
partially inside the the inner spiral structure. In the interarm and
external region, the S/N drops
below 1.5. In the bulge region, the S/N
is low because of the low stellar-corrected flux at 8 ![]() m.
m.
![\begin{figure}
\par\includegraphics[width=15cm]{12179f2.eps} \includegraphics[width=15cm]{12179f3.eps}
\end{figure}](/articles/aa/full_html/2009/43/aa12179-09/img82.png)
|
Figure 2:
Upper panel: minimum S/N
in each one of the analyzed regions of M31 once considering
the FUV, NUV, |
| Open with DEXTER | |
3 The theoretical models
We used and tested the theoretical models of infrared
emission of dust grains heated by starlight developed by Weingartner
& Draine (2001)
and Li & Draine (2001)
and updated by Draine & Li (2007). In
the
following, we summarize the main model characteristics and results.
Dust grains are treated as a mixture of amorphous
silicate and carbonaceous grains, where the smallest carbonaceous
grains have the physical properties of PAHs. Temperature
distribution functions for all particles are calculated and emission
spectra provided for dust heated by a single radiation field
intensity. The spectral energy distribution of the dust is given by
Mathis et al. (1983)
(MMP83) and scaled by the dimensionless
factor U, where U = 1
corresponds to the mean intensity of the
radiation field in the local ISM of the solar neighborhood. We tested
the seven Milky Way dust models proposed by Weingartner &
Draine
(2001),
which have PAH abundances of 0.47%, 1.12%, 1.77%, 2.50%,
3.19%, 3.90%, and 4.58% the total dust mass. These models assume
a dust-to-gas ratio
![]() .
For further
details, the reader is referred to the studies mentioned above. The
emission spectrum predicted by the model can be
approximated as
.
For further
details, the reader is referred to the studies mentioned above. The
emission spectrum predicted by the model can be
approximated as
![\begin{displaymath}\begin{array}{l}
F_{\nu, {\rm model}}=\Omega_{\rm star}~B_{\n...
...a~j_{\nu}({\rm model},U_{\min},U_{\max})\right],
\end{array}
\end{displaymath}](/articles/aa/full_html/2009/43/aa12179-09/img84.png)
|
(3) |
where the first term accounts for the residual infrared emission originating in the stars and is given by the product of
Each spectrum is thus completely characterized by 5
free parameters:
the solid angle subtended by the stars
![]() ,
the kind of
emission model (amount of PAHs), the minimum intensity
,
the kind of
emission model (amount of PAHs), the minimum intensity ![]() of
the starlight radiation field, the fraction
of
the starlight radiation field, the fraction ![]() of the total dust
mass heated by the power-law distribution of starlight intensities,
and the total dust (hydrogen) mass
of the total dust
mass heated by the power-law distribution of starlight intensities,
and the total dust (hydrogen) mass ![]() .
The best-fit model is obtained
by minimizing the quantity:
.
The best-fit model is obtained
by minimizing the quantity:
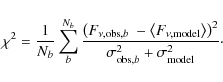
|
(4) |
In Table 2, we collected all the infrared integrated flux measurements of M31 performed to date, by analyzing data obtained with different instruments. In the fourth column, we show our own measurements derived from IRAC and MIPS observations. In general, all these measurements are in good agreement, and define the spectral energy distribution of M31 from
The best-fit model parameters we obtained were:
![]() ,
,
![]() ,
,
![]() ,
and
,
and ![]() ,
,
![]() ,
and the
,
and the ![]() of the best model was
of the best model was ![]() .
.
In the following, we discuss the uncertainties in the derived parameters and the implications of the results.
![\begin{figure}
\par\includegraphics[width=13.5cm,clip]{12179f4.eps}
\end{figure}](/articles/aa/full_html/2009/43/aa12179-09/img105.png)
|
Figure 3: Infrared spectral energy distribution of M31. Color symbols are measurements obtained with the different instruments indicated in the legend. The continuous line denotes the best-fit model of Draine et al. (2007). Open circles represent the model predicted fluxes after convolution with the instrumental response function, and these are the points that are compared with observations. |
| Open with DEXTER | |
3.1 The uncertainty in the dust mass estimate
The mass estimate obtained in the above paragraph must be
considered
to be rather uncertain. This is because, as shown in
Fig. 3,
the peak wavelength of M31's IR
spectrum is close to 160![]() m.
Thus, the vast majority of our
analyzed observations correspond to shorter waveleghts, therefore
colder mass components cannot be reliably constrained by the present
observations. The only measurement that provides any form of
constraint is the COBE
m.
Thus, the vast majority of our
analyzed observations correspond to shorter waveleghts, therefore
colder mass components cannot be reliably constrained by the present
observations. The only measurement that provides any form of
constraint is the COBE ![]() m
observation. Otherwise, the
cold-mass estimate critically depends on the temperature of the dust
inferred from the infrared spectrum. For a given mean radiation field
intensity U to which the dust is exposed,
the steady-state
temperature of the dust is
m
observation. Otherwise, the
cold-mass estimate critically depends on the temperature of the dust
inferred from the infrared spectrum. For a given mean radiation field
intensity U to which the dust is exposed,
the steady-state
temperature of the dust is
![]() ,
and the
emission peak
,
and the
emission peak ![]() (for grains of
dimension >
(for grains of
dimension >![]() ,
Draine & Li 2007),
that is
,
Draine & Li 2007),
that is ![]() .
By energy-balance considerations, U is then
directly
proportional to the emissivity per H nucleon of the dust
grains
tabulated in the models, and consequently the dust mass
.
By energy-balance considerations, U is then
directly
proportional to the emissivity per H nucleon of the dust
grains
tabulated in the models, and consequently the dust mass
![]() derived
by
comparing the model with the observations is
derived
by
comparing the model with the observations is
![]() ,
or
,
or
![]() .
This ensures that the dust temperature estimate is relatively robust to
uncertainties in U, i.e., a variation
of 100% in U (and in
.
This ensures that the dust temperature estimate is relatively robust to
uncertainties in U, i.e., a variation
of 100% in U (and in
![]() )
produces a variation of only
)
produces a variation of only ![]() 17% in both dust temperature
and emission peak wavelength, to which our measurements are
sensitive. Moreover,
17% in both dust temperature
and emission peak wavelength, to which our measurements are
sensitive. Moreover, ![]() can be quite large even for small changes
in U, if U is also small, as
seems to be the case for
M31. To perform a more quantitative analysis, in
Fig. 4,
we show the
can be quite large even for small changes
in U, if U is also small, as
seems to be the case for
M31. To perform a more quantitative analysis, in
Fig. 4,
we show the ![]() of the best-fit model,
obtained fixing the value of
of the best-fit model,
obtained fixing the value of ![]() ,
for the corresponding
total hydrogen mass
,
for the corresponding
total hydrogen mass ![]() predicted by the model. The black points
(continuous line) in that figure show the result of the fit when all
measurements in Table 2 are
considered (with the
exclusion of ISO and MSX measurements that were not used here), the
red points (dotted line) when neglecting the COBE 248
predicted by the model. The black points
(continuous line) in that figure show the result of the fit when all
measurements in Table 2 are
considered (with the
exclusion of ISO and MSX measurements that were not used here), the
red points (dotted line) when neglecting the COBE 248![]() m, and
the blue (dashed line) points when neglecting the MIPS 160
m, and
the blue (dashed line) points when neglecting the MIPS 160![]() m
and the COBE 148
m
and the COBE 148![]() m
and 248
m
and 248![]() m
measurements. From this figure, it is clear that the cold mass cannot
be accurately estimated. All the
curves exhibit a shallow minimum in
m
measurements. From this figure, it is clear that the cold mass cannot
be accurately estimated. All the
curves exhibit a shallow minimum in ![]() but the range of mass
values at which
but the range of mass
values at which ![]() approaches an absolute minimum is large
even when fitting all the present observations. Moreover,
when FIR measurements are excluded the
approaches an absolute minimum is large
even when fitting all the present observations. Moreover,
when FIR measurements are excluded the ![]() curves are even
flatter increasing the uncertainty in the mass values. Nevertheless,
we note that all
curves are even
flatter increasing the uncertainty in the mass values. Nevertheless,
we note that all ![]() curves are highly asymmetric
and imply that high mass values are much less tightly constrained than
low
mass values as explained below.
curves are highly asymmetric
and imply that high mass values are much less tightly constrained than
low
mass values as explained below.
![\begin{figure}
\par\includegraphics[width=7.5cm,clip]{12179f5.eps}
\end{figure}](/articles/aa/full_html/2009/43/aa12179-09/img116.png)
|
Figure 4:
Minimum |
| Open with DEXTER | |
In Fig. 5,
we present the difference between the
observations and the values predicted by two different models:
(i) the
best-fit model (which has ![]() ,
black filled points); (ii) the best-fit model obtained by
imposing
,
black filled points); (ii) the best-fit model obtained by
imposing ![]() (red open circles). All the measurements reported in Table 2 are
considered in the fit, thus the
(red open circles). All the measurements reported in Table 2 are
considered in the fit, thus the
![]() of these two
models are shown in Fig. 4
for the corresponding values of
of these two
models are shown in Fig. 4
for the corresponding values of ![]() as given by the points
connected by the continuous black line. In Fig. 5,
only
measurements with
as given by the points
connected by the continuous black line. In Fig. 5,
only
measurements with ![]() m are
considered because this is the
spectral region where the major differences are clearly evident. A
model
should be considered to be consistent with the observations if all the
observation minus model differences (
m are
considered because this is the
spectral region where the major differences are clearly evident. A
model
should be considered to be consistent with the observations if all the
observation minus model differences (![]() )
are consistent with
zero, within the observational errors. Focusing attention on the
far infrared measurements (FIR) of Spitzer 160
)
are consistent with
zero, within the observational errors. Focusing attention on the
far infrared measurements (FIR) of Spitzer 160![]() m and COBE
148
m and COBE
148![]() m, 248
m, 248![]() m in
Fig. 5,
we
obtained for the best-fit model
m in
Fig. 5,
we
obtained for the best-fit model
![]() ,
,
![]() ,
and
,
and
![]() ,
whereas for the model with
,
whereas for the model with ![]() ,
we obtained
,
we obtained
![]() ,
,
![]() ,
and
,
and
![]() .
Thus in this spectral range, the best-fit model with
.
Thus in this spectral range, the best-fit model with ![]() appears to
be consistent with the observations at <
appears to
be consistent with the observations at <
![]() ,
whereas to
reconcile observations and model predictions when
,
whereas to
reconcile observations and model predictions when
![]() we
measure differences <2.5
we
measure differences <2.5![]() ,
and in any case
>1.5
,
and in any case
>1.5![]() .
For shorter wavelengths, the two models appear almost
equivalent in reproducing the observations, although a slightly worse
result is obtained for
.
For shorter wavelengths, the two models appear almost
equivalent in reproducing the observations, although a slightly worse
result is obtained for ![]() .
An important feature of
Fig. 5
is that for
.
An important feature of
Fig. 5
is that for ![]() m,
the flux model values for
m,
the flux model values for ![]() are lower than the values of
the best-fit model, whereas for
are lower than the values of
the best-fit model, whereas for
![]() m
they are systematically higher. This is as expected as the peak
emission of the model with
m
they are systematically higher. This is as expected as the peak
emission of the model with ![]() is shifted towards shorter
wavelengths with respect to the best-fit model, as a consequence
of the stronger radiation field is heating the dust. Because of
FIR model predictions for the case of
is shifted towards shorter
wavelengths with respect to the best-fit model, as a consequence
of the stronger radiation field is heating the dust. Because of
FIR model predictions for the case of
![]() ,
we are
already at the limit of predicting an acceptable wavelength
distribution, and stronger radiation fields can be discarded. We
conclude
that on the basis of the diffuse dust emission models of Draine
&
Li (2007)
and
the analysis of the FIR spectrum of M31 the
mean radiation field
,
we are
already at the limit of predicting an acceptable wavelength
distribution, and stronger radiation fields can be discarded. We
conclude
that on the basis of the diffuse dust emission models of Draine
&
Li (2007)
and
the analysis of the FIR spectrum of M31 the
mean radiation field![]() that is heating the dust in M31 has typically
U < 2. Since the radiation field strnght is
inversely proportional to the dust mass estimate, we can also conclude
that the mass of the dust in
M31 is
that is heating the dust in M31 has typically
U < 2. Since the radiation field strnght is
inversely proportional to the dust mass estimate, we can also conclude
that the mass of the dust in
M31 is ![]()
![]() ,
which is the
value obtained for the best-fit model with
,
which is the
value obtained for the best-fit model with
![]() ,
assuming
a dust-to-gas ratio equal to 1%.
,
assuming
a dust-to-gas ratio equal to 1%.
The most accurate estimate of the total mass of atomic
hydrogen (HI) in M31 is that of Braun
et al. (2009),
and
equals
![]() .
Nieten et al. (2006)
provided a mass of molecular hydrogen
.
Nieten et al. (2006)
provided a mass of molecular hydrogen
![]() equal
to
equal
to
![]() (within
a radius of
(within
a radius of
![]() ). These estimates infer to a
total neutral hydrogen
mass of
). These estimates infer to a
total neutral hydrogen
mass of
![]() once
considering an uncertainty range for the CO conversion factor
between
once
considering an uncertainty range for the CO conversion factor
between
![]() .
The mass
estimate that we obtained from the best-fit model (considering all the
observations in Table 2,
.
The mass
estimate that we obtained from the best-fit model (considering all the
observations in Table 2,
![]() )
is thus respectively 1% and 5% lower than
the neutral hydrogen mass estimates at the extremes of the
uncertainty range mentioned above. Thus, despite the large uncertainty,
that we dicussed previously, the best-fit model mass estimate appears
to be consistent with HI and CO measurements, as shown in
Fig. 4.
Earlier estimates of the dust mass
(
)
is thus respectively 1% and 5% lower than
the neutral hydrogen mass estimates at the extremes of the
uncertainty range mentioned above. Thus, despite the large uncertainty,
that we dicussed previously, the best-fit model mass estimate appears
to be consistent with HI and CO measurements, as shown in
Fig. 4.
Earlier estimates of the dust mass
(
![]() )
in M31 inferred the values equal to
)
in M31 inferred the values equal to
![]() (Haas
et al. 1998) and
(Haas
et al. 1998) and
![]() (Schmidtobreick
et al. 2000),
which are fully consistent with our lower limit estimate but, for what
has been said so far, they cannot be considered to be more accurate
than
our best-fit model estimate.
(Schmidtobreick
et al. 2000),
which are fully consistent with our lower limit estimate but, for what
has been said so far, they cannot be considered to be more accurate
than
our best-fit model estimate.
![\begin{figure}
\par\includegraphics[width=8cm,clip]{12179f6.eps}
\end{figure}](/articles/aa/full_html/2009/43/aa12179-09/img141.png)
|
Figure 5:
Observed minus model difference values in flux units for measurements
with |
| Open with DEXTER | |
Analyzing a sample of 17 galaxies from the SINGS-SCUBA sample,
Draine et al. (2007)
showed that in all of these galaxies the value of the mean radiation
field derived from the best-fit model was >2,
with a median value of 4.3. On that basis, they proposed a
restricted
fitting procedure for the case in which submillimeter observations
are not available, which would require setting
![]() during
the
fit to avoid overestimating of the dust mass. Nevertheless,
as stated by the same authors, this procedure underestimates the dust
mass if the radiation field heating the dust is weak. The sample of
SINGS-SCUBA galaxies could be biased towards increased associated star
formation as recognized by the same authors. As we demonstrated
above, for the case of M31, models with
during
the
fit to avoid overestimating of the dust mass. Nevertheless,
as stated by the same authors, this procedure underestimates the dust
mass if the radiation field heating the dust is weak. The sample of
SINGS-SCUBA galaxies could be biased towards increased associated star
formation as recognized by the same authors. As we demonstrated
above, for the case of M31, models with
![]() disagree
with the FIR measurements. Moreover, models with a strong
UV radiation field imply gas masses far below the range given by
neutral hydrogen mass measurements, whereas our best-fit model
(
disagree
with the FIR measurements. Moreover, models with a strong
UV radiation field imply gas masses far below the range given by
neutral hydrogen mass measurements, whereas our best-fit model
(
![]() )
is close to reproducing the expected value. This
additional constraint excludes models with high
)
is close to reproducing the expected value. This
additional constraint excludes models with high ![]() and
proves that M31 is a galaxy in which the mean UV radiation
field
heating the dust is very weak. In Sect. 4, we provide
an independent demonstration that UV photons are in general not
dominating
the radiation field in M31, and discuss its implications.
and
proves that M31 is a galaxy in which the mean UV radiation
field
heating the dust is very weak. In Sect. 4, we provide
an independent demonstration that UV photons are in general not
dominating
the radiation field in M31, and discuss its implications.
![\begin{figure}
\par\includegraphics[width=12cm,clip]{fig6.eps}
\end{figure}](/articles/aa/full_html/2009/43/aa12179-09/img144.png)
|
Figure 6:
Upper panels: Correlations between the
logarithm of the TIR emission and the logarithm of the 24 |
| Open with DEXTER | |
In Fig. 6
(upper panels), we show the correlation between the logarithm of the
total IR (TIR) emission and the logarithm of the ![]() m (
m (![]() m) emission.
The TIR was estimated from the Spitzer maps of
M31 using the formula given by Draine & Li (2007)
m) emission.
The TIR was estimated from the Spitzer maps of
M31 using the formula given by Draine & Li (2007)
|
|
= | ||
| (5) |
The
![\begin{displaymath}lg({\rm TIR})=0.89(0.02)~lg(\nu~F_{\nu}^{ns}[24~\mu{\rm m}])-0.1(0.2),
\end{displaymath}](/articles/aa/full_html/2009/43/aa12179-09/img153.png)
|
(6) |
![\begin{displaymath}lg({\rm TIR}) = 1.1(0.01)~lg(\nu~F_{\nu}^{ns}[160\mu{\rm m}])-1.3(0.1).
\end{displaymath}](/articles/aa/full_html/2009/43/aa12179-09/img154.png)
|
(7) |
Although, as shown below, the correlation between the
In Fig. 6
(bottom panels), we show the ![]() m/TIR
(
m/TIR
(![]() m/TIR)
ratios against the TIR intensity. As the TIR
increases, the
m/TIR)
ratios against the TIR intensity. As the TIR
increases, the ![]() m/TIR
ratio increases, but is restricted to
typically between
m/TIR
ratio increases, but is restricted to
typically between ![]() -
-![]() .
In contrast, the
.
In contrast, the ![]() m/TIR
decreases from
m/TIR
decreases from ![]() 65%
to
65%
to ![]() 50%. This
demonstrates that overall the infrared spectrum of M31 is
dominated by cold dust emission in the FIR, although the contribution
of hotter dust components tends to increase for higher TIR emission.
50%. This
demonstrates that overall the infrared spectrum of M31 is
dominated by cold dust emission in the FIR, although the contribution
of hotter dust components tends to increase for higher TIR emission.
3.2 PAHs abundance, 
Figure 7,
shows the ratio R8 of the ![]() m flux
(normalized to the total infrared emission) against the ratio R71of
m flux
(normalized to the total infrared emission) against the ratio R71of
![]() m flux to
m flux to ![]() m flux. As
proposed by Draine et al. (2007), this
diagram can be used to estimate the abundance of
PAHs. We used it to illustrate the uncertainty in our fit by comparing
the result obtained from the total integrated emission of M31
to that obtained in the single regions of our maps, resampled to
the 160
m flux. As
proposed by Draine et al. (2007), this
diagram can be used to estimate the abundance of
PAHs. We used it to illustrate the uncertainty in our fit by comparing
the result obtained from the total integrated emission of M31
to that obtained in the single regions of our maps, resampled to
the 160![]() m
resolution and using exclusively the regions with
S/N > 3. Uncertainties
were
calculated as explained in
Sect. 2.
This selection restricted us to the study of
the ring-spiral structure. The PAHs are stochastically
heated by single photons, thus to derive their abundance one compares
the observations with theoretical models with
m
resolution and using exclusively the regions with
S/N > 3. Uncertainties
were
calculated as explained in
Sect. 2.
This selection restricted us to the study of
the ring-spiral structure. The PAHs are stochastically
heated by single photons, thus to derive their abundance one compares
the observations with theoretical models with
![]() (Draine
et al. 2007,
where
(Draine
et al. 2007,
where ![]() is the parameter that
regulates the power-law intensity radiation field in Eq. (3)).
In
Fig. 7,
we show the theoretical predictions as functions of
the different amount of PAHs and the minimum radiation field
intensity
is the parameter that
regulates the power-law intensity radiation field in Eq. (3)).
In
Fig. 7,
we show the theoretical predictions as functions of
the different amount of PAHs and the minimum radiation field
intensity ![]() .
These results imply that models with large
abundances (>3.19%) and rather low
.
These results imply that models with large
abundances (>3.19%) and rather low ![]() are favored when
comparing with the data. The measurement associated with the
integrated infrared emission (blue point) is not at the center of the
distribution of points produced by the analysis of the pixel-to-pixel
analysis, and in particular is biased towards lower values of R8.
Since our analysis is restricted to the spiral-ring structure, this
result suggests that in the inter-arm regions and/or toward the bulge,
the abundance of PAHs could be lower than we derived, but an accurate
analysis of the distribution of these particles across the entire disk
of M31 is beyond the purpose of this work.
are favored when
comparing with the data. The measurement associated with the
integrated infrared emission (blue point) is not at the center of the
distribution of points produced by the analysis of the pixel-to-pixel
analysis, and in particular is biased towards lower values of R8.
Since our analysis is restricted to the spiral-ring structure, this
result suggests that in the inter-arm regions and/or toward the bulge,
the abundance of PAHs could be lower than we derived, but an accurate
analysis of the distribution of these particles across the entire disk
of M31 is beyond the purpose of this work.
![\begin{figure}
\par\includegraphics[width=8cm,clip]{12179f11.eps}
\end{figure}](/articles/aa/full_html/2009/43/aa12179-09/img159.png)
|
Figure 7:
Ratio R8 of the |
| Open with DEXTER | |
In Fig. 8,
we show the ratio R24 of the
![]() m flux
(normalized to the total infrared emission) against the ratio R71,
a diagram similar to Fig. 7,
but for the 24
m flux
(normalized to the total infrared emission) against the ratio R71,
a diagram similar to Fig. 7,
but for the 24![]() m
map, which is more reliable diagnostic to the radiation field
intensity (Draine et al. 2007).
In this case, we considered only models with PAHs abundances
>3.19%,
since for the analyzed regions these are the models that agree more
closely with observations (Fig. 7). For the
bulk of
the points, and the total
integrated flux measurement,
m
map, which is more reliable diagnostic to the radiation field
intensity (Draine et al. 2007).
In this case, we considered only models with PAHs abundances
>3.19%,
since for the analyzed regions these are the models that agree more
closely with observations (Fig. 7). For the
bulk of
the points, and the total
integrated flux measurement, ![]() can in general be considered
can in general be considered
![]() 0.05. Using
the equation
0.05. Using
the equation
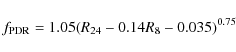
|
(8) |
taken from Draine & Li (2007) and the observed ratios R8 and R24 defined above, we determined that the fraction of the total dust luminosity radiated by dust grains in regions with U > 102 (
4 Which sources are responsible for the dust heating in M31?
![\begin{figure}
\par\includegraphics[width=6.7cm,clip]{12179f12.eps}
\includegr...
...]{12179f13.eps}
\includegraphics[width=6.7cm,clip]{12179f14.eps}
\end{figure}](/articles/aa/full_html/2009/43/aa12179-09/img163.png)
|
Figure 8:
Ratio R24 of the 24 |
| Open with DEXTER | |
The analysis of the infrared spectrum presented in Sect. 3 allows to conclude that the infrared spectrum of M31 can be explained by diffuse dust emission. Nevertheless, on the basis of that, we cannot understand which stellar population is responsible for the dust heating process. In particular, we want to know where the dust in M31 is predominantly heated by young populations (age <1 Gyr) or where older populations (age >1 Gyr) play also an important role in the dust-heating process. As shown below, the answer to this question is of crucial importance to the measurement of several important parameters, e.g., dust attenuation and the SFR.
![\begin{figure}
\par\includegraphics[width=13cm,clip]{12179f15.eps}
\end{figure}](/articles/aa/full_html/2009/43/aa12179-09/img164.png)
|
Figure 9:
|
| Open with DEXTER | |
In the following, we used the observational maps of M31
resampled to 40
![]() as
described in Sect. 2,
and considered all the regions in which the S/N
> 1 in all the maps.
as
described in Sect. 2,
and considered all the regions in which the S/N
> 1 in all the maps.
It should also be noted that the results we obtained are based on the theoretical models of Kong et al. (2004) and Cortese et al. (2008). It is worth saying that alternative interpretations may exist of the observational data we present. In particular, models considering modifications of the canonical attenuation laws have been proposed (e.g., Inoue 2005, 2006, see later in this section).
The model of Kong et al. (2004) is based
on
the Bruzual & Charlot (2003)
population synthesis code, and assumes an exponential star formation
history (SFH) and a power-law absorption law, distinguishing between
young (<
![]() )
stars embedded in their birth clouds and older stars that have migrated
into the ISM. The model of Cortese et al. (2008) is
also
based on the Bruzual & Charlot (2003)
population
syntesis code, but assumes an LMC attenuation law, and that both stars
and dust were homogeneously distributed in a plane-parallel (sandwich)
geometry. They also adopted a star formation history ``a
la Sandage'' in the formalism of Gavazzi et al. (2002)
)
stars embedded in their birth clouds and older stars that have migrated
into the ISM. The model of Cortese et al. (2008) is
also
based on the Bruzual & Charlot (2003)
population
syntesis code, but assumes an LMC attenuation law, and that both stars
and dust were homogeneously distributed in a plane-parallel (sandwich)
geometry. They also adopted a star formation history ``a
la Sandage'' in the formalism of Gavazzi et al. (2002)
|
(9) |
where SFR is the star formation rate per unit mass, t is the galaxy age (in Gyr, assuming t= 13 Gyr at present epoch), and
We also note that the model predictions should not be considered reliable in regions where old stars are likely to dominate the UV flux (mostly in the bulge region for M31).
We first investigated the
![]() versus
versus ![]() (the UV slope) relationship for the analyzed regions as shown in
Fig. 9.
The solid line represents the fit obtained by Kong et al. (2004) for the
50 starburst galaxies in their sample, which represents the
so-called
(the UV slope) relationship for the analyzed regions as shown in
Fig. 9.
The solid line represents the fit obtained by Kong et al. (2004) for the
50 starburst galaxies in their sample, which represents the
so-called ![]() relationship for starburst galaxies (Meurer et al. 1999). We
adopted the same definition as Kong et al. (2004) in
calculating
relationship for starburst galaxies (Meurer et al. 1999). We
adopted the same definition as Kong et al. (2004) in
calculating ![]()
|
(10) |
where
The small black points are the
values of the ![]() and
and ![]() obtained in the analyzed
regions of M31. A positive correlation is visible, but does
not follow the relation found for starburst galaxies. As can
be naively expected, going towards negative slopes and bluer colors
our observations imply similar
obtained in the analyzed
regions of M31. A positive correlation is visible, but does
not follow the relation found for starburst galaxies. As can
be naively expected, going towards negative slopes and bluer colors
our observations imply similar
![]() and
and ![]() values with respect
to the starburst galaxies relationship, whereas redder regions having
differently showing typically lower values of
values with respect
to the starburst galaxies relationship, whereas redder regions having
differently showing typically lower values of
![]() for
equivalent
for
equivalent ![]() .
This agrees with Kong et al. (2004), who
showed
the results coming from the analysis of their sample of normal
star-forming galaxies as well and found that these objects
typically have lower values of
.
This agrees with Kong et al. (2004), who
showed
the results coming from the analysis of their sample of normal
star-forming galaxies as well and found that these objects
typically have lower values of
![]() for
fixed UV-color than
predicted by the
for
fixed UV-color than
predicted by the ![]() relation, with a large scatter of values. Other authors have questioned
the application of the
relation, with a large scatter of values. Other authors have questioned
the application of the ![]() relationship to normal star-forming galaxies, suggesting that these
systems have lower dust attenuations than can be inferred from the
relationship to normal star-forming galaxies, suggesting that these
systems have lower dust attenuations than can be inferred from the
![]() relation
(Salim et al. 2007).
relation
(Salim et al. 2007).
Following the notation of Kong et al. (2004), we plot
in
Fig. 9
the lines of constant ratio of present to past-averaged star formation
rate assuming an exponentially declining star formation history (b
parameter, blue short-dashed lines), and constant attenuation (
![]() ,
red long-dashed lines). This comparison suggests that in the
M31 regions, population gradients are present but there are
similar amounts of dust attenuation, our observational points being
elongated along the direction indicated by the bands of equal
attenuation.
,
red long-dashed lines). This comparison suggests that in the
M31 regions, population gradients are present but there are
similar amounts of dust attenuation, our observational points being
elongated along the direction indicated by the bands of equal
attenuation.
Since color variations seem to be caused by a spread of ages,
it is more convenient to adopt a wider color baseline such as the
![]()
![]() color. Cortese
et al. (2008)
provided a detailed discussion of the age dependence of
the
color. Cortese
et al. (2008)
provided a detailed discussion of the age dependence of
the ![]() ratio, colors, and attenuations. In accordance with
their results, for
ratio, colors, and attenuations. In accordance with
their results, for
![]() ,
the energy absorbed by
the dust at
,
the energy absorbed by
the dust at ![]() is approximately equal to the energy
absorbed at
is approximately equal to the energy
absorbed at ![]() (as inferred from their Fig. 2 and
Table 1). This corresponds to
(as inferred from their Fig. 2 and
Table 1). This corresponds to
![]() Gyr
as defined above, and thus the stellar populations contributing to the
SED have an age >4.5 Gyr.
Gyr
as defined above, and thus the stellar populations contributing to the
SED have an age >4.5 Gyr.
![\begin{figure}
\par\includegraphics[width=8.5cm,clip]{12179f16.eps}\par\includegraphics[width=7.5cm,clip]{12179f17.eps}
\end{figure}](/articles/aa/full_html/2009/43/aa12179-09/img186.png)
|
Figure 10:
Upper panel:
|
| Open with DEXTER | |
In Fig. 10,
we show the ![]() ratio against the
ratio against the
![]() color,
for regions with S/N > 1
across the 10 kpc ring
(
color,
for regions with S/N > 1
across the 10 kpc ring
(
![]() ).
The positive correlation between these variables is also clearly
visible in this diagram. Moreover, for the color range
).
The positive correlation between these variables is also clearly
visible in this diagram. Moreover, for the color range
![]() it
is clearly evident that in a large number of
regions, old populations dominate the dust heating process. As shown
in Fig. 10
(lower left panel), the mean
it
is clearly evident that in a large number of
regions, old populations dominate the dust heating process. As shown
in Fig. 10
(lower left panel), the mean ![]() in
the analyzed regions of M31 derived with this method is
in
the analyzed regions of M31 derived with this method is
![]() ,
where the error is the standard
deviation. If the starburst scenario is considered, we obtain the
result shown in the lower right panel of Fig. 10, where
the mean attenuation is
,
where the error is the standard
deviation. If the starburst scenario is considered, we obtain the
result shown in the lower right panel of Fig. 10, where
the mean attenuation is
![]() .
Neglecting the dust heating age dependence would imply a mean
attenuation that is 100% higher and a scatter 150% larger, since in
this case the large color changes would be attributed entirely to the
reddening.
.
Neglecting the dust heating age dependence would imply a mean
attenuation that is 100% higher and a scatter 150% larger, since in
this case the large color changes would be attributed entirely to the
reddening.
In Fig. 10,
we overplotted two lines of constant
attenuation corresponding to
![]() and
and
![]() as
indicated by the labels. The shape of these lines reflects the age
dependence of the dust heating as modeled by Cortese et al.
(2008). For blue
as
indicated by the labels. The shape of these lines reflects the age
dependence of the dust heating as modeled by Cortese et al.
(2008). For blue
![]() )
or red colors
)
or red colors ![]() ,
the attenuation lines tend to be parallel to
the color axis, and thus independent of the color. This because
in these color ranges, the intrinsic spectral energy
distribution of the populations heating the dust is not
expected to change appreciably with age towards the very young (blue)
or
very old (red) side. On the other hand, in the range
,
the attenuation lines tend to be parallel to
the color axis, and thus independent of the color. This because
in these color ranges, the intrinsic spectral energy
distribution of the populations heating the dust is not
expected to change appreciably with age towards the very young (blue)
or
very old (red) side. On the other hand, in the range
![]() ,
which corresponds to most of our
observations, age variations contribute significantly to color
changes, and older populations appear intrinsically redder thus
shifting the
,
which corresponds to most of our
observations, age variations contribute significantly to color
changes, and older populations appear intrinsically redder thus
shifting the ![]() ratio towards higher values for equal amounts
of attenuation, than to bluer regions. In the following, we
tried to disentangle the effects of age and reddening on
the observed colors and
ratio towards higher values for equal amounts
of attenuation, than to bluer regions. In the following, we
tried to disentangle the effects of age and reddening on
the observed colors and
![]() ratios.
ratios.
At first, we converted the colors to the values of ![]() (the time, expressed in Gyr, at which the star formation rate reached
its highest value over the whole galaxy history, assuming
(the time, expressed in Gyr, at which the star formation rate reached
its highest value over the whole galaxy history, assuming
![]() at
present epoch) by means of
at
present epoch) by means of
| (11) |
taken from Table 2 of Cortese et al. (2008). The colors in Fig. 10 are defined as a function of the value of
![\begin{figure}
\par\includegraphics[width=8.8cm,clip]{12179f18.eps}
\end{figure}](/articles/aa/full_html/2009/43/aa12179-09/img199.png)
|
Figure 11:
|
| Open with DEXTER | |
From another point of view, we show in Fig. 11 the
same
diagram of Fig. 10,
separating regions of low and high TIR emission as indicated by the
labels and the colors. We considered 4 equally sized bins of TIR
emission in the range
![]() .
From Fig. 11,
it appears that towards redder colors along the regions of constant TIR
emission, the
.
From Fig. 11,
it appears that towards redder colors along the regions of constant TIR
emission, the ![]() ratio increases. Since the TIR emission is constant, the FUV emission
must decrease. Nevertheless, if the lower FUV emission was caused by
higher attenuations, the TIR emission should have increased
accordingly, which is not observed. Thus, the color change must be
caused by an intrinsic lower emission in the FUV band, which could be
indicative of a population gradient. Strictly speaking, this
interpretation is valid for an homogeneous layer of stars embedded in
an homogeneous optically thin layer of dust. In a real galaxy, dust and
stars (especially recently formed stars) are likely to have more clumpy
and inhomogeneous distributions. Otherwise, studying two of the more
conspicuous and more discrete dust clouds listed in the
M31 atlas (Hodge 1980);
Hodge & Kennicutt (1982)
derived average extinctions of
ratio increases. Since the TIR emission is constant, the FUV emission
must decrease. Nevertheless, if the lower FUV emission was caused by
higher attenuations, the TIR emission should have increased
accordingly, which is not observed. Thus, the color change must be
caused by an intrinsic lower emission in the FUV band, which could be
indicative of a population gradient. Strictly speaking, this
interpretation is valid for an homogeneous layer of stars embedded in
an homogeneous optically thin layer of dust. In a real galaxy, dust and
stars (especially recently formed stars) are likely to have more clumpy
and inhomogeneous distributions. Otherwise, studying two of the more
conspicuous and more discrete dust clouds listed in the
M31 atlas (Hodge 1980);
Hodge & Kennicutt (1982)
derived average extinctions of
![]() mag
(with a maximum value of
mag
(with a maximum value of ![]() mag)
and
mag)
and ![]() mag
(maximum
mag
(maximum ![]() mag)
for D307 and D441, respectively, indicating that the majority of all
the other clouds should have smaller amounts of extinction. Other
studies confirm the idea that the interstellar medium in M31
is generally optically thin. Fan et al. (2007) derived
reddening values towards 443 M31's catalogued globular
clusters, find that more than half of them are affected by a reddening
mag)
for D307 and D441, respectively, indicating that the majority of all
the other clouds should have smaller amounts of extinction. Other
studies confirm the idea that the interstellar medium in M31
is generally optically thin. Fan et al. (2007) derived
reddening values towards 443 M31's catalogued globular
clusters, find that more than half of them are affected by a reddening
![]() mag
with an average value of
mag
with an average value of
![]() (see also
Barmby et al. 2000).
Regarding the homogeneity of the dust distribution, Inoue (2005, 2006)
investigating
the attenuation law for clumpy spatial distributions of dust and
(young) stars, proposed different explanations of the redder UV
colors of normal galaxies with respect to starburst galaxies of fixed
FIR to FUV ratios, which are not based on population gradients. These
alternative models can be summarized as: (i) models where the
attenuation law has a stronger dependence on wavelength than the
canonical attenuation laws as a result of an age-selective attenuation
of young stars in clumpy structures with respect to old stars;
(ii) models where the attenuation law has no attenuation bump
at 2175 Å; (iii) models with a bump at 2175 Å, but of
smaller albedo at shorter wavelengths (except for the bump range).
While we did not try to apply these models to our data, we observe that
at least the first two scenarios do not seem to be applicable to
M31. Bianchi et al. (1996) found
that
the M31 extinction curve is very similar to the average
Galactic extinction law and a possible reduction in the 2175 Å
bump is significant only at the 1
(see also
Barmby et al. 2000).
Regarding the homogeneity of the dust distribution, Inoue (2005, 2006)
investigating
the attenuation law for clumpy spatial distributions of dust and
(young) stars, proposed different explanations of the redder UV
colors of normal galaxies with respect to starburst galaxies of fixed
FIR to FUV ratios, which are not based on population gradients. These
alternative models can be summarized as: (i) models where the
attenuation law has a stronger dependence on wavelength than the
canonical attenuation laws as a result of an age-selective attenuation
of young stars in clumpy structures with respect to old stars;
(ii) models where the attenuation law has no attenuation bump
at 2175 Å; (iii) models with a bump at 2175 Å, but of
smaller albedo at shorter wavelengths (except for the bump range).
While we did not try to apply these models to our data, we observe that
at least the first two scenarios do not seem to be applicable to
M31. Bianchi et al. (1996) found
that
the M31 extinction curve is very similar to the average
Galactic extinction law and a possible reduction in the 2175 Å
bump is significant only at the 1![]() level. Similar results were also reached in previous studies (e.g.,
Walterbos & Kennicutt 1988).
As for the third class of models, further studies of the wavelength
dependence of the albedo are required. We also note that these
considerations do not imply that clumpy structures with embedded young
stars do not exist in M31, but it could be that most of the
dust in M31 is not located in these structures. From counts
of dark nebulae across the disk of M31, Hodge &
Kennicutt (1982)
found that the major dust lanes visible in the optical should account
for
level. Similar results were also reached in previous studies (e.g.,
Walterbos & Kennicutt 1988).
As for the third class of models, further studies of the wavelength
dependence of the albedo are required. We also note that these
considerations do not imply that clumpy structures with embedded young
stars do not exist in M31, but it could be that most of the
dust in M31 is not located in these structures. From counts
of dark nebulae across the disk of M31, Hodge &
Kennicutt (1982)
found that the major dust lanes visible in the optical should account
for ![]()
![]() of the total dust mass content. Nieten et al. (2007) measured
a strong correlation between the most prominent dust lanes and dense
molecular clouds traced by strong CO emission lines, but concluded that
molecular gas in M31 represents only
of the total dust mass content. Nieten et al. (2007) measured
a strong correlation between the most prominent dust lanes and dense
molecular clouds traced by strong CO emission lines, but concluded that
molecular gas in M31 represents only ![]() 7% of the total neutral gas
content in M31, and that dust also appears correlated with
atomic gas in M31, which is distributed in more extended
regions outside of the densest clouds in the spiral-ring structure. In
Sect. 3.1,
we found that only a fraction <7% of the TIR originates in the hot
dust component emission at 24
7% of the total neutral gas
content in M31, and that dust also appears correlated with
atomic gas in M31, which is distributed in more extended
regions outside of the densest clouds in the spiral-ring structure. In
Sect. 3.1,
we found that only a fraction <7% of the TIR originates in the hot
dust component emission at 24 ![]() m associated with young star-forming regions.
Finally, it is unlikely that a large fraction of the M31's
dust mass is in very cold dark clouds (T <
16 K), as the total M31 dust mass we derived in
Sect. 3.1
from dust diffuse emission models was close (1
m associated with young star-forming regions.
Finally, it is unlikely that a large fraction of the M31's
dust mass is in very cold dark clouds (T <
16 K), as the total M31 dust mass we derived in
Sect. 3.1
from dust diffuse emission models was close (1![]() -5
-5![]() )
to the estimate based on neutral gas measurements. We conclude that the
interpretation of Fig. 11 in
terms of
population gradients must be considered carefully and is in need of
further investigation, but it appears reasonable for regions dominated
by diffuse dust emission away from large star-forming complexes (in
this case, we recall the criteria that we applied in Sect. 2 against
the
selection of HII regions). The attenuation within bands of
equal TIR emission appears to decrease towards redder colors
accordingly to the predictions of Cortese et al. (2008). This
could
also be caused by a population gradient, since older populations would
tend to be intrinsically less attenuated than younger ones, because of
their intrinsically redder spectral energy distribution, at least in
the region where the age effect is maximal
)
to the estimate based on neutral gas measurements. We conclude that the
interpretation of Fig. 11 in
terms of
population gradients must be considered carefully and is in need of
further investigation, but it appears reasonable for regions dominated
by diffuse dust emission away from large star-forming complexes (in
this case, we recall the criteria that we applied in Sect. 2 against
the
selection of HII regions). The attenuation within bands of
equal TIR emission appears to decrease towards redder colors
accordingly to the predictions of Cortese et al. (2008). This
could
also be caused by a population gradient, since older populations would
tend to be intrinsically less attenuated than younger ones, because of
their intrinsically redder spectral energy distribution, at least in
the region where the age effect is maximal
![]() .
We note nevertheless that the observed color could be also biased
towards redder values especially in the bulge region where the geometry
of the dust and star clearly deviates from the simple sandwich model of
Cortese et al. (2008).
We discuss this potential bias in more details in the next section.
Another interesting point about Fig. 11, is
that
towards higher
.
We note nevertheless that the observed color could be also biased
towards redder values especially in the bulge region where the geometry
of the dust and star clearly deviates from the simple sandwich model of
Cortese et al. (2008).
We discuss this potential bias in more details in the next section.
Another interesting point about Fig. 11, is
that
towards higher ![]() ratios, the TIR emission increases (whereas the
ratios, the TIR emission increases (whereas the ![]() emission remains almost constant), which should infer higher
attenuation values because of the large amount of absorbed energy for a
fixed observed
emission remains almost constant), which should infer higher
attenuation values because of the large amount of absorbed energy for a
fixed observed ![]() energy, which is what the model predicts. We have thus the following
interpretation of the diagram in Fig. 11.
While the
large color variation of the analyzed regions seems to be caused by a
population gradient in the stars heating the dust, the spread in the
energy, which is what the model predicts. We have thus the following
interpretation of the diagram in Fig. 11.
While the
large color variation of the analyzed regions seems to be caused by a
population gradient in the stars heating the dust, the spread in the
![]() values
for a fixed color seems instead to be caused by the differential
reddening of regions with similar underlaying stellar populations.
values
for a fixed color seems instead to be caused by the differential
reddening of regions with similar underlaying stellar populations.
![\begin{figure}
\par\includegraphics[width=8.8cm,clip]{12179f19.eps}
\end{figure}](/articles/aa/full_html/2009/43/aa12179-09/img208.png)
|
Figure 12:
Logarithmic |
| Open with DEXTER | |
Table
3:
Average values and standard deviations (in parenthesis) in
![]() ,
,
![]() and
and
![]() in each
annular region shown in Fig. 12.
in each
annular region shown in Fig. 12.
We also investigated the spatial distribution of the
![]() across the
disk of M31. We considered nine
across the
disk of M31. We considered nine
![]() -wide
radial
bins from the center of M31 out to
-wide
radial
bins from the center of M31 out to
![]() as
shown in Fig. 2,
and imposed a S/N > 1. In
Fig. 12,
we present the logarithmic
as
shown in Fig. 2,
and imposed a S/N > 1. In
Fig. 12,
we present the logarithmic
![]() ratios
versus the
ratios
versus the
![]() colors
obtained in each radial bin. In general, it appears that these
observable quantities are positively correlated across the entire disk
of M31. Only in the innermost annulus was it impossible to
verify the positive correlation of these variables because of the few
regions analyzed. We fit the
colors
obtained in each radial bin. In general, it appears that these
observable quantities are positively correlated across the entire disk
of M31. Only in the innermost annulus was it impossible to
verify the positive correlation of these variables because of the few
regions analyzed. We fit the
![]() ratios
versus
ratios
versus ![]() colors in each radial bin with a linear model
colors in each radial bin with a linear model
![]() .
We considered separately the uncertainties along the x
and y axis directions and considered the
mean value of the derived parameters and their semi-difference as
estimates of the best-fit model parameters (a
and b) and uncertainties. In Table 3,
we
report the result of the fit and other useful quantities.
.
We considered separately the uncertainties along the x
and y axis directions and considered the
mean value of the derived parameters and their semi-difference as
estimates of the best-fit model parameters (a
and b) and uncertainties. In Table 3,
we
report the result of the fit and other useful quantities.
As also shown in Fig. 13, the mean attenuation in each radial bin varies reaching a maximum near the 10 kpc ring, while it seems to decrease faster towards the inner regions of M31 than in the outer regions.
These results are also shown in the color maps of Fig. 14. As dicussed above twhile he model adopted here could be less reliable in the inner part of the galaxy because of deviations in the dust and star distribution from the assumed geometry, the trend in and the values of the mean attenuations derived with this method agree with previous studies as discussed in the next section.
The existence of a correlation between the
![]() ratios
and the
colors that we have found needs a final remark. It is important to
recall that the theoretical calculations of Kong et al. (2004) and
Cortese
et al. (2008)
do not necessarily imply the
existence of any correlation between these observables. Nonetheless, we
should consider that in this case we are study regions inside onegalaxy,
and thus we should expect a more uniform and homogeneous
behavior.
ratios
and the
colors that we have found needs a final remark. It is important to
recall that the theoretical calculations of Kong et al. (2004) and
Cortese
et al. (2008)
do not necessarily imply the
existence of any correlation between these observables. Nonetheless, we
should consider that in this case we are study regions inside onegalaxy,
and thus we should expect a more uniform and homogeneous
behavior.
5 Discussion
The models of Cortese et al. (2008)
assume a
simple plane-parallel (sandwich) geometry for the dust and star
distribution. Even if the fractional scale height between dust and the
stars is allowed to vary with wavelength, no radial dependence is
assumed. The method is based solely on the relationship between two
observed emission ratios, and is therefore expected to be sensitive to
light contamination from distant sources and variations in geometry.
Since, if the geometry is not plane parallel the radiation field
experienced by the dust can significantly differ from that naively
measured by the outside observer, the observed color from which the age
of the underlying population is derived could be biased towards redder
values in regions where older stellar populations are less embedded in
the dust. This bias should be strongest in the inner regions of the
galaxy as the result of bulge light contamination. Regions with
![]() in
Fig. 12
have redder colors and higher TIR/FUV ratios than the outer regions.
For r>12 kpc, the color range
remains
almost constant, although the TIR/FUV ratio decreases. In the presence
of the above mentioned observational bias, the value of the attenuation
derived from the model may have been underestimated in the inner
regions. Moreover, in the innermost radial bin (r<2 kpc),
old stars can produce a significant fraction of the GALEX-UV emission,
and thus the model prediction is likely to be unreliable in that
region.
in
Fig. 12
have redder colors and higher TIR/FUV ratios than the outer regions.
For r>12 kpc, the color range
remains
almost constant, although the TIR/FUV ratio decreases. In the presence
of the above mentioned observational bias, the value of the attenuation
derived from the model may have been underestimated in the inner
regions. Moreover, in the innermost radial bin (r<2 kpc),
old stars can produce a significant fraction of the GALEX-UV emission,
and thus the model prediction is likely to be unreliable in that
region.
![\begin{figure}
\par\includegraphics[width=8.8cm,clip]{12179f20.eps}
\end{figure}](/articles/aa/full_html/2009/43/aa12179-09/img214.png)
|
Figure 13:
Average FUV (
|
| Open with DEXTER | |
![\begin{figure}
\par\includegraphics[width=18cm]{12179f21.eps}
\includegraphics...
...h=18cm]{12179f22.eps}
\includegraphics[width=18cm]{12179f23.eps}
\end{figure}](/articles/aa/full_html/2009/43/aa12179-09/img217.png)
|
Figure 14:
From top to bottom:
|
| Open with DEXTER | |
![\begin{figure}
\par\mbox{\includegraphics[width=8cm,clip]{12179f24.eps}\includegraphics[width=8cm,clip]{12179f25.eps} }\end{figure}](/articles/aa/full_html/2009/43/aa12179-09/img218.png)
|
Figure 15:
Left panel:
|
| Open with DEXTER | |
To estimate how the integrated light along the line of sight could have
affected our analysis and consequently biased the derived attenuations,
we compared the ![]() color along the major and minor axis, as shown in Fig. 15.
Each
point in these figures is the average value of the colors
(attenuations) inside a 200''-wide
(0.75 kpc) stripe centered on the major and minor-axis
corresponding to each of the 2 kpc annular regions shown in
Fig. 2.
Any effect of bias should be more evident along the minor than the
major axis because of the inclination of M31. At the same
galactocentric radius of the disk, the line of sight passes through
more central regions of the bulge along the minor axis than along the
major axis. If the described bias affects the derived parameters, it is
expected that at the same galactocentric radius the adopted method will
predict lower attenuations along the minor axis than on the major axis.
We calculated the mean color and attenuation difference inside the
10 kpc ring excluding the region around +5 kpc on the
near-side of the galaxy along the minor axis because of the presence of
the inner spiral arm with enhanced TIR emission and attenuation. In
Fig. 15
(left panel), we see that the color profile along the minor axis is
systematically redder than along the major axis by on average
color along the major and minor axis, as shown in Fig. 15.
Each
point in these figures is the average value of the colors
(attenuations) inside a 200''-wide
(0.75 kpc) stripe centered on the major and minor-axis
corresponding to each of the 2 kpc annular regions shown in
Fig. 2.
Any effect of bias should be more evident along the minor than the
major axis because of the inclination of M31. At the same
galactocentric radius of the disk, the line of sight passes through
more central regions of the bulge along the minor axis than along the
major axis. If the described bias affects the derived parameters, it is
expected that at the same galactocentric radius the adopted method will
predict lower attenuations along the minor axis than on the major axis.
We calculated the mean color and attenuation difference inside the
10 kpc ring excluding the region around +5 kpc on the
near-side of the galaxy along the minor axis because of the presence of
the inner spiral arm with enhanced TIR emission and attenuation. In
Fig. 15
(left panel), we see that the color profile along the minor axis is
systematically redder than along the major axis by on average ![]() 0.5 mag.
This implies that the attenuation appear to be systematically lower on
the minor axis by
0.5 mag.
This implies that the attenuation appear to be systematically lower on
the minor axis by ![]() mag (Fig. 15
right panel).
mag (Fig. 15
right panel).
Because the major axis also should be affected by this
observational bias, the effect should be in principle larger than
this. Considering the radial bin at 11kpc and the one at 3 kpc
and considering the color shift toward redder values in the inner bin
as being totally due
to the bias effect, we estimated the average attenuation at
3 kpc to be higher by ![]() 0.84 mag
(Fig. 16)
than that derived from the observed colors. This value should be
considered as an upper limit because the color shift should be in
partially caused by intrinsically
redder and older populations than those in the ring, where most of the
star formation
in M31 is taking place. Nevertheless, even after applying
such a significant bias
correction, the ring would remain distinctive evident as a maximum of
attenuation, as shown in Fig. 16.
On
the other hand, this exercise highlight the need for a more accurate
model to properly account for what happens in the innermost regions.
0.84 mag
(Fig. 16)
than that derived from the observed colors. This value should be
considered as an upper limit because the color shift should be in
partially caused by intrinsically
redder and older populations than those in the ring, where most of the
star formation
in M31 is taking place. Nevertheless, even after applying
such a significant bias
correction, the ring would remain distinctive evident as a maximum of
attenuation, as shown in Fig. 16.
On
the other hand, this exercise highlight the need for a more accurate
model to properly account for what happens in the innermost regions.
Xu & Helou (1996)
developed a dust heating/cooling model for
M31 based on a radiative transfer code that assumes a
sandwich geometry for stars and dust as in Cortese et al. (2008). They
found
that the mean optical depth ![]() as viewed from an inclination angle of 77
as viewed from an inclination angle of 77![]() ,
increased with radius from
,
increased with radius from
![]() at
at
![]() ,
reaching a peak of
,
reaching a peak of ![]() near
near ![]() ,
and remaining quite flat out to
,
and remaining quite flat out to
![]() .
We used Eqs. (2)-(4) of Cortese et al. (2008) to
convert the
.
We used Eqs. (2)-(4) of Cortese et al. (2008) to
convert the ![]() values of Xu & Helou (1996) into
values of Xu & Helou (1996) into
![]() magnitudes
and obtained
magnitudes
and obtained
![]() at
at
![]() ,
and
,
and ![]() near
near ![]() . These results are in good
agreement with those shown in Fig. 13
and in
Table 3,
where we present average values and standard deviations (in
parenthesis) in
. These results are in good
agreement with those shown in Fig. 13
and in
Table 3,
where we present average values and standard deviations (in
parenthesis) in ![]() ,
,
![]() and
and
![]() in each annular region shown in Fig. 12. The
fifth
and sixth columns of Table 3
show the
linear regression parameters obtained by fitting the data in
Fig. 12
(bottom panel) with the relation
in each annular region shown in Fig. 12. The
fifth
and sixth columns of Table 3
show the
linear regression parameters obtained by fitting the data in
Fig. 12
(bottom panel) with the relation
![]() .
The last column shows the number of regions used in each annulus. The
radial trend that we derived peaks close to
.
The last column shows the number of regions used in each annulus. The
radial trend that we derived peaks close to
![]() and
appears to remain quite flat in the outer regions and to decrease
rapidle with decreasing radius in the inner regions. While, considering
the uncertainties in the
and
appears to remain quite flat in the outer regions and to decrease
rapidle with decreasing radius in the inner regions. While, considering
the uncertainties in the ![]() estimate, these results are consistent with those of Xu & Helou
(1996),
some
differences are evident. In the inner side of the ring, our average
attenuations tend to be lower (in the range
estimate, these results are consistent with those of Xu & Helou
(1996),
some
differences are evident. In the inner side of the ring, our average
attenuations tend to be lower (in the range ![]()
![]() )
with respect to the results of those authors. Although the same
sandwich geometry was adopted, the two approaches differ in various
aspects. At first, Xu & Helou (1996) did not account
for the presence of population gradients. While this assumption was
motivated by considering that the (V-R)
color of M31 appeared rather constant in the disk of
M31 (Walterbos & Kennicutt 1988),
the
results shown in the previous section, based on a far wider color
baseline, indicate that a population gradient is indeed present across
the disk of M31. In the absence of population gradients, as
discussed in the previous section, one tends to overestimate the
attenuation in the region where the age effect is maximal (
)
with respect to the results of those authors. Although the same
sandwich geometry was adopted, the two approaches differ in various
aspects. At first, Xu & Helou (1996) did not account
for the presence of population gradients. While this assumption was
motivated by considering that the (V-R)
color of M31 appeared rather constant in the disk of
M31 (Walterbos & Kennicutt 1988),
the
results shown in the previous section, based on a far wider color
baseline, indicate that a population gradient is indeed present across
the disk of M31. In the absence of population gradients, as
discussed in the previous section, one tends to overestimate the
attenuation in the region where the age effect is maximal (
![]() ),
and this is independent of the observational biases discussed
previously (which should affect both methods in a similar way). We note
that in the inner region at 2 kpc, and thus where most of the
regions have
),
and this is independent of the observational biases discussed
previously (which should affect both methods in a similar way). We note
that in the inner region at 2 kpc, and thus where most of the
regions have ![]() ,
the two models appear to be in perfect agreement. On the other hand,
the model of Xu & Helou (1996)
solves the radiative transfer problem and fully accounts for the
effects of the dust scattering, which are neglected by Cortese
et al. (2008).
If the scatter was neglected for a fixed observed color, we would have
a lower
,
the two models appear to be in perfect agreement. On the other hand,
the model of Xu & Helou (1996)
solves the radiative transfer problem and fully accounts for the
effects of the dust scattering, which are neglected by Cortese
et al. (2008).
If the scatter was neglected for a fixed observed color, we would have
a lower ![]() ratio and would thus predict a lower attenuation. While both of these
effects could have contributed to the differences that we see in
Fig. 13,
the generally good agreement between these results infers that these
effects do not dramatically alter our conclusions. As we have shown in
the previous sections, old populations dominate the radiation field, so
good results can be obtained if the color is fixed to the one of an old
population as done in Xu & Helou (1996). The
scattering
should affect mostly young stars embedded in the dust, and thus mainly
in the spiral-ring structure, but since the radiation field of these
stars never dominates the effect should be limited. Finally, we recall
that we are comparing results obtained at different spatial resolutions
(
ratio and would thus predict a lower attenuation. While both of these
effects could have contributed to the differences that we see in
Fig. 13,
the generally good agreement between these results infers that these
effects do not dramatically alter our conclusions. As we have shown in
the previous sections, old populations dominate the radiation field, so
good results can be obtained if the color is fixed to the one of an old
population as done in Xu & Helou (1996). The
scattering
should affect mostly young stars embedded in the dust, and thus mainly
in the spiral-ring structure, but since the radiation field of these
stars never dominates the effect should be limited. Finally, we recall
that we are comparing results obtained at different spatial resolutions
(
![]() in
our case, and
in
our case, and ![]() in the case of Xu & Helou 1996)
and that the accuracy of Spitzer, GALEX, and SDSS maps is certainly
superior to the measurements used by Xu & Helou (1996). In
particular,
using IRAS images the cold dust emission and thus the TIR
emission should be less accurately constrained than using Spitzer data,
since the longest wavelength measurement of IRAS is at 100
in the case of Xu & Helou 1996)
and that the accuracy of Spitzer, GALEX, and SDSS maps is certainly
superior to the measurements used by Xu & Helou (1996). In
particular,
using IRAS images the cold dust emission and thus the TIR
emission should be less accurately constrained than using Spitzer data,
since the longest wavelength measurement of IRAS is at 100![]() m, whereas
for Spitzer it is at 160
m, whereas
for Spitzer it is at 160![]() m
close to the FIR spectrum peak of M31 (Fig. 3).
In
Fig. 13,
we also show the comparison of our results with those of Hodge
& Lee (1988),
who used two color diagrams to determine the average reddenings of
5 fields at different M31 galactocentric distances.
We converted the reddening values of Hodge & Lee (1988) to the
optical depths along the line of sight (
m
close to the FIR spectrum peak of M31 (Fig. 3).
In
Fig. 13,
we also show the comparison of our results with those of Hodge
& Lee (1988),
who used two color diagrams to determine the average reddenings of
5 fields at different M31 galactocentric distances.
We converted the reddening values of Hodge & Lee (1988) to the
optical depths along the line of sight (
![]() )
by multiplying by a factor of
)
by multiplying by a factor of
![]() as
in Xu & Helou (1996),
then we proceeded as before to convert the
as
in Xu & Helou (1996),
then we proceeded as before to convert the
![]() in
in
![]() .
Although the radial trend always peaks at 10 kpc, a larger
scatter with respect to the results of Xu &
Helou (1996)
is
visible. This may be caused by both ourselves and Xu & Helou (1996) analyzing
radial
averages, whereas the results of Hodge & Lee (1988) are
based on
5 selected regions.
.
Although the radial trend always peaks at 10 kpc, a larger
scatter with respect to the results of Xu &
Helou (1996)
is
visible. This may be caused by both ourselves and Xu & Helou (1996) analyzing
radial
averages, whereas the results of Hodge & Lee (1988) are
based on
5 selected regions.
![\begin{figure}
\par\includegraphics[width=8cm,clip]{12179f26.eps}
\end{figure}](/articles/aa/full_html/2009/43/aa12179-09/img233.png)
|
Figure 16: Upper panel: observed colors and TIR/FUV ratios for regions in the 3 kpc radial bin (big red points) and in the 11 kpc radial bin (small blue points). Lower panel: same as upper panel, but the observed colors in the inner radial bin are shifted by the average color difference with respect to the best-fit linear model in the outer ring (blue line). |
| Open with DEXTER | |
![\begin{figure}
\par\includegraphics[width=15cm,clip]{12179f27.eps}
\end{figure}](/articles/aa/full_html/2009/43/aa12179-09/img234.png)
|
Figure 17:
E(B-V)
map at 6''/px resolution ( |
| Open with DEXTER | |
![\begin{figure}
\par\includegraphics[width=15cm]{12179f28.eps} \includegraphics[width=15cm]{12179f29.eps}
\end{figure}](/articles/aa/full_html/2009/43/aa12179-09/img235.png)
|
Figure 18: Upper panel: original SDSS image in the i-band. Lower panel: SDSS i-band image dereddened with our extinction map. For clarity, all regions are shown here. Regions with bright point-like sources and/or occasional negative fluxes in some (UV/Optical/IR) maps (black regions) are unreliable. The colorbar shows intensity levels in Jansky in logarithmic units. Images have 6''/px resolution. |
| Open with DEXTER | |
The 10 kpc ring is the locus where gas density and star formation activity also reach their maximum values across the disk of M31 (e.g., Braun et al. 2009; Nieten et al. 2006; Reddish 1962; Hodge 1979; Hodge & Lee 1988), thus it is unsurprising that the dust density also peaks at the ring as found in previous studies.
Another limitation of the approach that we followed consists
of assuming that each one of the cells that we analyzed is independent
of the others, and thus the radiation field of each region is
resposible only for the dust heating in that region. As the mean free
path of photons is typically larger than
the dimension of the regions analyzed here (
![]() ,
,
![]() 670 pc/px),
it is possible that photons coming from
nearby bright regions could contribute significantly to dust heating.
Nevertheless, this effect is likely to have a limited impact on our
conclusions. At first, because dust heated by stars in star-forming
regions is not the dominant source of emission in the FIR in
M31, as indicated by the hot dust component emission at
24
670 pc/px),
it is possible that photons coming from
nearby bright regions could contribute significantly to dust heating.
Nevertheless, this effect is likely to have a limited impact on our
conclusions. At first, because dust heated by stars in star-forming
regions is not the dominant source of emission in the FIR in
M31, as indicated by the hot dust component emission at
24 ![]() m
being overall <7% of the TIR emission, as shown in
Sect. 3.1.
Secondly, the smooth distribution of the M31 surface
brightness in the optical (
m
being overall <7% of the TIR emission, as shown in
Sect. 3.1.
Secondly, the smooth distribution of the M31 surface
brightness in the optical (
![]() from where most of the
dust-heating radiation comes) is indicative of
homogeneous conditions among adjacent regions for which a local
equilibrium between photons transmitted and received in closeby regions
can be assumed.
from where most of the
dust-heating radiation comes) is indicative of
homogeneous conditions among adjacent regions for which a local
equilibrium between photons transmitted and received in closeby regions
can be assumed.
Finally, using the correlation between the 24![]() m and the
TIR emission shown in Fig. 6, we
derived
the reddening map of M31 at 6''/px
(Fig. 17).
We then applied the reddening correction to the observed SDSS map
(Fig. 18).
The most prominent dust lanes and absorption features are clearly
consistent with the reddening map, and the ring emission at
10 kpc appears to be very
significant. We note that in Figs. 17, and
18
we show the
whole maps for clarity, but regions where optical, UV, and infrared
point-like sources are visible should be interpreted with care. We
discussed the issue of contaminants and how we corrected for them in
Sect. 2.
m and the
TIR emission shown in Fig. 6, we
derived
the reddening map of M31 at 6''/px
(Fig. 17).
We then applied the reddening correction to the observed SDSS map
(Fig. 18).
The most prominent dust lanes and absorption features are clearly
consistent with the reddening map, and the ring emission at
10 kpc appears to be very
significant. We note that in Figs. 17, and
18
we show the
whole maps for clarity, but regions where optical, UV, and infrared
point-like sources are visible should be interpreted with care. We
discussed the issue of contaminants and how we corrected for them in
Sect. 2.
6 Conclusions
In this paper, we have studied the dust properties of
M31. The major results that we reached are the following:
(i) from the study of the infrared spectrum of M31,
we have
found that the mean intensity of the radiation field heating the dust
is globally low (typically U < 2); (ii) the
dust
mass (
![]() )
estimate remains uncertain because of a lack of
submillimeter observations, but we have found that
)
estimate remains uncertain because of a lack of
submillimeter observations, but we have found that
![]() ,
the value given by the best-fit model being
,
the value given by the best-fit model being
![]() in
good agreement with
that inferred from CO and HI observations; (iii) the abundance of
polyciclic aromatic hydrocarbon (PAH) particles in M31 is
high (>
in
good agreement with
that inferred from CO and HI observations; (iii) the abundance of
polyciclic aromatic hydrocarbon (PAH) particles in M31 is
high (>
![]() )
across the spiral-ring structure of M31;
(iv) we demonstrated the existence of a
correlation between the observed
)
across the spiral-ring structure of M31;
(iv) we demonstrated the existence of a
correlation between the observed
![]() emission
ratios and the
color
emission
ratios and the
color ![]() over the entire spiral-ring structure of
M31; (v) this correlation is not in agreement with
the
over the entire spiral-ring structure of
M31; (v) this correlation is not in agreement with
the
![]() relationship
of starburst galaxies, thus color changes are
in general not driven by dust attenuations; (vi) we found that
according to the prescription of models that consider age-dependent
dust heating, the observed correlation could be evidence of a
population gradient and a quite homogeneous attenuation of the analyzed
regions; (vii) in 83% of the regions between
relationship
of starburst galaxies, thus color changes are
in general not driven by dust attenuations; (vi) we found that
according to the prescription of models that consider age-dependent
dust heating, the observed correlation could be evidence of a
population gradient and a quite homogeneous attenuation of the analyzed
regions; (vii) in 83% of the regions between
![]() kpc,
the dust absorbs more than
kpc,
the dust absorbs more than ![]() of the energy at
of the energy at ![]() Å
and it appears to be
mainly heated by populations a few Gyr old, which could provide a good
interpretation of the low mean
intensity of the radiation field that we found from the independent
analysis of the infrared spectrum; (viii) we found that the
mean attenuation
in 2 kpc-wide radial bins reaches the maximum value near
10 kpc and
decreases more rapidly with radius in the inner than the outer regions
of the galaxy, and that regions with higher TIR emission also have
enhanced attenuations; (ix) we finally produced an attenuation
map of M31 at 6
Å
and it appears to be
mainly heated by populations a few Gyr old, which could provide a good
interpretation of the low mean
intensity of the radiation field that we found from the independent
analysis of the infrared spectrum; (viii) we found that the
mean attenuation
in 2 kpc-wide radial bins reaches the maximum value near
10 kpc and
decreases more rapidly with radius in the inner than the outer regions
of the galaxy, and that regions with higher TIR emission also have
enhanced attenuations; (ix) we finally produced an attenuation
map of M31 at 6
![]() resolution (
resolution (![]() 100/px
along the plane of M31).
100/px
along the plane of M31).
Future work will investigate in more detail the dependence of the dust attenuation values on other parameters (e.g., color, metallicity), the star formation rate, and the modeling of the stellar populations in M31.
The maps presented in Fig. 14 and the E(B-V) map of Fig. 17 are available via CDS.
AcknowledgementsWe acknowledge the useful comments of the anonymous referee. This research was supported by the DFG cluster of excellence ``Origin and Structure of the Universe'' (www.universe-cluster.de).
References
- Barmby, P., Huchra, J. P., Brodie, J. P., et al. 2000, AJ, 119, 727 [CrossRef] [NASA ADS]
- Barmby, P., Ashby, M. L. N., Bianchi, L., et al. 2006, ApJ, 650, 45 [CrossRef] [NASA ADS]
- Bendo, G. J., Draine, B. T., Engelbracht, C. W., et al. 2008, MNRAS, 389, 629 [CrossRef] [NASA ADS]
- Bianchi, L., Clayton, G. C., Bohlin, R. C., et al. 1996, ApJ, 471, 203 [CrossRef] [NASA ADS]
- Bigiel, F., Leroy, A., Walter, F., et al. 2008, AJ, 136, 2846 [CrossRef] [NASA ADS]
- Buat, V. 1992, A&A, 264, 444 [NASA ADS]
- Buat, V., Iglesias-Páramo, J., Seibert, M., et al. 2005, ApJ, 619, L51 [CrossRef] [NASA ADS]
- Braun, R., et al. 2009 [arXiv:0901.4154B]
- Bruzual, G., & Charlot, S. 2003, MNRAS, 344, 1000 [CrossRef] [NASA ADS]
- Calzetti, D., Kennicutt, R. C., Engelbracht, C. W., et al. 2007, ApJ, 666, 870 [CrossRef] [NASA ADS]
- Charlot, S., & Fall, S. M. 2000, ApJ, 539, 718 [CrossRef] [NASA ADS]
- Cortese, L., Boselli, A., Franzetti, P., et al. 2008, MNRAS, 386, 1157 [CrossRef] [NASA ADS]
- Draine, B. T., & Li, A. 2007, ApJ, 657, 810 [CrossRef] [NASA ADS]
- Draine, B. T., Dale, D. A., Bendo, G. D., et al. 2007, ApJ, 663, 866D [CrossRef] [NASA ADS]
- Gil de Paz, A., Boissier, S., Madore, B. F., et al. 2007, ApJS, 173, 185 [CrossRef] [NASA ADS]
- Fan, Z., Ma, J., de Grijs, R., et al. 2008, MNRAS, 385, 1973 [CrossRef] [NASA ADS]
- Gavazzi, G., Bonfanti, C., Sanvito, G., et al. 2002, ApJ, 576, 135 [CrossRef] [NASA ADS]
- Gordon, K. D., Clayton, G. C., Witt, A. N., et al. 2000, ApJ, 533, 236 [CrossRef] [NASA ADS]
- Gordon, K. D., Bailin, J., Engelbracht, C. W., et al. 2006, ApJ, 638, 87 [CrossRef] [NASA ADS]
- Gordon, K. D., Engelbracht, C. W., Rieke, G. H., et al. 2008, ApJ, 682, 336 [CrossRef] [NASA ADS]
- Haas, M., Lemke, D., Stickel, M., et al. 1998, A&A, 338, 33 [NASA ADS]
- Helou, G., Roussel, H., Appleton, P., et al. 2004, ApJS, 154, 253 [CrossRef] [NASA ADS]
- Hodge, P. W. 1979, AJ, 84, 744 [CrossRef] [NASA ADS]
- Hodge, P. 1980, AJ, 85, 376 [CrossRef] [NASA ADS]
- Hodge, P. W., & Kennicutt, R. C. 1982, AJ, 87, 264 [CrossRef] [NASA ADS]
- Hodge, P. W., & Lee M. G. 1988, ApJ, 329, 651 [CrossRef] [NASA ADS]
- Inoue, A. K. 2005, MNRAS, 359, 171 [CrossRef] [NASA ADS]
- Inoue, A. K., Buat, V., Burgarella, D., et al. 2006, MNRAS, 370, 380 [NASA ADS]
- Kennicutt, R. C., Jr., Calzetti, D., Walter, F., et al. 2007, ApJ, 671, 333 [CrossRef] [NASA ADS]
- Kong, X., Charlot, S., Brinchmann, J., et al. 2004, MNRAS, 349, 769 [CrossRef] [NASA ADS]
- Leroy, A. K., Walter, F., Brinks, E., et al. 2008, AJ, 136, 2782 [CrossRef] [NASA ADS]
- Kraemer, K. E., Price, S. D., Mizuno, D. R., et al. 2002, AJ, 124, 2990 [CrossRef] [NASA ADS]
- Li, A., & Draine, B. T. 2001, ApJ, 554, 778 [CrossRef] [NASA ADS]
- Mathis, J. S., Mezger, P. G., & Panagia, N. 1983, A&A, 128, 212 [NASA ADS]
- Madden, S. C., Galliano, F., Jones, A. P., et al. 2006, A&A, 446, 877 [EDP Sciences] [CrossRef] [NASA ADS]
- Meurer, G. R., Heckman, T. M., Leitherer, C., et al. 1995, AJ, 110, 2665 [CrossRef] [NASA ADS]
- Meurer, G. R., Heckmann, T. M., & Calzetti, D. 1999, ApJ, 521, 64 [CrossRef] [NASA ADS]
- Nieten, Ch., Neininger, N., & Guélin, M. 2006, A&A, 453, 459 [EDP Sciences] [CrossRef] [NASA ADS]
- Odenwald, S., Newmark, J., & Smoot, G. 1998, ApJ, 500, 554 [CrossRef] [NASA ADS]
- Rice, W., Lonsdale, C. J., Soifer, B. T., et al. 1988, ApJS, 68, 91 [CrossRef] [NASA ADS]
- Reddish, V. C. 1962, Zs. Ap., 56, 194 [NASA ADS]
- Salim, S., Rich, R. M., Charlot, S., et al. 2007, ApJS, 173, 267 [CrossRef] [NASA ADS]
- Schlegel, D. J., Finkbeiner, D. P., & Davis, M., ApJ, 500, 525
- Schmidtobreick, L., Haas, M., & Lemke, D. 2000, A&A, 363, 91 [NASA ADS]
- Smith, J. D. T., Draine, B. T., Dale, D. A., et al. 2007, ApJ, 656, 770 [CrossRef] [NASA ADS]
- Unwin, S. C. 1983, MNRAS, 205, 787 [NASA ADS]
- Weingartner, J. C., & Draine, B. T. 2001, ApJ, 548, 296 [CrossRef] [NASA ADS]
- Walterbos, R. A. M., & Kennicutt, R. C. 1988, A&A, 198, 61 [NASA ADS]
- Xu, C., & Helou, G. 1996, ApJ, 456, 163 [CrossRef] [NASA ADS]
- York, D. G., Adelman, J., Anderson, J. E., et al. 2000, AJ, 120, 1579 [CrossRef] [NASA ADS]
Footnotes
- ... M31
- Maps of Figure 14 and the E(B-V) map of Figure 17 are only available in electronic form at the CDS via anonymous ftp to cdsarc.u-strasbg.fr (130.79.128.5) or via http://cdsweb.u-strasbg.fr/cgi-bin/qcat?J/A+A/507/283
- ...
Gordon
- http://dirty.as.arizona.edu/ kgordon/mips/conv_psfs/conv_psfp.html
- ... MOPEX
- http://ssc.spitzer.caltech.edu/postbcd/mopex.html
- ... field
- In principle, the value of
 is
not consistent with the definition of the mean radiation field
given by Draine & Li (2007),
although these two values are
essentially equivalent once
is
not consistent with the definition of the mean radiation field
given by Draine & Li (2007),
although these two values are
essentially equivalent once  as seems the case for
M31.
as seems the case for
M31.
- ...

- We decided to use here the
color because the 2MASS images of M31 obtained
during the 2MASS Extended Survey
did not appear sufficiently deep for our purposes.
All Tables
Table 1: Percentual variation in the total integrated flux of M31 due to the resampling procedure.
Table 2: Measurements of M31 infrared integrated fluxes.
Table
3: Average values and standard deviations (in parenthesis) in
![]() ,
,
![]() and
and
![]() in each
annular region shown in Fig. 12.
in each
annular region shown in Fig. 12.
Current usage metrics show cumulative count of Article Views (full-text article views including HTML views, PDF and ePub downloads, according to the available data) and Abstracts Views on Vision4Press platform.
Data correspond to usage on the plateform after 2015. The current usage metrics is available 48-96 hours after online publication and is updated daily on week days.
Initial download of the metrics may take a while.