| Issue |
A&A
Volume 506, Number 3, November II 2009
|
|
|---|---|---|
| Page(s) | L37 - L40 | |
| Section | Letters | |
| DOI | https://doi.org/10.1051/0004-6361/200913141 | |
| Published online | 01 October 2009 | |
A&A 506, L37-L40 (2009)
The power spectrum of the cosmic microwave background Kolmogorov maps: possible clue to correlation of voids
V. G. Gurzadyan1 - A. L. Kashin1 - H. G. Khachatryan1 - A. A. Kocharyan1,2 - E. Poghosian1 - D. Vetrugno3 - G. Yegorian1
1 - Yerevan Physics Institute and Yerevan State University, Yerevan, Armenia
2 - School of Mathematical Sciences, Monash University, Clayton, Australia
3 - University of Lecce, Lecce, Italy
Received 19 August 2009 / Accepted 7 September 2009
Abstract
The power spectrum is obtained for the Kolmogorov stochasticity
parameter map for WMAP's cosmic microwave background (CMB) radiation
temperature datasets. The interest for CMB Kolmogorov map is that
it can carry direct information about voids in the matter distribution,
so that the correlations in the distribution of voids have to be
reflected in the power spectrum. Although limited by the angular
resolution of the WMAP, this analysis shows the possibility of
acquiring this crucial information via CMB maps. Even the already
obtained behavior, some of which is absent in the simulated maps, can
influence the development of views on the void correlations at the
large-scale web formation.
Key words: cosmology: cosmic microwave background
1 Introduction
Correlations in the full sky or broad enough surveys contain clues to the early Universe and its present structure. The acoustic peaks of the cosmic microwave background (CMB) power spectrum revealed a set of cosmological parameters with particular accuracy (Komatsu et al. 2008; de Bernardis et al. 2000). The baryon acoustic oscillations (see Percival et al. 2009) are crucial for studies of the formation of the large-scale structure, including the role of dark matter and dark energy.
Below, we construct the power spectrum of a novel type of full sky map, those representing the distribution of the Kolmogorov stochasticity parameter of the CMB temperature maps. Kolmogorov's parameter is a descriptor for a degree of randomness (Kolmogorov 1933; Arnold 2008a) and when applied to the CMB temperature datasets results in a map (K-map) (Gurzadyan et al. 2009) that has both features resembling the temperature maps, like the outlined Galactic disk, but also ones with different contents. The Cold Spot (Cruz et al. 2009), the non-Gaussian structure of negative mean temperature, was noticed thanks to the excess of the K-parameter with respect to its mean value over the sky. Moreover, the behavior of the K-parameter, i.e. of the degree of the randomness was increasing towards the boundary of the Cold Spot (Gurzadyan & Kocharyan 2008, 2009). Both features are compatible to the void nature of the Cold Spot. Other spots and regions have been noticed in the K-map, which are studied with other descriptors as well (Rossmanith et al. 2009), and other noticed non-Gausianities can also be among the applications (Gurzadyan et al. 2005,2008).
If the Kolmogorov CMB map is able to reflect the features in the matter distribution, it is therefore natural to study the large-scale correlations in such a map, along with the above-mentioned small-scale features. We used the latest available full sky maps, i.e. those of the Wilkinson Microwave Anisotropy Probe (WMAP) of W, Q, V-bands, and the foreground cleaning procedure elaborated by Tegmark et al. (2003). The power spectra obtained for them have common structures that are, however, absent in the simulated maps based on the CMB temperature power spectrum. This is the first attempt, and more detailed analysis of the K-parameter's power spectra can be performed when higher resolution CMB maps are available.
2 Kolmogorov's stochasticity parameter map
The Kolmogorov map can be constructed by estimating the
stochasticity parameter for the CMB temperature dataset sequence.
Kolmogorov's stochasticity parameter (Kolmogorov 1933; Arnold 2008a) is defined for the sequence
![]() in increasing order. The cumulative distribution function is
in increasing order. The cumulative distribution function is
![]() ,
and the empirical distribution function is defined as
,
and the empirical distribution function is defined as
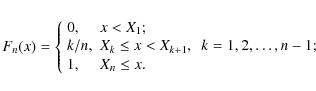
|
(1) |
The stochasticity parameter is
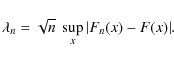
The universality of this definition stems from how for any continuous F, the convergence
is uniform, and
More specifically, to obtain the degree of randomness for a given
sequence, one must compute the Kolmogorov stochasticity parameter ![]() ,
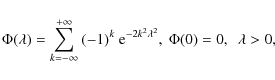
and then the estimated Kolmogorov's distribution
,
and then the estimated Kolmogorov's distribution ![]() will provide information on the degree of randomness in the sequence for the
will provide information on the degree of randomness in the sequence for the ![]() within the interval of their probable values, i.e. approximately, 0.4-1.8 (Arnold 2008b). The mean value of
within the interval of their probable values, i.e. approximately, 0.4-1.8 (Arnold 2008b). The mean value of ![]() given by Kolmogorov distribution is
given by Kolmogorov distribution is
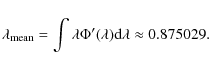
|
(4) |
The behavior of
The Kolmogorov map obtained based on this definition exhibits, as mentioned above, that structures are linked not only to those noticed by other descriptors but also to those indicating voids (Gurzadyan et al. 2009).
3 Power spectrum
Once the Kolmogorov statistic ![]() is
represented on a map, then one can define a correlation function on a
sphere in spherical coordinates, as for the temperature data,
is
represented on a map, then one can define a correlation function on a
sphere in spherical coordinates, as for the temperature data,
| (5) |
and expand
|
(6) |
where the coefficients alm, as usual, are found from
|
(7) |
Then
|
(8) |
and

or
However, for our purposes, i.e. when the
where
In our analysis we used the eight of WMAP's maps, of W, V, Q-bands, in the usual HEALPix format (Gorski et al. 2005), of the resolution parameter ns=512, of a total number of pixels
![]() .
For each ns=512 temperature map, we constructed Kolmogorov's stochasticity parameter map for ns=32,
.
For each ns=512 temperature map, we constructed Kolmogorov's stochasticity parameter map for ns=32,
![]() ,
since for the Kolmogorov map one needs about 100 temperature pixels. To obtain the ns=32 K-map from the ns=512 CMB map, each
,
since for the Kolmogorov map one needs about 100 temperature pixels. To obtain the ns=32 K-map from the ns=512 CMB map, each ![]() pixel is calculated from 64 temperature pixels.
pixel is calculated from 64 temperature pixels.
Then, for the HEALPix map of given
![]() ,
the maximum l in the obtained power spectrum will be
,
the maximum l in the obtained power spectrum will be

This corresponds to
- 1.
- calculation of ith alm for each K-map;
- 2.
- obtaining of all possible combinations of cross-power spectra;
- 3.
- estimation of the mean and the error bars for the set of spectra:
![\begin{figure}
\par\includegraphics[width=9cm,clip]{13141fg1.eps}
\end{figure}](/articles/aa/full_html/2009/42/aa13141-09/img29.png)
|
Figure 1: The mean for 15 cross-power spectra for Kolmogorov CMB maps for WMAP's 6 frequency bands, V1, V2, W1, W2, W3, W4. |
| Open with DEXTER | |
Note that alm-s are complex variables,
making the correlation function complex as well. However, since
the noise differs from map to map, the resulting complex part due to
noise is vanishing at cross correlations. The calculations were
performed for alm without a Galactic disk region within
![]() ,
for 6 and 8 K-maps, and we get 15 and
28 cross-power spectra, respectively, once their mean and error
bars were obtained. The results are shown in Fig. 1.
We see that, for the 28 cross-power spectra, the mean is the same
as for 15, but the estimated errors are bigger because of using
the noisier Q1, Q2 maps.
,
for 6 and 8 K-maps, and we get 15 and
28 cross-power spectra, respectively, once their mean and error
bars were obtained. The results are shown in Fig. 1.
We see that, for the 28 cross-power spectra, the mean is the same
as for 15, but the estimated errors are bigger because of using
the noisier Q1, Q2 maps.
The mean power spectrum is similar to the CMB pseudo-power spectrum discussed in Hinshaw et al. (2003), so one may think to use the Peebles weighting method (Hivon et al. 2002; Peebles 1973)
to find the power spectrum with the Galactic disk. However, this causes
two types of difficulties. First, we do not have enough pixels (
![]() )
to calculate the alm up to l=250, which is needed for calculating the precise weighting. Second, even if we keep the Galactic
disk region where we have approximately
)
to calculate the alm up to l=250, which is needed for calculating the precise weighting. Second, even if we keep the Galactic
disk region where we have approximately ![]() ,
it differs very little from the situation
if we a priori adopt
,
it differs very little from the situation
if we a priori adopt ![]() .
The reasonable solution seems not to use the Galactic region at all and to construct the power spectrum only for odd l, which are not affected by the Galactic disk cut.
.
The reasonable solution seems not to use the Galactic region at all and to construct the power spectrum only for odd l, which are not affected by the Galactic disk cut.
4 Foreground cleaned  map
map
We then obtained the power spectrum of ![]() using the foreground cleaning method developed for CMB maps by Tegmark et al. (2003) and the linear combination method of (Saha et al. 2006,2008). This is based on the use of a linear combination of different maps with weighting of wli, not only depending on ith map but also on the multipole l.
using the foreground cleaning method developed for CMB maps by Tegmark et al. (2003) and the linear combination method of (Saha et al. 2006,2008). This is based on the use of a linear combination of different maps with weighting of wli, not only depending on ith map but also on the multipole l.
![\begin{figure}
\par\includegraphics[width=9cm,clip]{13141fg2.eps}
\end{figure}](/articles/aa/full_html/2009/42/aa13141-09/img33.png)
|
Figure 2: The power spectrum for foreground cleaned Kolmogorov maps. |
| Open with DEXTER | |
For constructing of a cleaned ![]() map, we first calculated all alm and then calculated the cleaned alm using the relation
map, we first calculated all alm and then calculated the cleaned alm using the relation
|
(14) |
where wli is

Here Cl is an 8
We thus get 16 different triplets. For any triplet, a linearly superposed alm-s
is
constructed. The last step is to find all possible cross-power spectra
from those linearly superposed ones, whose initial map components are
different. For example,
![]() complies to this restriction, but
complies to this restriction, but
![]() does not, so only 3 maps of Eq. (15)
were used. In this way we obtain three cross-power spectra from
triplets. The mean power spectra from these cross-power spectra is
shown in Fig. 2.
does not, so only 3 maps of Eq. (15)
were used. In this way we obtain three cross-power spectra from
triplets. The mean power spectra from these cross-power spectra is
shown in Fig. 2.
5 Simulations
We repeated the estimations described above for simulated maps. Four different types of simulations were constructed from:
- a.
- the real maps' alm-s (T maps);
- b.
- real maps with added Gaussian noise of the same parameters as the noise in WMAP CMB maps (T+N maps);
- c.
- Gaussian maps of the distribution parameters
 from WMAP W band real map (G maps); and
- d.
- Gaussian maps with added Gaussian noise, both from the parameters
of WMAP W band map (G+N maps).
![\begin{figure}
\par\includegraphics[width=9cm,clip]{13141fg3.eps}
\end{figure}](/articles/aa/full_html/2009/42/aa13141-09/img42.png)
|
Figure 3: The Kolmogorov power spectra for simulated CMB temperature (T+N) and Gaussian (G+N) maps with superimposed WMAP's noise, averaged over 190 cross-power spectra each; the smoothed error bars are shown. |
| Open with DEXTER | |
For each group of ns=32 ![]() simulated
map we obtain the mean cross power spectra as described above. For
20 different maps one has 190 cross power spectra. Similarly,
190 cross-power spectra were computed for the Gaussian maps
generated with the WMAP's
simulated
map we obtain the mean cross power spectra as described above. For
20 different maps one has 190 cross power spectra. Similarly,
190 cross-power spectra were computed for the Gaussian maps
generated with the WMAP's ![]() and mean temperature and with superimposed noise of WMAP.
and mean temperature and with superimposed noise of WMAP.
Although the number of the cross spectra for simulations is more
than those we used for calculating the power spectra for real K-maps,
neither of the resulted spectra shows the features found for real maps
with 0.6 and 2.7-![]() level for W and foreground cleaned maps, respectively, as shown in Fig. 3. Even more important than the
level for W and foreground cleaned maps, respectively, as shown in Fig. 3. Even more important than the ![]() -level,
however, seems that the features only appear at cross and not at auto
correlations, thus indicating that they do not come from the noise in
the maps. The principal limitation in the above analysis is the angular
resolution, since
-level,
however, seems that the features only appear at cross and not at auto
correlations, thus indicating that they do not come from the noise in
the maps. The principal limitation in the above analysis is the angular
resolution, since ![]() reflects the statistical properties of the signal, the efficiency of the method will increase with higher resolution data.
reflects the statistical properties of the signal, the efficiency of the method will increase with higher resolution data.
6 Conclusion
We have obtained the first power spectrum of Kolmogorov stochasticity parameter map of CMB temperature data. The WMAP W, Q, V-band datasets were used to compute the Kolmogorov's CMB maps. The foreground cleaning method of Tegmark et al. (2003) was also applied while computing the ![]() maps. The mean for the set of cross-correlated maps was computed. They show features, particularly at around l=25,
that are absent in the maps simulated either for the WMAP's temperature
power spectrum parameters or in the Gaussian maps with superimposed
noise, i.e. additional effects to those usually included in the
simulated models.
maps. The mean for the set of cross-correlated maps was computed. They show features, particularly at around l=25,
that are absent in the maps simulated either for the WMAP's temperature
power spectrum parameters or in the Gaussian maps with superimposed
noise, i.e. additional effects to those usually included in the
simulated models.
Although the accuracy of the present analysis is limited by the WMAP's angular resolution and signal-to-noise ratio, it shows the principal possibility of obtaining such crucial information from CMB, and even the already obtained behaviors can affect the development of scenarios for the void correlations at the large-scale structure formation.
Higher angular resolution maps expected soon at Planck and other experiments will enable the finer structure analysis of structures in the power spectra of Kolmogorov CMB maps.
References
- Arnold, V. 2008a, Nonlinearity, 21, T109 [NASA ADS] [CrossRef]
- Arnold, V. I. 2008b, ICTP/2008/001, Trieste
- de Bernardis, P., Ade, P. A. R., Bock, J. J., et al. 2000, Nature, 404, 955 [NASA ADS] [CrossRef]
- Cruz, M., Martinez-Gonzalez, E., & Vielva, P. 2009, to appear in Highlights of Spanish Astrophysics V, Proc. VIII Sci. Meeting Spanish Astr. Soc. [arXiv:0901.1986]
- Ghahramanyan, T., Mirzoyan, S., Poghosian, E., & Yegorian, G. 2009, Mod. Phys. Lett. A, 24, 1187 [NASA ADS] [CrossRef]
- Gorski, K. M., Hivon, E., Banday, A. J., et al. 2005, ApJ, 622, 759 [NASA ADS] [CrossRef], http://healpix.jpl.nasa.gov
- Gurzadyan, V. G., & Kocharyan, A. A. 2008, A&A, 492, L33 [NASA ADS] [CrossRef] [EDP Sciences]
- Gurzadyan, V. G., & Kocharyan, A. A. 2009, A&A, 493, L61 [NASA ADS] [CrossRef] [EDP Sciences]
- Gurzadyan, V. G., de Bernardis, P., de Troia, G., et al. 2005, Mod. Phys. Lett. A, 20, 813 [NASA ADS] [CrossRef]
- Gurzadyan, V. G., Starobinsky, A. A., Ghahramanyan, T., et al. 2008, A&A, 490, 929 [NASA ADS] [CrossRef] [EDP Sciences]
- Gurzadyan, V. G., Allahverdyan, A. E., Ghahramanyan, T., et al. 2009, A&A, 497, 343 [NASA ADS] [CrossRef] [EDP Sciences]
- Hinshaw, G., Spergel, D. N., Verde, L., et al. 2003, ApJS, 148, 135 [NASA ADS] [CrossRef]
- Hivon, E., Gorski, K. M., Netterfield, C. B., et al. 2002, ApJ, 567, 2 [NASA ADS] [CrossRef]
- Kolmogorov, A. N. 1933, Giorn. Ist. Ital. Attuar, 4, 83
- Komatsu, E., Dunkley, J., Nolta, M. R., et al. 2009, ApJS, 180, 330 [NASA ADS] [CrossRef]
- Peebles, P. J. E. 1973, ApJ, 185, 413 [NASA ADS] [CrossRef]
- Percival, W. J., Reid, B. A., Eisenstein, D. J., et al. 2009, MNRAS, submitted [arXiv:0907.1660]
- Rossmanith, G., Raeth, C., Banday, A. J., & Morfill, G. 2009, MNRAS, accepted [arXiv:0905.2854]
- Saha, R., Jain, P., & Souradeep, T. 2006, ApJ, 645, L89 [NASA ADS] [CrossRef]
- Saha, R., Prunet, S., Jain, P., & Souradeep, T. 2008, Phys. Rev. D, 78, 023003 [NASA ADS] [CrossRef]
- Tegmark, M., de Oliveira-Costa, A., & Hamilton, A. 2003, Phys. Rev. D, 68, 123523 [NASA ADS] [CrossRef]
All Figures
|
|
Figure 1: The mean for 15 cross-power spectra for Kolmogorov CMB maps for WMAP's 6 frequency bands, V1, V2, W1, W2, W3, W4. |
| Open with DEXTER | |
| In the text | |
|
|
Figure 2: The power spectrum for foreground cleaned Kolmogorov maps. |
| Open with DEXTER | |
| In the text | |
|
|
Figure 3: The Kolmogorov power spectra for simulated CMB temperature (T+N) and Gaussian (G+N) maps with superimposed WMAP's noise, averaged over 190 cross-power spectra each; the smoothed error bars are shown. |
| Open with DEXTER | |
| In the text | |
Copyright ESO 2009
Current usage metrics show cumulative count of Article Views (full-text article views including HTML views, PDF and ePub downloads, according to the available data) and Abstracts Views on Vision4Press platform.
Data correspond to usage on the plateform after 2015. The current usage metrics is available 48-96 hours after online publication and is updated daily on week days.
Initial download of the metrics may take a while.