| Issue |
A&A
Volume 506, Number 3, November II 2009
|
|
|---|---|---|
| Page(s) | 1477 - 1485 | |
| Section | Celestial mechanics and astrometry | |
| DOI | https://doi.org/10.1051/0004-6361/200912369 | |
| Published online | 03 September 2009 | |
A&A 506, 1477-1485 (2009)
Effect of asymmetry of the radio source
distribution on the apparent proper motion kinematic analysis![[*]](/icons/foot_motif.png)
O. Titov1 - Z. Malkin2
1 - Geoscience Australia, GPO Box 378, Canberra, ACT 2601, Australia
2 - Central Astronomical Observatory at Pulkovo of RAS,
Pulkovskoe Ch. 65,
St. Petersburg 196140, Russia
Received 22 April 2009 / Accepted 24 July 2009
Abstract
Context. Information on physical characteristics of
astrometric radio sources, such as magnitude and redshift, is of great
importance for many astronomical studies. However, data usually used in
radio astrometry is often incomplete and outdated.
Aims. Our purpose is to study the optical
characteristics of more than 4000 radio sources observed by
the astrometric VLBI technique since 1979. We also studied the effect
of the asymmetry in the distribution of the reference radio sources on
the correlation matrices between vector spherical harmonics of the
first and second degrees.
Methods. The radio source characteristics were
mainly taken from the NASA/IPAC Extragalactic Database (NED).
Characteristics of the gravitational lenses were checked with the
CfA-Arizona Space Telescope LEns Survey. SIMBAD and HyperLeda databases
were also used to clarify the characteristics of some objects. Also we
simulated and investigated a list of 4000 radio sources evenly
distributed around the celestial sphere. We estimated the correlation
matrices between the vector spherical harmonics using the real as well
as modelled distribution of the radio sources.
Results. A new list OCARS (optical characteristics
of astrometric radio sources) of 4261 sources has been
compiled. Comparison of our data of optical characteristics with the
official International Earth Rotation and Reference Systems Service
(IERS) list showed significant discrepancies for about half of the
667 common sources. Finally, we found that asymmetry in the
radio source distribution between hemispheres could cause significant
correlation between the vector spherical harmonics, especially in the
case of sparse distribution of the sources with high redshift. We also
identified radio sources having a many-year observation history and
lack of redshift. These sources should be urgently observed with large
optical telescopes.
Conclusions. The list of optical characteristics
created in this paper is recommended for use as a supplementary
material for the next international celestial reference frame (ICRF)
realization. It can be also effectively used for cosmological studies
and planning of observing programs both in radio and optical
wavelength.
Key words: astrometry - techniques: interferometric - astronomical data bases: miscellaneous - cosmology: miscellaneous
1 Introduction
Information on the physical characteristics of astrometric radio sources is important for the planning of VLBI experiments and analysis of VLBI data for a research in cosmology, kinematics of the Universe, etc. In particular, the primary motivation for this work was support for the investigation of the systematic effects in apparent motion of the astrometric radio sources observed by VLBI (Gwinn et al. 1997; MacMillan 2005; Titov 2008a,b).
The official list of physical characteristics of the ICRF
radio sources is supported by the IERS (International Earth Rotation
and Reference Systems Service) ICRS (International Celestial Reference
System) Product Center (Archinal et al. 1997). The
latest version of the IERS list is available by internet![]() . However this list has
some deficiencies:
. However this list has
some deficiencies:
- Not all the sources observed in the framework of geodetic and astrometric experiments are included in the IERS list.
- The characteristics of some sources in the IERS list are outdated or doubtful.
The list of radio sources with their positions was originally
taken from the Goddard VLBI astrometric catalogues![]() ,
version 2007c,
with the addition of the two absent ICRF-Ext.2 (Fey et al. 2004)
sources 1039-474 and
1329-665 (hereafter we will use 8-character IERS designation HHMMsDDd
which is an abridged version of the IAU-compliant name ``IERS
BHHMMsDDd''). In the latest version, the source list was updated using
the 2009a_astro.cat catalogue computed by Petrov
,
version 2007c,
with the addition of the two absent ICRF-Ext.2 (Fey et al. 2004)
sources 1039-474 and
1329-665 (hereafter we will use 8-character IERS designation HHMMsDDd
which is an abridged version of the IAU-compliant name ``IERS
BHHMMsDDd''). In the latest version, the source list was updated using
the 2009a_astro.cat catalogue computed by Petrov![]() .
It gives 4261 radio sources in total.
.
It gives 4261 radio sources in total.
At this stage mainly the NASA/IPAC extragalactic database![]() (NED) was scoured.
Characteristics of the gravitational lenses were checked with the
CfA-Arizona Space Telescope LEns Survey
(NED) was scoured.
Characteristics of the gravitational lenses were checked with the
CfA-Arizona Space Telescope LEns Survey![]() (CASTLES). Several sources were checked with SIMBAD
(CASTLES). Several sources were checked with SIMBAD![]() and HyperLeda
and HyperLeda![]() databases. In the OCARS
list we have included only the optical characteristics of astrometric
radio sources: source type, redshift and visual magnitude. The flux
parameters are not included in our list because they are available from
other
centers directly working on correlation and primary processing of the
VLBI observations.
databases. In the OCARS
list we have included only the optical characteristics of astrometric
radio sources: source type, redshift and visual magnitude. The flux
parameters are not included in our list because they are available from
other
centers directly working on correlation and primary processing of the
VLBI observations.
The OCARS was preliminary presented in Malkin & Titov (2008). In this paper we investigate statistical properties of the list in more detail and study their impact on the kinematic analysis of radio source motion.
An analysis of the radio source apparent motion revealed some statistically significant systematic effects described by the vector spherical harmonics of the first and second orders (dipole and quadrupole effects, respectively) (Titov 2008a,b). The dipole effect could be caused by the Galactocentric acceleration of the Solar system (Gwinn et al. 1997; Sovers et al. 1998; Kovalevsky 2003; Klioner 2003; Kopeikin & Makarov 2006) or a hypothetic acceleration of the Galaxy relative to the reference quasars. The quadrupole harmonic, considered in detail by Kristian & Sachs (1966), could be caused either by the primordial gravitational waves or by anisotropic expansion of the Universe. This result was confirmed by Ellis et al. (1985), although they stated ``the major problem is that neither the distortion nor the proper motions are likely to be measurable in practice in the foreseeable future''. In this case the quadrupole effect should be redshift-dependent, and the apparent proper motion will increase with redshift. However, Pyne et al. (1996) and Gwinn et al. (1997) also discussed gravitational waves having a wavelength shorter than the Hubble length. Thus, the proper motion induced by the short-wavelength gravitational waves also might be constant over all redshifts.
Due to the asymmetry of the astrometric radio source distribution around the sky, the correlation between the vector spherical harmonic components is not zero. Therefore, we studied the effect of the asymmetry using the real uneven and simulated even distribution of the sources.
The OCARS list can be used as supplementary material for the second realization of the International Celestial Reference Frame (ICRF2), as well as for kinematic studies of the Universe and other related works, including scheduling of dedicated IVS (International VLBI Service for Geodesy and Astrometry, Schlüeter & Behrend 2007) programs.
2 Description of the OCARS
Our primary interest is to obtain the redshift (z) for astrometric radio sources to develop previous studies (Gwinn et al. 1997; MacMillan 2005; Titov 2008a,b). In these papers, redshift values were taken from the ICRF list (Archinal et al. 1997). However, as very small effects on the source motions are to be investigated, it is important to increase the number of sources used during the processing. Searching the latest astrophysical databases, primarily the NED, we could considerably augment the list of astrometric radio sources with known redshift. Nevertheless, more than half of the astrometric radio sources have no determined redshift.
The only direct way to determine the redshift for other frequently observed astrometric sources is through a dedicated observing program with large optical telescopes. To help in the preparation of such a program, we also collect the source type and its visual magnitude if this information is available. Also, we include in this observational program those sources with existing but uncertain redshift values.
Unfortunately, not all astrometric radio sources have been reliably identified in the NED. We use the following procedure for identification. First, we search for sources by source name using the ``ICRF'' and ``IVS'' prefix (i.e., at this stage, we rely on the source identification used in the literature and by the NED staff). Then about 500 sources, mostly from the VCS6 list, were searched for by position. We take into account both the angular distance between the VLBI and NED positions as well as their uncertainty. For some sources, multiple NED objects within the error were found. For 16 sources no appropriate object was found in the NED, which is mentioned in the comments. The problem of source identification in the NED and other astrophysical databases hopefully will be resolved after official publication of the VCS6 catalogue.
The OCARS list is made available along with this paper in electronic form.
3 Statistics
The overall statistics of the OCARS is the following.
| Number of sources: | ||
| total | 4261 (100%) | |
| N | 2391 (56.1%) | |
| S | 1870 (43.9%) | |
| with known type | 2545 (59.7%) | |
| AGN | 1654 (65.0%) | |
| galaxy | 492 (19.3%) | |
| star | 27 (1.1%) | |
| other | 372 (14.6%) | |
| with known redshift | 1840 (43.2%) | |
| <=1 | 853 (46.4%) | |
| >1 | 987 (53.6%) | |
| N | 1195 (64.9%) | |
| S | 645 (35.1%) | |
| with known visual magnitude | 2452 (57.5%) | |
| with known both z and magnitude | 1789 (42.0%) | |
| with known z or magnitude | 2503 (58.7%) | |
| with known magnitude and unknown z | 663 (15.6%) |
Figures 1 and 2 show the distribution of the sources with known redshift.
![\begin{figure}
\par\includegraphics[width=8.5cm,clip]{2369f01a.eps}\vspace*{3mm}
\includegraphics[width=8.5cm,clip]{2369f01b.eps}
\end{figure}](/articles/aa/full_html/2009/42/aa12369-09/img2.png)
|
Figure 1: Distribution of the redshift ( top) and cumulative number of sources ( bottom). |
| Open with DEXTER | |
| Figure 2: Distribution of the redshift over declination. |
|
| Open with DEXTER | |
![\begin{figure}
\par\includegraphics[width=8.5cm,clip]{2369f03a.eps}\vspace*{3mm}
\includegraphics[width=8.5cm,clip]{2369f03b.eps}
\end{figure}](/articles/aa/full_html/2009/42/aa12369-09/img4.png)
|
Figure 3: Distribution of the visual magnitude for all sources ( top) and for sources without known redshift ( bottom). |
| Open with DEXTER | |
Figure 3 shows the distribution of the visual magnitude. The bottom part of the figure shows the magnitude of the sources for which a redshift has not yet been determined. Therefore, large observational projects for spectroscopy of astrometric radio sources are very important. Such a program is quite laborious, taking into account necessity of observations of mostly rather weak sources and their careful identification (search for an optical counterpart of radio sources). Thus, it is useful to have a list of radio sources which were intensively observed during astrometric and geodetic VLBI programs, and with no known redshift, to establish an order of priority for optical observations. Our list of high-priority sources is given in Table 1. It was compiled using the IVS observation statistics available at http://www.gao.spb.ru/english/as/ac_vlbi/. The list was sorted using the number of observations marked as good in the observational NGS cards. On the other hand, we give observation priority to sources with reliably determined redshift, especially in the Southern hemisphere, and sources already having a good observational history.
Table 1: High-priority list of radio sources lacking known redshift.
4 Comparison with the IERS list
We have compared the OCARS with the IERS list and found 667 common radio sources. All the sources are present in the IERS list. Comparison of these two lists reveals large discrepancies.
- The first difference is in the number of radio sources. The OCARS list contains 40 extra ICRF sources plus several hundred other sources, 4261 vs. 667 objects in total, 2503 vs. 555 objects with known redshift or visual magnitude.
- Unlike the IERS list, we did not try to trace all the details of the active galactic nuclei (AGN) classification that are not always stable and unambiguous. So, all quasars and BL object are designated as AGN.
- Redshift for 55 more ICRF sources were found; redshift for 4 sources presented in the IERS list were not included in our list for various reasons; for 30 sources,the redshift differs by more than 0.01; the largest differences are 1.26 (1903-802), 1.20 (1600+431), 0.70 (0646-306).
- Visual magnitudes for 70 more ICRF sources were found; magnitudes for 2 sources were not confirmed in our list; for 195 sources, magnitude differs by more than 0.5; the largest differences are 5.2 (1758-651), 5.0 (1156-094, 1322-427), 3.9 (0241+622).
5 Comparison with the LQAC
We also performed a comparison of the OCARS list with the recently published Large Quasar Astrometric Catalogue (LQAC) (Souchay et al. 2009). This catalogue contains information on redshift and luminosity at optical and radio wavelengths for 113 666 quasars.
First, it should be noticed that more than one third of the astrometric sources are not quasars (see Sect. 3), hence not all of them are contained in the LQAC. Nevertheless, this comparison is useful because the information sources used to compile both lists have a large overlap, but are not fully the same. Also, such a check allows us to identify possible mistakes, overlooked literature, etc.
Since LQAC has no source names, the source identification was made using their position in both catalogues, which corresponds to the method used by the authors of LQAC. Table 2 shows a summary of comparison results for five different search radii. Here we compared only redshift values as the most important parameter. The z values in the two catalogs that differ by 0.01 or more were considered as different.
Table 2: Statistics of comparison of OCARS (1) with LQAC (2).
The most interesting results are sources having redshifts in the LQAC and lacking them in the OCARS. Those sources are 0003-302, 0118-283, 1026-084, 1202+527, 1225+028, 1332+031, 1422+231, 1555+030, 1639-062, and 2256-084. A first analysis showed that the sources 0003-302 and 1026-084 are located in a very populated sky region, and more careful identification is needed. The redshift value for the former is from a private communication. The source 1422+231 is a component of a gravitational lens according to CASTLES. These and other discrepancies found during this comparison will be analyzed during preparation of the next OCARS version.
It is interesting that about 85% of OCARS objects were found in the LQAC, which is much greater than the number of OCARS objects with known type. On the other hand, the number of OCARS objects not found in the LQAC is less than the number of OCARS non-AGN objects. It may be worth re-visiting the object classification in both catalogues, in fact, in LQAC and NED. Such a large work is out of the scope of this study.
6 Vector spherical functions
The paucity of radio sources with declination less than ![]() (Fig. 2)
may result in difficulties for astrometric analysis of radio
catalogues. The poorer precision of radio source coordinates in the
Southern hemisphere has been reported in papers on the International
Celestial Reference Frame (Ma et al. 1998). It may
cause a more dramatic impact on the analysis of the apparent proper
motion of the reference radio sources.
(Fig. 2)
may result in difficulties for astrometric analysis of radio
catalogues. The poorer precision of radio source coordinates in the
Southern hemisphere has been reported in papers on the International
Celestial Reference Frame (Ma et al. 1998). It may
cause a more dramatic impact on the analysis of the apparent proper
motion of the reference radio sources.
The ICRF consists of a set of highly accurate positions of
reference radio sources as determined by the VLBI techniques. The
observed radio sources are very distant, therefore when the ICRF is
made, their physical proper motion is assumed to be negligible (less
then 1 ![]() as/year)
and their
positions are practically stable. However, the motion of relativistic
jets from the active extragalactic nuclei can mimic the proper motion
of the observed radio sources (with a magnitude up to
0.5 mas/yr) (see e.g. Marcaide et al. 1985; Alberdi
et al. 1993;
Fey et al. 1997;
Feissel-Vernier 2003;
Titov 2007;
MacMillan & Ma 2007).
Moreover, some tiny systematic effects (dipole and quadrupole) in the
apparent proper motion have been observed (Titov 2008a,b).
A study of these apparent proper motions is an important part
of the development of future fundamental reference frame.
as/year)
and their
positions are practically stable. However, the motion of relativistic
jets from the active extragalactic nuclei can mimic the proper motion
of the observed radio sources (with a magnitude up to
0.5 mas/yr) (see e.g. Marcaide et al. 1985; Alberdi
et al. 1993;
Fey et al. 1997;
Feissel-Vernier 2003;
Titov 2007;
MacMillan & Ma 2007).
Moreover, some tiny systematic effects (dipole and quadrupole) in the
apparent proper motion have been observed (Titov 2008a,b).
A study of these apparent proper motions is an important part
of the development of future fundamental reference frame.
The dipole and quadrupole systematic effect in the radio source apparent motion have been studied previously (Gwinn et al. 1997; MacMillan 2005; Titov 2008a,b) using the expansion of the apparent motion field in vector spherical harmonics. Unfortunately, due to uneven distribution of the reference radio sources over the sky, the results may be corrupted by the correlation between estimated parameters. However, the correlation matrices have not been studied carefully so far.
The vector spherical harmonics (Hill 1954) are used to study of systematic effect on the proper motion of celestial objects (see e.g. Mignard & Morando 1990; Gwinn et al. 1997; Vityazev & Shuksto 2004; Vityazev & Tsvetkov 2009).
Let us consider ![]() as a vector field of a sphere described by the components of the
apparent proper motion vector (
as a vector field of a sphere described by the components of the
apparent proper motion vector (
![]() ,
,
![]() )
)
where
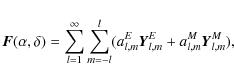
where
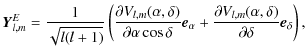
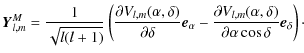
The function Vl,m(
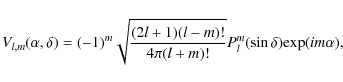
where
The coefficients of expansion al,mE,
al,mM
can be estimated as follows
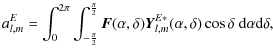
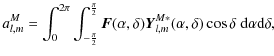
where
The three ``electric'' spherical harmonics for l=1 produces the dipole effect corresponding to the acceleration of the Solar system. The three l=1 ``magnetic'' harmonics describe a rotation of the set of quasars. This rotation is not separable from the Earth's rotation, and therefore not estimated. The five l=2 ``electric'' spherical harmonics correspond either to the gravitational waves or to the Universe anisotropic expansion, and, finally, the five l=2 ``magnetic'' spherical harmonics correspond only to the gravitational waves. In total, 13 components are to be estimated.
We studied both real and modelled distributions of the radio
sources to calculate the correlations between the spherical harmonics
(see Fig. 4).
For the model, we initially created a set of 4000 radio
sources uniformly distributed over the sky. Then we assigned redshifts
to all simulated objects in a such way that the assigned redshift
values have the same distribution as real ones. Another model set of
sources was created from the first one by thinning of the sources
within a
![]() zone along the Galactic equator, to obtain an ``avoidance zone''
similar to the real distribution. These distributions are shown in
Fig. 4.
zone along the Galactic equator, to obtain an ``avoidance zone''
similar to the real distribution. These distributions are shown in
Fig. 4.
Table 3: Statistics of the model and real distributions of the radio sources over four redshift intervals.
![\begin{figure}
\parbox[b]{18cm}{\scriptsize
\raisebox{8em}{\includegraphics[angl...
...0.00 &--0.01 &--0.01 &--0.01 &--0.02 & 1.00 \\
\end{tabular}}
\par
\end{figure}](/articles/aa/full_html/2009/42/aa12369-09/img27.png)
|
Figure 4: Sky coverage and correlation matrix for 13 vector spherical harmonics of first and second order for real source distribution of the 1809 radio sources with known redshift for real distribution ( top) and two modelled distributions of 3123 radio source with the avoidance zone ( middle) and of 4000 radio sources without the avoidance zone ( bottom). The circle size corresponds to the redshift value. |
| Open with DEXTER | |
![\begin{figure}
\par\parbox[b]{18cm}{
\raisebox{8em}{\includegraphics[angle=-90,w...
...--0.01 & 0.07 &--0.13 & 0.06 &-0.05 & 1.00 \\
\end{tabular}}}
\par
\end{figure}](/articles/aa/full_html/2009/42/aa12369-09/img28.png)
|
Figure 5: Sky coverage and correlation matrix for 13 vector spherical harmonics of first and second order for modelled source distribution and four redshift intervals. From top to bottom: 0<z<1, 1<z<2, 2<z<3, 3<z<4. The circle size corresponds to the redshift value. |
| Open with DEXTER | |
![\begin{figure}
\par\parbox[b]{18cm}{
\raisebox{8em}{\includegraphics[angle=-90,w...
...11 & 0.03 &--0.15 &--0.02 & 0.20 &-0.11 & 1.00 \\
\end{tabular}}}\end{figure}](/articles/aa/full_html/2009/42/aa12369-09/img29.png)
|
Figure 6: Sky coverage and correlation matrix for 13 vector spherical harmonics of first and second order for real source distribution and four redshift intervals. From top to bottom: 0<z<1, 1<z<2, 2<z<3, 3<z<4. The circle size corresponds to the redshift value. |
| Open with DEXTER | |
A comparison of the correlation matrices corresponding to the two
modelled distributions shown in Fig. 4
highlights that the avoidance zone increases the maximum correlation
(in absolute values) between the estimated spherical harmonics from
0.03 to 0.16. It is obvious that the paucity of radio
sources below a declination of ![]() (for the real distribution) results in a further increase of the
correlation to the maximum absolute value 0.28.
(for the real distribution) results in a further increase of the
correlation to the maximum absolute value 0.28.
Once the separation in different zones of redshift is applicable, we also considered the correlation between observables in four zones for the model and real distributions (Figs. 5 and 6, respectively). The model distribution without a decrease in the number of sources around the South Celestial Pole produces almost equal maximum correlation parameters for all four redshift zones (from 0.15 to 0.19). A deficit of the real radio sources around the South Celestial Pole is more crucial. Figure 6 demonstrates the impact of the North-South asymmetry on the real distribution of radio sources. For the zone of redshift between 3 and 4 the maximum correlation reaches 0.51.
As we learnt from the comparison of correlation matrices for
the limited number of radio sources unevenly distributed around the
celestial sphere, the correlation between estimated spherical
harmonics might increase dramatically to a level of 0.8-0.9, especially
if not all the sources are observed. While the individual apparent
motion due to intrinsic structure reaches 500 ![]() as/yr
(Feissel-Vernier 2003;
MacMillan & Ma 2007;
Titov 2007),
these values could be propagated systematically to the estimated
parameters, if the number of objects is not sufficient,
i.e. for the case of high redshift.
as/yr
(Feissel-Vernier 2003;
MacMillan & Ma 2007;
Titov 2007),
these values could be propagated systematically to the estimated
parameters, if the number of objects is not sufficient,
i.e. for the case of high redshift.
7 Conclusion
The ``historic'' deficit of radio sources (and, additionally, radio sources with measured redshift) might cause problems in further investigations of the barely detectable systematic effects in the proper motion of the reference radio sources. Therefore, large observational projects obtaining spectroscopy of astrometric radio sources in the Southern hemisphere are very important. Nonetheless, some observations in the Northern hemisphere also need to be undertaken.
Independently, the MASIV scintillation survey (Lovell et al. 2003, 2009) also demonstrates a highly significant dramatic decrease in the numbers of scintillators for redshifts in excess of z = 2. The lack of scintillation at high redshifts is clear evidence for an increase in the source angular sizes with increasing redshift. Such an increase may be cosmological in origin or may be a propagation effect of inter-galactic scattering (Lovell et al. 2009).
To observe and study radio source in both frequency ranges (optical and radio) characteristics such as visual magnitude and redshift in optical wavelengths, and flux density in several radio bands have to be measured. We also need to be sure that the same source is observed by optical and radio instruments. Due to possible misalignment between optical and radio positions, the physical characteristics might help to solve the problem of identification.
For this, a new list of optical characteristics of 4261 astrometric radio sources, OCARS, has been compiled. The OCARS list includes source type, redshift and visual magnitude (when available). Detailed comments are provided when necessary, which is especially useful to understand incomplete, contradictory and controversial astrophysical data. The OCARS may serve for various VLBI tasks, for instance:
- As supplemental material for the second ICRF realization
ICRF2 (Fey & Gordon 2009).
- As a database for VLBI data analysis.
- For planning of IVS and other observing programs, in order to enrich the observational history of the sources with reliable determined redshift.
- For future link between optical (GAIA) and radio (ICRF) celestial reference frames, once the GAIA optical position of about 100 000 quasars will be available.
We also compared OCARS with the newest Large Quasar Astrometric Catalogue (LQAC), and found discrepancies worth further investigation. Most of the discrepancies seems to be a result of different object identification.
This is only the first stage of our work. We are planning the following steps:
- To continue searching for missing and ambiguous characteristics through literature and astronomical databases.
- To organize photometric and spectroscopic observations of astrometric radio sources with large optical telescopes. In particular, such an observational program was started at Pulkovo Observatory in 2008. Observations are being made on the 6-m BTA telescope of the Special Astrophysical Observatory in North Caucasus.
This research has made use of the NASA/IPAC Extragalactic Database (NED) which is operated by the Jet Propulsion Laboratory, California Institute of Technology, under contract with the National Aeronautics and Space Administration, the SIMBAD and HyperLeda databases, and the CfA-Arizona Space Telescope LEns Survey (CASTLES). Valuable comments and suggestions of the anonymous reviewer are highly appreciated.
References
- Alberdi, A., Marcaide, A., Marscher, A., et al. 1993, AJ, 402, 160 [NASA ADS] [CrossRef]
- Archinal, B. A., Arias, E. F., Gontier, A.-M., & Mercuri-Moreau, C. 1997, IERS Technical Notes No. 23, III-11
- Ellis, G. F. R., Nel, S. D., Maartens, R., Stoeger, W. R., & Whitman, A. P. 1985, Phys. Rep., 124, 315 [NASA ADS] [CrossRef]
- Feissel-Vernier, M. 2003, A&A, 403, 105 [NASA ADS] [CrossRef] [EDP Sciences]
- Fey, A., & Gordon, D. 2009, The Second Realization of the International Celestial Reference Frame by Very Long Baseline Interferometry, IERS Technical Note 35, Frankfurt am Main: Verlag des Bundesamts für Kartographie und Geodäsie
- Fey, A. L., Eubanks, T. M., & Kingham, K. 1997, AJ, 114, 2284 [NASA ADS] [CrossRef]
- Fey, A. L., Ma, C., Arias, E. F., et al. 2004, AJ, 127, 3587 [NASA ADS] [CrossRef]
- Gwinn, C. R., Eubanks, T. M., Pyne, T., et al. 1997, ApJ, 485, 87 [NASA ADS] [CrossRef]
- Hill, E. L. 1954, Am. J. Phys., 22, 211 [NASA ADS] [CrossRef]
- Klioner, S. 2003, AJ, 125, 1580 [NASA ADS] [CrossRef]
- Kopeikin, S. M., & Makarov, V. V. 2006, AJ, 131, 1471 [NASA ADS] [CrossRef]
- Kovalevsky, J. 2003, A&A, 404, 743 [NASA ADS] [CrossRef] [EDP Sciences]
- Kristian, J., & Sachs, R. K. 1966, ApJ, 143, 379 [NASA ADS] [CrossRef]
- Lovell, J. E. J., Jauncey, D. L., Bignall, H. E., et al. 2003, AJ, 126, 1699 [NASA ADS] [CrossRef]
- Lovell, J. E. J., Rickett, B. J., Macquart, J.-P., et al. 2009, ApJ, 689, 108 [NASA ADS] [CrossRef]
- Ma, C., Arias, E., Eubanks, T. M., et al. 1998, AJ, 116, 516 [NASA ADS] [CrossRef]
- MacMillan, D., & Ma, C. 2007, JoG, 81, 443
- MacMillan, D. S. 2005, in ASP Conf. Proc. 340, ed. J. Romney, & M. Reid, 477
- Malkin, Z., & Titov, O. 2008, in Measuring the Future, Proc. 5th IVS General Meeting, ed. A. Finkelstein, & D. Behrend, 183
- Marcaide, J., Bartel, N., Gorenstein, M., et al. 1985, Nature, 314, 424 [NASA ADS] [CrossRef]
- Mignard, F., & Morando, B. 1990, in Proc. Colloque André Danjon, Journées 1990: Systèmes de référence spatio-temporels, ed. N. Capitaine, & S. Débarbat, 151
- Pyne, T., Gwinn, C. R., Birkinshaw, M., et al. 1996, ApJ, 465, 566 [NASA ADS] [CrossRef]
- Schlüter, W., & Behrend, D. 2007, J. Geod., 81, 479 [CrossRef]
- Souchay, J., Andrei, A. H., Barache, C., et al. 2009, A&A, 494, 799 [NASA ADS] [CrossRef] [EDP Sciences]
- Sovers, O. J., Fanselow, J. L., & Jacobs, C. S. 1998, Rev. Mod. Phys., 70, 1393 [NASA ADS] [CrossRef]
- Titov, O. 2007, Astron. Lett., 33, 481 [NASA ADS] [CrossRef]
- Titov, O. 2008a, in Proc. of the Journées 2007: Systèmes de Référence Spatio-Temporels (The Celestial Reference Frame for the Future), Observatoire de Paris, ed. N. Capitaine, 16
- Titov, O. 2008b, in Measuring the Future, Proc. 5th IVS General Meeting, ed. A. Finkelstein, & D. Behrend, 265
- Vityazev, V., & Shuksto, A. 2004, ASP Conf. Ser., 316, 230 [NASA ADS]
- Vityazev, V. V., & Tsvetkov, A. S. 2009, Astron. Lett., 35, 100 [NASA ADS] [CrossRef]
Footnotes
- ... analysis
- OCARS catalog is only available in electronic form at the CDS via anonymous ftp to cdsarc.u-strasbg.fr (130.79.128.5) or via http://cdsweb.u-strasbg.fr/cgi-bin/qcat?J/A+A/506/1477
- ... internet
- http://hpiers.obspm.fr/icrs-pc/info/car_physique_ext1
- ... catalogues
- http://vlbi.gsfc.nasa.gov/solutions/astro
- ... Petrov
- http://astrogeo.org/vlbi/solutions
- ... database
- http://nedwww.ipac.caltech.edu/
- ... Survey
- http://cfa-www.harvard.edu/glensdata/
- ... SIMBAD
- http://simbad.u-strasbg.fr/
- ... HyperLeda
- http://leda.univ-lyon1.fr/
All Tables
Table 1: High-priority list of radio sources lacking known redshift.
Table 2: Statistics of comparison of OCARS (1) with LQAC (2).
Table 3: Statistics of the model and real distributions of the radio sources over four redshift intervals.
All Figures
|
|
Figure 1: Distribution of the redshift ( top) and cumulative number of sources ( bottom). |
| Open with DEXTER | |
| In the text | |
| |
Figure 2: Distribution of the redshift over declination. |
| Open with DEXTER | |
| In the text | |
|
|
Figure 3: Distribution of the visual magnitude for all sources ( top) and for sources without known redshift ( bottom). |
| Open with DEXTER | |
| In the text | |
|
|
Figure 4: Sky coverage and correlation matrix for 13 vector spherical harmonics of first and second order for real source distribution of the 1809 radio sources with known redshift for real distribution ( top) and two modelled distributions of 3123 radio source with the avoidance zone ( middle) and of 4000 radio sources without the avoidance zone ( bottom). The circle size corresponds to the redshift value. |
| Open with DEXTER | |
| In the text | |
|
|
Figure 5: Sky coverage and correlation matrix for 13 vector spherical harmonics of first and second order for modelled source distribution and four redshift intervals. From top to bottom: 0<z<1, 1<z<2, 2<z<3, 3<z<4. The circle size corresponds to the redshift value. |
| Open with DEXTER | |
| In the text | |
|
|
Figure 6: Sky coverage and correlation matrix for 13 vector spherical harmonics of first and second order for real source distribution and four redshift intervals. From top to bottom: 0<z<1, 1<z<2, 2<z<3, 3<z<4. The circle size corresponds to the redshift value. |
| Open with DEXTER | |
| In the text | |
Copyright ESO 2009
Current usage metrics show cumulative count of Article Views (full-text article views including HTML views, PDF and ePub downloads, according to the available data) and Abstracts Views on Vision4Press platform.
Data correspond to usage on the plateform after 2015. The current usage metrics is available 48-96 hours after online publication and is updated daily on week days.
Initial download of the metrics may take a while.