| Issue |
A&A
Volume 506, Number 3, November II 2009
|
|
|---|---|---|
| Page(s) | 1455 - 1467 | |
| Section | Planets and planetary systems | |
| DOI | https://doi.org/10.1051/0004-6361/200912306 | |
| Published online | 03 September 2009 | |
A&A 506, 1455-1467 (2009)
Search for cold debris disks around M-dwarfs. II
J.-F. Lestrade1 - M. C. Wyatt2 - F. Bertoldi3 - K. M. Menten4 - G. Labaigt5
1 - Observatoire de Paris - CNRS, 77 Av. Denfert Rochereau, 75014 Paris, France
2 -
Institute of Astronomy, University of Cambridge, Cambridge, CB3 OHA, UK
3 -
Argelander Institute for Astronomy, University of Bonn, Auf dem Hügel 71, 53121 Bonn, Germany
4 -
Max-Planck-Institut für Radioastronomie, Auf dem Hügel 69, 53121 Bonn, Germany
5 -
École Normale Supérieure de Cachan, 61 avenue du Président Wilson, 94235 Cachan, France
Received 8 April 2009 / Accepted 6 July 2009
Abstract
Although 70% of the stars in the Galaxy are M-dwarfs, thermal emission searches for cold debris disks have been
conducted mostly for A-type and solar-type stars.
We report on new
![]() mm continuum observations of thirty M-dwarfs, using the MAMBO-2 bolometer array camera
at the IRAM 30 m telescope.
For a statistical analysis, we combine these data with our prior SCUBA and MAMBO-2 observations of 20 other M-dwarfs.
Our sample consists of M-dwarfs in moving groups, with relatively young ages, and of nearby M-dwarfs with unknown ages.
Only one cold debris disk (GJ842.2) was detected significantly.
We compare the implied disk abundance constraints with those found in two comparable submillimeter surveys
of 10 to 190 Myr old A- and FGK-type stars.
For the 19 youngest (ages less than 200 Myr) M-dwarfs in our sample, we derive a cold disk fraction of
5.3+10.5-5.0%,
compared to
15+11.5-11.5% for FGK-stars and
22+33-20% for
A-stars. Hence, for this age group, there is an apparent trend of fewer
cold disks for later stellar types. Although its statistical
significance is marginal, this trend is strengthened by the deeper
observations of our M-dwarf sample. We derive a cold disk fraction of
<10% for the older (likely a few Gyr) M-dwarfs in our sample.
Finally, although inconclusively related to a debris disk, we present
the complex millimeter structure found around the position of the
M 1.5 dwarf GJ526 in our sample.
mm continuum observations of thirty M-dwarfs, using the MAMBO-2 bolometer array camera
at the IRAM 30 m telescope.
For a statistical analysis, we combine these data with our prior SCUBA and MAMBO-2 observations of 20 other M-dwarfs.
Our sample consists of M-dwarfs in moving groups, with relatively young ages, and of nearby M-dwarfs with unknown ages.
Only one cold debris disk (GJ842.2) was detected significantly.
We compare the implied disk abundance constraints with those found in two comparable submillimeter surveys
of 10 to 190 Myr old A- and FGK-type stars.
For the 19 youngest (ages less than 200 Myr) M-dwarfs in our sample, we derive a cold disk fraction of
5.3+10.5-5.0%,
compared to
15+11.5-11.5% for FGK-stars and
22+33-20% for
A-stars. Hence, for this age group, there is an apparent trend of fewer
cold disks for later stellar types. Although its statistical
significance is marginal, this trend is strengthened by the deeper
observations of our M-dwarf sample. We derive a cold disk fraction of
<10% for the older (likely a few Gyr) M-dwarfs in our sample.
Finally, although inconclusively related to a debris disk, we present
the complex millimeter structure found around the position of the
M 1.5 dwarf GJ526 in our sample.
Key words: stars: circumstellar matter - stars: low-mass, brown dwarfs - planetary systems: formation
1 Introduction
Cold debris disks around main sequence stars are left-over planetesimals (comets) that could not agglomerate into larger planets during the initial phase of planet formation. They are assembled as a belt within the periphery of the system in a manner analogous to the Kuiper Belt. The study of debris disks, including warm disks such as the asteroid belt in our Solar System, advances our knowledge of the origin and evolution of planetary systems around other stars, in a similar way to the study of the Kuiper Belt. It is well recognised that its present-day structure and dynamics retain important information about the formation and evolution of the Solar System. For example, the low mass and expanded size of the present-day Kuiper Belt can be traced back to the outward migrations of the giant planets, which exchanged orbital energy with an initially more compact and more massive disk (Hahn & Malhotra 1999; Tsiganis et al. 2005; Morbidelli et al. 2005; Gomes et al. 2005).
Our current understanding of debris disks was reviewed by Wyatt (2008). Mutual collisions between planetesimals in debris disks produce second-generation dust grains that are observable by means of their thermal emission or scattered light. Since the discovery of a first debris disk around the A0 main sequence star Vega by IRAS (Aumann et al. 1984), debris disks have been searched for photometrically with the infrared (IR) satellites IRAS, ISO, and Spitzer. In these observations, any flux excess above the photospheric level is interpreted as emission from warm (50-100 K) circumstellar dust.
By analyzing Spitzer observations, it was found that
![]() of 160 A-dwarfs show a 70
of 160 A-dwarfs show a 70 ![]() m excess (Su et al. 2006), while
only
m excess (Su et al. 2006), while
only
![]() of 225 observed FG-dwarfs show excess emission (Bryden et al. 2006; Trilling et al. 2008).
Submillimeter photometry of A-to-G type stars with no detectable IRAS excess do however show cold (10-50 K) dust
emission around some of them (Wyatt et al. 2003; Najita & Williams 2005).
Imaging of scattered light with HST
and of thermal continuum emission with SCUBA has measured disk radii between 50 and 150 AU
(Smith & Terrile 1984; Kalas et al. 2005; Holland et al. 1998; Greaves et al. 2005);
22 debris disks have been imaged to date
of 225 observed FG-dwarfs show excess emission (Bryden et al. 2006; Trilling et al. 2008).
Submillimeter photometry of A-to-G type stars with no detectable IRAS excess do however show cold (10-50 K) dust
emission around some of them (Wyatt et al. 2003; Najita & Williams 2005).
Imaging of scattered light with HST
and of thermal continuum emission with SCUBA has measured disk radii between 50 and 150 AU
(Smith & Terrile 1984; Kalas et al. 2005; Holland et al. 1998; Greaves et al. 2005);
22 debris disks have been imaged to date![]() .
Azimuthal structures have been detected in a few of these disks and are
thought to be caused by dust associated with planetesimals trapped in
mean
motion resonance with an orbiting planet (Wyatt 2003, 2006; Reche et al. 2008), or by dynamical perturbations from a distant
stellar companion or passing stars (HD 141569A: Augereau & Paploizou 2004).
.
Azimuthal structures have been detected in a few of these disks and are
thought to be caused by dust associated with planetesimals trapped in
mean
motion resonance with an orbiting planet (Wyatt 2003, 2006; Reche et al. 2008), or by dynamical perturbations from a distant
stellar companion or passing stars (HD 141569A: Augereau & Paploizou 2004).
Although low-mass M-dwarfs are the most populous (70%) stars in the
Galaxy, they have so far received little attention, mostly because
their low luminosity
makes the thermal emission and scattered light from their disks more
difficult to detect. In a SCUBA survey of young stars of the ![]() Pic
moving group and of the Local Association, Liu et al. (2004) detected
the first two debris disks around M-dwarfs, AU Mic, and GJ182.
Using SCUBA and MAMBO-2, Lestrade et al. (2006) surveyed 32 relatively young M-dwarfs of moving groups
and newly detected one disk around the M 0.5 dwarf GJ842.2. Using Spitzer, Gautier et al. (2007)
surveyed 62 nearby M-dwarfs at 24
Pic
moving group and of the Local Association, Liu et al. (2004) detected
the first two debris disks around M-dwarfs, AU Mic, and GJ182.
Using SCUBA and MAMBO-2, Lestrade et al. (2006) surveyed 32 relatively young M-dwarfs of moving groups
and newly detected one disk around the M 0.5 dwarf GJ842.2. Using Spitzer, Gautier et al. (2007)
surveyed 62 nearby M-dwarfs at 24 ![]() m, and subsamples of 41 at 70
m, and subsamples of 41 at 70 ![]() m and of 20 at 160
m and of 20 at 160 ![]() m, and found no firm detection.
AU Mic was also imaged in scattered light as an edge-on and structured disk (Liu 2004; Krist et al. 2005).
m, and found no firm detection.
AU Mic was also imaged in scattered light as an edge-on and structured disk (Liu 2004; Krist et al. 2005).
Here we present new MAMBO-2 observations of nearby M-dwarfs, and combined them with our previous survey to analyze a total sample of 50 M-dwarfs (Table 1) in terms of their cold debris disk abundance.
We present the new M-dwarfs surveyed in Sect. 2, we describe the observations in Sect. 3, and results for both debris disks and background sources in the fields of some of the M-dwarfs in Sect. 4. Finally, we compare the detected fraction of cold debris disks around the M-dwarfs of our sample with the fractions for other stellar types to discuss whether or not the characteristics of M-dwarfs - mass and luminosity lower than solar - impact the formation of debris disks around them or their detectability.
Table 1: The 50 M-dwarfs of our (sub)mm surveys.
2 Sample of newly observed M-type dwarfs
To complement our first survey of M-dwarfs whithin moving groups of ages <600 Myr (Lestrade et al. 2006), we
observed the most nearby M-dwarfs, irrespective of age. We selected single M-dwarfs at a distance of less
than 6 pc and
![]() ,
and added five M-dwarfs binaries and six single M-dwarfs between 6 and 10 pc
that are in common with the Spitzer survey by Gautier et al. (2007).
The five binaries in our sample are: GJ725 (M 3 and M 3.5) separated by 15''
,
and added five M-dwarfs binaries and six single M-dwarfs between 6 and 10 pc
that are in common with the Spitzer survey by Gautier et al. (2007).
The five binaries in our sample are: GJ725 (M 3 and M 3.5) separated by 15''
![]() ,
GJ234 (M 4.5 and M 8) separated by 1''
,
GJ234 (M 4.5 and M 8) separated by 1''
![]() ,
GJ412 (M 2 and M 6) separated by 32''
,
GJ412 (M 2 and M 6) separated by 32''
![]() ,
GJ569 (M 2.5 and M 8.5) separated by 1''
,
GJ569 (M 2.5 and M 8.5) separated by 1''
![]() ,
and GJ65 (M 5.5 and M 5.5) separated by 2''
,
and GJ65 (M 5.5 and M 5.5) separated by 2''
![]() .
These angular separations are so small that a single MAMBO-2 map can cover both components.
The ages of the targeted near-by M-dwarfs are presently unknown.
.
These angular separations are so small that a single MAMBO-2 map can cover both components.
The ages of the targeted near-by M-dwarfs are presently unknown.
3 Observations
The diameter usually adopted for debris disks is 120 AU, which
for near-by stars is larger than the IRAM 30-m telescope beam of 10.7''
FWHM
at
![]() mm. We therefore imaged each field with the
117-channel Max-Planck Bolometer array (MAMBO-2; Kreysa et al. 1998) of the 30 m telescope on Pico Veleta,
Spain (2900 m). MAMBO-2 has a half-power spectral bandwidth from 210 to
290 GHz, with an effective frequency centered on 250 GHz (1.20 mm) for thermal emission spectra.
The effective FWHM beam is 10.7'' and the undersampled field of view of the array is 4'.
We used the standard on-the-fly mapping technique, where one map consists
of 41 azimuthal subscans of 60 s each, with a scanning velocity of
mm. We therefore imaged each field with the
117-channel Max-Planck Bolometer array (MAMBO-2; Kreysa et al. 1998) of the 30 m telescope on Pico Veleta,
Spain (2900 m). MAMBO-2 has a half-power spectral bandwidth from 210 to
290 GHz, with an effective frequency centered on 250 GHz (1.20 mm) for thermal emission spectra.
The effective FWHM beam is 10.7'' and the undersampled field of view of the array is 4'.
We used the standard on-the-fly mapping technique, where one map consists
of 41 azimuthal subscans of 60 s each, with a scanning velocity of ![]() and an elevation incremental step of 4'',
while chopping the secondary mirror at 2 Hz by 60'' in azimuth. The bolometers are arranged in a hexagonal pattern
with a beam separation of 22''. This scanning pattern produces time streams of data that are converted
into a fully sampled spatial map with 3.5'' pixels. Our observations
were completed within pooled observing runs spread over the winter and summer periods
from 2005 to 2007. Atmospheric conditions were generally good during the observations,
with typical zenith opacities between 0.1 and 0.3 at 250 GHz and low sky noise.
The telescope pointing was checked before and after each map by using the same nearest bright point source, and
was found to be stable to greater accuracy than 3'', except on a few occasions for which we discarded the data.
The absolute flux calibration is based on observations of several standard calibration sources, including
planets, and on a tipping curve (sky dip) measurement of the atmospheric opacity once every few hours.
The resulting absolute flux calibration uncertainty is estimated to be about 10% (rms).
and an elevation incremental step of 4'',
while chopping the secondary mirror at 2 Hz by 60'' in azimuth. The bolometers are arranged in a hexagonal pattern
with a beam separation of 22''. This scanning pattern produces time streams of data that are converted
into a fully sampled spatial map with 3.5'' pixels. Our observations
were completed within pooled observing runs spread over the winter and summer periods
from 2005 to 2007. Atmospheric conditions were generally good during the observations,
with typical zenith opacities between 0.1 and 0.3 at 250 GHz and low sky noise.
The telescope pointing was checked before and after each map by using the same nearest bright point source, and
was found to be stable to greater accuracy than 3'', except on a few occasions for which we discarded the data.
The absolute flux calibration is based on observations of several standard calibration sources, including
planets, and on a tipping curve (sky dip) measurement of the atmospheric opacity once every few hours.
The resulting absolute flux calibration uncertainty is estimated to be about 10% (rms).
The data were analyzed using the mopsic software package written by R. Zylka at IRAM.
The double-beam maps were combined to a single map using the shift-and-add procedure. Compared to a proper image
restoration, this produces maps with about a factor 2 higher sensitivity, at the expense of no sensitivity to emission
structures in scan direction that are larger that the wobbler throw of 60''.
In our sample, the shortest integration time per field
is 30 min, yielding an rms noise level of ![]()
![]() beam in the central part
of the map (r < 60''), steadily rising to
beam in the central part
of the map (r < 60''), steadily rising to ![]()
![]() at its edge (
at its edge (
![]() ).
This non-uniform noise across the maps exists because the scanned field is about twice
as large as the bolometer array size, so that more data is taken in the central part of the map
than near the edges. Because of this non-uniformity, it is more judicious to present Signal-to-Noise (S/N) maps
rather than intensity maps. The longest observation, by far, had a 20 h duration and was targeted at GJ628,
yielding an rms noise level of
).
This non-uniform noise across the maps exists because the scanned field is about twice
as large as the bolometer array size, so that more data is taken in the central part of the map
than near the edges. Because of this non-uniformity, it is more judicious to present Signal-to-Noise (S/N) maps
rather than intensity maps. The longest observation, by far, had a 20 h duration and was targeted at GJ628,
yielding an rms noise level of ![]()
![]() in the central part of the map and
in the central part of the map and ![]()
![]() at
at
![]() .
The sky area covered by each map corresponds to
.
The sky area covered by each map corresponds to ![]() 1700 independent antenna beams. The residual noise in the map was found to be nearly Gaussian.
Hence, a 4
1700 independent antenna beams. The residual noise in the map was found to be nearly Gaussian.
Hence, a 4![]() detection in our maps is statistically significant.
Below, we describe the procedure we used to extract discrete sources and to search for extended emission.
detection in our maps is statistically significant.
Below, we describe the procedure we used to extract discrete sources and to search for extended emission.
![\begin{figure}
\par\includegraphics[width=8.5cm, angle=-90]{12306fg1.ps}
\end{figure}](/articles/aa/full_html/2009/42/aa12306-09/img53.png)
|
Figure 1:
MAMBO-2 Signal-to-noise ratio map of the field around the M1.5 dwarf GJ526 at
|
| Open with DEXTER | |
4 Results
Although initially intended, our complete survey of 50 M-dwarfs turns out not to be flux-limited, which makes its statistical interpretation not straightforward. First, we present the discrete millimeter sources detected in four MAMBO-2 maps (Figs. 1-3, and Table 2), and we discuss the nature of the intriguing cluster of sources around GJ526. Second, we present the deep search for faint debris disks made by averaging intensities over an effective area in the 42 MAMBO-2 maps of our complete survey (Tables 3 and 4). The 8 other M-dwarfs were observed in wide photometry mode with SCUBA (Table 5) and were already discussed by Lestrade et al. (2006). We use the complete sample of 50 M-dwarfs to estimate the fraction of cold debris disks around M-dwarfs and upper limits to their fractional dust luminosities. Three stars (GJ285, GJ393 and GJ4247) are in common between Tables 3-5.
4.1 Discrete sources and structure around GJ526
Table 2: Millimeter sources found in our MAMBO-2 maps.
![\begin{figure}
\par\includegraphics[width=7.4cm, angle=-90]{12306fg2.ps}
\end{figure}](/articles/aa/full_html/2009/42/aa12306-09/img71.png)
|
Figure 2:
MAMBO-2 Signal-to-noise ratio map of the field around the binary GJ725 (M3 + M3.5 dwarfs) at
|
| Open with DEXTER | |
4.1.1 Source extraction
In Table 2, we summarize the characteristics of the discrete sources detected with Signal-to-Noise S/N > 4 in the
42 fields mapped with MAMBO-2, each being ![]()
![]() in size and being centered on the position of
an M-dwarf. The source extraction was done by searching each map for pixels with S/N > 4 to select
a block of
in size and being centered on the position of
an M-dwarf. The source extraction was done by searching each map for pixels with S/N > 4 to select
a block of ![]() pixels centered on each of them. We then minimized
pixels centered on each of them. We then minimized ![]() between the 2-D Gaussian
between the 2-D Gaussian
![]() and the measured intensities over this block by varying the peak flux F, the parameter
and the measured intensities over this block by varying the peak flux F, the parameter ![]() (
(
![]() ),
and the peak position
(x0, y0) by less than a pixel from the S/N > 4 pixel.
We used the mean brightness computed from the 32 pixels surrounding the
),
and the peak position
(x0, y0) by less than a pixel from the S/N > 4 pixel.
We used the mean brightness computed from the 32 pixels surrounding the
![]() block to remove
any constant level. With this scheme, this level is determined from pixels that are far enough
from the 2-D Gaussian peak to be at the map floor, since the Gaussian FWHM is 3 to 5 pixels
(
11''-17'') for our sources.
This correction amounted to between 5% and 20% of the integrated flux density.
The integrated flux densities of sources in Table 2 are
block to remove
any constant level. With this scheme, this level is determined from pixels that are far enough
from the 2-D Gaussian peak to be at the map floor, since the Gaussian FWHM is 3 to 5 pixels
(
11''-17'') for our sources.
This correction amounted to between 5% and 20% of the integrated flux density.
The integrated flux densities of sources in Table 2 are
![]() .
We extracted 13 discrete sources with S/N > 4 for F in 4 fields out of the 42 MAMBO-2 maps;
8 sources were newly found in the fields of GJ526, GJ725, and GJ569. They are all shown in Figs. 1-3.
The 5 other sources are in the field of GJ628 as already reported in Lestrade et al. (2006);
typographic errors in their coordinates in this first publication are corrected in Table 2.
In this table, the lowest integrated flux density is
.
We extracted 13 discrete sources with S/N > 4 for F in 4 fields out of the 42 MAMBO-2 maps;
8 sources were newly found in the fields of GJ526, GJ725, and GJ569. They are all shown in Figs. 1-3.
The 5 other sources are in the field of GJ628 as already reported in Lestrade et al. (2006);
typographic errors in their coordinates in this first publication are corrected in Table 2.
In this table, the lowest integrated flux density is
![]() mJy and the highest is between 30 and 63 mJy. There is no
optical counterpart within 7'' (
mJy and the highest is between 30 and 63 mJy. There is no
optical counterpart within 7'' (![]() MAMBO-2 position error) of any of these sources in the USNO-B1 catalogue
(Monet et al. 2003), except for MM163007-123942 (GJ628W) at the
MAMBO-2 position error) of any of these sources in the USNO-B1 catalogue
(Monet et al. 2003), except for MM163007-123942 (GJ628W) at the ![]() level in position (object I mag = 18.92)
as already reported in Lestrade et al. (2006). Additionally, we searched the fields of GJ526 and
GJ569 that were imaged in the Sloan Digital Sky Survey (SDSS). In the field of GJ526, there is
only one SDSS object (z mag = 20.4) which is as close as 7'' from MM134540+145446.
However, the confusion limit is reached over such a separation
since the density of SDSS objets is
level in position (object I mag = 18.92)
as already reported in Lestrade et al. (2006). Additionally, we searched the fields of GJ526 and
GJ569 that were imaged in the Sloan Digital Sky Survey (SDSS). In the field of GJ526, there is
only one SDSS object (z mag = 20.4) which is as close as 7'' from MM134540+145446.
However, the confusion limit is reached over such a separation
since the density of SDSS objets is ![]() 22 000
objects/deg2 as measured over the
22 000
objects/deg2 as measured over the
![]() area centered on the star position.
In the field of GJ569 (
area centered on the star position.
In the field of GJ569 (![]() 33 000 SDSS objects/deg2), there are two SDSS objets (mag u = 19.9, g = 21.6)
as close as 8'' from MM145428+160439, but again confusion prevents identification with the MAMBO-2 m source.
We found no radio counterpart within the
33 000 SDSS objects/deg2), there are two SDSS objets (mag u = 19.9, g = 21.6)
as close as 8'' from MM145428+160439, but again confusion prevents identification with the MAMBO-2 m source.
We found no radio counterpart within the ![]() MAMBO-2 position uncertainty
(10.5'') in the NVSS catalogue (Condon et al. 1998) to the
flux density limit of 2.5 mJy at 1.4 GHz, except for MM163007-123942 (GJ628W) at the 1.7
MAMBO-2 position uncertainty
(10.5'') in the NVSS catalogue (Condon et al. 1998) to the
flux density limit of 2.5 mJy at 1.4 GHz, except for MM163007-123942 (GJ628W) at the 1.7![]() level in position
(object flux density =
level in position
(object flux density =
![]() mJy) as already reported
in Lestrade et al. (2006). Finally, we found no IR counterpart within the 3
mJy) as already reported
in Lestrade et al. (2006). Finally, we found no IR counterpart within the 3![]() MAMBO-2 position uncertainty
in the 2MASS All-Sky Catalog of Point Sources (Skrutskie et al. 2006).
MAMBO-2 position uncertainty
in the 2MASS All-Sky Catalog of Point Sources (Skrutskie et al. 2006).
4.1.2 A bright millimeter source
![\begin{figure}
\par\includegraphics[width=7.0cm, angle=-90]{12306fg3.ps}
\end{figure}](/articles/aa/full_html/2009/42/aa12306-09/img84.png)
|
Figure 3:
MAMBO-2 Signal-to-noise ratio map of the field around the binary GJ569 (M 2.5 + M 8.5 dwarfs) at
|
| Open with DEXTER | |
The source MM184222+593828 in the field of GJ725 has a flux density of between 30 and 63 mJy
(Table 2), which is bright compared to millimeter sources found previously in empty fields mapped with MAMBO-2
(Greve et al. 2004; Bertoldi et al. 2007; and Voss et al. 2006). These lower and upper limits were obtained
by using different atmospheric correlation lengths in the skynoise reduction
within the mopsic data reduction package, yielding similar detections of
![]() .
Systematics
affects the accuracy of the flux measurement for this source, which is near the edge of the map.
This source is possibly resolved with a source FWHM between 12'' and 15''
depending on the reduction parameter used. Although this is rare, it has been shown that submm galaxies can have
multiple components (Tacconi et al. 2008).
We shall discuss this source together with complementary observations in a forthcoming paper.
.
Systematics
affects the accuracy of the flux measurement for this source, which is near the edge of the map.
This source is possibly resolved with a source FWHM between 12'' and 15''
depending on the reduction parameter used. Although this is rare, it has been shown that submm galaxies can have
multiple components (Tacconi et al. 2008).
We shall discuss this source together with complementary observations in a forthcoming paper.
Table 3: Search for debris disks around nearby M-dwarfs with our new MAMBO-2 data.
4.1.3 Structure around GJ526
The map of GJ526 is shown in Fig. 1. There are five sources that can be connected by an ellipse almost centered
on the star; precisely four robust ones with S/N >4 and
an additional one, farthest to the SE, that is only detected with S/N
>3.5. This source is possibly real since statistically less than
1 positive noise peak is expected at this level over the whole map
if dominated by Gaussian noise.
To estimate whether this is the case or not, we identified the negative
noise spikes S/N < -3 and the positive spikes
3 < S/N < 4 in our
![]() map (
map (![]() 2050 beams). The total of these 7 noise spikes found in the map is consistent
with the 6 theoretically expected for |S/N| > 3 for Gaussian noise.
Also, the detection of the SE source is robust since it appears at the same position in the two independent maps
we made by dividing the data in half. There is also a
2050 beams). The total of these 7 noise spikes found in the map is consistent
with the 6 theoretically expected for |S/N| > 3 for Gaussian noise.
Also, the detection of the SE source is robust since it appears at the same position in the two independent maps
we made by dividing the data in half. There is also a ![]()
![]() source to the West close to the ellipse but
its detection is not robust to data selection. Finally, there is an S/N > 4 source farther away in the SW direction.
source to the West close to the ellipse but
its detection is not robust to data selection. Finally, there is an S/N > 4 source farther away in the SW direction.
The ellipse is offset by two pixels in right ascension from the position of the star,
its semi-major and semi-minor axes are a=98''
and b=15'', and its orientation is PA =
![]() .
This structure might be the projected ring
of a clumpy debris disk, its inclination being
.
This structure might be the projected ring
of a clumpy debris disk, its inclination being
![]() from the plane of the sky.
The offset between the star and the center of the ellipse is only 2 pixels and might be caused by
position uncertainties or/and by true source structure. However,
the 5 connected sources do not appear to be embedded in any extended emission as expected for
a debris disk. The mean brightness over a rectangular box
from the plane of the sky.
The offset between the star and the center of the ellipse is only 2 pixels and might be caused by
position uncertainties or/and by true source structure. However,
the 5 connected sources do not appear to be embedded in any extended emission as expected for
a debris disk. The mean brightness over a rectangular box
![]() (92 beams),
oriented at PA =
(92 beams),
oriented at PA =
![]() ,
and centered on the star is
,
and centered on the star is
![]() mJy/11'' beam,
i.e.,
mJy/11'' beam,
i.e., ![]()
![]() .
This mean brightness matches the mean of the 5 flux densities of the connected sources within
the box, indicating that any extended emission must have a brightness <
.
This mean brightness matches the mean of the 5 flux densities of the connected sources within
the box, indicating that any extended emission must have a brightness <
![]() beam at 1.2 mm.
beam at 1.2 mm.
We now test whether or not such a source cluster can be produced by the distribution of background sources.
We carry out a first test to estimate the probability that the connected sources around GJ526 can cluster
as tightly as they do in Fig. 1 if they were background sources.
For this test, we use the statistical analysis of spatial point patterns developed by Diggle (2003).
This analysis is based on the nearest neighbour distance, defined as the distance between a point
(a source for us) and its nearest neighbour. For GJ526, all the nearest neighbour distances for the 5 sources
connected by the ellipse are <60''.
The probability that k distances x be <60'' among N distances if the mean frequence of occurrence
for x < 60'' over the whole sky is f, is given by the binomial distribution
![]() .
We can derive the mean frequence of occurrence f from the three
empty fields (ELAIS N2, Lockman Hole, and COSMOS) maped by MAMBO-2 (Greves et al. 2004; and Bertoldi et al. 2007). We found
that there are 9 distances <60'' between the 71 sources of these three fields, and so
f=9/(71-3)=0.13.
The factor (71-3) is the number of nearest neighbour distances for 71 sources distributed in the 3 separate fields.
For the five sources around GJ526 in Fig. 1, all 5-1 nearest neighbour distances are <60'' as already mentioned, so k=N=4 and the probability Bk
that background sources can produce such a number of small distances is as low as 0.1%.
.
We can derive the mean frequence of occurrence f from the three
empty fields (ELAIS N2, Lockman Hole, and COSMOS) maped by MAMBO-2 (Greves et al. 2004; and Bertoldi et al. 2007). We found
that there are 9 distances <60'' between the 71 sources of these three fields, and so
f=9/(71-3)=0.13.
The factor (71-3) is the number of nearest neighbour distances for 71 sources distributed in the 3 separate fields.
For the five sources around GJ526 in Fig. 1, all 5-1 nearest neighbour distances are <60'' as already mentioned, so k=N=4 and the probability Bk
that background sources can produce such a number of small distances is as low as 0.1%.
As a second test, we use the elliptical pattern connecting
6 submm sources recognisable in the North-West part of the COSMOS
field maped by MAMBO-2 and displayed in Fig. 2 of Bertoldi et al. (2007). This field is
![]() arcmin2 in size and
the mean occurrence of ellipse of major-axis 200'', as in the field of GJ526, is
arcmin2 in size and
the mean occurrence of ellipse of major-axis 200'', as in the field of GJ526, is
![]() arcmin-2.
We compute the Poisson probability of finding a similar ellipse in a field that we take as small
as
arcmin-2.
We compute the Poisson probability of finding a similar ellipse in a field that we take as small
as
![]() arcsec2 to account for
the ellipse around GJ526 being in an area restricted to the central part of the map, i.e., centered
on the position of GJ525. This probability is 2.7%. This test is only indicative because the COSMOS field has been mapped
at the level of 1 mJy/beam rms, while our map is twice as deep for the field around GJ526.
arcsec2 to account for
the ellipse around GJ526 being in an area restricted to the central part of the map, i.e., centered
on the position of GJ525. This probability is 2.7%. This test is only indicative because the COSMOS field has been mapped
at the level of 1 mJy/beam rms, while our map is twice as deep for the field around GJ526.
In summary, the five sources in Fig. 1
that are symmetrically located around GJ526 are connected by an ellipse
almost centered on the star. The two tests carried out above provide
indications that this structure is statistically inconsistent with
known spatial distributions of background submm galaxies. Hence, at
this stage, we cannot rule out the hypothesis that the sources are
associated with the star.
In this case, the 5 connected sources could be indicative of azimuthal
structures in an inclined debris disk around GJ526,
whose extended emission is not seen because the map is not deep enough.
Complementary observations at 850 ![]() m,
and at shorter wavelengths with Herschel, should attempt to detect the
extended emission of the disk. Eventually, astrometry should detect the
same proper motion for the 5 connected sources as for the star GJ526
(2.3''/yr in the SE direction) if indeed they are part of a debris
disk. The mid-epoch of our MAMBO-2 data is early 2007, so that the
5 sources should have moved in concert with the star by a full
IRAM-30 m beam by 2011, providing definitive proof of a disk.
m,
and at shorter wavelengths with Herschel, should attempt to detect the
extended emission of the disk. Eventually, astrometry should detect the
same proper motion for the 5 connected sources as for the star GJ526
(2.3''/yr in the SE direction) if indeed they are part of a debris
disk. The mid-epoch of our MAMBO-2 data is early 2007, so that the
5 sources should have moved in concert with the star by a full
IRAM-30 m beam by 2011, providing definitive proof of a disk.
Table 4: Reanalysis of the MAMBO-2 data of the M-dwarfs associated with moving groups of survey I.
Such a debris disk would have a radius as large as ![]() 500 AU at the distance of GJ526.
We examine whether or not this is conceivable. First, we note that exceptionally large debris disks,
520 AU and 600 AU in extent, have been found around the 184 Myr old A0-type dwarf
500 AU at the distance of GJ526.
We examine whether or not this is conceivable. First, we note that exceptionally large debris disks,
520 AU and 600 AU in extent, have been found around the 184 Myr old A0-type dwarf ![]() Oph at 70
Oph at 70 ![]() m (Su et al. 2008),
and around the main sequence F8V q1 Eri at 870
m (Su et al. 2008),
and around the main sequence F8V q1 Eri at 870 ![]() m (Liseau et al. 2008). Second,
protoplanetary disks where planetesimals and planets form extend to almost 1000 AU
as observed for example around the young close binary GG Tau (Dutrey et al. 1994).
In the model proposed by Kenyon & Bromley (2004a), icy-planets successively form in waves outward in the disk producing larger
and larger dusty rings from collisional cascades. In their model, the planet formation timescale is
m (Liseau et al. 2008). Second,
protoplanetary disks where planetesimals and planets form extend to almost 1000 AU
as observed for example around the young close binary GG Tau (Dutrey et al. 1994).
In the model proposed by Kenyon & Bromley (2004a), icy-planets successively form in waves outward in the disk producing larger
and larger dusty rings from collisional cascades. In their model, the planet formation timescale is
![]() Myr in a quiet disk (their Eq. (4)).
Assuming for
Myr in a quiet disk (their Eq. (4)).
Assuming for ![]() as much as 15 times the surface density of the minimum-mass solar nebula
as much as 15 times the surface density of the minimum-mass solar nebula
![]() as required for the formation of Jupiter in the solar system (Lissauer 1987),
the timescale for planet formation to reach 500 AU in the GJ526 system is
as required for the formation of Jupiter in the solar system (Lissauer 1987),
the timescale for planet formation to reach 500 AU in the GJ526 system is ![]() 5 Gyr.
The stellar diameter of GJ526 measured by the optical interferometer CHARA
(Berger et al. 2006) is about 2
5 Gyr.
The stellar diameter of GJ526 measured by the optical interferometer CHARA
(Berger et al. 2006) is about 2![]() larger than the ZAMS diameter predicted by Chabrier & Baraffe (1997) and Siess et al. (2000).
If this deviation of only
larger than the ZAMS diameter predicted by Chabrier & Baraffe (1997) and Siess et al. (2000).
If this deviation of only ![]() is real, it is an indication of youth instead for GJ526, and this would pose a problem for
the Kenyon and Bromley model applied to the hypothetical debris disk around GJ526.
We note that, with the dust surface density profile
is real, it is an indication of youth instead for GJ526, and this would pose a problem for
the Kenyon and Bromley model applied to the hypothetical debris disk around GJ526.
We note that, with the dust surface density profile
![]() ,
the mass of solids in a ring at r=500 AU and 0.1 r in width is
,
the mass of solids in a ring at r=500 AU and 0.1 r in width is
![]() ,
which is enough to form planetesimals. Finally,
the dust mass corresponding to the emission of the 5 sources is between
,
which is enough to form planetesimals. Finally,
the dust mass corresponding to the emission of the 5 sources is between ![]() 6 and
6 and ![]() 10 lunar masses
as derived in the Appendix for dust grains with a Dohnanyi size distribution
and heated both by the stellar luminosity and the interstellar radiation field.
The dust mass is
10 lunar masses
as derived in the Appendix for dust grains with a Dohnanyi size distribution
and heated both by the stellar luminosity and the interstellar radiation field.
The dust mass is ![]() 22 lunar masses if derived conventionally
for grey body dust with a mass opacity of
22 lunar masses if derived conventionally
for grey body dust with a mass opacity of
![]() at 850
at 850 ![]() m and
m and
![]()
![]() for
for
![]() m, and with the single dust temperature 4.9 K at large radius from the star (r = 500 AU)
where the interstellar radiation field dominates the heating process of grains (see Appendix).
m, and with the single dust temperature 4.9 K at large radius from the star (r = 500 AU)
where the interstellar radiation field dominates the heating process of grains (see Appendix).
Table 5: SCUBA observations of the M-dwarfs associated with moving groups in survey I (Lestrade et al. 2006).
4.2 Deep search for debris disks in the MAMBO-2 maps
We searched for faint debris disks in each MAMBO-2 map by averaging
intensities over a disk of increasing radius out to 30'' to see
whether or not the mean brightness peaks at some angular radius ![]() .
The radius limit of 30'' comes from the shift-and-add reduction method
and the wobbler throw of 60'' used for the observations. The intention with this averaging was to identify
a disk whose structure is not directly apparent in the map but whose mean brightness is statistically significant.
Naturally, no information about its structure can be recovered with this procedure. The optimum sensitivity of this method is
for face-on disks, while highly inclined disks might escape detection.
This method is similar to the one used to determine extension limits of debris disks in
the mid-IR surveys of Sun-like stars conducted by Smith et al. (2008), although,
we do not have the complication of having to accurately substract the photosphere at
.
The radius limit of 30'' comes from the shift-and-add reduction method
and the wobbler throw of 60'' used for the observations. The intention with this averaging was to identify
a disk whose structure is not directly apparent in the map but whose mean brightness is statistically significant.
Naturally, no information about its structure can be recovered with this procedure. The optimum sensitivity of this method is
for face-on disks, while highly inclined disks might escape detection.
This method is similar to the one used to determine extension limits of debris disks in
the mid-IR surveys of Sun-like stars conducted by Smith et al. (2008), although,
we do not have the complication of having to accurately substract the photosphere at
![]() mm.
Following this procedure, we plotted the mean brightness as a function of
angular radius
mm.
Following this procedure, we plotted the mean brightness as a function of
angular radius ![]() for each star presented in Tables 3 and 4.
All the curves were inspected and found to wander around zero mean with excursions
for each star presented in Tables 3 and 4.
All the curves were inspected and found to wander around zero mean with excursions ![]()
![]() for
for ![]() comprised between 11''/2 and 30'',
indicating that no disk was found by this method.
comprised between 11''/2 and 30'',
indicating that no disk was found by this method.
In Fig. 4, we provide the distribution of the mean brightness ![]() /mean brightness uncertainty
/mean brightness uncertainty
![]() listed in Tables 3 and4 and computed
for
listed in Tables 3 and4 and computed
for ![]() corresponding specificly to the adopted disk radius 60 AU at the distances of the stars.
The corresponding Gaussian probability density function is also plotted in Fig. 4.
Comparison between the two distributions indicates there are more
high positive and negative ratios
corresponding specificly to the adopted disk radius 60 AU at the distances of the stars.
The corresponding Gaussian probability density function is also plotted in Fig. 4.
Comparison between the two distributions indicates there are more
high positive and negative ratios
![]() than expected, although they stay within
than expected, although they stay within
![]() .
It means that there are still some systematic errors in the maps
but at a low level, likely caused by remaining atmospheric fluctuations.
.
It means that there are still some systematic errors in the maps
but at a low level, likely caused by remaining atmospheric fluctuations.
4.3 Upper limits to both fractional dust luminosities and dust masses of the debris disks
![\begin{figure}
\par\includegraphics[width=6.5cm, angle=-90]{12306fg4.ps}
\end{figure}](/articles/aa/full_html/2009/42/aa12306-09/img106.png)
|
Figure 4:
Distribution of the ratios mean brightness |
| Open with DEXTER | |
![\begin{figure}
\par\includegraphics[width=6.3cm, angle=-90]{12306fg5.ps}
\end{figure}](/articles/aa/full_html/2009/42/aa12306-09/img107.png)
|
Figure 5:
Constraints on the dust luminosity fraction versus disk radius.
Note that the x-axis shows the single radius corresponding
to the single temperature of a disk (ring) assumed infinitely narrow in our model. We consider the wide range of radii from
1 to 1000 AU as plausible for rings of debris.
Upper limits are shown as dashed lines, detections as solid lines.
Blue lines correspond to the (sub)millimeter observations: i.e., our sample of 50 M-dwarfs for which dark blue is
used for ``young'' M-dwarfs (ages <200 Myr)
and light blue for ``old'' M-dwarfs (likely a few Gyr); the submm disk detected around AU Mic
and resolved (Liu et al. 2004; Liu 2004) is marked by a single dot; the two submm
disks detected but not clearly resolved around GJ182 (Liu et al. 2004) and around GJ842.2 (Lestrade et al. 2006) are marked as curves; and the submm transition disk
detected around the pre-main sequence M 1 dwarf TWA7 (Matthews et al. 2007) is also included. Orange lines correspond to Spitzer 70 |
| Open with DEXTER | |
The fractional dust luminosity is the fraction
of the stellar radiation absorbed and reprocessed to the infrared and (sub)mm by the dust grains; it is
proportional to the fraction of the sky covered by dust as seen from the star (Dominik & Decin 2003).
We used the Stefan-Boltzmann law - black body emission -to estimate dust luminosity, and modified it by emissivity
![]() ,
with
,
with
![]() for
for
![]() m, and
m, and
![]() for
for
![]() m (Wyatt 2008).
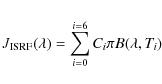
In these conditions, the fractional dust luminosity is
m (Wyatt 2008).
In these conditions, the fractional dust luminosity is
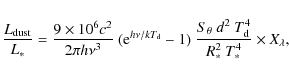
|
(1) |
the normalization coefficient is such that the measured flux density
The standard argument used to fix dust temperature ![]() in mid-IR surveys of debris disks is that observations are most
sensitive to the dust emission peak, and
in mid-IR surveys of debris disks is that observations are most
sensitive to the dust emission peak, and ![]() is derived from the Wien law. In the (sub)mm range, this law is
inappropriate for
is derived from the Wien law. In the (sub)mm range, this law is
inappropriate for ![]() since we observe in the Rayleigh-Jeans limit.
To keep full generality, we avoid choosing a dust temperature
since we observe in the Rayleigh-Jeans limit.
To keep full generality, we avoid choosing a dust temperature ![]() at some arbitrary radius but
plot in Figs. 5 and 6 fractional dust luminosities and dust masses as functions of disk radius r between 1 and 1000 AU following the approach by Bryden et al. (2006) and Wyatt (2008).
At disk radius r, we use the dust temperature
at some arbitrary radius but
plot in Figs. 5 and 6 fractional dust luminosities and dust masses as functions of disk radius r between 1 and 1000 AU following the approach by Bryden et al. (2006) and Wyatt (2008).
At disk radius r, we use the dust temperature
| (2) |
from Black Body equilibrium, where L* is the stellar luminosity in
We adopt the ![]() flux density limit for
flux density limit for
![]() in Eq. (1) by integrating brightness over a face-on disk
of radius r, or
in Eq. (1) by integrating brightness over a face-on disk
of radius r, or ![]() at the distance of the star. If
at the distance of the star. If
![]() (i.e., >IRAM 30 m beam):
(i.e., >IRAM 30 m beam):
This formula takes into account that the mean brightness uncertainty
We used the rms of Tables 3 and 4 that correspond to the central part of the maps, thus underestimating slightly the upper limits computed.
In Fig. 5, we show the resulting fractional dust luminosity upper limits to r between 1 and 1000 AU.
These functions first show a steep negative slope for
![]() making
making
![]() constant in Eq. (1), then these functions level off when
constant in Eq. (1), then these functions level off when
![]() linearly increases with
linearly increases with ![]() ,
and finally they
increase when the dust temperature saturates at 4.9 K because the interstellar radiation field becomes dominant
over the stellar field (see Appendix). In this figure, we have added the upper limits to the fractional dust
luminosities for the 41 M-dwarfs observed at 70
,
and finally they
increase when the dust temperature saturates at 4.9 K because the interstellar radiation field becomes dominant
over the stellar field (see Appendix). In this figure, we have added the upper limits to the fractional dust
luminosities for the 41 M-dwarfs observed at 70 ![]() m by Spitzer (Gautier et al. 2007),
computed in a similar fashion for their 3
m by Spitzer (Gautier et al. 2007),
computed in a similar fashion for their 3![]() flux densities. The figure shows that the two sets of data
are complementary, and lead to a uniform fractional dust luminosity over a large extent of disk radii for the
dozen of M-dwarfs common to the two data sets.
In Fig. 6, we present the corresponding dust masses as a function of r for both samples computed with the optically thin emission
model (e.g., Zuckerman 2001) and the mass opacity
flux densities. The figure shows that the two sets of data
are complementary, and lead to a uniform fractional dust luminosity over a large extent of disk radii for the
dozen of M-dwarfs common to the two data sets.
In Fig. 6, we present the corresponding dust masses as a function of r for both samples computed with the optically thin emission
model (e.g., Zuckerman 2001) and the mass opacity
![]() for
for
![]() m
and
m
and
![]() .
.
![\begin{figure}
\par\includegraphics[width=6.3cm, angle=-90]{12306fg6.ps}
\end{figure}](/articles/aa/full_html/2009/42/aa12306-09/img127.png)
|
Figure 6:
Constraints on the dust mass versus disk radius.
Note that the x-axis shows the single radius corresponding
to the single temperature of a disk (ring) assumed infinitely narrow in our model. We consider the wide range of radii from
1 to 1000 AU as plausible for rings of debris.
Upper limits are shown as dashed lines, detections as solid lines.
Blue lines correspond to the (sub)millimeter observations and
orange lines to the Spitzer 70 |
| Open with DEXTER | |
5 Discussion
The single cold debris disk found in our surveys (GJ842.2, see details in Lestrade et al. (2006), and
excluding GJ526 at this stage) makes the detection fraction to be
2+4.5-1.5%
in our sample of 50 M-dwarfs. The limits are based on the Binomial distribution
for a small number sample and are such that 68% of the probability is between the lower and upper uncertainties,
and the peak probablity is the observed fraction 1/50, following Burgasser et al. (2003).
We recall that Gautier et al. (2007) had no detection in a sample of 62 nearby M-dwarfs at 24 ![]() m and
no detection in a subsample of 41 of them at 70
m and
no detection in a subsample of 41 of them at 70 ![]() m, i.e., rate <7%.
In a different way, Forbrich et al. (2008) detected photometric excesses at 24
m, i.e., rate <7%.
In a different way, Forbrich et al. (2008) detected photometric excesses at 24 ![]() m
tracing warm dust around 11 M-dwarfs in the young open cluster NGC2457 (20-40 Myr) representing
4.9 +1.8-1.8%
of the 225 highly probable member M-stars identified within it.
m
tracing warm dust around 11 M-dwarfs in the young open cluster NGC2457 (20-40 Myr) representing
4.9 +1.8-1.8%
of the 225 highly probable member M-stars identified within it.
To discuss how detectability of cold debris disks depends
on the mass of the central star, we compared our result with the observed fractions
of cold debris disks around stars more massive than M-dwarfs. In the literature,
we find ![]() 30 cold debris disks around A-to-K type stars detected by submm observations
(see Fig. 3 and caption of Wyatt 2008). However most of these detections are from JCMT/SCUBA surveys
of IRAS biased samples, i.e., targets with prior IRAS excess detections, unlike our M-dwarfs,
for which no such prior knowledge was used in the selection of the sample.
There are only two submm surveys of A-to-K type stars that are unbiased in this respect and have
depths of
30 cold debris disks around A-to-K type stars detected by submm observations
(see Fig. 3 and caption of Wyatt 2008). However most of these detections are from JCMT/SCUBA surveys
of IRAS biased samples, i.e., targets with prior IRAS excess detections, unlike our M-dwarfs,
for which no such prior knowledge was used in the selection of the sample.
There are only two submm surveys of A-to-K type stars that are unbiased in this respect and have
depths of ![]() 1-3 mJy at 850
1-3 mJy at 850 ![]() m, comparable to our sensitivity at 1.2 mm:
the JCMT survey by Najita & Williams (2005) of thirteen F5-to-K3 stars (10 Myr < ages <180 Myr,
10 < d < 78 pc, 3 detections) and
the JCMT survey by Wyatt et al. (2003) of nine B7-to-A0 stars (
86< d < 938 pc, 2 detections) and of thirteen F3-to-K5 stars
(
27< d < 250 pc, 1 detection) that are all part of Lindroos binaries (14 Myr < ages < 170 Myr).
Combining these two submm surveys, we determine the cold disk fractions of
22+33-20% for young A stars (2 detections/9)
and of
15 +11.5-11.5% for young FGK stars (4/26). For a meaningful comparison, instructed by
Spitzer surveys where the age factor is crucial for detectability of warm debris disks, we selected
the 19 youngest M dwarfs with ages between 20 and 200 Myr in our sample. The disk fraction for these
``young'' M-dwarfs is
5.3+10.5-5.0%. Therefore, for this age range,
there is an apparent trend in these three fractions, indicative of fewer cold disks
detected for later stellar types - lower star masses - although
at a low statistical significance (Fig. 7). Nonetheless, this trend is notable because the surveys are deeper for later stellar
types as shown in Fig. 8, for disk radii <100 AU. Interestingly, this trend has also been found at
m, comparable to our sensitivity at 1.2 mm:
the JCMT survey by Najita & Williams (2005) of thirteen F5-to-K3 stars (10 Myr < ages <180 Myr,
10 < d < 78 pc, 3 detections) and
the JCMT survey by Wyatt et al. (2003) of nine B7-to-A0 stars (
86< d < 938 pc, 2 detections) and of thirteen F3-to-K5 stars
(
27< d < 250 pc, 1 detection) that are all part of Lindroos binaries (14 Myr < ages < 170 Myr).
Combining these two submm surveys, we determine the cold disk fractions of
22+33-20% for young A stars (2 detections/9)
and of
15 +11.5-11.5% for young FGK stars (4/26). For a meaningful comparison, instructed by
Spitzer surveys where the age factor is crucial for detectability of warm debris disks, we selected
the 19 youngest M dwarfs with ages between 20 and 200 Myr in our sample. The disk fraction for these
``young'' M-dwarfs is
5.3+10.5-5.0%. Therefore, for this age range,
there is an apparent trend in these three fractions, indicative of fewer cold disks
detected for later stellar types - lower star masses - although
at a low statistical significance (Fig. 7). Nonetheless, this trend is notable because the surveys are deeper for later stellar
types as shown in Fig. 8, for disk radii <100 AU. Interestingly, this trend has also been found at ![]() m in a sample
of A to M stars with ages between 8 Myr and 1 Gyr by Plavchan et al. (2009).
m in a sample
of A to M stars with ages between 8 Myr and 1 Gyr by Plavchan et al. (2009).
![\begin{figure}
\par\includegraphics[width=6.3cm, angle=-90]{12306fg7.ps}
\end{figure}](/articles/aa/full_html/2009/42/aa12306-09/img129.png)
|
Figure 7: Detection rates of cold debris disks versus stellar masses (stellar types) for stars younger than 200 Myr. These rates and uncertainties are for disks having dust fractional luminosities larger than the limits shown in Fig. 8 of the (sub)mm surveys used. |
| Open with DEXTER | |
![\begin{figure}
\par\includegraphics[width=6.3cm, angle=-90]{12306fg8.ps}
\end{figure}](/articles/aa/full_html/2009/42/aa12306-09/img130.png)
|
Figure 8:
Dust luminosity versus disk radius limits of the three (sub)mm surveys used to determine
the cold disk fractions of ``young'' M-, FGK- and A-type stars.
Shown are the dust luminosity fractions of the 19 youngest M-dwarfs of our sample (blue),
of the 9 young A-stars (green), and of the 26 young FGK-stars (red) in the two 850 |
| Open with DEXTER | |
We also determine the cold disk fraction of <10% for the ``old'' M-dwarfs of our sample with undetermined ages but that are
probably as old as average Galactic disk stars (
![]() Gyr, del Peloso et al. 2005). This may
indicate that the cold disk fraction decreases with stellar age, in a similar way to warm disks (Rieke et al. 2005).
We note that the ``old'' M-dwarfs were observed with higher sensitivity as seen in Figs. 5 and 6,
where ``young'' and ``old'' M-dwarfs have been color-coded in dark and light blue.
The higher sensitivity to the ``old'' M-dwarfs is because they are nearer than the ``young'' M-dwarfs.
Gyr, del Peloso et al. 2005). This may
indicate that the cold disk fraction decreases with stellar age, in a similar way to warm disks (Rieke et al. 2005).
We note that the ``old'' M-dwarfs were observed with higher sensitivity as seen in Figs. 5 and 6,
where ``young'' and ``old'' M-dwarfs have been color-coded in dark and light blue.
The higher sensitivity to the ``old'' M-dwarfs is because they are nearer than the ``young'' M-dwarfs.
We now examine possible reasons why M-dwarfs have less detectable disks.
Theoretical models of star formation predict that protoplanetary disks are less massive around M-dwarfs
than around higher mass stars. Vorobyov & Basu (2008) predict
![]() ,
where disk mass
,
where disk mass
![]() and star
mass
and star
mass
![]() are time-averaged over the star accretion period (0.5 to 2.5 Myr).
Consequently, less primordial materials could limit planet formation around M-dwarfs.
Collecting masses of protoplanetary disks determined by (sub)mm observations in the nearest star forming regions,
Natta et al. (2000) found
are time-averaged over the star accretion period (0.5 to 2.5 Myr).
Consequently, less primordial materials could limit planet formation around M-dwarfs.
Collecting masses of protoplanetary disks determined by (sub)mm observations in the nearest star forming regions,
Natta et al. (2000) found
![]() ,
but Andrews & Williams (2005, 2007) show that
,
but Andrews & Williams (2005, 2007) show that ![]() versus M* in Taurus-Auriga is so widely scattered
between 0.001 and 0.2
versus M* in Taurus-Auriga is so widely scattered
between 0.001 and 0.2 ![]() that it
precludes any meaningful correlation fit. The comparison of the disk masses of 6 members of the
nearby young TW Hydrae Association (TWA) also suggests no correlation between disk masses and stellar
types for these reasonably coeval disks (Matthews et al. 2007).
that it
precludes any meaningful correlation fit. The comparison of the disk masses of 6 members of the
nearby young TW Hydrae Association (TWA) also suggests no correlation between disk masses and stellar
types for these reasonably coeval disks (Matthews et al. 2007).
Removal of circumstellar dust by the Poynting-Robertson effect and radiation pressure processes are diminished around M-dwarfs because they are less luminous than solar-type stars, and so dust generated by collisions in any remnant planetesimal belt should remain there longer, giving rise to detectable emission. However, the opposite conclusion has been reached by Plavchan et al. (2005), highlighting the fact that dust removal around M-dwarfs could be dominated by the drag caused by strong winds associated with their high coronal and chromospheric activities.
The formation of planetesimals and planets depends on the
timescales between the competing processes of coagulation and evaporation in the early period of accumulation. Theory predicts
that
![]() increases and
increases and
![]() decreases with both the central star mass and the strength of the FUV and EUV radiation
field (Eq. (47) and (48) in Adams et al. 2004, respectively). From their Fig. 10, it can be seen that
a time longer than 10 Myr is required to evaporate a protoplanetary disk around a solar-mass star, whereas
only a few Myr are required to evaporate the same disk around a low-mass M-dwarf
in a stellar cluster with a moderate UV flux of
decreases with both the central star mass and the strength of the FUV and EUV radiation
field (Eq. (47) and (48) in Adams et al. 2004, respectively). From their Fig. 10, it can be seen that
a time longer than 10 Myr is required to evaporate a protoplanetary disk around a solar-mass star, whereas
only a few Myr are required to evaporate the same disk around a low-mass M-dwarf
in a stellar cluster with a moderate UV flux of ![]() 3000 G0. This might quench planet formation around M-dwarfs.
3000 G0. This might quench planet formation around M-dwarfs.
Early stripping of planetesimals by passing stars is likely since
most stars are born in clusters where stellar encounters as close as 160 AU are likely in the first 100 Myr
(Kenyon & Bromley 2004b). The disruption of planetesimal disks by close stellar encounters
was studied for the A6 star ![]() Pic by Larwood & Kalas (2001).
Depending on both the passing star's trajectory and the relative star masses, they found that
1% to 48% of the planetesimals are lost after encounters. Related issues for planetary systems were also discussed
by Malmberg et al. (2007).
Pic by Larwood & Kalas (2001).
Depending on both the passing star's trajectory and the relative star masses, they found that
1% to 48% of the planetesimals are lost after encounters. Related issues for planetary systems were also discussed
by Malmberg et al. (2007).
A lack of gaseous giant planets around M-dwarfs is predicted by Laughlin et al. (2004),
because of the longer duration required to build a core of 15
![]() .
This lack of giant planets might reduce the production of second generation dust in M-dwarf debris disks
because of weaker gravitationnal stirring (Wilner et al. 2002), diminishing their detectability.
.
This lack of giant planets might reduce the production of second generation dust in M-dwarf debris disks
because of weaker gravitationnal stirring (Wilner et al. 2002), diminishing their detectability.
This series of arguments leads to the expectation that debris disks around M-dwarfs might be intrinsically less dusty and therefore more difficult to detect than those around more massive stars of the same age. However, most of these arguments assume that the initial protoplanetary disk mass scales with the central star mass, which may be plausible but is observationally not well established.
6 Conclusion
To search for emission from cold debris disks, we have used the MAMBO-2 bolometer camera
at the IRAM 30 m telescope to map 42 nearby M-dwarfs at
![]() mm to a noise level
of between 0.6 and 2.8 mJy per 11'' beam. We also reanalyzed our earlier MAMBO-2 and SCUBA data
to form a coherent sample of 50 M-dwarfs.
Only one cold debris disk was detected, surrounding the M 0.5 dwarf GJ842.2.
To discuss how the detectability of cold debris disks depends
on the mass of the central star, we have compared this result to the observed fractions of cold disks
for more massive stars in the two submm surveys of Wyatt et al. (2003) and
Najita & Williams (2005), who report detection rates of
22+33-20% for A-stars
and
15 +11.5-11.5% for FGK-stars with stellar ages between 10 and 180 Myr. For
the 19 youngest M-dwarfs (
mm to a noise level
of between 0.6 and 2.8 mJy per 11'' beam. We also reanalyzed our earlier MAMBO-2 and SCUBA data
to form a coherent sample of 50 M-dwarfs.
Only one cold debris disk was detected, surrounding the M 0.5 dwarf GJ842.2.
To discuss how the detectability of cold debris disks depends
on the mass of the central star, we have compared this result to the observed fractions of cold disks
for more massive stars in the two submm surveys of Wyatt et al. (2003) and
Najita & Williams (2005), who report detection rates of
22+33-20% for A-stars
and
15 +11.5-11.5% for FGK-stars with stellar ages between 10 and 180 Myr. For
the 19 youngest M-dwarfs (![]() 200 Myr) of our sample, we found a detection rate of
5.3+10.5-5.0%.
Hence, for this age range, there is a mild trend in these three detections rates,
indicative of fewer cold debris disks detected for later stellar types -
lower star masses - although at a low statistical significance. Nonethless this trend
is notable because the sensitivities of these surveys are deeper for later stellar types.
We also determine the cold disk fraction of <10% for the ``old'' M-dwarfs (likely to be a few Gyr) of our sample,
indicative of the cold disk fraction decreasing with stellar age, as is also seen for warm disks.
Future observations of a larger and more tightly controlled
sample of stars of all stellar types with Herschel in the far-IR and deeper observations
in the (sub)mm will help to clarify these issues.
200 Myr) of our sample, we found a detection rate of
5.3+10.5-5.0%.
Hence, for this age range, there is a mild trend in these three detections rates,
indicative of fewer cold debris disks detected for later stellar types -
lower star masses - although at a low statistical significance. Nonethless this trend
is notable because the sensitivities of these surveys are deeper for later stellar types.
We also determine the cold disk fraction of <10% for the ``old'' M-dwarfs (likely to be a few Gyr) of our sample,
indicative of the cold disk fraction decreasing with stellar age, as is also seen for warm disks.
Future observations of a larger and more tightly controlled
sample of stars of all stellar types with Herschel in the far-IR and deeper observations
in the (sub)mm will help to clarify these issues.
Appendix A: Computation of the dust temperature and mass of the possible large debris disk around GJ526
The source that heats dust in debris disks is usually the stellar radiation field, but in a large debris disk, as possibly found around GJ526, the interstellar radiation field dominates at some radius from the star. We compute this transition radius for several stellar spectral types by numerically solving the integral equation of a grain at thermal equilibrium absorbing both the stellar and interstellar incident fields
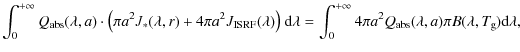
|
(A.1) |
![\begin{figure}
\par\includegraphics[width=6.5cm, angle=-90]{12306fA1.ps}
\end{figure}](/articles/aa/full_html/2009/42/aa12306-09/img142.png)
|
Figure A.1:
Variation in the temperature of a grain 100 |
| Open with DEXTER | |
where
![]() for
for
![]() and
and
![]() with
with
![]() for
for
![]() ,
which approximate the absorption efficiency computed
for carbon by Laor & Draine (1993). The parameter a is the radius of a spherical grain.
The expression
,
which approximate the absorption efficiency computed
for carbon by Laor & Draine (1993). The parameter a is the radius of a spherical grain.
The expression
![]() is the Planck function at grain
temperature
is the Planck function at grain
temperature ![]() that depends on a. The intensity
of the stellar radiation field
that depends on a. The intensity
of the stellar radiation field
![]() is
is
![]() at disk radius r,
where the star is characterized by its effective temperature T* and its radius R*.
The intensity of the interstellar radiation field
at disk radius r,
where the star is characterized by its effective temperature T* and its radius R*.
The intensity of the interstellar radiation field
![]() in the solar neighbourhood is
in the solar neighbourhood is
with components
![]() ,
at galactocentric distance 10 kpc (Mathis et al. 1983).
In Fig. A.1, we solved Eq. (A1) numerically to determine dust temperature
,
at galactocentric distance 10 kpc (Mathis et al. 1983).
In Fig. A.1, we solved Eq. (A1) numerically to determine dust temperature
![]() as a function of disk radius
in modelling grains with the single size
as a function of disk radius
in modelling grains with the single size
![]() m, typical of submm observations, and for several stellar spectral types. For GJ526 (M 1.5), this
figure shows that the interstellar radiation field becomes dominant at r > 1000 AU,
but this transition radius is only 200 AU for spectral type M 6.
m, typical of submm observations, and for several stellar spectral types. For GJ526 (M 1.5), this
figure shows that the interstellar radiation field becomes dominant at r > 1000 AU,
but this transition radius is only 200 AU for spectral type M 6.
![\begin{figure}
\includegraphics[width=6.5cm, angle=-90]{12306fA2.ps}
\end{figure}](/articles/aa/full_html/2009/42/aa12306-09/img157.png)
|
Figure A.2:
Variation in temperature as a function of grain radius at 500 AU from the M 1.5 dwarf GJ526.
Similar results are reported by Krügel (2003, p. 249). The discontinuity in the silicate curve arises from
the piecewise-defined function
|
| Open with DEXTER | |
In Fig. A.2, we use a more realistic model for the dust in adopting the standard grain size
distribution
![]() (Dohnanyi 1969) to compute temperature
(Dohnanyi 1969) to compute temperature
![]() as a function of grain
size at r=500 AU with Eq. (A1) but modified to include the grain size
distribution. Temperature increases significantly
for
as a function of grain
size at r=500 AU with Eq. (A1) but modified to include the grain size
distribution. Temperature increases significantly
for
![]() m, which is relevant for M-dwarfs because the grain blow-out size is small. For GJ526 (0.031
m, which is relevant for M-dwarfs because the grain blow-out size is small. For GJ526 (0.031 ![]() ), it is
as small as 0.04
), it is
as small as 0.04 ![]() m for carboneous grains,
ignoring the effect of stellar wind drag for this star, which has a low coronal/chromospheric activity
(Log
m for carboneous grains,
ignoring the effect of stellar wind drag for this star, which has a low coronal/chromospheric activity
(Log
![]() [10-7 W], Schmitt & Liefke, 2004).
Finally, we use this temperature function
[10-7 W], Schmitt & Liefke, 2004).
Finally, we use this temperature function
![]() at r=500 AU to determine the dust mass
around GJ526 by matching the total flux density
of the 5 clumps (
at r=500 AU to determine the dust mass
around GJ526 by matching the total flux density
of the 5 clumps (
![]() mJy) to the flux density of our model.
If d is the distance to the star, the predicted flux density is
mJy) to the flux density of our model.
If d is the distance to the star, the predicted flux density is
| (A.2) |
where the limit
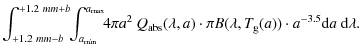
|
(A.3) |
This power would need to be computed more accurately by including the small contribution to the emission of larger pebbles only if the flux density were measured more accurately. We found that
![\begin{figure}
\includegraphics[width=6.2cm, angle=-90]{12306fA3.ps}
\end{figure}](/articles/aa/full_html/2009/42/aa12306-09/img175.png)
|
Figure A.3:
SED of carboneous dust around GJ526 based on our model fitted to the 1.2 mm flux density.
Our model includes the collisional dust size
distribution
|
| Open with DEXTER | |
![\begin{figure}
\includegraphics[width=6.2cm, angle=-90]{12306fA4.ps}
\end{figure}](/articles/aa/full_html/2009/42/aa12306-09/img176.png)
|
Figure A.4: SED of silicate dust around GJ526 based on our model and fitted to the 1.2 mm flux density. Same comments as in Fig. A.3. (This figure is available in color in electronic form.) |
| Open with DEXTER | |
Figures A.3 and A.4 show the SED of the dust around GJ526 based on our model of both carboneous and
silicate grains adjusted to the flux density measured at 1.2 mm. The
dust mass determined by our model is between ![]() 6 and
6 and ![]() 10 lunar masses.
We have added in these figures, the SED based on the standard grey-body model
of optically thin dust emission (Hildebrand 1983; and Zuckerman 2001)
10 lunar masses.
We have added in these figures, the SED based on the standard grey-body model
of optically thin dust emission (Hildebrand 1983; and Zuckerman 2001)
| (A.4) |
where the mass opacity
The SED of our model is significantly more extended to the far-IR
and to the radio than the grey-body model when both models match
the flux density at
![]() mm. We point out that this far-IR extension is much less pronounced
if our model is applied to an A-star.
Future observations with Herschel will test these SED differences and will thus probe, in essence, the collisional dust size
distribution adopted and the non-uniform grain temperature.
mm. We point out that this far-IR extension is much less pronounced
if our model is applied to an A-star.
Future observations with Herschel will test these SED differences and will thus probe, in essence, the collisional dust size
distribution adopted and the non-uniform grain temperature.
We are grateful to the staff of the IRAM 30-m telescope, especially Dr S. Leon, for his dedication in managing the MAMBO-2 pool during the transistion period with the new contral system and for his unfailing determination to optimize the science return of the telescope despite harsh conditions. We would like to thank an anonymous referee for his careful reading of the manuscript and constructive remarks. This research has made use of the SIMBAD database and of the VizieR catalog access tool, opera ted at the Centre de Données Stellaires (CDS), Strasbourg, France. This publication makes use of data products from the Two Micron All Sky Survey, which is a joint project of the University of Massachusetts and the Infrared Processing and Analysis Center/California Institute of Technology, funded by the National Aeronautics and Space Administration and the National Science Foundation. This publication has made use of data products from the SDSS and SDSS-II funded by the Alfred P. Sloan Foundation, the Participating Institutions, the National Science Foundation, the US Department of Energy, the National Aeronautics and Space Administration, the Japanese Monbukagakusho, the Max Planck Society, and the Higher Education Funding Council for England. This work is based in part on observations made with the Spitzer Space Telescope, which is operated by the Jet Propulsion Laboratory, California Institute of Technology under a contract with NASA.
References
- Adams, F. C., Hollenbach, D., Laughlin, G., & Gorti, U. 2004, ApJ, 611, 360 [NASA ADS] [CrossRef]
- Allard, F., Hauschildt, P. H., Alexander, D. R., Tamanai, A., & Schweitzer, A. 2001, ApJ, 556, 357 [NASA ADS] [CrossRef]
- Andrews, S. M., & Williams, J. P. 2005, ApJ, 631, 1134 [NASA ADS] [CrossRef]
- Andrews, S. M., & Williams, J. P. 2007, ApJ, 671, 1800 [NASA ADS] [CrossRef]
- Augereau, J.-C., & Paploizou, J. C. B. 2004, A&A, 414, 1153 [NASA ADS] [CrossRef] [EDP Sciences]
- Aumann, H. H., Beichman, C. A., Gillett, F. C., et al. 1984, ApJ, 278, 23 [NASA ADS] [CrossRef]
- Backman D. E., & Paresce, F. 1993, in Protostars and Planets III, ed. E. H. Levy, & J. I. Lumine (Tucson: Univ. Press), 1253
- Berger D. H., Gies, D. R., McAlister, H. A., et al. 2006, ApJ, 644, 475 [NASA ADS] [CrossRef]
- Bertoldi, F., Carilli, C., Aravena, M., et al. 2007, ApJS, 172, 132 [NASA ADS] [CrossRef]
- Bryden, G. C., Beichman, C. A., Trilling, D. E., et al. 2006, ApJ, 636, 1098 [NASA ADS] [CrossRef]
- Burgasser, A. J., Kirkpatrick, J. D., Reid, I. N., et al. 2003, ApJ, 586, 512 [NASA ADS] [CrossRef]
- Chabrier, G., & Baraffe, I. 1997, A&A, 327, 1039 [NASA ADS]
- Condon, J. J., Cotton, W. D., Greisen, E. W., et al. 1998, AJ, 115, 1693 [NASA ADS] [CrossRef]
- del Peloso, E. F., da Silva, L., Porto de Mello, G. F., & Arany-Prado, L. I. 2005, A&A, 440, 1153 [NASA ADS] [CrossRef] [EDP Sciences]
- Diggle, P. J. 2003, in Statistical Analysis of Spatial Point Patterns (Hodder Arnold)
- Dohnanyi, J. S., 1969, J. Geophys. Res., 74, 2531 [NASA ADS] [CrossRef]
- Dominik, C., & Decin, G. 2003, ApJ, 583, 626 [NASA ADS] [CrossRef]
- Dutrey, A., Guilloteau, S., & Simon, M. 1994, A&A, 286, 149 [NASA ADS]
- Forbrich, J., Lada, C. J., Muench, A. A., & Teixeira, P. S. 2008, ApJ, 687, 1107 [NASA ADS] [CrossRef]
- Gautier, T. N., Rieke, G. H., Stansberry, J., et al. 2007, ApJ, 667, 527 [NASA ADS] [CrossRef]
- Gomes, R., Levison, H. F., Tsiganis, K., & Morbidelli, A. 2005, Nature, 435, 466 [NASA ADS] [CrossRef].
- Greaves, J. S., Holland, W. S., Wyatt, M. C., et al. 2005, ApJ, 619, 187 [NASA ADS] [CrossRef]
- Greve, T. R., Ivison, R. J., Bertoldi, F., et al. 2004, MNRAS, 354, 779 [NASA ADS] [CrossRef]
- Hahn, J. M., & Malhotra, R. 1999, AJ, 117, 3041 [NASA ADS] [CrossRef]
- Hildebrand, R. H. 1983, QJLR Astr. Soc., 24, 267 [NASA ADS]
- Holland, W. S., Greaves, J. S., Zuckerman, B., et al. 1998, Nature, 392, 788 [NASA ADS] [CrossRef]
- Kalas, P., Graham, J., & Clampin, M. 2005, Nature, 435, 1067 [NASA ADS] [CrossRef]
- Kenyon, S. J., & Bromley, B. C. 2004a, AJ, 127, 513 [NASA ADS] [CrossRef]
- Kenyon, S. J., & Bromley, B. C. 2004b, Nature, 432, 598 [NASA ADS] [CrossRef]
- Kreysa, E., Gemünd, H. P., Gromke, J., et al. 1998, in Advanced Technology MMW, Radio, and Terahertz Telescopes, ed. T. G. Phillips, SPIE, 3357, 319
- Krist, J. E., Ardila, D. R., Golimowski, D. A., et al. 2005, AJ, 129, 1008 [NASA ADS] [CrossRef]
- Krügel, E. 2003, in The Physics of Interstellar Dust (Institute of Physics Publishing: Series Astronomy & Astrophysics)
- Laor, A., & Draine, B. T. 1993, ApJ, 402, 441 [NASA ADS] [CrossRef]
- Larwood, J. D., & Kalas, P. G. 2001, MNRAS, 323, 402 [NASA ADS] [CrossRef]
- Laughlin, G., Bodenheimer, P., & Adams, F. 2004, ApJ, 612, L73 [NASA ADS] [CrossRef]
- Lestrade, J.-F., Wyatt, M. C., Bertoldi, F., Dent, W. R. F., & Menten, K. M. 2006, A&A, 460, 733 [NASA ADS] [CrossRef] [EDP Sciences]
- Liseau, R. Risacher, C., Brandeker, A., et al. 2008, A&A, 480, 47 [NASA ADS] [CrossRef]
- Lissauer, J. J., 1987, Icarus, 69, 249 [NASA ADS] [CrossRef]
- Liu, M. C. 2004, Science, 305, 1442 [NASA ADS] [CrossRef]
- Liu, M. C., Matthews, B. C., Williams, J. P., & Kalas, P. G. 2004, ApJ, 608, 526 [NASA ADS] [CrossRef]
- Malmberg, D., de Angeli, F., Davies, M. B., et al. 2007, MNRAS, 378, 1207 [NASA ADS] [CrossRef]
- Mathis, J. S., Mezger, P. G., & Panagia, N. 1983, A&A, 128, 212 [NASA ADS]
- Matthews, B. C., Kalas, P. G., & Wyatt, M. C. 2007, ApJ, 663, 1103 [NASA ADS] [CrossRef]
- Monet, D. G., Levine, S. E., Canzian, B., et al. 2003, AJ, 125, 984 [NASA ADS] [CrossRef]
- Montes, D., López-Santiago, J., Gálvez, M. C., et al. 2001, MNRAS, 328, 45 [NASA ADS] [CrossRef]
- Morbidelli, A., Levison, H. F., Tsiganis, K., & Gomes, R. 2005, Nature, 435, 462 [NASA ADS] [CrossRef]
- Najita, J., & Williams, J. P. 2005, ApJ, 635, 625 [NASA ADS] [CrossRef]
- Natta, A., Grinin, V., & Mannings, V. 2000, Protostars and Planets IV (Book-Tucson: University of Arizona Press), 559
- Plavchan, P., Jura, M., & Lipscy, S. J. 2005, ApJ, 631, 1161 [NASA ADS] [CrossRef]
- Plavchan, P., Werner, M. W., Chen, C. H., et al. 2009, ApJ, 698, 1068 [NASA ADS] [CrossRef]
- Reche, R., Beust, H., Augereau, J.-C., & Absil, O. 2008, A&A, 480, 551 [NASA ADS] [CrossRef] [EDP Sciences]
- Rieke, G. H., Su, K. Y. L., Stansberry, J. A., et al. 2005, ApJ, 620, 1010 [NASA ADS] [CrossRef]
- Schmitt J. H. M. M., & Liefke C. 2004, A&A, 417, 651 [NASA ADS] [CrossRef] [EDP Sciences]
- Siess L., Dufour E., & Forestini M. 2000, A&A, 358, 593 [NASA ADS]
- Silverstone, M. D. 2000, Ph.D. Thesis, UCLA
- Skrutskie, M. F., Cutri, R. M., Stiening, R., et al. 2006, AJ, 131, 1163 [NASA ADS] [CrossRef]
- Smith B. A., & Terrile, R. J., 1984, Science, 226, 1421 [NASA ADS] [CrossRef]
- Smith, P. S., Hines, D. C., Low, F. J., et al. 2006, ApJ, 644, L125 [NASA ADS] [CrossRef]
- Smith, R., Wyatt, M. C., & Dent, W. R. F. 2008, A&A, 485, 897 [NASA ADS] [CrossRef] [EDP Sciences]
- Spangler, C., Sargent, A. I., Silverstone, M. D., Becklin, E. E., & Zuckerman, B. 2001, ApJ, 555, 932 [NASA ADS] [CrossRef]
- Su, K. Y. L., Rieke, G. H., Stapelfeldt, K. R., et al. 2006, ApJ, 653, 675 [NASA ADS] [CrossRef]
- Su, K. Y. L., Rieke, G. H., Stapelfeldt, K. R., et al. 2008, ApJ, 679, 125 [NASA ADS] [CrossRef]
- Tacconi, L. J., Genzel, R., Smail, I., et al. 2008, ApJ, 680, 246 [NASA ADS] [CrossRef]
- Trilling, D. E., Bryden, G., Beichman, C. A., et al. 2008, ApJ, 674, 1086 [NASA ADS] [CrossRef]
- Tsiganis, K., Gomes, R., Morbidelli, A., & Levison, H. F. 2005, Nature, 435, 459 [NASA ADS] [CrossRef]
- Vorobyov, E. I., & Basu, S. 2008, ApJ, 676, L139 [NASA ADS] [CrossRef]
- Voss, H., Bertoldi, F., Carilli, C., et al. 2006, A&A, 448, 823 [NASA ADS] [CrossRef] [EDP Sciences]
- Wilner, D. J., Holman, M. J., Kuchner, M. J., & Ho, P. T. P. 2002, ApJ, 569, L115 [NASA ADS] [CrossRef]
- Wyatt, M. C. 2003, ApJ, 598, 1321 [NASA ADS] [CrossRef]
- Wyatt, M. C. 2006, ApJ, 639, 1153 [NASA ADS] [CrossRef]
- Wyatt, M. C. 2008, ARA&A, 46, 339 [NASA ADS] [CrossRef]
- Wyatt, M. C., & Dent, W. F. R. 2002, MNRAS, 334, 589 [NASA ADS] [CrossRef]
- Wyatt, M. C., Dent, W. F. R., & Greaves, J. S. 2003, MNRAS, 342, 876 [NASA ADS] [CrossRef]
- Zuckerman, B. 2001, ARA&A, 39, 549 [NASA ADS] [CrossRef]
- Zuckerman, B., & Inseok Song 2004a, ARA&A, 42, 685 [NASA ADS] [CrossRef]
- Zuckerman, B., & Inseok Song 2004b, ApJ, 613, L65 [NASA ADS] [CrossRef]
Footnotes
All Tables
Table 1: The 50 M-dwarfs of our (sub)mm surveys.
Table 2: Millimeter sources found in our MAMBO-2 maps.
Table 3: Search for debris disks around nearby M-dwarfs with our new MAMBO-2 data.
Table 4: Reanalysis of the MAMBO-2 data of the M-dwarfs associated with moving groups of survey I.
Table 5: SCUBA observations of the M-dwarfs associated with moving groups in survey I (Lestrade et al. 2006).
All Figures
|
|
Figure 1:
MAMBO-2 Signal-to-noise ratio map of the field around the M1.5 dwarf GJ526 at
|
| Open with DEXTER | |
| In the text | |
|
|
Figure 2:
MAMBO-2 Signal-to-noise ratio map of the field around the binary GJ725 (M3 + M3.5 dwarfs) at
|
| Open with DEXTER | |
| In the text | |
|
|
Figure 3:
MAMBO-2 Signal-to-noise ratio map of the field around the binary GJ569 (M 2.5 + M 8.5 dwarfs) at
|
| Open with DEXTER | |
| In the text | |
|
|
Figure 4:
Distribution of the ratios mean brightness |
| Open with DEXTER | |
| In the text | |
|
|
Figure 5:
Constraints on the dust luminosity fraction versus disk radius.
Note that the x-axis shows the single radius corresponding
to the single temperature of a disk (ring) assumed infinitely narrow in our model. We consider the wide range of radii from
1 to 1000 AU as plausible for rings of debris.
Upper limits are shown as dashed lines, detections as solid lines.
Blue lines correspond to the (sub)millimeter observations: i.e., our sample of 50 M-dwarfs for which dark blue is
used for ``young'' M-dwarfs (ages <200 Myr)
and light blue for ``old'' M-dwarfs (likely a few Gyr); the submm disk detected around AU Mic
and resolved (Liu et al. 2004; Liu 2004) is marked by a single dot; the two submm
disks detected but not clearly resolved around GJ182 (Liu et al. 2004) and around GJ842.2 (Lestrade et al. 2006) are marked as curves; and the submm transition disk
detected around the pre-main sequence M 1 dwarf TWA7 (Matthews et al. 2007) is also included. Orange lines correspond to Spitzer 70 |
| Open with DEXTER | |
| In the text | |
|
|
Figure 6:
Constraints on the dust mass versus disk radius.
Note that the x-axis shows the single radius corresponding
to the single temperature of a disk (ring) assumed infinitely narrow in our model. We consider the wide range of radii from
1 to 1000 AU as plausible for rings of debris.
Upper limits are shown as dashed lines, detections as solid lines.
Blue lines correspond to the (sub)millimeter observations and
orange lines to the Spitzer 70 |
| Open with DEXTER | |
| In the text | |
|
|
Figure 7: Detection rates of cold debris disks versus stellar masses (stellar types) for stars younger than 200 Myr. These rates and uncertainties are for disks having dust fractional luminosities larger than the limits shown in Fig. 8 of the (sub)mm surveys used. |
| Open with DEXTER | |
| In the text | |
|
|
Figure 8:
Dust luminosity versus disk radius limits of the three (sub)mm surveys used to determine
the cold disk fractions of ``young'' M-, FGK- and A-type stars.
Shown are the dust luminosity fractions of the 19 youngest M-dwarfs of our sample (blue),
of the 9 young A-stars (green), and of the 26 young FGK-stars (red) in the two 850 |
| Open with DEXTER | |
| In the text | |
|
|
Figure A.1:
Variation in the temperature of a grain 100 |
| Open with DEXTER | |
| In the text | |
|
|
Figure A.2:
Variation in temperature as a function of grain radius at 500 AU from the M 1.5 dwarf GJ526.
Similar results are reported by Krügel (2003, p. 249). The discontinuity in the silicate curve arises from
the piecewise-defined function
|
| Open with DEXTER | |
| In the text | |
|
|
Figure A.3:
SED of carboneous dust around GJ526 based on our model fitted to the 1.2 mm flux density.
Our model includes the collisional dust size
distribution
|
| Open with DEXTER | |
| In the text | |
|
|
Figure A.4: SED of silicate dust around GJ526 based on our model and fitted to the 1.2 mm flux density. Same comments as in Fig. A.3. (This figure is available in color in electronic form.) |
| Open with DEXTER | |
| In the text | |
Copyright ESO 2009
Current usage metrics show cumulative count of Article Views (full-text article views including HTML views, PDF and ePub downloads, according to the available data) and Abstracts Views on Vision4Press platform.
Data correspond to usage on the plateform after 2015. The current usage metrics is available 48-96 hours after online publication and is updated daily on week days.
Initial download of the metrics may take a while.