| Issue |
A&A
Volume 506, Number 3, November II 2009
|
|
|---|---|---|
| Page(s) | 1169 - 1182 | |
| Section | Galactic structure, stellar clusters, and populations | |
| DOI | https://doi.org/10.1051/0004-6361/200912210 | |
| Published online | 08 September 2009 | |
A&A 506, 1169-1182 (2009)
Candidate free-floating super-Jupiters in the young  Orionis open cluster
G. Bihain1,2 - R. Rebolo1,2 - M. R. Zapatero Osorio1 - V. J. S. Béjar1 - I. Villó-Pérez3 - A. Díaz-Sánchez3 - A. Pérez-Garrido3 - J. A. Caballero4 - C. A. L. Bailer-Jones5 - D. Barrado y Navascués6,7 - J. Eislöffel8 - T. Forveille9 - B. Goldman5 - T. Henning5 - E. L. Martín1,10 - R. Mundt5
1 - Instituto de Astrofísica de Canarias, c/ vía Láctea, s/n, 38205 La Laguna, Tenerife, Islas Canarias, Spain
2 -
Consejo Superior de Investigaciones Científicas, Spain
3 -
Universidad Politécnica de Cartagena, Campus Muralla del Mar, 30202 Cartagena, Murcia, Spain
4 - Dpto. de Astrofísica y Ciencias de la Atmósfera, Facultad de
Física, Universidad Complutense de Madrid, 28040 Madrid, Spain
5 -
Max-Planck-Institut für Astronomie, Königstuhl 17, 69117 Heidelberg, Germany
6 - Laboratorio de Astrofísica Espacial y Exoplanetas, Centro de
Astrobiologia (LAEFF-CAB, INTA-CSIC), European Space Astronomy centre
(ESAC), PO Box 78, 28691 Villanueva de la Cañada, Madrid, Spain
7 -
Spanish Virtual Observatory thematic network, Spain
8 -
Thüringer Landessternwarte Tautenburg, Sternwarte 5, 07778 Tautenburg, Germany
9 - Laboratoire d'Astrophysique de Grenoble, Observatoire de Grenoble,
Université Joseph Fourier, CNRS, UMR 571, Grenoble, France
10 -
University of Central Florida. Department of Physics, PO Box 162385, Orlando, FL 32816-2385, USA
Received 26 March 2009 / Accepted 31 July 2009
Abstract
Context. Free-floating substellar candidates with estimated theoretical masses of as low as ![]() 5 Jupiter masses have been found in the
5 Jupiter masses have been found in the ![]() 3 Myr old
3 Myr old ![]() Orionis
open cluster. As the overlap with the planetary mass domain increases,
the question of how these objects form becomes important. The
determination of their number density and whether a mass cut-off limit
exists is crucial to understanding their formation.
Orionis
open cluster. As the overlap with the planetary mass domain increases,
the question of how these objects form becomes important. The
determination of their number density and whether a mass cut-off limit
exists is crucial to understanding their formation.
Aims. We propose to search for objects of yet lower masses in the cluster and determine the shape of the mass function at low mass.
Methods. Using new- and (re-analysed) published
![]() -band data of an area of 840 arcmin2, we performed a search for LT-type cluster member candidates in the magnitude range J=19.5-21.5 mag, based on their expected magnitudes and colours.
-band data of an area of 840 arcmin2, we performed a search for LT-type cluster member candidates in the magnitude range J=19.5-21.5 mag, based on their expected magnitudes and colours.
Results. Besides recovering the T type object
S Ori 70 and two other known objects, we find three
new cluster member candidates, S Ori 72-74, with
![]() mag and within 12 arcmin of the cluster centre. They have theoretical masses of 4
-2+3
mag and within 12 arcmin of the cluster centre. They have theoretical masses of 4
-2+3
![]() and are among the least massive free-floating objects detected by
direct imaging outside the Solar System. The photometry in archival Spitzer
[3.6]-[5.8]-band images infers that S Ori 72 is an
L/T transition candidate and S Ori 73 a T-type
candidate, following the expected cluster sequence in the mid-infrared.
Finally, the L-type candidate S Ori 74 with lower
quality photometry is located at 11.8 arcsec (
and are among the least massive free-floating objects detected by
direct imaging outside the Solar System. The photometry in archival Spitzer
[3.6]-[5.8]-band images infers that S Ori 72 is an
L/T transition candidate and S Ori 73 a T-type
candidate, following the expected cluster sequence in the mid-infrared.
Finally, the L-type candidate S Ori 74 with lower
quality photometry is located at 11.8 arcsec (![]() 4250 AU) of a stellar member of
4250 AU) of a stellar member of ![]() Orionis and could be a companion. After contaminant correction in the area complete to J=21.1 mag, we estimate that there remain between zero and two cluster members in the mass interval 6-4
Orionis and could be a companion. After contaminant correction in the area complete to J=21.1 mag, we estimate that there remain between zero and two cluster members in the mass interval 6-4
![]() .
.
Conclusions. We present S Ori 73, a new candidate T type and candidate ![]() Orionis member of a few Jupiter masses. Our result suggests a possible turnover in the substellar mass spectrum below
Orionis member of a few Jupiter masses. Our result suggests a possible turnover in the substellar mass spectrum below ![]() 6 Jupiter masses, which could be investigated further by wider and deeper photometric surveys.
6 Jupiter masses, which could be investigated further by wider and deeper photometric surveys.
Key words: stars: luminosity function, mass function - Galaxy:
open clusters and associations: individual: ![]() Orionis - stars: low-mass, brown dwarfs
Orionis - stars: low-mass, brown dwarfs
1 Introduction
Free-floating objects with masses of several to a few times the mass of Jupiter
appear to populate young open clusters
(see Lucas & Roche 2000; Zapatero Osorio et al. 2000). They could form in a similar way to
stars, by gravitational fragmentation above an opacity mass limit
(Low & Lynden-Bell 1976; Larson 1973; Hoyle 1953; Rees 1976; Silk 1977) or by turbulent
fragmentation (Padoan et al. 2007; Padoan & Nordlund 2004,2002) of collapsing molecular
clouds, or as stellar embryos that are fragmented, photo-eroded, or ejected before
they can accrete sufficient mass to become stars (see Whitworth & Goodwin 2005, and
references therein). They could also form by gravitational instability in
circumstellar disks (Whitworth & Stamatellos 2006; Boss 1997), then have their orbits
disrupted and be ejected (Stamatellos & Whitworth 2009; Veras et al. 2009). A better knowledge of
the cluster mass function (MF; number of objects per unit mass) at these low
masses will help us to determine the main formation process for these objects.
Indeed, numerical simulations of opacity-limited fragmentation show a cutoff in
the mass function at ![]() 4 Jupiter masses (Bate & Bonnell 2005; Bate 2005,2009),
whereas numerical simulations of turbulent fragmentation show an approximately
log-normal, shallower drop at substellar masses (Padoan & Nordlund 2004). A detailed
comparison with planets (e.g., spectral emission and chemical composition) will
also provide complementary information about their origin and evolution
(Fortney et al. 2008).
4 Jupiter masses (Bate & Bonnell 2005; Bate 2005,2009),
whereas numerical simulations of turbulent fragmentation show an approximately
log-normal, shallower drop at substellar masses (Padoan & Nordlund 2004). A detailed
comparison with planets (e.g., spectral emission and chemical composition) will
also provide complementary information about their origin and evolution
(Fortney et al. 2008).
The ![]() Orionis open cluster in the Ori OB 1b association,
together with other star-forming regions in the Orion and
Scorpius-Centaurus complexes, is well-suited to the search for free-floating
planetary-mass objects. It is young (
Orionis open cluster in the Ori OB 1b association,
together with other star-forming regions in the Orion and
Scorpius-Centaurus complexes, is well-suited to the search for free-floating
planetary-mass objects. It is young (![]() Myr; Zapatero Osorio et al. 2002b),
relatively nearby (
360+70-60 pc, Brown et al. 1994;
Myr; Zapatero Osorio et al. 2002b),
relatively nearby (
360+70-60 pc, Brown et al. 1994; ![]() pc,
Sherry et al. 2008), affected by very low extinction (
pc,
Sherry et al. 2008), affected by very low extinction (
![]() mag; Sherry et al. 2008),
and of solar metallicity (González Hernández et al. 2008).
A revision of published, basic parameters of the cluster was provided by
Caballero (2007). Caballero et al. (2007) found a smoothly continuous
MF down to
mag; Sherry et al. 2008),
and of solar metallicity (González Hernández et al. 2008).
A revision of published, basic parameters of the cluster was provided by
Caballero (2007). Caballero et al. (2007) found a smoothly continuous
MF down to ![]() 6 Jupiter masses (
6 Jupiter masses (
![]() )
and that the brown dwarfs appear to
harbour disks with a frequency similar to that of low-mass stars. This suggests
that low-mass stars and substellar objects share the same formation mechanism.
Also, S Ori 70, of spectral type T6, has been proposed to be a cluster
member with an estimated mass of 2-7
)
and that the brown dwarfs appear to
harbour disks with a frequency similar to that of low-mass stars. This suggests
that low-mass stars and substellar objects share the same formation mechanism.
Also, S Ori 70, of spectral type T6, has been proposed to be a cluster
member with an estimated mass of 2-7
![]() (Luhman et al. 2008; Martín & Zapatero Osorio 2003; Scholz & Jayawardhana 2008; Zapatero Osorio et al. 2008,2002a; Burgasser et al. 2004).
(Luhman et al. 2008; Martín & Zapatero Osorio 2003; Scholz & Jayawardhana 2008; Zapatero Osorio et al. 2008,2002a; Burgasser et al. 2004).
In this paper, we present new
![]() -band photometry and a re-analysis
of previous data of the
-band photometry and a re-analysis
of previous data of the ![]() Orionis cluster, allowing us to search
for faint candidates in an area of
Orionis cluster, allowing us to search
for faint candidates in an area of ![]() 790 arcmin2, to the completeness
magnitude
790 arcmin2, to the completeness
magnitude
![]() mag. Our search area overlaps with those of
Caballero et al. (2007) and Lodieu et al. (2009b), and its J-band completeness
magnitude is about 1.5 and 2 mag fainter, respectively. We report the detection
of three new cluster member candidates with theoretical masses of
mag. Our search area overlaps with those of
Caballero et al. (2007) and Lodieu et al. (2009b), and its J-band completeness
magnitude is about 1.5 and 2 mag fainter, respectively. We report the detection
of three new cluster member candidates with theoretical masses of
![]() 4
4
![]() .
.
2 Observations and data reduction
We discuss the new data obtained for this study and the data from Caballero et al. (2007) and Zapatero Osorio et al. (2008) that were reduced or analysed again in an attempt to increase the sensitivity to faint sources.
2.1 Optical data
The I-band imaging data presented in Caballero et al. (2007) were obtained with
the Wide Field Camera (WFC) mounted at the Isaac Newton Telescope (INT). The WFC
contains four CCD of 2 k ![]() 4 k pixels and 0.33 arcsec/pixel.
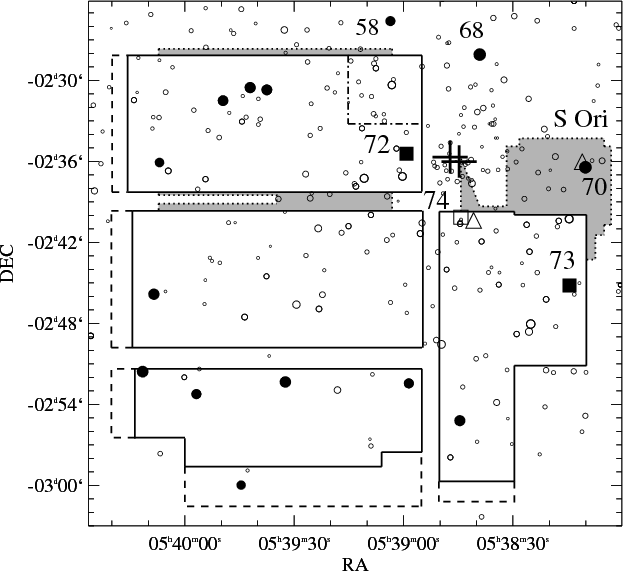
Figure 2 shows the area of the corresponding four images, limited to their
overlap with the near-infrared data (solid and dashed lines). A new automatic
search for sources was performed with the IRAF routine FINDSTAR
(Almoznino), which led to a substantial increase in the number of sources at
faint magnitudes with respect to those considered by Caballero et al. (2007). FINDSTAR is especially useful for detecting sources in combined dithered images
(or in images with background gradients), where the standard deviation varies from
centre to border. We then carried out the aperture and point-spread-function (PSF)
photometry using routines within the DAOPHOT package. Objects missed by the
automatic search routine but easily detected by eye in the
PSF-subtracted images
(e.g., sources partially hidden in the wings of bright stars) were added to the
list of sources. Finally, for each of the four CCD images, the new photometry was
calibrated using
4 k pixels and 0.33 arcsec/pixel.
Figure 2 shows the area of the corresponding four images, limited to their
overlap with the near-infrared data (solid and dashed lines). A new automatic
search for sources was performed with the IRAF routine FINDSTAR
(Almoznino), which led to a substantial increase in the number of sources at
faint magnitudes with respect to those considered by Caballero et al. (2007). FINDSTAR is especially useful for detecting sources in combined dithered images
(or in images with background gradients), where the standard deviation varies from
centre to border. We then carried out the aperture and point-spread-function (PSF)
photometry using routines within the DAOPHOT package. Objects missed by the
automatic search routine but easily detected by eye in the
PSF-subtracted images
(e.g., sources partially hidden in the wings of bright stars) were added to the
list of sources. Finally, for each of the four CCD images, the new photometry was
calibrated using ![]() 1850 objects in common with the Caballero et al. (2007)
photometry in the Cousins system. We found average completeness and limiting
magnitudes of
1850 objects in common with the Caballero et al. (2007)
photometry in the Cousins system. We found average completeness and limiting
magnitudes of
![]() mag and
mag and
![]() mag, respectively.
mag, respectively.
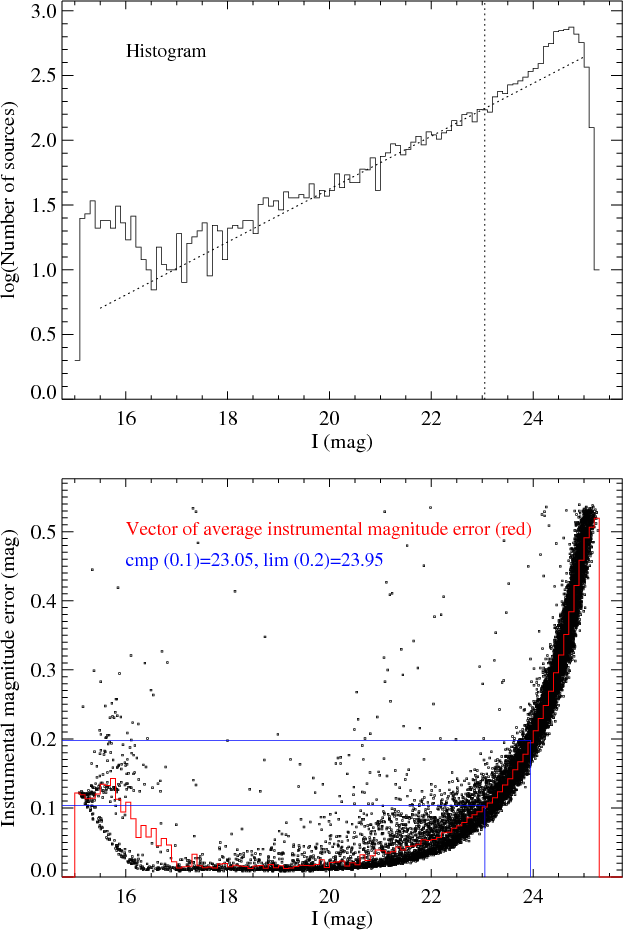
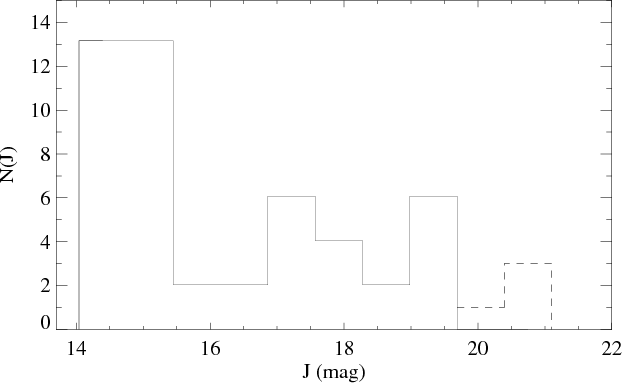
To determine these completeness and limiting magnitudes, we compiled the
distribution of the instrumental magnitude error versus the calibrated magnitude
for each image. In the bottom panel of Fig. 1, we present this with
the source catalogue of one of the WFC CCD images. The completeness and
limiting magnitudes were defined to be the faintest magnitude bins where the
average errors are ![]() 0.10 and 0.20 mag, respectively. These errors correspond
to signal-to-noise ratios of S/N=10 and S/N=5, respectively (see e.g.,
Newberry 1991). The average error per magnitude bin is overploted as a red
solid line. The upper panel shows the histogram of all sources on a logarithmic
scale as a function of the calibrated magnitude. The inclined dotted line
represents a power law fit to the histogram in the range
0.10 and 0.20 mag, respectively. These errors correspond
to signal-to-noise ratios of S/N=10 and S/N=5, respectively (see e.g.,
Newberry 1991). The average error per magnitude bin is overploted as a red
solid line. The upper panel shows the histogram of all sources on a logarithmic
scale as a function of the calibrated magnitude. The inclined dotted line
represents a power law fit to the histogram in the range
![]() ,
where
,
where
![]() is the completeness magnitude (vertical
dotted line). At
is the completeness magnitude (vertical
dotted line). At
![]() ,
the histogram's deviation from the fit is
most probably caused by sources affected by random upward or downward
fluctuations of the background, the upward ones being preferentially detected
above the detection threshold (Malmquist bias; see also Beichman et al. 2003).
Comparing the counts of the histogram of sources having errors smaller than
0.10 mag with the counts of the linear extrapolation of its power law fit at the
completeness magnitude, we estimated a level of completeness of
,
the histogram's deviation from the fit is
most probably caused by sources affected by random upward or downward
fluctuations of the background, the upward ones being preferentially detected
above the detection threshold (Malmquist bias; see also Beichman et al. 2003).
Comparing the counts of the histogram of sources having errors smaller than
0.10 mag with the counts of the linear extrapolation of its power law fit at the
completeness magnitude, we estimated a level of completeness of ![]() 90%.
This method was also applied to the other data sets.
90%.
This method was also applied to the other data sets.
|
Figure 1: Upper panel. Histogram in logarithmic scale of the I-band sources as a function of the calibrated magnitude (see text for details about the dotted lines). Lower panel. Instrumental magnitude error versus the calibrated magnitude of these sources (dots). The average error per magnitude bin is overploted as a red solid line. The magnitudes of the bins just below errors of 0.1 mag (blue lower line) and 0.2 mag (blue upper line) were defined here as the completeness and limiting magnitudes, respectively. |
| Open with DEXTER | |
|
Figure 2:
Main search area: WFC-ISAAC IJ-band data (dashed line)
together with follow-up H- or K-band data (solid line). Additional search
areas: WFC I-, LRIS I-, and Omega2000
|
| Open with DEXTER | |
Table 1: Coordinates and depth of the LRIS imagesa.
We used broad IZ-band images from the Keck II Low Resolution Imaging
Spectrograph (LRIS), associated with the discovery of S Ori 70
(see Zapatero Osorio et al. 2002a), as well as unpublished I-band images
obtained with the same instrument on 2000 January 5, in similar atmospheric
conditions and for the same exposure time. Their coordinates and depths are
listed in Table 1. The photometry was performed as described above.
The I-band photometry was calibrated using typically 200 sources in common
with the WFC survey, whereas the Z-band photometry was calibrated using on
average 41 stellar sources from the Galactic Clusters Survey (GCS) component of
UKIDSS![]() (Lawrence et al. 2007, fifth data release) and of magnitude
error
(Lawrence et al. 2007, fifth data release) and of magnitude
error
![]() mag. The Z-band photometry has an average
(relative) calibration error of 0.04 mag. We caution that the UKIDSS Z-band
filter differs from that of the LRIS images. For the published data, we
estimated that the average completeness and limiting magnitudes are
mag. The Z-band photometry has an average
(relative) calibration error of 0.04 mag. We caution that the UKIDSS Z-band
filter differs from that of the LRIS images. For the published data, we
estimated that the average completeness and limiting magnitudes are
![]() mag and
mag and
![]() mag, respectively, and
mag, respectively, and
![]() mag and
mag and
![]() mag, respectively. For the data from 2000,
these are
mag, respectively. For the data from 2000,
these are
![]() mag and
mag and
![]() mag.
mag.
We obtained Z-band imaging data using the INT/WFC instrument on the night of
2008 November 27. We took 21 images of 900 s exposure time each and with central
coordinates
![]() .
During the observations,
thin cirrus were present and the average seeing was 1.2 arcsec. The images were
reduced using routines within the IRAF environment, including bias and
zero image subtraction and flat-field correction. Observations were done using a
dithering pattern. Science images were combined to obtain flat-field images to
correct for fringing. Individual images were aligned and combined to obtain
final images. Aperture and PSF photometry was performed for one of the CCDs. Its
photometric calibration was done using about 400 stellar sources from GCS-UKIDSS
of
.
During the observations,
thin cirrus were present and the average seeing was 1.2 arcsec. The images were
reduced using routines within the IRAF environment, including bias and
zero image subtraction and flat-field correction. Observations were done using a
dithering pattern. Science images were combined to obtain flat-field images to
correct for fringing. Individual images were aligned and combined to obtain
final images. Aperture and PSF photometry was performed for one of the CCDs. Its
photometric calibration was done using about 400 stellar sources from GCS-UKIDSS
of
![]() mag, implying a relative calibration error
of 0.02 mag. We caution that the UKIDSS Z-band filter is different from that of
the WFC images. We estimated completeness and limiting magnitudes of 22.4 and
23.1 mag, respectively.
mag, implying a relative calibration error
of 0.02 mag. We caution that the UKIDSS Z-band filter is different from that of
the WFC images. We estimated completeness and limiting magnitudes of 22.4 and
23.1 mag, respectively.
Astrometry was obtained for all the optical images with an accuracy
of ![]() 0.2-0.05 arcsec, using 2MASS as reference and an adaptation of the
IRAF MYASTROM procedure (Puddu, see also Bihain et al. 2006). A
representation of the individual fields is provided in Fig. A.1 (top
left and right panels).
0.2-0.05 arcsec, using 2MASS as reference and an adaptation of the
IRAF MYASTROM procedure (Puddu, see also Bihain et al. 2006). A
representation of the individual fields is provided in Fig. A.1 (top
left and right panels).
Table 2: New near-infrared observationsa.
2.2 Near- and mid-infrared data
The J-band imaging data from Caballero et al. (2007) were obtained with the
Infrared Spectrometer And Array Camera (ISAAC), mounted at the Very Large
Telescope (VLT) and containing a Rockwell Hawaii detector of 1 k ![]() 1 k pixels and
0.148 arcsec/pixel. We re-reduced these data to obtain a clean sky subtraction,
remove bad pixel values, and identify more reliably charge persistencies of
bright sources in the detector. The raw images were dark subtracted, superflat
divided, sky subtracted (with the routine LIRISDR.LIMAGE.LRUNSKY from
Acosta-Pulido, which includes object masking and vertical gradient
correction), their elements flagged for bad pixel (at extreme values for
thresholding) using bad pixel masks from superflats, related by pixel shifts
(computed from clearly defined sources in common), and combined all at once in
strips along right ascension or declination (16 strips in total). The photometry
of each strip was performed similarly as for the WFC data. We ensured that all
the sources remaining in the PSF-subtracted images were recovered, as we did for
the Omega2000 J-band images (see below). The photometry was calibrated using
an average number of 12 point sources from the 2MASS catalogue
(Skrutskie et al. 2006) of quality flags AAA or AAB. The average calibration error
is 0.03 mag. The average completeness and limiting magnitudes are
1 k pixels and
0.148 arcsec/pixel. We re-reduced these data to obtain a clean sky subtraction,
remove bad pixel values, and identify more reliably charge persistencies of
bright sources in the detector. The raw images were dark subtracted, superflat
divided, sky subtracted (with the routine LIRISDR.LIMAGE.LRUNSKY from
Acosta-Pulido, which includes object masking and vertical gradient
correction), their elements flagged for bad pixel (at extreme values for
thresholding) using bad pixel masks from superflats, related by pixel shifts
(computed from clearly defined sources in common), and combined all at once in
strips along right ascension or declination (16 strips in total). The photometry
of each strip was performed similarly as for the WFC data. We ensured that all
the sources remaining in the PSF-subtracted images were recovered, as we did for
the Omega2000 J-band images (see below). The photometry was calibrated using
an average number of 12 point sources from the 2MASS catalogue
(Skrutskie et al. 2006) of quality flags AAA or AAB. The average calibration error
is 0.03 mag. The average completeness and limiting magnitudes are
![]() mag and
mag and
![]() mag, respectively, in an area of
mag, respectively, in an area of
![]() 660 arcmin2. This area excludes
660 arcmin2. This area excludes ![]() 20 arcmin2 within the
region delimited by the dash dot line in Fig. 2, where
20 arcmin2 within the
region delimited by the dash dot line in Fig. 2, where
![]() mag and
mag and
![]() mag, and
mag, and ![]() 100 arcmin2corresponding to the
100 arcmin2corresponding to the ![]() 0.4 mag shallower borders of the strips.
0.4 mag shallower borders of the strips.
We obtained additional near-infrared imaging data, using Omega2000 at the 3.5-m
Telescope (Calar Alto, Spain), Son of Isaac (SofI) at the New Technology
Telescope (La Silla, Chile), and the Long-slit Intermediate Resolution Infrared
Spectrograph (LIRIS) at the William Herschel Telescope (Roque de los Muchachos
Observatory, Spain). Table 2 indicates field identification,
coordinates, instrument, filter, area, observing night date(s), total exposure
time, and completeness- and limiting magnitudes. All the data were reduced
within the IRAF environment, including (super)flat division, sky
subtraction, alignment with several reference stars, and combination without
trimming. SofI raw images were first row cross-talk corrected with the routine
crosstalk (Leo Vanzi, ESO SofI tools). Omega2000 and most of the SofI
images were dark subtracted before flat division. LIRIS raw images were first
pixel-mapping- and row-cross-talk corrected, and then processed with the routine
LIRISDR.LIMAGE.LDEDITHER, including sky subtraction, as applied to
ISAAC J-band, and distortion correction. Bad pixel masks were used for LIRIS
and SofI, whereas for Omega2000 extreme values relative to the average at each
pixel were rejected during combination. Because the combined images are
untrimmed, they have a deep central region surrounded by a shallower region,
whose proportions depend on the observing dithers. In Table 2, we
list the deep area and the total area (in parenthesis). The photometry was
obtained as described above. For the Omega2000 images, the photometric
calibration was obtained using ![]() 150 2MASS point sources of quality flags
AAA or AAB (average calibration error of 0.03 mag). For each of the SofI and
LIRIS images, about 10 of these calibrators were used (average calibration error
of 0.04 mag). Completeness and limiting magnitudes were derived from the sources
in the deeper central regions.
150 2MASS point sources of quality flags
AAA or AAB (average calibration error of 0.03 mag). For each of the SofI and
LIRIS images, about 10 of these calibrators were used (average calibration error
of 0.04 mag). Completeness and limiting magnitudes were derived from the sources
in the deeper central regions.
Table 3: Re-estimated depth of individual fields from Caballero et al. (2007) and Zapatero Osorio et al. (2008).
Other near-infrared data, already published in Caballero et al. (2007) and Zapatero Osorio et al. (2008), were used in the search. The Omega2000 data from the latter study were re-reduced to obtain untrimmed images. Completeness and limiting magnitudes of our new photometry (obtained as described above) are listed in Table 3, except for the H-bandAstrometry was obtained for all the near-infrared images similarly as for the
optical images, with an accuracy of
![]() 0.2-0.05 arcsec. A representation of
the individual fields is provided in Fig. A.1 (top left and bottom
panels).
0.2-0.05 arcsec. A representation of
the individual fields is provided in Fig. A.1 (top left and bottom
panels).
We also used archival post-basic calibrated data (PBCD) from the Spitzer
Space Telescope Infrared Array Camera (IRAC). For our new candidates (see
Sect. 4), we have obtained the Spitzer photometry following the
procedure described in Zapatero Osorio et al. (2007) and using the data published
by Hernández et al. (2007) and Scholz & Jayawardhana (2008). A comparison of these two data
sets is provided in Luhman et al. (2008, see e.g. Fig. 1 therein for a map of the IRAC
surveys). We averaged our measurements in overlapping deep images
and adopted their standard deviation as a representative error bar. We compared
the [3.6]- and [4.5]-band measurements of Zapatero Osorio et al. (2007) with those
of Luhman et al. (2008) for the six objects in common![]() and found small average differences
and found small average differences
![]() mag and
mag and
![]() mag, implying good agreement between the two
sets of measurements.
mag, implying good agreement between the two
sets of measurements.
3 The search for Orionis LT-type objects
Field dwarfs with spectral types T0-8 (effective temperature 1400-700 K) have
typical colours of I-J>4.5, J-H < 1.5, and
![]() mag
(Tinney et al. 2003; Zhang et al. 2009); the early types have redder J-H and
mag
(Tinney et al. 2003; Zhang et al. 2009); the early types have redder J-H and
![]() colours and higher effective temperatures than the later types.
By extrapolating the
colours and higher effective temperatures than the later types.
By extrapolating the ![]() Orionis cluster sequence using the field dwarf
sequence, cluster members with a T spectral type appear to be at
Orionis cluster sequence using the field dwarf
sequence, cluster members with a T spectral type appear to be at ![]() mag
(see Sect. 4 and Fig. 4). About the same apparent magnitude is
found using the synthetic atmosphere J-band prediction of the
3-Myr COND model
isochrone from Chabrier & Baraffe (2000). However, when predicted bolometric
luminosities and effective temperatures are transformed into the observable
using relations for field dwarfs (see also Sect. 4 and Fig. 4),
a J-band value of
mag
(see Sect. 4 and Fig. 4). About the same apparent magnitude is
found using the synthetic atmosphere J-band prediction of the
3-Myr COND model
isochrone from Chabrier & Baraffe (2000). However, when predicted bolometric
luminosities and effective temperatures are transformed into the observable
using relations for field dwarfs (see also Sect. 4 and Fig. 4),
a J-band value of ![]() 21 mag is found.
21 mag is found.
T-type objects of this magnitude will still be detected within the completeness
of the ISAAC data, whereas they will be relatively faint or undetected in the
less deep ![]() -band images. For example, faint T type objects with J=21.5,
I-J>4.5, J-H<1, and
-band images. For example, faint T type objects with J=21.5,
I-J>4.5, J-H<1, and
![]() mag will be undetected in all the
optical images and only possibly detected in the near-infrared images of
(H- or
mag will be undetected in all the
optical images and only possibly detected in the near-infrared images of
(H- or ![]() -band) limiting magnitudes fainter than 20.5 mag
(
-band) limiting magnitudes fainter than 20.5 mag
(![]() 470 arcmin2). Therefore, we opted for a search relying on the ISAAC
J-band photometry, i.e., the deepest near-infrared photometry over the largest
area, and with an automatic selection in terms of magnitudes and colours that is
not too restrictive, to allow us to recover visually any potential cluster
member candidate, including L-type objects.
470 arcmin2). Therefore, we opted for a search relying on the ISAAC
J-band photometry, i.e., the deepest near-infrared photometry over the largest
area, and with an automatic selection in terms of magnitudes and colours that is
not too restrictive, to allow us to recover visually any potential cluster
member candidate, including L-type objects.
First, we correlated the
![]() coordinates of the
coordinates of the
![]() -band sources using the IDL srcor procedure (IDL Astronomy
User's Library, Landsman 1993); for each J-band source, we searched for the
nearest counterpart within 2 arcsec in the H,
-band sources using the IDL srcor procedure (IDL Astronomy
User's Library, Landsman 1993); for each J-band source, we searched for the
nearest counterpart within 2 arcsec in the H, ![]() ,
and I bands. The
correlations with the WFC- and LRIS I-band catalogues were performed
separately. We then selected
19.5<J<21.5 mag sources with no automatic
I-band detection, or either I>24 mag
,
and I bands. The
correlations with the WFC- and LRIS I-band catalogues were performed
separately. We then selected
19.5<J<21.5 mag sources with no automatic
I-band detection, or either I>24 mag ![]()
![]() (for unreliable
or spurious detections) or I-J>3.5 mag. As shown in Sect. 4, the
I-J colour is essential for distinguishing LT-type objects from galaxies. The
I-J>3.5 mag sub-criterion intersects at J=20.7 mag with a linear
extrapolation of the selection criterion applied by Caballero et al. (2007, see therein
Fig. 2) for their sources with
(for unreliable
or spurious detections) or I-J>3.5 mag. As shown in Sect. 4, the
I-J colour is essential for distinguishing LT-type objects from galaxies. The
I-J>3.5 mag sub-criterion intersects at J=20.7 mag with a linear
extrapolation of the selection criterion applied by Caballero et al. (2007, see therein
Fig. 2) for their sources with
![]() mag. For
continuity between the searches, we also selected sources redder than their
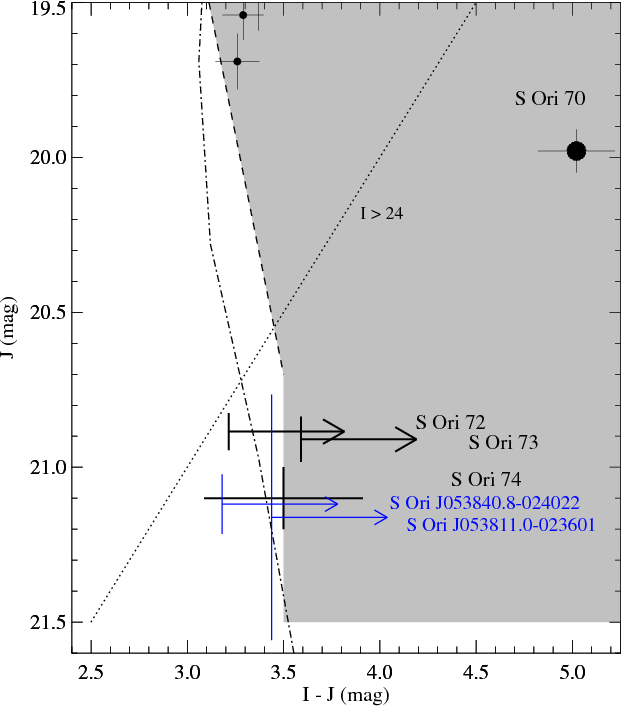
I-J selection boundary and bluer than 3.5 mag. In the J versus I-Jcolour-magnitude diagram of Fig. 3, the shaded region represents the
entire domain where we expected cluster member candidates, the dashed line
represents the extrapolated selection boundary from Caballero et al. (2007), and
the dotted line the I>24 mag sub-criterion. Finally, since the ``2-j''
Omega2000 J-band image (Table 2) overlaps with the northern ISAAC
scans over
mag. For
continuity between the searches, we also selected sources redder than their
I-J selection boundary and bluer than 3.5 mag. In the J versus I-Jcolour-magnitude diagram of Fig. 3, the shaded region represents the
entire domain where we expected cluster member candidates, the dashed line
represents the extrapolated selection boundary from Caballero et al. (2007), and
the dotted line the I>24 mag sub-criterion. Finally, since the ``2-j''
Omega2000 J-band image (Table 2) overlaps with the northern ISAAC
scans over ![]() 210 arcmin2, we performed the selection process again for
the sources with
210 arcmin2, we performed the selection process again for
the sources with
![]() mag and those without
ISAAC counterparts.
mag and those without
ISAAC counterparts.
|
Figure 3:
J versus I-J colour-magnitude diagram. The shaded search region is
where we expected cluster member candidates. The dashed line represents the
extrapolated selection boundary from Caballero et al. (2007). The dotted line
represents the I>24 mag selection sub-criterion. The dash-dot line represents
the 3 Myr COND model isochrone, where I and J are in the Cousins and CIT
photometric systems, respectively. The two small filled circles are the faintest
objects from Caballero et al. (2007) and the large filled circle is S Ori 70. The
four (5 |
| Open with DEXTER | |
About 800 sources were chosen by our selection criteria from our IJ-band
catalogues. We checked each source visually in all of the optical and infrared
images, using the SAOImage DS9 display programme (Joye & Mandel 2003) and commands
in the X Public Access (XPA) messaging
system![]() . The simultaneous
visualisation in all available bandpasses and at all observing epochs allowed us
to verify whether a source is real (or of low proper motion) and unresolved.
Most sources were not detected automatically in the optical, because they are
faint or very close
. The simultaneous
visualisation in all available bandpasses and at all observing epochs allowed us
to verify whether a source is real (or of low proper motion) and unresolved.
Most sources were not detected automatically in the optical, because they are
faint or very close![]() to brighter ones, and their clearly bluer
I-J colours imply that they should be stars or unresolved galaxies. Many are
spurious detections of spikes or glares in the J-band. Others represent charge
persistencies of bright sources in the ISAAC detector (following precisely and
chronologically the offsets of individual pointings), resolved galaxies, sources
cut at image borders, or very blended sources, which are too close to bright
stars in the optical to be identified. The ``2-j'' Omega2000 J-band sources
with
to brighter ones, and their clearly bluer
I-J colours imply that they should be stars or unresolved galaxies. Many are
spurious detections of spikes or glares in the J-band. Others represent charge
persistencies of bright sources in the ISAAC detector (following precisely and
chronologically the offsets of individual pointings), resolved galaxies, sources
cut at image borders, or very blended sources, which are too close to bright
stars in the optical to be identified. The ``2-j'' Omega2000 J-band sources
with
![]() mag were typically galaxies, resolved
in the ISAAC images, whereas those without ISAAC counterparts were sources that
could not be detected in the shallower survey region (see Sect. 2.2
and Fig. 2) and the gaps between the strips.
mag were typically galaxies, resolved
in the ISAAC images, whereas those without ISAAC counterparts were sources that
could not be detected in the shallower survey region (see Sect. 2.2
and Fig. 2) and the gaps between the strips.
In a similar way, we searched for candidates in the additional areas of
![]() 15 arcmin2 and
15 arcmin2 and ![]() 45 arcmin2 represented by the shaded left
and right regions in Fig. 2. These areas are common to the Omega2000
45 arcmin2 represented by the shaded left
and right regions in Fig. 2. These areas are common to the Omega2000
![]() -, WFC I-, and LRIS I-band data. The J-band data of the left
and right regions (fields 2-j and 18-j) are complete to 20.9 and 21.1 mag,
respectively. They are therefore shallower by about 0.5 mag than the ISAAC data.
-, WFC I-, and LRIS I-band data. The J-band data of the left
and right regions (fields 2-j and 18-j) are complete to 20.9 and 21.1 mag,
respectively. They are therefore shallower by about 0.5 mag than the ISAAC data.
These searches allowed us to find four sources that are indeed undetectable by
eye in the deepest I-band images (see Sect. 4), and a half-dozen of
sources at J>20.7 mag that are barely detected beyond the I-band
limiting magnitudes. Most of the latter sources appear to be bluer than
![]() mag. They have magnitude errors
mag. They have magnitude errors ![]() 0.1 mag in the
0.1 mag in the
![]() -bands and red colours of
-bands and red colours of
![]() mag or
mag or
![]() mag.
Only one of them has a colour
mag.
Only one of them has a colour ![]() mag. It was selected as a candidate
(see Sect. 4), whereas the others were rejected because they are
probable galaxies or faint field M- or early L-type dwarfs. Some sources could
not be verified in the I-band images because of blending with extended stellar
spikes and glares. We estimated that areas of
mag. It was selected as a candidate
(see Sect. 4), whereas the others were rejected because they are
probable galaxies or faint field M- or early L-type dwarfs. Some sources could
not be verified in the I-band images because of blending with extended stellar
spikes and glares. We estimated that areas of ![]() 10 and
10 and ![]() 5 arcmin2are lost in the main- and additional areas, respectively. Thus, the total search
area with J-band completeness
5 arcmin2are lost in the main- and additional areas, respectively. Thus, the total search
area with J-band completeness ![]() 21.1 mag (ISAAC and Omega2000 18-j data)
amounts to
21.1 mag (ISAAC and Omega2000 18-j data)
amounts to ![]() 790 arcmin2.
790 arcmin2.
4 Results and discussion
Table 4: Coordinates and photometry of the new L- and T-type cluster member candidatesa.
Table 5: Coordinates and photometry of probable galaxy candidatesa.
|
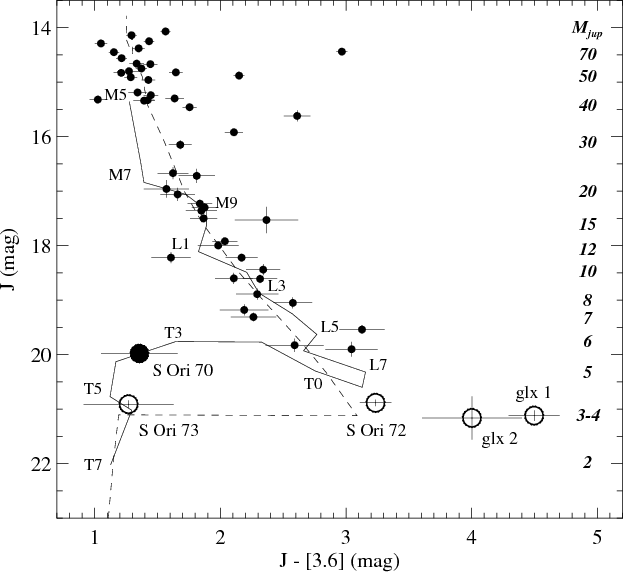
Figure 4:
J versus J-[3.6] colour-magnitude diagram of |
| Open with DEXTER | |
Besides recovering the two faintest cluster member candidates![]() S Ori J053932.4-025220 and
S Ori J054011.6-025135 from Caballero et al. (2007) and the T-type
S Ori 70, we detect three new L- and T-type candidates and two
probable galaxies (see finding charts of Figs. B.1-B.4), among many other objects rejected
because they do not meet our selection criteria. As shown in Fig. 3, the
new candidates are about one magnitude fainter than S Ori 70. The photometric
information that we compiled from the images of different depths are listed in
Tables 4 and 5, where the 5
S Ori J053932.4-025220 and
S Ori J054011.6-025135 from Caballero et al. (2007) and the T-type
S Ori 70, we detect three new L- and T-type candidates and two
probable galaxies (see finding charts of Figs. B.1-B.4), among many other objects rejected
because they do not meet our selection criteria. As shown in Fig. 3, the
new candidates are about one magnitude fainter than S Ori 70. The photometric
information that we compiled from the images of different depths are listed in
Tables 4 and 5, where the 5![]() flux upper limits
correspond to the magnitude limits of the images.
flux upper limits
correspond to the magnitude limits of the images.
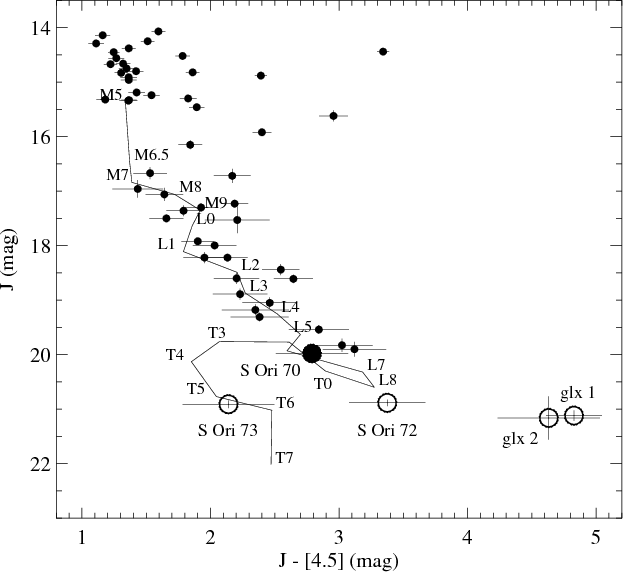
In the J versus J-[3.6] and J-[4.5] colour-magnitude diagrams of
Figs. 4 and 5, we represent the candidates together with known
![]() Orionis cluster members and candidates
(Zapatero Osorio et al. 2007; Caballero et al. 2007; Zapatero Osorio et al. 2008). The solid line
represents the spectrophotometric sequence of field mid-M- to late-T-type
dwarfs, shifted to match the brightness of the late-M-type cluster members
(Zapatero Osorio et al. 2008). For the field dwarfs, we use average absolute
I-band magnitudes, I-J, and
Orionis cluster members and candidates
(Zapatero Osorio et al. 2007; Caballero et al. 2007; Zapatero Osorio et al. 2008). The solid line
represents the spectrophotometric sequence of field mid-M- to late-T-type
dwarfs, shifted to match the brightness of the late-M-type cluster members
(Zapatero Osorio et al. 2008). For the field dwarfs, we use average absolute
I-band magnitudes, I-J, and
![]() colours compiled by
Caballero et al. (2008a)
colours compiled by
Caballero et al. (2008a)![]() , J-H colours from
Vrba et al. (2004)
, J-H colours from
Vrba et al. (2004)![]() , and mid-infrared magnitudes
from Patten et al. (2006). In Fig. 4, the dashed line represents the 3 Myr
COND model isochrone at the cluster distance, adapted by converting predicted
effective temperature and luminosity into observables using relations for field
dwarfs (procedure explained in Zapatero Osorio et al. 2008).
, and mid-infrared magnitudes
from Patten et al. (2006). In Fig. 4, the dashed line represents the 3 Myr
COND model isochrone at the cluster distance, adapted by converting predicted
effective temperature and luminosity into observables using relations for field
dwarfs (procedure explained in Zapatero Osorio et al. 2008).
|
Figure 5: J versus J-[4.5] colour-magnitude diagram. Same as in Fig. 4. |
| Open with DEXTER | |
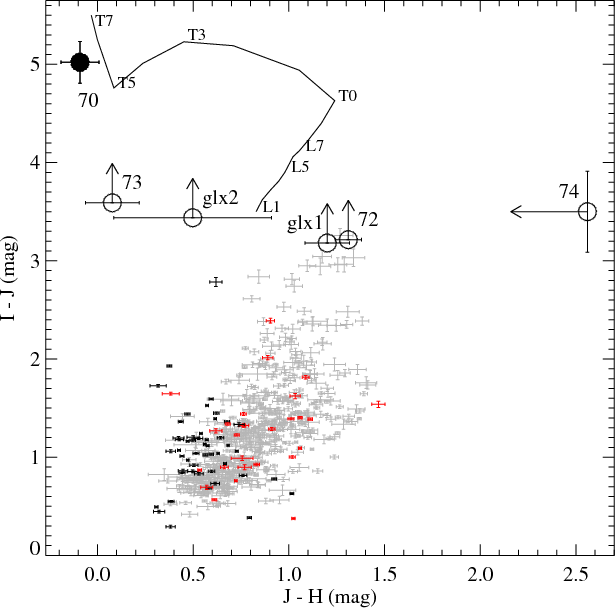
|
Figure 6: I-J versus J-H colour-colour diagram of stars (black crosses), AGN (red crosses), and galaxies (grey crosses) from the GOODS-MUSIC catalogue (Grazian et al. 2006), in the magnitude range 19.5<J<21.5 mag. The solid line represents the field L1-T7-type dwarf sequence, the filled circle represents S Ori 70, and the open circles represent the new candidates. S Ori J053840.8-024022 and S Ori J053811.0-023601 are labelled ``glx 1'' and ``glx 2'', respectively. |
| Open with DEXTER | |
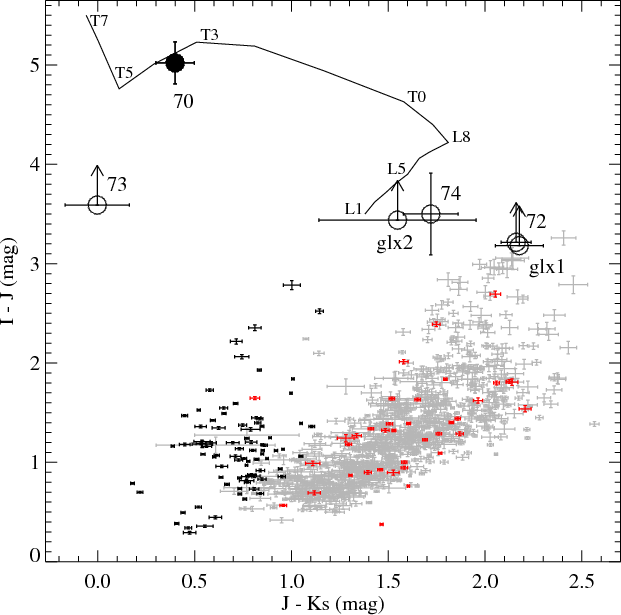
|
Figure 7:
I-J versus
|
| Open with DEXTER | |
We also represent the candidates in I-J versus J-H and
![]() colour-colour diagrams (Figs. 6 and 7) as well as in
various diagrams with mid-infrared filters (Figs. 8-10), together with sources from the
GOODS-MUSIC catalogue (Grazian et al. 2006) that we use as a control field to
study the potential contamination by extragalactic sources in our survey. In all
the figures, the open circles represent the new candidates (labelled) and the
solid line represents part of the field LT-type dwarf sequence. The GOODS-MUSIC
survey is centred on
colour-colour diagrams (Figs. 6 and 7) as well as in
various diagrams with mid-infrared filters (Figs. 8-10), together with sources from the
GOODS-MUSIC catalogue (Grazian et al. 2006) that we use as a control field to
study the potential contamination by extragalactic sources in our survey. In all
the figures, the open circles represent the new candidates (labelled) and the
solid line represents part of the field LT-type dwarf sequence. The GOODS-MUSIC
survey is centred on
![]() ,
approximately,
and covers an area of 143.2 arcmin2 (except in the H-band, where the area
is 78 arcmin2), i.e., less than a fifth of our search area. The limiting
magnitudes are i=26.1, J=23.6, H=22.9,
,
approximately,
and covers an area of 143.2 arcmin2 (except in the H-band, where the area
is 78 arcmin2), i.e., less than a fifth of our search area. The limiting
magnitudes are i=26.1, J=23.6, H=22.9,
![]() ,
[3.6]=21.2,
[4.5]=20.1,
[5.8]=18.3, and
[8.0]=17.6 mag, when converted from the AB
system to the Vega system
,
[3.6]=21.2,
[4.5]=20.1,
[5.8]=18.3, and
[8.0]=17.6 mag, when converted from the AB
system to the Vega system![]() . In the
magnitude range
19.5<J<21.5 mag, the catalogue contains 882 galaxies,
37 active galactic nuclei (AGN), and 83 stars, and in the smaller H-band area,
505 galaxies, 27 AGN, and 49 stars. Stars and AGN are distinguished from
``normal'' galaxies mostly by morphological and photometric criteria, or else by
spectroscopic criteria. Stars are distinguished from AGN by spectroscopic
criteria. In the infrared colour-colour diagrams of Figs. 9
and 10, the sequence of mid-L- to early-T type field dwarfs
overlaps with the domain of galaxies and AGN; only T type dwarfs tend to have
different colours. The colour-magnitude diagrams of Fig. 8 also
indicate that, from J=19.5
to 21.5 mag, the colour ranges of galaxies and AGN become
broader and the number of galaxies increases (here by a factor
of 1.4 in
a 0.5-mag interval). However the optical-infrared diagrams of
Figs. 6 and 7 show that mid-L to mid-T type dwarfs
are clearly redder in I-J than the other sources. Thus, the I-J colour is
essential to distinguishing these objects from galaxies and AGN, whereas the
infrared colours only help us to guess the spectral type.
. In the
magnitude range
19.5<J<21.5 mag, the catalogue contains 882 galaxies,
37 active galactic nuclei (AGN), and 83 stars, and in the smaller H-band area,
505 galaxies, 27 AGN, and 49 stars. Stars and AGN are distinguished from
``normal'' galaxies mostly by morphological and photometric criteria, or else by
spectroscopic criteria. Stars are distinguished from AGN by spectroscopic
criteria. In the infrared colour-colour diagrams of Figs. 9
and 10, the sequence of mid-L- to early-T type field dwarfs
overlaps with the domain of galaxies and AGN; only T type dwarfs tend to have
different colours. The colour-magnitude diagrams of Fig. 8 also
indicate that, from J=19.5
to 21.5 mag, the colour ranges of galaxies and AGN become
broader and the number of galaxies increases (here by a factor
of 1.4 in
a 0.5-mag interval). However the optical-infrared diagrams of
Figs. 6 and 7 show that mid-L to mid-T type dwarfs
are clearly redder in I-J than the other sources. Thus, the I-J colour is
essential to distinguishing these objects from galaxies and AGN, whereas the
infrared colours only help us to guess the spectral type.
4.1 New L- and T-type candidates
S Ori 72, with
![]() mag and
mag and
![]() mag, could be a late L-type object. It is clearly detected in the
ISAAC J-band image from December 2001 and even better in Omega2000
mag, could be a late L-type object. It is clearly detected in the
ISAAC J-band image from December 2001 and even better in Omega2000
![]() -band images (observations 2-h and 2-k, Table 2), whereas it is
slightly blended but detected in the
[3.6][4.5][5.8]-band images (its visual
neighbour is 2MASS J05385930-0235282, a field star located 3 arcsec
south-east, with
-band images (observations 2-h and 2-k, Table 2), whereas it is
slightly blended but detected in the
[3.6][4.5][5.8]-band images (its visual
neighbour is 2MASS J05385930-0235282, a field star located 3 arcsec
south-east, with
![]() mag and
mag and
![]() mag). S Ori 72 is
undetected in the WFC I-band image and the LRIS IZ-band images (1998iz3,
Table 1). The FWHMs in the
mag). S Ori 72 is
undetected in the WFC I-band image and the LRIS IZ-band images (1998iz3,
Table 1). The FWHMs in the
![]() -band images are
approximately equal to those of nearby faint point-like sources, of about 0.5,
1.2, and 0.8 arcsec, respectively. Among the new candidates presented in this
paper, S Ori 72 is the only one that is detected in the GCS-UKIDSS images, with
-band images are
approximately equal to those of nearby faint point-like sources, of about 0.5,
1.2, and 0.8 arcsec, respectively. Among the new candidates presented in this
paper, S Ori 72 is the only one that is detected in the GCS-UKIDSS images, with
![]() mag, in agreement with our measurement. In
Fig. 11, we show its spectral energy distribution, together with average
ones of field dwarfs of L7- and L8 spectral types (dotted lines). S Ori 72 is
relatively brighter in the
mag, in agreement with our measurement. In
Fig. 11, we show its spectral energy distribution, together with average
ones of field dwarfs of L7- and L8 spectral types (dotted lines). S Ori 72 is
relatively brighter in the
![]() -bands. A preliminary measurement of
S Ori 72's proper motion using the ISAAC-Omega2000 images of 3.87 yr time
baseline and the method described in Bihain et al. (2006) allows us to impose a
-bands. A preliminary measurement of
S Ori 72's proper motion using the ISAAC-Omega2000 images of 3.87 yr time
baseline and the method described in Bihain et al. (2006) allows us to impose a ![]() upper limit of 30 mas/yr. Although the estimate should be improved
before comparison with the
upper limit of 30 mas/yr. Although the estimate should be improved
before comparison with the
![]() mas yr-1 amplitude of
mas yr-1 amplitude of
![]() Orionis members (Caballero 2007), it indicates that S Ori 72
is not a high-proper motion object and unlikely to be a nearby (
Orionis members (Caballero 2007), it indicates that S Ori 72
is not a high-proper motion object and unlikely to be a nearby (![]() 30 pc)
source. From the J versus J-[3.6] and J-[4.5] colour-magnitude diagrams of
Figs. 4 and 5, S Ori 72 could be an L/T transition cluster
member candidate, but Figs. 6-10
imply that it could also be a galaxy
or an AGN.
30 pc)
source. From the J versus J-[3.6] and J-[4.5] colour-magnitude diagrams of
Figs. 4 and 5, S Ori 72 could be an L/T transition cluster
member candidate, but Figs. 6-10
imply that it could also be a galaxy
or an AGN.
With
![]() mag, S Ori 73 has near-infrared
colours of a mid T-type object. It is clearly detected in the ISAAC J-band
image, but appears very faint in the WFC Z-band image from November 2008, the
CFHTIR HK'-band images from February 2004 (20-h and 20-k,
Table 3), and the public Spitzer/IRAC [3.6]- and
[4.5]-band images. It is undetected in the WFC I-band image, the LRIS
IZ-band images (2000i2, 1998iz2, Table 1), and in the Omega2000
mag, S Ori 73 has near-infrared
colours of a mid T-type object. It is clearly detected in the ISAAC J-band
image, but appears very faint in the WFC Z-band image from November 2008, the
CFHTIR HK'-band images from February 2004 (20-h and 20-k,
Table 3), and the public Spitzer/IRAC [3.6]- and
[4.5]-band images. It is undetected in the WFC I-band image, the LRIS
IZ-band images (2000i2, 1998iz2, Table 1), and in the Omega2000
![]() -band images (17-h and 17-k). Its FWHM in the J-band
image is approximately equal to that of nearby faint point-like sources, of
about 0.5 arcsec. In Fig. 11, we show its spectral energy distribution,
together with average ones of field dwarfs of T4 and T6 spectral types. The
position of S Ori 73 in the J versus J-[3.6] diagram of Fig. 4
agrees with both adapted field- and model sequences, securing this source as a
good T-type- and cluster member candidate. The colour-colour diagrams of
Figs. 6, 7, and 9 also indicate
that there are neither stars, nor AGN, nor galaxies in GOODS-MUSIC as red in
I-J and blue in J-H and
-band images (17-h and 17-k). Its FWHM in the J-band
image is approximately equal to that of nearby faint point-like sources, of
about 0.5 arcsec. In Fig. 11, we show its spectral energy distribution,
together with average ones of field dwarfs of T4 and T6 spectral types. The
position of S Ori 73 in the J versus J-[3.6] diagram of Fig. 4
agrees with both adapted field- and model sequences, securing this source as a
good T-type- and cluster member candidate. The colour-colour diagrams of
Figs. 6, 7, and 9 also indicate
that there are neither stars, nor AGN, nor galaxies in GOODS-MUSIC as red in
I-J and blue in J-H and
![]() as this object.
as this object.
![\begin{figure}
\par\includegraphics[width=11.5cm]{12210f08.ps}
\end{figure}](/articles/aa/full_html/2009/42/aa12210-09/img93.png)
|
Figure 8: J versus J-[3.6] and J-[4.5] colour-magnitude diagrams. Same as in Fig. 6. The blue solid line represents the field dwarf sequence shifted as in Fig. 4. |
| Open with DEXTER | |
![\begin{figure}
\par\includegraphics[width=11.5cm]{12210f09.ps}
\end{figure}](/articles/aa/full_html/2009/42/aa12210-09/img94.png)
|
Figure 9:
Near- and mid-infrared colour-colour diagrams: J-[3.6] and
J-[4.5] versus J-H ( top- and bottom left), J-[3.6] and J-[4.5] versus
|
| Open with DEXTER | |
![\begin{figure}
\par\includegraphics[width=12cm]{12210f10.ps}
\end{figure}](/articles/aa/full_html/2009/42/aa12210-09/img95.png)
|
Figure 10: Mid-infrared diagrams: [3.6] versus [3.6]-[5.8] ( left), [3.6]-[5.8] versus [4.5]-[8.0] ( right). Same as in Fig. 6. |
| Open with DEXTER | |
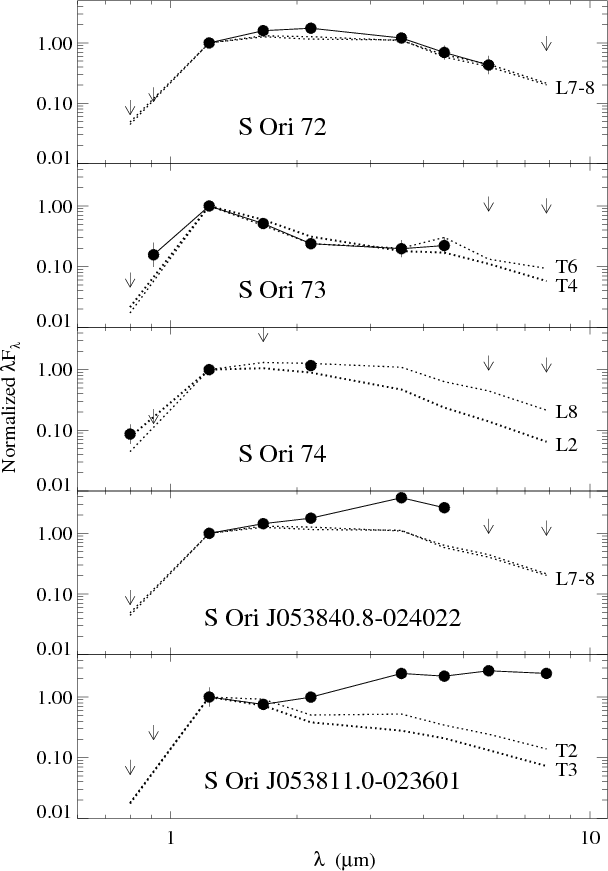
|
Figure 11:
Spectral energy distributions of the new candidates compared
to average ones of field dwarfs (dotted lines).
|
| Open with DEXTER | |
4.2 Probable galaxy candidates
With
![]() mag and
mag and
![]() mag, S Ori J053840.8-024022 could be a late L-type object or a galaxy.
It is detected with brighter magnitudes at longer wavelengths, from the
Omega2000
mag, S Ori J053840.8-024022 could be a late L-type object or a galaxy.
It is detected with brighter magnitudes at longer wavelengths, from the
Omega2000
![]() -band images (18j-k, Table 3) to the
[3.6][4.5]-band images, but is then undetected in the
[5.8][8.0]-band
images. It is undetected in the WFC and LRIS I-band images (2000i3,
Table 1). In Fig. 11, we show its spectral energy
distribution, together with average ones of field dwarfs of L7- and L8 spectral
types. In the ISAAC J-band image, it is found to be slightly extended and
fainter than in the lower-resolution Omega2000 J-band image. The FWHMs of the
object in the Omega2000
-band images (18j-k, Table 3) to the
[3.6][4.5]-band images, but is then undetected in the
[5.8][8.0]-band
images. It is undetected in the WFC and LRIS I-band images (2000i3,
Table 1). In Fig. 11, we show its spectral energy
distribution, together with average ones of field dwarfs of L7- and L8 spectral
types. In the ISAAC J-band image, it is found to be slightly extended and
fainter than in the lower-resolution Omega2000 J-band image. The FWHMs of the
object in the Omega2000
![]() -band images are systematically larger by a
factor
-band images are systematically larger by a
factor ![]() 1.4 than those of nearby faint point-like sources, suggesting
that it is a galaxy. S Ori J053840.8-024022 could be an L/T transition
object, but from the J versus J-[3.6] and J-[4.5] diagrams
(Figs. 4 and 5), it is redder than the expected sequence of the
cluster. Galaxies from the GOODS-MUSIC catalogue with these red colours appear
at magnitudes
1.4 than those of nearby faint point-like sources, suggesting
that it is a galaxy. S Ori J053840.8-024022 could be an L/T transition
object, but from the J versus J-[3.6] and J-[4.5] diagrams
(Figs. 4 and 5), it is redder than the expected sequence of the
cluster. Galaxies from the GOODS-MUSIC catalogue with these red colours appear
at magnitudes ![]() mag (Fig. 8).
Figure 9 illustrates its infrared excess in the
mag (Fig. 8).
Figure 9 illustrates its infrared excess in the ![]() -,
[3.6]-, and [4.5]-bands relative to the field dwarf sequence, and also
suggests that this object is likely to be a galaxy.
-,
[3.6]-, and [4.5]-bands relative to the field dwarf sequence, and also
suggests that this object is likely to be a galaxy.
S Ori J053811.0-023601, with
![]() mag and
mag and
![]() mag, could be an early T-type object or a galaxy. It is detected with
brighter magnitudes at longer wavelengths, from the Omega2000
mag, could be an early T-type object or a galaxy. It is detected with
brighter magnitudes at longer wavelengths, from the Omega2000
![]() -band
images (18j-k, Table 3) to the [3.6][4.5][5.6][8.0]-band images. It
is undetected in the WFC I-band image and the LRIS IZ-band images (2000i1
and 1998iz1, Table 1). In Fig. 11, we show its spectral
energy distribution, together with average ones of field dwarfs of T2 and T3
spectral types. We caution that the object appears relatively faint in the
J-band and that the
-band
images (18j-k, Table 3) to the [3.6][4.5][5.6][8.0]-band images. It
is undetected in the WFC I-band image and the LRIS IZ-band images (2000i1
and 1998iz1, Table 1). In Fig. 11, we show its spectral
energy distribution, together with average ones of field dwarfs of T2 and T3
spectral types. We caution that the object appears relatively faint in the
J-band and that the
![]() -band centroids are 0.8 arcsec south of the
J-band centroid, although the JH-band data were obtained on the same
observing night. The FWHMs in the
-band centroids are 0.8 arcsec south of the
J-band centroid, although the JH-band data were obtained on the same
observing night. The FWHMs in the
![]() -band images are approximately
equal to those of nearby faint point-like sources, of about 1.2 and 0.9 arcsec,
respectively. S Ori J053811.0-023601 appears as an L/T transition object, but
from the J versus J-[3.6] and J-[4.5] diagrams (Figs. 4 and
5) and as for S Ori J053840.8-024022, it is redder than the
expected cluster sequence and could be a galaxy (Fig. 8).
S Ori J053811.0-023601 is particularly bright in the [5.8]- and
[8.0]-bands and displays a colour
-band images are approximately
equal to those of nearby faint point-like sources, of about 1.2 and 0.9 arcsec,
respectively. S Ori J053811.0-023601 appears as an L/T transition object, but
from the J versus J-[3.6] and J-[4.5] diagrams (Figs. 4 and
5) and as for S Ori J053840.8-024022, it is redder than the
expected cluster sequence and could be a galaxy (Fig. 8).
S Ori J053811.0-023601 is particularly bright in the [5.8]- and
[8.0]-bands and displays a colour
![]() ,
redder than most
,
redder than most
![]() Orionis low-mass member candidates
(Luhman et al. 2008; Zapatero Osorio et al. 2007; Scholz & Jayawardhana 2008). Considering that
Orionis low-mass member candidates
(Luhman et al. 2008; Zapatero Osorio et al. 2007; Scholz & Jayawardhana 2008). Considering that ![]() 50%
of the known
50%
of the known ![]() Orionis planetary-mass candidates exhibit excesses
longward of 5
Orionis planetary-mass candidates exhibit excesses
longward of 5 ![]() m (Zapatero Osorio et al. 2007), it appears to be a cluster
member. In Figs. 6, 7, and 9, its
optical and near-infrared colours differ from those of AGN and galaxies, but in
Fig. 10, its other colours are consistent with the AGN hypothesis
(see also Fig. 1 in Stern et al. 2005, representing spectroscopically
identified stars, AGN, and galaxies). Hence, although we cannot exclude
completely this source beeing a peculiar cluster member with extreme infrared
excesses, our data seem to indicate that it is more probably an AGN.
m (Zapatero Osorio et al. 2007), it appears to be a cluster
member. In Figs. 6, 7, and 9, its
optical and near-infrared colours differ from those of AGN and galaxies, but in
Fig. 10, its other colours are consistent with the AGN hypothesis
(see also Fig. 1 in Stern et al. 2005, representing spectroscopically
identified stars, AGN, and galaxies). Hence, although we cannot exclude
completely this source beeing a peculiar cluster member with extreme infrared
excesses, our data seem to indicate that it is more probably an AGN.
4.3 Cluster membership
Because our search area is larger than that of the GOODS-MUSIC catalogue,
contamination by red galaxies and AGN is even more likely to explain some of our
candidates. Caballero et al. (2008b) present low-resolution optical
spectroscopy and spectral energy distributions between 0.55 and 24 ![]() m of two
sources fainter than the star-brown-dwarf cluster boundary, which were
interpreted to be peculiar
m of two
sources fainter than the star-brown-dwarf cluster boundary, which were
interpreted to be peculiar ![]() Orionis members with very red colours
related to discs. They are instead two emission-line galaxies at moderate
redshift, one with an AGN and the other ongoing star formation. In the present
study, we assume that S Ori J053840.8-024022 and S Ori J053811.0-023601
are galaxy- or AGN contaminants and that the other objects are Galactic
candidates awaiting confirmation by higher resolution imaging, proper motion, or
spectroscopy.
Orionis members with very red colours
related to discs. They are instead two emission-line galaxies at moderate
redshift, one with an AGN and the other ongoing star formation. In the present
study, we assume that S Ori J053840.8-024022 and S Ori J053811.0-023601
are galaxy- or AGN contaminants and that the other objects are Galactic
candidates awaiting confirmation by higher resolution imaging, proper motion, or
spectroscopy.
In our search, we must also account for contamination by field dwarfs.
Caballero et al. (2008a) provide predictions of the number of L5-T0, T0-T5, and
T5-T8 field dwarf contaminants per square degree towards the ![]() Orionis
region, in one-magnitude I-band intervals and from I=21.0 to 29.0 mag. We
convert the bright and faint boundaries of the range
J=19.7-21.1 mag (as a
prolongation of the search range of Caballero et al. 2007) into the I-band
magnitudes corresponding to the earliest and latest spectral types of each of
the three contaminant groups. We then sum the predicted numbers of contaminants
accounting for the I-band ranges and scale the sums to the search area that is
complete to
Orionis
region, in one-magnitude I-band intervals and from I=21.0 to 29.0 mag. We
convert the bright and faint boundaries of the range
J=19.7-21.1 mag (as a
prolongation of the search range of Caballero et al. 2007) into the I-band
magnitudes corresponding to the earliest and latest spectral types of each of
the three contaminant groups. We then sum the predicted numbers of contaminants
accounting for the I-band ranges and scale the sums to the search area that is
complete to ![]() mag (
mag (![]() 790 arcmin2). We obtain about three
L5-T8-type field dwarfs, which all contribute the most to the light close to
J=21.1 mag. This predicted value remains mostly indicative, because the
initial mass function and scale heights of late L- and T-type dwarfs are still
uncertain. Interestingly, Caballero et al. (2008a) assume a rising mass function in
the planetary mass regime and predict spatial densities of T0-8 dwarfs that are
a factor of two higher than those derived from observations
(Lodieu et al. 2009a; Metchev et al. 2008).
790 arcmin2). We obtain about three
L5-T8-type field dwarfs, which all contribute the most to the light close to
J=21.1 mag. This predicted value remains mostly indicative, because the
initial mass function and scale heights of late L- and T-type dwarfs are still
uncertain. Interestingly, Caballero et al. (2008a) assume a rising mass function in
the planetary mass regime and predict spatial densities of T0-8 dwarfs that are
a factor of two higher than those derived from observations
(Lodieu et al. 2009a; Metchev et al. 2008).
S Ori 73 and S Ori 70 are located![]() at 11.9 and 8.7 arcmin from
at 11.9 and 8.7 arcmin from
![]() Ori AB, respectively. S Ori 72 and S Ori 74 are closer, at 3.6 and
4.1 arcmin, respectively. Interestingly, the location of these faintest,
presumably least massive candidates contrasts with that of the eleven
13-6
Ori AB, respectively. S Ori 72 and S Ori 74 are closer, at 3.6 and
4.1 arcmin, respectively. Interestingly, the location of these faintest,
presumably least massive candidates contrasts with that of the eleven
13-6
![]() free-floating planetary-mass candidates from
Caballero et al. (2007), further out at 26-13 arcmin in the survey area (see
Fig. 2). Caballero (2008a) find an apparent deficit of low mass
objects (M<0.16
free-floating planetary-mass candidates from
Caballero et al. (2007), further out at 26-13 arcmin in the survey area (see
Fig. 2). Caballero (2008a) find an apparent deficit of low mass
objects (M<0.16 ![]() )
towards the
)
towards the ![]() Orionis cluster centre. If the
cluster membership census and the individual masses are confirmed, this
configuration could be explained by several mechanisms, including e.g., a
possible photo-erosion by the central OB stars (Whitworth & Zinnecker 2004; Hester et al. 1996)
in the deep gravity well. Complementary studies of the dense cluster core
(Bouy et al. 2009) and other cluster regions could thus help us to understand the
formation of low-mass planetary-mass objects.
Orionis cluster centre. If the
cluster membership census and the individual masses are confirmed, this
configuration could be explained by several mechanisms, including e.g., a
possible photo-erosion by the central OB stars (Whitworth & Zinnecker 2004; Hester et al. 1996)
in the deep gravity well. Complementary studies of the dense cluster core
(Bouy et al. 2009) and other cluster regions could thus help us to understand the
formation of low-mass planetary-mass objects.
4.4 Mass spectrum
We consider the luminosity and mass functions for the ISAAC- and additional
areas, where the search is complete down to ![]() mag
(
mag
(![]() 790 arcmin2).
790 arcmin2).
|
Figure 12: J-band luminosity function with the LT-type candidates at J>19.7 mag (dashed line) and the brighter cluster member candidates from Caballero et al. (2007) scaled to the search area (solid line). |
| Open with DEXTER | |
In Fig. 12, we show the J-band luminosity function. The magnitude bins in the range J=19.7-21.1 mag correspond to the three new LT-type candidates and S Ori 70 (dashed line). The magnitude bins in the range J=14.1-19.7 mag correspond to the cluster member candidates from Caballero et al. (2007), i.e., in the ISAAC area; they are scaled by the area factor (790)/780=1.0128. The magnitude bins have equal widths of about 0.7 mag.
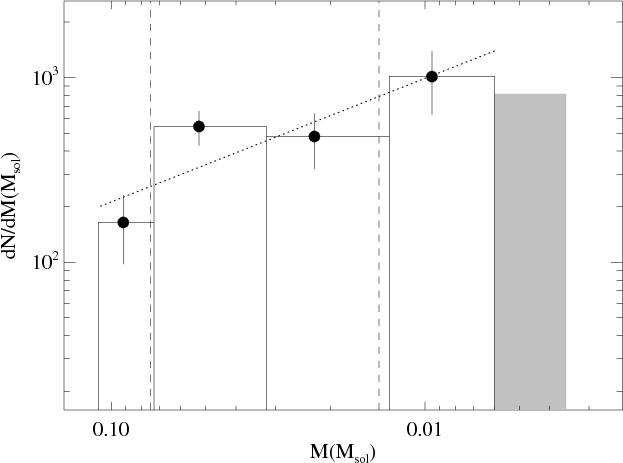
|
Figure 13:
Mass spectrum with contamination-corrected data. The dotted segment
represents the linear fit to the data points from Caballero et al. (2007) in the
mass range 0.11-0.006 |
| Open with DEXTER | |
We estimate the masses of our new cluster member candidates by comparing with
the theoretical bolometric luminosities from the Lyon group
(e.g., Baraffe et al. 2003), using exactly the same method as in
Caballero et al. (2007). If cluster members, S Ori 72-74 would each have an
estimated theoretical mass of 4
-2+3
![]() ,
accounting for age,
distance, and photometric uncertainties. This rounded up result does not change
significantly by using a cluster distance of 400 pc (Mayne & Naylor 2008) or 440 pc
(Sherry et al. 2008) instead of 360 pc (Brown et al. 1994). The effective
temperature corresponding to that mass would be of
,
accounting for age,
distance, and photometric uncertainties. This rounded up result does not change
significantly by using a cluster distance of 400 pc (Mayne & Naylor 2008) or 440 pc
(Sherry et al. 2008) instead of 360 pc (Brown et al. 1994). The effective
temperature corresponding to that mass would be of ![]() 1400 K. In
Fig. 13, we display the mass spectrum (
1400 K. In
Fig. 13, we display the mass spectrum (
![]() ). The filled
circles represent the contamination-corrected data points from
Caballero et al. (2007) scaled to the search area of
). The filled
circles represent the contamination-corrected data points from
Caballero et al. (2007) scaled to the search area of ![]() 790 arcmin2. The
last bin (shaded region) corresponds to the result from the present study for
the magnitude range J=19.7-21.1 mag. Subtracting the three possible
contaminants (see Sect. 4.3) from the four LT-type candidates and
accounting for the Poissonian error, we estimate 0-2 cluster members with a
mass of 0.006-0.004
790 arcmin2. The
last bin (shaded region) corresponds to the result from the present study for
the magnitude range J=19.7-21.1 mag. Subtracting the three possible
contaminants (see Sect. 4.3) from the four LT-type candidates and
accounting for the Poissonian error, we estimate 0-2 cluster members with a
mass of 0.006-0.004 ![]() .
.
Previous studies of the substellar population in the ![]() Orionis cluster
find that the mass spectrum increases toward lower masses. Béjar et al. (2001)
show that it can be represented by a potential law (
Orionis cluster
find that the mass spectrum increases toward lower masses. Béjar et al. (2001)
show that it can be represented by a potential law (
![]() )
with an
)
with an ![]() index of 0.8 in the mass range
0.11-0.013
index of 0.8 in the mass range
0.11-0.013 ![]() .
González-García et al. (2006) and Caballero et al. (2007)
extend this mass spectrum to 0.006
.
González-García et al. (2006) and Caballero et al. (2007)
extend this mass spectrum to 0.006 ![]() and find a slightly lower index
and find a slightly lower index
![]() .
For the substellar mass range of 0.073-0.006
.
For the substellar mass range of 0.073-0.006 ![]() ,
Caballero et al. (2007) obtain an even lower
,
Caballero et al. (2007) obtain an even lower ![]() index of 0.4. An
extrapolation of the mass spectrum with an index
index of 0.4. An
extrapolation of the mass spectrum with an index
![]() predicts 3-7 objects in the mass range 0.006-0.004
predicts 3-7 objects in the mass range 0.006-0.004 ![]() .
From our survey, the most
likely number of cluster members in this mass interval is in the range 0-2.
This could be an indication of a turnover in the substellar mass spectrum.
However, given the low statistics and the possibility that the number of
contaminants could be overestimated, such a change in the slope of the mass
spectrum should be considered with caution. If real, the turnover could be
related to an opacity mass limit, turbulence effects, or a different
mass-luminosity relation (if less massive objects were fainter than predicted).
Wider and deeper searches would be very valuable in constraining the mass
spectrum more reliably at these and lower masses.
.
From our survey, the most
likely number of cluster members in this mass interval is in the range 0-2.
This could be an indication of a turnover in the substellar mass spectrum.
However, given the low statistics and the possibility that the number of
contaminants could be overestimated, such a change in the slope of the mass
spectrum should be considered with caution. If real, the turnover could be
related to an opacity mass limit, turbulence effects, or a different
mass-luminosity relation (if less massive objects were fainter than predicted).
Wider and deeper searches would be very valuable in constraining the mass
spectrum more reliably at these and lower masses.
5 Conclusions
The mass function in young open clusters can provide clues about the formation
mechanism of free-floating planetary-mass objects. We therefore decided to
explore the substellar mass function for M<6
![]() in the
in the ![]() 3 Myr
old
3 Myr
old ![]() Orionis open cluster. We extended to
J=19.5-21.5 mag the
Orionis open cluster. We extended to
J=19.5-21.5 mag the
![]() 780 arcmin2 INT/WFC-VLT/ISAAC IJ-band search of
Caballero et al. (2007). J-band sources (ISAAC and CAHA 3.5 m/Omega2000) were
cross-matched with I- (WFC and Keck/LRIS) and HK-band sources (Omega2000,
NTT/SofI, WHT/LIRIS, and CFHT/CFHTIR). We selected sources redder than a
boundary at
I-J>3.1-3.5 or without an I-band detection or fainter than
I=24 mag. These sources were then checked visually in all available images,
including Z-band images from LRIS and WFC, and archival mid-infrared images
from Spitzer/IRAC.
780 arcmin2 INT/WFC-VLT/ISAAC IJ-band search of
Caballero et al. (2007). J-band sources (ISAAC and CAHA 3.5 m/Omega2000) were
cross-matched with I- (WFC and Keck/LRIS) and HK-band sources (Omega2000,
NTT/SofI, WHT/LIRIS, and CFHT/CFHTIR). We selected sources redder than a
boundary at
I-J>3.1-3.5 or without an I-band detection or fainter than
I=24 mag. These sources were then checked visually in all available images,
including Z-band images from LRIS and WFC, and archival mid-infrared images
from Spitzer/IRAC.
We recover S Ori 70 and the two faintest cluster member candidates
from Caballero et al. (2007), and we find five red I-J sources, with
![]() mag, located within 12 arcmin of the cluster centre. The near- and
mid-infrared colours indicate that one of the sources, S Ori 73, is
probably of T spectral type. If confirmed as a cluster member, it would be the
least massive free-floating T type object detected in
mag, located within 12 arcmin of the cluster centre. The near- and
mid-infrared colours indicate that one of the sources, S Ori 73, is
probably of T spectral type. If confirmed as a cluster member, it would be the
least massive free-floating T type object detected in ![]() Orionis, with
4
-2+3
Orionis, with
4
-2+3
![]() .
The four other sources appear to be L/T transition
objects, but two are likely to be galaxies because of their strong mid-infrared
excesses, similar to those of galaxies at
.
The four other sources appear to be L/T transition
objects, but two are likely to be galaxies because of their strong mid-infrared
excesses, similar to those of galaxies at ![]() mag. S Ori 72 and
S Ori 73 are relatively close to the expected cluster sequence in the Jversus J-[3.6] and J-[4.5] colour-magnitude diagrams. S Ori 74 is
located 11.8 arcsec (
mag. S Ori 72 and
S Ori 73 are relatively close to the expected cluster sequence in the Jversus J-[3.6] and J-[4.5] colour-magnitude diagrams. S Ori 74 is
located 11.8 arcsec (![]() 4250 AU) away from the solar-type cluster star
Mayrit 260182. From the effective search area of
4250 AU) away from the solar-type cluster star
Mayrit 260182. From the effective search area of ![]() 790 arcmin2complete to J=21.1 mag, we estimate there to be, after contaminant correction,
between zero and two cluster members in the mass interval 6-4
790 arcmin2complete to J=21.1 mag, we estimate there to be, after contaminant correction,
between zero and two cluster members in the mass interval 6-4
![]() .
The low number of candidates in this mass bin may be indicative of a turnover in
the substellar mass function. Wider and deeper optical-to-infrared surveys are
required to confirm whether this is the case, by constraining the mass function
more tightly at lower masses.
.
The low number of candidates in this mass bin may be indicative of a turnover in
the substellar mass function. Wider and deeper optical-to-infrared surveys are
required to confirm whether this is the case, by constraining the mass function
more tightly at lower masses.
We thank the referee Kevin Luhman. We thank Claire Halliday (A&A language editor) and Terry Mahoney (IAC, Spain) for revising the English of the manuscript. We acknowledge Project No. 03065/PI/05 from the Fundación Séneca. Partially funded by the Spanish MEC under the Consolider-Ingenio 2010 Programme grant CSD2006-00070 (First Science with the GTC, http://www.iac.es/consolider-ingenio-gtc/). Based on observations made with ESO Telescopes at the La Silla or Paranal Observatories under programmes ID 068.C-0553(A) and 078.C-0402(A). Based on observations obtained at the Canada-France-Hawaii Telescope (CFHT), which is operated by the National Research Council of Canada, the Institut National des Sciences de l'Univers of the Centre National de la Recherche Scientifique of France, and the University of Hawaii. Based on observations collected at the German-Spanish Astronomical centre, Calar Alto, jointly operated by the Max-Planck-Institut für Astronomie Heidelberg and the Instituto de Astrofísica de Andalucía (CSIC). We thank Calar Alto Observatory for allocation of director's discretionary time to this programme. Based on observations made with the Isaac Newton Telescope (INT) and the William Herschel Telescope (WHT) operated on the island of La Palma by the Isaac Newton Group in the Spanish Observatorio del Roque de los Muchachos of the Instituto de Astrofísica de Canarias. This research has been supported by the Spanish Ministry of Science and Innovation (MICINN) under the grant AYA2007-67458. Some of the data presented herein were obtained at the W.M. Keck Observatory, which is operated as a scientific partnership among the California Institute of Technology, the University of California, and the National Aeronautics and Space Administration. The Observatory was made possible by the generous financial support of the W.M. Keck Foundation. The authors wish to recognise and acknowledge the very significant cultural role and reverence that the summit of Mauna Kea has always had within the indigenous Hawaiian community. We are most fortunate to have the opportunity to conduct observations from this mountain. This work is based in part on observations made with the Spitzer Space Telescope, which is operated by the Jet Propulsion Laboratory, California Institute of Technology under a contract with NASA. IRAF is distributed by the National Optical Astronomy Observatories, which are operated by the Association of Universities for Research in Astronomy, Inc., under cooperative agreement with the National Science Foundation. This publication makes use of data products from the Two Micron All Sky Survey, which is a joint project of the University of Massachusetts and the Infrared Processing and Analysis centre/California Institute of Technology, funded by the National Aeronautics and Space Administration and the National Science Foundation. This research has made use of SAOImage DS9, developed by Smithsonian Astrophysical Observatory. This research has made use of the SIMBAD database, operated at CDS, Strasbourg, France.
Appendix A: Representation of individual fields in the IZJHK-bands
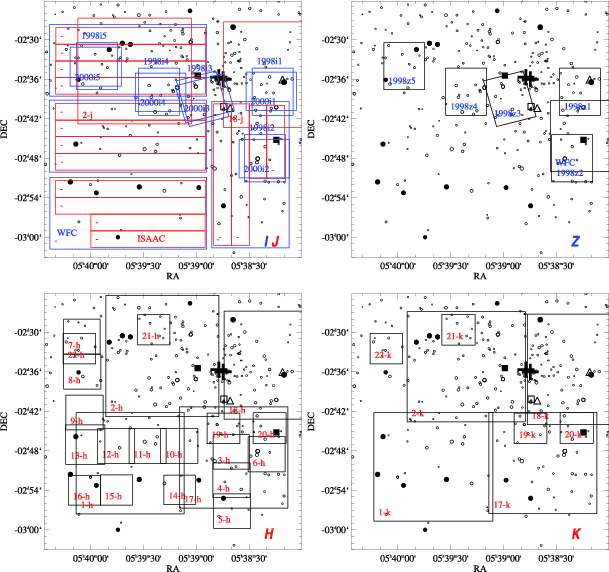
|
Figure A.1: Individual fields used in the search: IJ-bands ( top left), Z-band ( top right), H-band ( bottom left), and K-band ( bottom right). Symbols are defined as in Fig. 2. |
| Open with DEXTER | |
Appendix B: Finding charts
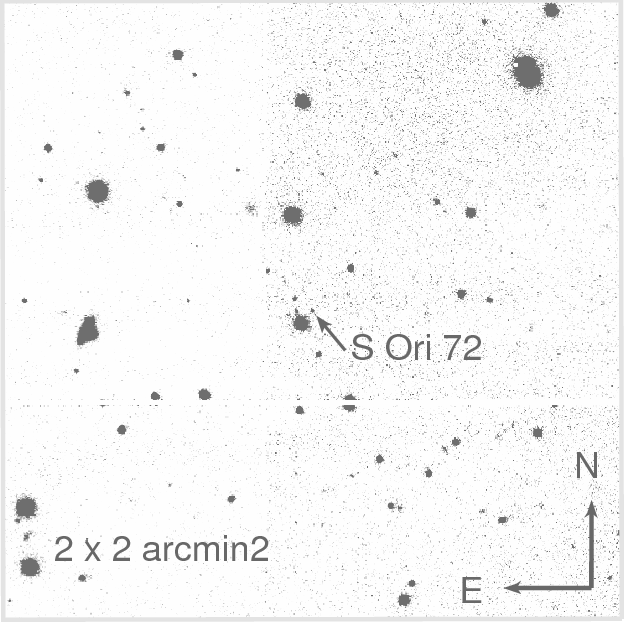
|
Figure B.1: ISAAC J-band image of S Ori 72. |
| Open with DEXTER | |
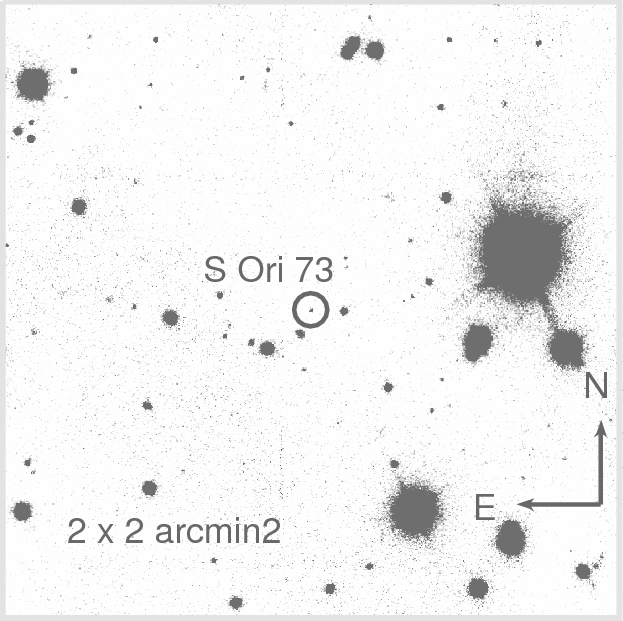
|
Figure B.2: ISAAC J-band image of S Ori 73. |
| Open with DEXTER | |
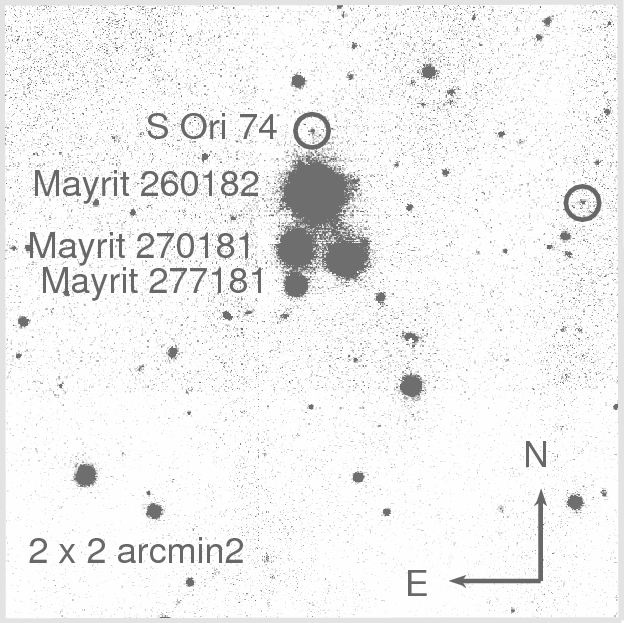
|
Figure B.3: ISAAC J-band image of S Ori 74 and S Ori J053840.8-024022 (unlabelled circle). |
| Open with DEXTER | |
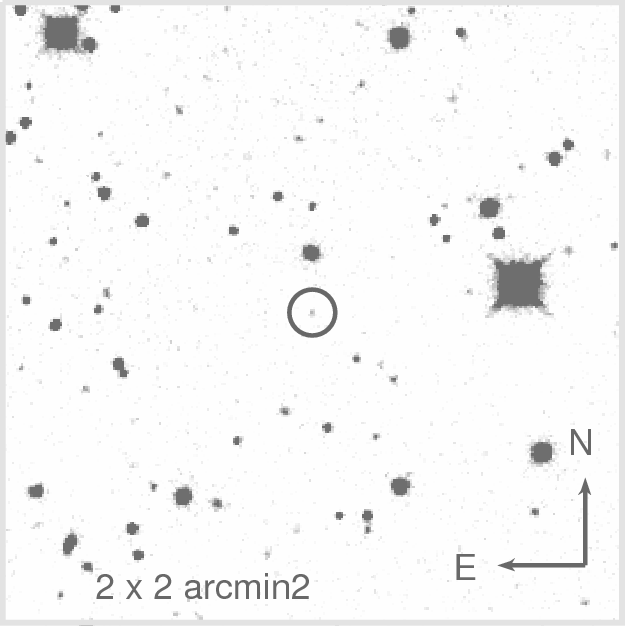
|
Figure B.4: Omega2000 H-band image of S Ori J053811.0-023601. |
| Open with DEXTER | |
References
- Baraffe, I., Chabrier, G., Barman, T. S., Allard, F., & Hauschildt, P. H. 2003, A&A, 402, 701 [NASA ADS] [CrossRef] [EDP Sciences]
- Bate, M. R. 2005, MNRAS, 363, 363 [NASA ADS]
- Bate, M. R. 2009, MNRAS, 392, 590 [NASA ADS] [CrossRef]
- Bate, M. R., & Bonnell, I. A. 2005, MNRAS, 356, 1201 [NASA ADS] [CrossRef]
- Beichman, C. A., Cutri, R., Jarrett, T., Stiening, R., & Skrutskie, M. 2003, AJ, 125, 2521 [NASA ADS] [CrossRef]
- Béjar, V. J. S., Martín, E. L., Zapatero Osorio, M. R., et al. 2001, ApJ, 556, 830 [NASA ADS] [CrossRef]
- Bihain, G., Rebolo, R., Béjar, V. J. S., et al. 2006, A&A, 458, 805 [NASA ADS] [CrossRef] [EDP Sciences]
- Boss, A. P. 1997, Science, 276, 1836 [NASA ADS] [CrossRef]
- Bouy, H., Huélamo, N., Martín, E. L., et al. 2009, A&A, 493, 931 [NASA ADS] [CrossRef] [EDP Sciences]
- Brown, A. G. A., de Geus, E. J., & de Zeeuw, P. T. 1994, A&A, 289, 101 [NASA ADS]
- Burgasser, A. J., Kirkpatrick, J. D., McGovern, M. R., et al. 2004, ApJ, 604, 827 [NASA ADS] [CrossRef]
- Caballero, J. A. 2006, Ph.D. Thesis, Universidad de La Laguna, Spain
- Caballero, J. A. 2007, A&A, 466, 917 [NASA ADS] [CrossRef] [EDP Sciences]
- Caballero, J. A. 2008a, MNRAS, 383, 375 [NASA ADS]
- Caballero, J. A. 2008b, A&A, 478, 667 [NASA ADS] [CrossRef] [EDP Sciences]
- Caballero, J. A. 2009, in The 15th Cambridge Workshop on Cool Stars, Stellar Systems, and the Sun, ed. E. Stempels, AIP Conf. Proc., 1094, 912
- Caballero, J. A., Martín, E. L., Dobbie, P. D., & Barrado y Navascués, D. 2006, A&A, 460, 635 [NASA ADS] [CrossRef] [EDP Sciences]
- Caballero, J. A., Béjar, V. J. S., Rebolo, R., et al. 2007, A&A, 470, 903 [NASA ADS] [CrossRef] [EDP Sciences]
- Caballero, J. A., Burgasser, A. J., & Klement, R. 2008a, A&A, 488, 181 [NASA ADS] [CrossRef] [EDP Sciences]
- Caballero, J. A., Valdivielso, L., Martín, E. L., et al. 2008b, A&A, 491, 515 [NASA ADS] [CrossRef] [EDP Sciences]
- Carpenter, J. M. 2001, AJ, 121, 2851 [NASA ADS] [CrossRef]
- Casali, M., Adamson, A., Alves de Oliveira, C., et al. 2007, A&A, 467, 777 [NASA ADS] [CrossRef] [EDP Sciences]
- Chabrier, G., & Baraffe, I. 2000, ARA&A, 38, 337 [NASA ADS] [CrossRef]
- Fortney, J. J., Marley, M. S., Saumon, D., & Lodders, K. 2008, ApJ, 683, 1104 [NASA ADS] [CrossRef]
- González-García, B. M., Zapatero Osorio, M. R., Béjar, V. J. S., et al. 2006, A&A, 460, 799 [NASA ADS] [CrossRef] [EDP Sciences]
- González Hernández, J. I., Caballero, J. A., Rebolo, R., et al. 2008, A&A, 490, 1135 [NASA ADS] [CrossRef] [EDP Sciences]
- Grazian, A., Fontana, A., de Santis, C., et al. 2006, A&A, 449, 951 [NASA ADS] [CrossRef] [EDP Sciences]
- Hambly, N. C., Collins, R. S., Cross, N. J. G., et al. 2008, MNRAS, 384, 637 [NASA ADS] [CrossRef]
- Hernández, J., Hartmann, L., Megeath, T., et al. 2007, ApJ, 662, 1067 [NASA ADS] [CrossRef]
- Hester, J. J., Scowen, P. A., Sankrit, R., et al. 1996, AJ, 111, 2349 [NASA ADS] [CrossRef]
- Hewett, P. C., Warren, S. J., Leggett, S. K., & Hodgkin, S. T. 2006, MNRAS, 367, 454 [NASA ADS] [CrossRef]
- Hoyle, F. 1953, ApJ, 118, 513 [NASA ADS] [CrossRef]
- Joye, W. A., & Mandel, E. 2003, in Astronomical Data Analysis Software and Systems XII, ed. H. E. Payne, R. I. Jedrzejewski, & R. N. Hook, PASPC, 295, 489
- Landsman, W. B. 1993, in PASPC, Astronomical Data Analysis Software and Systems II, ed. R. J. Hanisch, R. J. V. Brissenden, & J. Barnes, 52, 246
- Larson, R. B. 1973, MNRAS, 161, 133 [NASA ADS]
- Lawrence, A., Warren, S. J., Almaini, O., et al. 2007, MNRAS, 379, 1599 [NASA ADS] [CrossRef]
- Lodieu, N., Dobbie, P. D., Deacon, N. R., Venemans, B. P., & Durant, M. 2009a, MNRAS, 395, 1631 [NASA ADS] [CrossRef]
- Lodieu, N., Zapatero Osorio, M. R., Rebolo, R., Martín, E. L., & Hambly, N. C. 2009b, A&A, 505, 1115 [CrossRef] [EDP Sciences]
- Low, C., & Lynden-Bell, D. 1976, MNRAS, 176, 367 [NASA ADS]
- Lucas, P. W., & Roche, P. F. 2000, MNRAS, 314, 858 [NASA ADS] [CrossRef]
- Luhman, K. L., Hernández, J., Downes, J. J., Hartmann, L., & Briceño, C. 2008, ApJ, 688, 362 [NASA ADS] [CrossRef]
- Martín, E. L., & Zapatero Osorio, M. R. 2003, ApJ, 593, L113 [NASA ADS] [CrossRef]
- Mayne, N. J., & Naylor, T. 2008, MNRAS, 386, 261 [NASA ADS] [CrossRef]
- Metchev, S. A., Kirkpatrick, J. D., Berriman, G. B., & Looper, D. 2008, ApJ, 676, 1281 [NASA ADS] [CrossRef]
- Newberry, M. V. 1991, PASP, 103, 122 [NASA ADS] [CrossRef]
- Padoan, P., & Nordlund, Å. 2002, ApJ, 576, 870 [NASA ADS] [CrossRef]
- Padoan, P., & Nordlund, Å. 2004, ApJ, 617, 559 [NASA ADS] [CrossRef]
- Padoan, P., Nordlund, Å., Kritsuk, A. G., Norman, M. L., & Li, P. S. 2007, ApJ, 661, 972 [NASA ADS] [CrossRef]
- Patten, B. M., Stauffer, J. R., Burrows, A., et al. 2006, ApJ, 651, 502 [NASA ADS] [CrossRef]
- Rees, M. J. 1976, MNRAS, 176, 483 [NASA ADS]
- Scholz, A., & Jayawardhana, R. 2008, ApJ, 672, L49 [NASA ADS] [CrossRef]
- Sherry, W. H., Walter, F. M., Wolk, S. J., & Adams, N. R. 2008, AJ, 135, 1616 [NASA ADS] [CrossRef]
- Silk, J. 1977, ApJ, 214, 152 [NASA ADS] [CrossRef]
- Skrutskie, M. F., Cutri, R. M., Stiening, R., et al. 2006, AJ, 131, 1163 [NASA ADS] [CrossRef]
- Stamatellos, D., & Whitworth, A. P. 2009, MNRAS, 392, 413 [NASA ADS] [CrossRef]
- Stern, D., Eisenhardt, P., Gorjian, V., et al. 2005, ApJ, 631, 163 [NASA ADS] [CrossRef]
- Tinney, C. G., Burgasser, A. J., & Kirkpatrick, J. D. 2003, AJ, 126, 975 [NASA ADS] [CrossRef]
- Veras, D., Crepp, J. R., & Ford, E. B. 2009, ApJ, 696, 1600 [NASA ADS] [CrossRef]
- Vrba, F. J., Henden, A. A., Luginbuhl, C. B., et al. 2004, AJ, 127, 2948 [NASA ADS] [CrossRef]
- Whitworth, A. P., & Goodwin, S. P. 2005, Astron. Nachr., 326, 899 [NASA ADS] [CrossRef]
- Whitworth, A. P., & Stamatellos, D. 2006, A&A, 458, 817 [NASA ADS] [CrossRef] [EDP Sciences]
- Whitworth, A. P., & Zinnecker, H. 2004, A&A, 427, 299 [NASA ADS] [CrossRef] [EDP Sciences]
- Zapatero Osorio, M. R., Béjar, V. J. S., Martín, E. L., et al. 2000, Science, 290, 103 [NASA ADS] [CrossRef]
- Zapatero Osorio, M. R., Béjar, V. J. S., Martín, E. L., et al. 2002a, ApJ, 578, 536 [NASA ADS] [CrossRef]
- Zapatero Osorio, M. R., Béjar, V. J. S., Pavlenko, Y., et al. 2002b, A&A, 384, 937 [NASA ADS] [CrossRef] [EDP Sciences]
- Zapatero Osorio, M. R., Caballero, J. A., Béjar, V. J. S., et al. 2007, A&A, 472, L9 [NASA ADS] [CrossRef] [EDP Sciences]
- Zapatero Osorio, M. R., Béjar, V. J. S., Bihain, G., et al. 2008, A&A, 477, 895 [NASA ADS] [CrossRef] [EDP Sciences]
- Zhang, Z. H., Pokorny, R. S., Jones, H. R. A., et al. 2009, A&A, 497, 619 [NASA ADS] [CrossRef] [EDP Sciences]
Footnotes
- ...
UKIDSS
![[*]](/icons/foot_motif.png)
- UKIDSS uses the UKIRT Wide Field Camera (WFCAM, Casali et al. 2007) and a photometric system described in Hewett et al. (2006). The pipeline processing and science archive are described in Hambly et al. (2008).
- ... common
- S Ori 54 was not included in the comparison because in Luhman et al. (2008) the object was probably misidentified with the brighter source [SE2004] 26, at about 5 arcsec.
- ...
system
- http://hea-www.harvard.edu/saord/xpa/
- ... close
- De-blended in the images subtracted by the PSF fitted sources (NOAO.DIGIPHOT.DAOPHOT.ALLSTAR) or subtracted by a smoothing obtained with a moving average box much smaller than the image size (NOAO.IMRED.CCDRED.MKSKYCOR).
- ... candidates
- For the
latter, we were able to measure
 mag
and
mag
and  mag,
implying early L colours J-H=0.8 mag
and
mag,
implying early L colours J-H=0.8 mag
and  mag.
mag.
- ...Caballero et al. (2008a)
- Note that the photometric values in Table 3
therein correspond to the spectral types M3V, M4V, M5V,... instead of
M3-4V,
M4-5V, M5-6V,...The I and
 magnitudes are in the Johnson-Cousins-
and 2MASS photometric systems, respectively.
magnitudes are in the Johnson-Cousins-
and 2MASS photometric systems, respectively.
- ...Vrba et al. (2004)
- The J-H colour is transformed back from the CIT- to the 2MASS photometric system using the same colour transformation of Carpenter (2001) as used in Vrba et al. (2004).
- ... system
- The i- (or
 )
band photometry is from
HST/ACS and similar to that from the Sloan
Digital Sky Survey (SDSS). A
transformation
)
band photometry is from
HST/ACS and similar to that from the Sloan
Digital Sky Survey (SDSS). A
transformation  (
(
 mag) has been
obtained for stars
(http://web.archive.org/web/20071014232413/http://www.sdss.org/dr6/algorithms/sdssUBVRITransform.html);
we assumed that this transformation is
also valid for galaxies. The VLT/ISAAC
mag) has been
obtained for stars
(http://web.archive.org/web/20071014232413/http://www.sdss.org/dr6/algorithms/sdssUBVRITransform.html);
we assumed that this transformation is
also valid for galaxies. The VLT/ISAAC  -band
photometry was
converted to the Vega system using the transformations provided in the
web page
http://web.archive.org/web/20070814141037/http://www.eso.org/science/goods/releases/20050930/;
it is found to be consistent within 0.05 mag
with the 2MASS point-source photometry. For the Spitzer/IRAC
[3.6][4.5][5.8][8.0]-band photometry, we used the transformations
provided in
the web page http://web.ipac.caltech.edu/staff/gillian/cal.html
-band
photometry was
converted to the Vega system using the transformations provided in the
web page
http://web.archive.org/web/20070814141037/http://www.eso.org/science/goods/releases/20050930/;
it is found to be consistent within 0.05 mag
with the 2MASS point-source photometry. For the Spitzer/IRAC
[3.6][4.5][5.8][8.0]-band photometry, we used the transformations
provided in
the web page http://web.ipac.caltech.edu/staff/gillian/cal.html
- ... located
- S Ori 73 is the only candidate
found in one of the deeper multi-band search areas, summing up to
 470 arcmin2,
see Sect. 3.
470 arcmin2,
see Sect. 3.
All Tables
Table 1: Coordinates and depth of the LRIS imagesa.
Table 2: New near-infrared observationsa.
Table 3: Re-estimated depth of individual fields from Caballero et al. (2007) and Zapatero Osorio et al. (2008).
Table 4: Coordinates and photometry of the new L- and T-type cluster member candidatesa.
Table 5: Coordinates and photometry of probable galaxy candidatesa.
All Figures
|
|
Figure 1: Upper panel. Histogram in logarithmic scale of the I-band sources as a function of the calibrated magnitude (see text for details about the dotted lines). Lower panel. Instrumental magnitude error versus the calibrated magnitude of these sources (dots). The average error per magnitude bin is overploted as a red solid line. The magnitudes of the bins just below errors of 0.1 mag (blue lower line) and 0.2 mag (blue upper line) were defined here as the completeness and limiting magnitudes, respectively. |
| Open with DEXTER | |
| In the text | |
|
|
Figure 2:
Main search area: WFC-ISAAC IJ-band data (dashed line)
together with follow-up H- or K-band data (solid line). Additional search
areas: WFC I-, LRIS I-, and Omega2000
|
| Open with DEXTER | |
| In the text | |
|
|
Figure 3:
J versus I-J colour-magnitude diagram. The shaded search region is
where we expected cluster member candidates. The dashed line represents the
extrapolated selection boundary from Caballero et al. (2007). The dotted line
represents the I>24 mag selection sub-criterion. The dash-dot line represents
the 3 Myr COND model isochrone, where I and J are in the Cousins and CIT
photometric systems, respectively. The two small filled circles are the faintest
objects from Caballero et al. (2007) and the large filled circle is S Ori 70. The
four (5 |
| Open with DEXTER | |
| In the text | |
|
|
Figure 4:
J versus J-[3.6] colour-magnitude diagram of |
| Open with DEXTER | |
| In the text | |
|
|
Figure 5: J versus J-[4.5] colour-magnitude diagram. Same as in Fig. 4. |
| Open with DEXTER | |
| In the text | |
|
|
Figure 6: I-J versus J-H colour-colour diagram of stars (black crosses), AGN (red crosses), and galaxies (grey crosses) from the GOODS-MUSIC catalogue (Grazian et al. 2006), in the magnitude range 19.5<J<21.5 mag. The solid line represents the field L1-T7-type dwarf sequence, the filled circle represents S Ori 70, and the open circles represent the new candidates. S Ori J053840.8-024022 and S Ori J053811.0-023601 are labelled ``glx 1'' and ``glx 2'', respectively. |
| Open with DEXTER | |
| In the text | |
|
|
Figure 7:
I-J versus
|
| Open with DEXTER | |
| In the text | |
|
|
Figure 8: J versus J-[3.6] and J-[4.5] colour-magnitude diagrams. Same as in Fig. 6. The blue solid line represents the field dwarf sequence shifted as in Fig. 4. |
| Open with DEXTER | |
| In the text | |
|
|
Figure 9:
Near- and mid-infrared colour-colour diagrams: J-[3.6] and
J-[4.5] versus J-H ( top- and bottom left), J-[3.6] and J-[4.5] versus
|
| Open with DEXTER | |
| In the text | |
|
|
Figure 10: Mid-infrared diagrams: [3.6] versus [3.6]-[5.8] ( left), [3.6]-[5.8] versus [4.5]-[8.0] ( right). Same as in Fig. 6. |
| Open with DEXTER | |
| In the text | |
|
|
Figure 11:
Spectral energy distributions of the new candidates compared
to average ones of field dwarfs (dotted lines).
|
| Open with DEXTER | |
| In the text | |
|
|
Figure 12: J-band luminosity function with the LT-type candidates at J>19.7 mag (dashed line) and the brighter cluster member candidates from Caballero et al. (2007) scaled to the search area (solid line). |
| Open with DEXTER | |
| In the text | |
|
|
Figure 13:
Mass spectrum with contamination-corrected data. The dotted segment
represents the linear fit to the data points from Caballero et al. (2007) in the
mass range 0.11-0.006 |
| Open with DEXTER | |
| In the text | |
|
|
Figure A.1: Individual fields used in the search: IJ-bands ( top left), Z-band ( top right), H-band ( bottom left), and K-band ( bottom right). Symbols are defined as in Fig. 2. |
| Open with DEXTER | |
| In the text | |
|
|
Figure B.1: ISAAC J-band image of S Ori 72. |
| Open with DEXTER | |
| In the text | |
|
|
Figure B.2: ISAAC J-band image of S Ori 73. |
| Open with DEXTER | |
| In the text | |
|
|
Figure B.3: ISAAC J-band image of S Ori 74 and S Ori J053840.8-024022 (unlabelled circle). |
| Open with DEXTER | |
| In the text | |
|
|
Figure B.4: Omega2000 H-band image of S Ori J053811.0-023601. |
| Open with DEXTER | |
| In the text | |
Copyright ESO 2009
Current usage metrics show cumulative count of Article Views (full-text article views including HTML views, PDF and ePub downloads, according to the available data) and Abstracts Views on Vision4Press platform.
Data correspond to usage on the plateform after 2015. The current usage metrics is available 48-96 hours after online publication and is updated daily on week days.
Initial download of the metrics may take a while.