| Issue |
A&A
Volume 506, Number 3, November II 2009
|
|
|---|---|---|
| Page(s) | 1137 - 1146 | |
| Section | Extragalactic astronomy | |
| DOI | https://doi.org/10.1051/0004-6361/200912138 | |
| Published online | 15 September 2009 | |
A&A 506, 1137-1146 (2009)
The metallicity gradient as a tracer of history and structure: the Magellanic Clouds and M33 galaxies
M.-R. L. Cioni
University of Hertfordshire, Science and Technology Research Institute, Hatfield AL10 9AB, UK
Received 24 March 2009 / Accepted 9 August 2009
Abstract
Context. The stellar metallicity and its gradient
place constraints on the formation and evolution of galaxies.
Aims. This is a study of the metallicity gradient of
the LMC, SMC and M33 galaxies derived from their asymptotic giant
branch (AGB) stars.
Methods. The [Fe/H] abundance was derived from the
ratio between C- and M-type AGB stars and its variation analysed as a
function of galactocentric distance. Galaxy structure parameters were
adopted from the literature.
Results. The metallicity of the LMC decreases
linearly as ![]() dex kpc-1
out to
dex kpc-1
out to ![]() 8 kpc
from the centre. In the SMC, [Fe/H] has a constant value of
8 kpc
from the centre. In the SMC, [Fe/H] has a constant value of ![]()
![]() dex up to
dex up to ![]() 12 kpc.
The gradient of the M33 disc, until
12 kpc.
The gradient of the M33 disc, until ![]() 9 kpc, is
9 kpc, is ![]() dex kpc-1
while the outer disc/halo, out to
dex kpc-1
while the outer disc/halo, out to ![]() 25 kpc, has
[Fe/H]
25 kpc, has
[Fe/H] ![]() dex.
dex.
Conclusions. The metallicity of the LMC, as traced
by different populations, bears the signature of two major star forming
episodes: the first one constituting a thick disc/halo population and
the second one a thin disc and bar due to a close encounter with the
Milky Way and SMC. The [Fe/H] of the recent episode supports an LMC
origin for the Stream. The metallicity of the SMC supports star
formation, ![]() 3 Gyr
ago, as triggered by LMC interaction and sustained by the bar in the
outer region of the galaxy. The SMC [Fe/H] agrees with the
present-day abundance in the Bridge and shows no significant gradient.
The metallicity of M33 supports an ``inside-out'' disc formation via
accretion of metal poor gas from the interstellar medium.
3 Gyr
ago, as triggered by LMC interaction and sustained by the bar in the
outer region of the galaxy. The SMC [Fe/H] agrees with the
present-day abundance in the Bridge and shows no significant gradient.
The metallicity of M33 supports an ``inside-out'' disc formation via
accretion of metal poor gas from the interstellar medium.
Key words: galaxies: abundances - Magellanic Clouds - Local Group - stars: AGB and post-AGB - galaxies: stellar content - galaxies: individual: M33
1 Introduction
The Magellanic Clouds and M33 galaxies are members of the Local Group. They contain many AGB stars that have been used to study their star formation history (SFH) and structure (e.g. Cioni et al. 2000a; van der Marel & Cioni 2001; Cioni & Habing 2003; Cioni et al. 2006a,b, 2008a). AGB stars exist in two forms: carbon-rich (C-type) and oxygen-rich (M-type), depending on the chemical abundance (atoms and molecules) of their atmosphere. Their ratio, the C/M ratio, is an established indicator of metallicity; the most comprehensive, whilst not perfect, calibration as a function of [Fe/H] is given by Battinelli & Demers (2005).
The investigation of the metallicity gradient in galaxies is directly linked to their formation mechanism. Generally, in a collapse scenario gas is accreted and falls into the centre where stars form, enriching the pre-existing gas. Stars may also form during the accretion process at a given distance from the centre. Bar, disc and halo components as well as the dynamical interaction of galaxies and the accretion of satellites alter the distribution of gas. The detection of metallicity and age gradients is crucial to interpret the formation and evolution mechanisms.
Gradients in total metallicity, iron, oxygen or ![]() elements may
differ because they do not share the same origin and evolution, and
therefore trace different moments in the history of galaxies. According
to stellar evolution theory, iron-peak elements are mostly produced in
the explosion of supernovae (SNe) of type I, with low- and
intermediate-mass star progenitors. Oxygen and other
elements may
differ because they do not share the same origin and evolution, and
therefore trace different moments in the history of galaxies. According
to stellar evolution theory, iron-peak elements are mostly produced in
the explosion of supernovae (SNe) of type I, with low- and
intermediate-mass star progenitors. Oxygen and other ![]() elements are instead primarily produced by SNe type II, with
massive star progenitors. The relation between iron and oxygen depends
on the galaxy.
elements are instead primarily produced by SNe type II, with
massive star progenitors. The relation between iron and oxygen depends
on the galaxy.
The Magellanic Clouds are a pair of interacting galaxies. Recent measurements of their proper motion (Kallivayalil et al. 2006a,b) suggest that they are approaching the Milky Way (MW) for the first time (Besla et al. 2007). Their mutual interaction, rather than the interaction with the MW, is fundamental in shaping their SFH and metallicity gradients. The large magellanic cloud (LMC) is a late-type spiral galaxy seen nearly face-on, rich in gas and with active star formation while the small magellanic cloud (SMC) is a highly inclined irregular galaxy with less active star formation. Their dynamical interaction is claimed to be responsible for the various star forming episodes and of the creation of the Magellanic Bridge, connecting the two galaxies, (Gordon et al. 2009) and the Stream (Nidever et al. 2008). The LMC is probably just a few kpc thick, along the line of sight, but the SMC has a more complex structure that may extend up to 20 kpc. Their apparent morphology is dominated by the distribution of young stars, while evolved stars trace a more regular elliptical structure (Cioni et al. 2000a). Embedded in each galaxy is a bar. The Magellanic Clouds have experienced an extended SFH (e.g. Hill 2000; Zaritsky et al. 2002; 2004; Cole et al 2005; Pompéia et al. 2008; Gallart et al. 2008; Carrera et al. 2008a,b).
M33 is an isolated spiral galaxy. Its most prominent feature
is a
warped disc embedding well delineated spiral arms. Surface brightness
profiles indicate that the disc is truncated at ![]() 8 kpc (Ferguson
et al. 2007)
and while there might be a halo (Schommer et al.
1991;
McConnachie et al. 2006a;
Sarajedini et al.
2006), there is
no bulge (McLean & Liu1996).
The SFH
of the inner disc is different from that of the outer disc/halo
(e.g. Barker et al. 2007;
Williams et al. 2009).
Inhomogeneities in age and metallicity have been presented by Cioni
et al. (2008a).
8 kpc (Ferguson
et al. 2007)
and while there might be a halo (Schommer et al.
1991;
McConnachie et al. 2006a;
Sarajedini et al.
2006), there is
no bulge (McLean & Liu1996).
The SFH
of the inner disc is different from that of the outer disc/halo
(e.g. Barker et al. 2007;
Williams et al. 2009).
Inhomogeneities in age and metallicity have been presented by Cioni
et al. (2008a).
This paper, motivated by previous investigations, explores the [Fe/H] abundance variation with galactocentric distance in the Magellanic Clouds and M33. Section 2 describes the AGB samples, the calculation of [Fe/H] and of distances as well as of gradients. Section 3 discusses these gradients with respect to the literature and the implication on the structure, formation and evolution of each galaxy. Section 4 concludes this study. The appendix discusses the iron abundance with respect to the Ca II triplet (Appendix A) and the C/M ratio (Appendix B).
2 Analysis
2.1 The AGB sample
The data analysed here are from Cioni & Habing (2003), for the
Magellanic Clouds, and Cioni et al. (2008a), for M33. The
samples
contain 32801 and 7653 AGB stars within two areas of ![]() deg2
in the LMC and SMC, respectively, and 14 360 in M33 within
deg2
in the LMC and SMC, respectively, and 14 360 in M33 within
![]() deg2.
The LMC and SMC areas, centred at
deg2.
The LMC and SMC areas, centred at
![]() and
and
![]() ,
were divided using a grid of
,
were divided using a grid of
![]() cells of size 0.04 deg2 each. The M33
area,
centred at
cells of size 0.04 deg2 each. The M33
area,
centred at ![]() ,
was divided
using a grid of
,
was divided
using a grid of ![]() cells
of size 0.0025 deg2 each.
cells
of size 0.0025 deg2 each.
The number of C- and M-type AGB stars was selected using
colour-magnitude diagrams. DENIS-
![]() data were used for the
Magellanic Clouds. This combination of optical and near-infrared
broad-band observations allows us to minimize the contamination of the
AGB sample by foreground and red giant branch (RGB) stars. The
reader
should refer to Cioni & Habing (2003) for the
sub-type of AGB
stars selected. Only
data were used for the
Magellanic Clouds. This combination of optical and near-infrared
broad-band observations allows us to minimize the contamination of the
AGB sample by foreground and red giant branch (RGB) stars. The
reader
should refer to Cioni & Habing (2003) for the
sub-type of AGB
stars selected. Only ![]() data were available for M33 and the most
reliable, whilst not complete, sample of AGB stars was obtained by
selecting AGB stars above the tip of the RGB that were classified as C
if
data were available for M33 and the most
reliable, whilst not complete, sample of AGB stars was obtained by
selecting AGB stars above the tip of the RGB that were classified as C
if ![]() and as M if comprised within two slanted lines,
following the shape of the giant branch and in agreement with
theoretical stellar evolutionary models (see Cioni et al. 2008a).
and as M if comprised within two slanted lines,
following the shape of the giant branch and in agreement with
theoretical stellar evolutionary models (see Cioni et al. 2008a).
Prior to the selection of the AGB sample, the data were dereddend to account for interstellar extinction along the line of sight, as in Cioni et al. (2006a,b, 2008a). If differential reddening is, however, present throughout a galaxy, this may affect the source selection based on colours and magnitudes. The extinction map derived by Zaritsky et al. (2004) for the LMC shows that dust is highly localized near young and hot stars while there is no global pattern. The extinction towards older stars is bimodal, reflecting the location of stars in front of and behind a thin dust layer embedding the young stars. This extinction corresponds to absorption peaks of AJ=0.02, 0.12 and AK=0.01, 0.05 for AV=0.1, 0.5 and adopting the Glass & Schultheis (2003) extinction law. The lack of pattern does not influence the global shape of the galactocentric trends discussed here, but it will introduce scatter around them. No extinction map is available at present for the SMC and M33.
2.2 The iron abundance
The C/M ratio has been established as a good indicator of metallicity.
Battinelli & Demers (2005)
have provided a relation to convert
this ratio into iron abundance: [Fe/H]
![]() .
This relation was obtained by homogeneously
classifying AGB stars in a wide sample of Local Group galaxies and by
adopting [Fe/H] values from, mostly, RGB stars. The latter represent
the closest approximation to the metallicity of the AGB progenitors
across their age range. A re-assessment of this relation,
[Fe/H]
.
This relation was obtained by homogeneously
classifying AGB stars in a wide sample of Local Group galaxies and by
adopting [Fe/H] values from, mostly, RGB stars. The latter represent
the closest approximation to the metallicity of the AGB progenitors
across their age range. A re-assessment of this relation,
[Fe/H]
![]() ,
is given in
Appendix B.
,
is given in
Appendix B.
![\begin{figure}
\par\includegraphics[width=8.3cm,clip]{12138fg1.ps} %\end{figure}](/articles/aa/full_html/2009/42/aa12138-09/img21.png)
|
Figure 1:
Metallicity distribution for the LMC (dashed line), M33 (dotted line)
and the SMC (continuous line) normalized to their peak of 544, 115 and
50 stars, respectively. Shaded areas indicate [Fe/H] values
with |
| Open with DEXTER | |
The C/M ratio obtained within each cell across the Magellanic Clouds
and M33 has been converted into [Fe/H] using this relation. The
uncertainty in the resulting values of [Fe/H] is the propagated error
on the parameters that characterize the relation and on the error on
the number of C and M stars, the square root of these numbers.
This
error is ![]() 0.1
if C/M
0.1
if C/M ![]() or [Fe/H]
or [Fe/H] ![]() dex.
Figure
1 shows the
metallicity distribution across each galaxy. The
distribution of M33 is bimodal with peaks at [Fe/H]
dex.
Figure
1 shows the
metallicity distribution across each galaxy. The
distribution of M33 is bimodal with peaks at [Fe/H]
![]() and
[Fe/H]
and
[Fe/H]
![]() dex. The LMC peaks
at [Fe/H]
dex. The LMC peaks
at [Fe/H]
![]() dex
and the SMC at [Fe/H]
dex
and the SMC at [Fe/H]
![]() dex. Sources with
dex. Sources with ![]() dex
populate mostly the metal-rich peak
in M33; the metal-poor peak appears, however, significant with respect
to the uncertainties involved. The metallicity of the LMC is higher
than that of the SMC while the metal-rich M33 peak is wide and
encompasses both Magellanic peaks.
dex
populate mostly the metal-rich peak
in M33; the metal-poor peak appears, however, significant with respect
to the uncertainties involved. The metallicity of the LMC is higher
than that of the SMC while the metal-rich M33 peak is wide and
encompasses both Magellanic peaks.
2.3 The AGB gradient
A galactocentric distance, ![]() ,
has been associated with each
cell. These values were derived using distance (D),
position angle
of the major axis (PA) and inclination (i),
as listed in
Table 1
and proceeding as follows:
,
has been associated with each
cell. These values were derived using distance (D),
position angle
of the major axis (PA) and inclination (i),
as listed in
Table 1
and proceeding as follows:
- - convert the equatorial coordinates of each star (
 )
into angular coordinates (xi,yi);
)
into angular coordinates (xi,yi);
- - group stars into cells of a given grid (Sect. 2.1);
- - rotate the coordinate system according to:
(1) Open with DEXTER
(2)
where (x,y) are mid-cell values in deg and ;
;
- - de-project using:

(3)
- - calculate the angular distance and convert into kpc with:
(4)
(5)
where d is the angular distance of each cell.
Table 1: Parameters of galaxy structures.
Figure 2
shows that the LMC has a smooth gradient where
the central region is more metal rich, [Fe/H]
![]() dex, compared
to the outer region, [Fe/H]
dex, compared
to the outer region, [Fe/H] ![]() dex at
dex at ![]() 10 kpc.
A
non-weighted least square fit through all points gives [Fe/H]
10 kpc.
A
non-weighted least square fit through all points gives [Fe/H]
![]() with a typical uncertainty on a single measurement of
0.14 (rms) while if only points with
with a typical uncertainty on a single measurement of
0.14 (rms) while if only points with ![]() dex
are considered, the
resulting fit is [Fe/H]
dex
are considered, the
resulting fit is [Fe/H]
![]() with rms= 0.09.
with rms= 0.09.
A negligible gradient is derived for the SMC (Fig. 3). A
non-weighted least square fit through all points gives
[Fe/H]
![]() with rms =
0.13 while for
with rms =
0.13 while for ![]() dex
the resulting fit is
[Fe/H]
dex
the resulting fit is
[Fe/H]
![]() with rms =
0.09. Note that the slope is different between the two fits but in
both cases it is consistent with a flat gradient.
with rms =
0.09. Note that the slope is different between the two fits but in
both cases it is consistent with a flat gradient.
The M33 gradient has a dual distribution (Fig. 4) and the
change in slope occurs at about the truncation radius, ![]() 8 kpc
(Ferguson et al. 2007).
A non-weighted fit of all points with
8 kpc
(Ferguson et al. 2007).
A non-weighted fit of all points with
![]() dex,
that are approximately confined
within this radius and have [Fe/H]
dex,
that are approximately confined
within this radius and have [Fe/H] ![]() ,
gives [Fe/H]
,
gives [Fe/H]
![]() with rms = 0.11. Points
with [Fe/H] <-1.5 dex have
with rms = 0.11. Points
with [Fe/H] <-1.5 dex have ![]() kpc
and their fit is
[Fe/H]
kpc
and their fit is
[Fe/H]
![]() with
rms =0.09. By neglecting the dual distribution and the
uncertainty
one obtains [Fe/H]
with
rms =0.09. By neglecting the dual distribution and the
uncertainty
one obtains [Fe/H]
![]() with
rms = 0.17.
with
rms = 0.17.
3 Discussion
3.1 The large magellanic cloud
![\begin{figure}
\par\includegraphics[width=15.5cm,clip]{12138fg2.ps}
\end{figure}](/articles/aa/full_html/2009/42/aa12138-09/img48.png)
|
Figure 2:
Iron abundance in the LMC. Points referring to AGB abundances with |
![\begin{figure}
\par\includegraphics[width=15.5cm,clip]{12138fg3.ps}
\end{figure}](/articles/aa/full_html/2009/42/aa12138-09/img49.png)
|
Figure 3: Iron abundance in the SMC. Points are as in Fig. 2. The least square fit lines through all points (red) and only those with small uncertainties (blue) are indicated. Filled circles with large error bars (light blue) and their least square fit line (yellow) refer to RGB stars by Carrera et al. (2008a) while filled circles with small error bars (dark blue) are for stellar clusters (Parisi et al. 2009; Da Costa & Hatzidimitriou 1998). Both measurements were corrected as explained in the text. Filled circles without error bars and the best fit line through them (green) are for PNe by Idiart et al. (2007). The colour figure is available electronically. |
| Open with DEXTER | |
Literature studies of the LMC refer to an inner and an outer disc component simply differentiating how far the observed regions are from the centre. The presence of an inner/outer halo component is instead drawn from metallicity measurements. A halo containing predominantly gas from the initial process of galaxy formation would be metal poorer than the disc of the galaxy where stars have formed. A metal rich halo would instead bear the signature of significant accretion of small bodies. The bar, residing in the disc (Zaritsky et al. 1994), is usually referred to as a separate component and can considerably reduce pre-existing abundance gradients over a few dynamical timescales since its formation (Friedli & Benz 1995).
3.1.1 AGB and RGB gradients
Cole et al. (2005)
derived [Fe/H] using the Ca II triplet
method in a sample of RGB stars in the LMC bar. Carrera et al.
(2008a) used
the same method for RGB stars at 3-7 kpc and
Pompéia et al. (2008)
for RGB stars at ![]() 2 kpc.
The
original data-point from Pompéia et al. (2008) is the mean
and standard deviation, [Fe/H]
2 kpc.
The
original data-point from Pompéia et al. (2008) is the mean
and standard deviation, [Fe/H]
![]() ,
of their sample
(Appendix A).
The two Cole et al. (2005)
points correspond
to the disc (metal rich) and to the halo (metal poor). Carrera
et al.
(2008a) quote
metallicities only for the disc. On the other
hand, their Fig. 5 shows that a halo component exists in at
least two
of their fields. I derived the intensity and width of this component
from their histograms. Table 2
shows the values of [Fe/H]
obtained from the Cole et al. (2005), Pompéia
et al. (2008)
and Carrera et al. (2008a)
original data
and the values resulting from applying a correction for the difference
between Ca II triplet abundances and abundances obtained
directly from
iron lines (Appendix A).
The latter are used in this study.
,
of their sample
(Appendix A).
The two Cole et al. (2005)
points correspond
to the disc (metal rich) and to the halo (metal poor). Carrera
et al.
(2008a) quote
metallicities only for the disc. On the other
hand, their Fig. 5 shows that a halo component exists in at
least two
of their fields. I derived the intensity and width of this component
from their histograms. Table 2
shows the values of [Fe/H]
obtained from the Cole et al. (2005), Pompéia
et al. (2008)
and Carrera et al. (2008a)
original data
and the values resulting from applying a correction for the difference
between Ca II triplet abundances and abundances obtained
directly from
iron lines (Appendix A).
The latter are used in this study.
Figure 2
shows that RGB values, compared to AGB ones, have
a dual behaviour: those of the disc have high abundances and a
negligible gradient out to ![]() 6 kpc,
and those of the halo are
metal poor and follow the AGB gradient more closely. The intensity of
star forming episodes, the dynamical effect of the bar and the
re-distribution of stars from their birth place (Roskar et al.
2008) may be
responsible for the different gradients and
for the scatter around them. It is unlikely that the photometric
criteria used to discriminate between C- and M-type stars favour low
metallicities. In fact it is somewhat easier to distinguish C stars
using their near-infrared colours and magnitudes because at their
location there are very few sources of contamination (Cioni
et al.
2001; Battinelli
& Demers 2009).
The M star region,
however, relies strongly on the minimization of the contribution by
RGB and galactic dwarf stars. The result is a bias in isolating
preferentially metal-rich regions, with low C/M ratios, as
M stars
would be over-estimated compared to C stars within the same region.
6 kpc,
and those of the halo are
metal poor and follow the AGB gradient more closely. The intensity of
star forming episodes, the dynamical effect of the bar and the
re-distribution of stars from their birth place (Roskar et al.
2008) may be
responsible for the different gradients and
for the scatter around them. It is unlikely that the photometric
criteria used to discriminate between C- and M-type stars favour low
metallicities. In fact it is somewhat easier to distinguish C stars
using their near-infrared colours and magnitudes because at their
location there are very few sources of contamination (Cioni
et al.
2001; Battinelli
& Demers 2009).
The M star region,
however, relies strongly on the minimization of the contribution by
RGB and galactic dwarf stars. The result is a bias in isolating
preferentially metal-rich regions, with low C/M ratios, as
M stars
would be over-estimated compared to C stars within the same region.
Most AGB stars are long period variables (LPVs) and Hughes
et al.
(1991) derived
that 40% of them are old (![]() 9 Gyr)
and
part of a spheroidal population, with 53% being of intermediate age
(
9 Gyr)
and
part of a spheroidal population, with 53% being of intermediate age
(![]() 4 Gyr)
and residing in a disc; the others are young (
4 Gyr)
and residing in a disc; the others are young (![]() 1 Gyr). Most C stars reside in a thick
disc (van der Marel et al. 2002)
and are 1-4 Gyr old (Marigo et al. 1999).
The distinction between a thin and thick disc is not clear. In our
Galaxy, thick disc stars have higher
1 Gyr). Most C stars reside in a thick
disc (van der Marel et al. 2002)
and are 1-4 Gyr old (Marigo et al. 1999).
The distinction between a thin and thick disc is not clear. In our
Galaxy, thick disc stars have higher ![]() than thin
disc stars (Soubiran & Girard 2005) but
than thin
disc stars (Soubiran & Girard 2005) but ![]() might follow a gradient within either discs (Edvardsson et al.
1993). The low
might follow a gradient within either discs (Edvardsson et al.
1993). The low ![]() ratio measured by
Pompéia et al. (2008)
suggests a higher contribution by SN
type Ia relative to type II, supporting the formation of their
stars
at intermediate ages. Cole et al. (2000) indicate that
these
RGB stars are likely 1-3 Gyr old, like most of the RGB stars
studied
by Cole et al. (2005)
and Carrera et al. (2008a).
If
many of the AGB stars analysed here are older than the bulk of RGB
stars, they will more closely follow the outer disc/halo.
ratio measured by
Pompéia et al. (2008)
suggests a higher contribution by SN
type Ia relative to type II, supporting the formation of their
stars
at intermediate ages. Cole et al. (2000) indicate that
these
RGB stars are likely 1-3 Gyr old, like most of the RGB stars
studied
by Cole et al. (2005)
and Carrera et al. (2008a).
If
many of the AGB stars analysed here are older than the bulk of RGB
stars, they will more closely follow the outer disc/halo.
3.1.2 Does the LMC have a stellar halo?
A break in the surface brightness profile, usually associated
with the
transition between two components, is present at ![]()
![]() (
(![]() 3.6 kpc;
van der Marel 2001).
The AGB gradient at
3.6 kpc;
van der Marel 2001).
The AGB gradient at
![]() is only marginally flatter than in the inner disc.
Observations of stellar clusters exhibit disc-like kinematics that is
very similar to the HI disc (Grocholski et al. 2006,
2007). Their
corrected metallicity, using Eq. (A.1), is
constant at [Fe/H]
is only marginally flatter than in the inner disc.
Observations of stellar clusters exhibit disc-like kinematics that is
very similar to the HI disc (Grocholski et al. 2006,
2007). Their
corrected metallicity, using Eq. (A.1), is
constant at [Fe/H]
![]() dex, in agreement
with the inner
disc metallicity in field RGBs. Grocholski et al. (2006)
attributed this flattening to the dynamical effect of a bar that
occupies a significant fraction of the disc length. The older and
metal poorer clusters, however, follow the AGB gradient, regardless of
their location with respect to the galaxy centre, this is also true
for RGB stars associated with the halo. The small number of these
clusters does not allow us to characterize their kinematics but
suggests that a halo extends at least to
dex, in agreement
with the inner
disc metallicity in field RGBs. Grocholski et al. (2006)
attributed this flattening to the dynamical effect of a bar that
occupies a significant fraction of the disc length. The older and
metal poorer clusters, however, follow the AGB gradient, regardless of
their location with respect to the galaxy centre, this is also true
for RGB stars associated with the halo. The small number of these
clusters does not allow us to characterize their kinematics but
suggests that a halo extends at least to ![]() 14 kpc from the
centre; LMC stars have been reported at
14 kpc from the
centre; LMC stars have been reported at ![]() 20 kpc (Majewski
et al.
2005), while
studies of AGB stars are limited to
20 kpc (Majewski
et al.
2005), while
studies of AGB stars are limited to ![]() 10 kpc.
10 kpc.
RR Lyrae stars are often attributed to the halo of galaxies
because of
their old age and velocity dispersion (Minniti et al. 2003).
In the LMC, they may have formed in the disc and subsequently moved to
the halo as a consequence of a merger event in the early formation of
the galaxy (Subramaniam 2006).
This halo formed before the
disc currently traced by red clump giant stars (Subramanian &
Subramaniam 2009).
The metallicity of RR Lyrae stars measured
by Borissova et al. (2006)
and their least square fit,
[Fe/H]
![]() with
rms =0.18, are shown in Fig. 2. This gradient is
steeper
than that obtained from AGB stars and population II clusters (
with
rms =0.18, are shown in Fig. 2. This gradient is
steeper
than that obtained from AGB stars and population II clusters (![]() 9 Gyr
old). The latter is steeper than that from disc RGB stars and
intermediate-age (1-3 Gyr) clusters.
9 Gyr
old). The latter is steeper than that from disc RGB stars and
intermediate-age (1-3 Gyr) clusters.
Table 2: [Fe/H] abundances in the LMC.
3.1.3 Chemical enrichment and dynamics
The difference between the AGB and the RR Lyrae stars gradients,
supported by old clusters, suggests that chemical enrichment has
occured between the formation of their progenitors. If these AGB stars
are old (Hughes et al. 1991)
a 2 Gyr difference would
produce an enrichment of ![]() 0.02 dex kpc-1 Gyr-1.
On the
other hand, the mean age difference between RR Lyrae stars and young
RGB stars or young clusters is 8 Gyr. By comparing their
gradients
we obtain an enrichment of
0.02 dex kpc-1 Gyr-1.
On the
other hand, the mean age difference between RR Lyrae stars and young
RGB stars or young clusters is 8 Gyr. By comparing their
gradients
we obtain an enrichment of ![]() 0.01 dex kpc-1 Gyr-1.
If
the enrichment took place in the last 3 Gyr then the rate can
be as
high as 0.05 dex kpc-1 Gyr-1.
A steep enrichment is also
supported by the difference between the AGB and young-RGB
gradients. The metallicity offset between RR Lyrae stars and AGB stars
is comparable to the difference between AGB stars and young RGB
stars. This effect can be explained in terms of age differences but
could also be influenced by the dispersion in the calibration of the
C/M-[Fe/H] relation as well as uncertainties in metallicities obtained
via other methods. There are insufficient data on HII regions and PNe
to investigate further the chemical enrichment of the LMC. The census
of these objects is incomplete and biased towards younger members
(Reid & Parker 2006;
Leisy & Dennefeld 2006;
Dufour
et al. 1984).
Metal poor PNe distributed over a halo fall
below the sensitivity of previous studies. High PNe abundances, that
do not include iron, are confined to the bar and south eastern region
of the LMC, indicating places were star formation was recently active
(Leisy & Dennefeld 2006).
0.01 dex kpc-1 Gyr-1.
If
the enrichment took place in the last 3 Gyr then the rate can
be as
high as 0.05 dex kpc-1 Gyr-1.
A steep enrichment is also
supported by the difference between the AGB and young-RGB
gradients. The metallicity offset between RR Lyrae stars and AGB stars
is comparable to the difference between AGB stars and young RGB
stars. This effect can be explained in terms of age differences but
could also be influenced by the dispersion in the calibration of the
C/M-[Fe/H] relation as well as uncertainties in metallicities obtained
via other methods. There are insufficient data on HII regions and PNe
to investigate further the chemical enrichment of the LMC. The census
of these objects is incomplete and biased towards younger members
(Reid & Parker 2006;
Leisy & Dennefeld 2006;
Dufour
et al. 1984).
Metal poor PNe distributed over a halo fall
below the sensitivity of previous studies. High PNe abundances, that
do not include iron, are confined to the bar and south eastern region
of the LMC, indicating places were star formation was recently active
(Leisy & Dennefeld 2006).
According to Bekki et al. (2004), the LMC
experienced a close
encounter with the SMC ![]() 4 Gyr
ago. This event caused a new
episode of star formation in both the field and cluster population as
well as the formation of the LMC bar and Magellanic Stream. The
average metallicity of the Stream is [Fe/H]
4 Gyr
ago. This event caused a new
episode of star formation in both the field and cluster population as
well as the formation of the LMC bar and Magellanic Stream. The
average metallicity of the Stream is [Fe/H]
![]() dex (Wakker
2001),
suggesting a similar age to that of disc RGB and cluster
stars (Fig. 2).
Nidever et al. (2008)
argue for an
LMC origin of the Stream that is
dex (Wakker
2001),
suggesting a similar age to that of disc RGB and cluster
stars (Fig. 2).
Nidever et al. (2008)
argue for an
LMC origin of the Stream that is ![]() 2 Gyr old. This is
consistent
with ram-pressure gas stripping from the outer LMC disc due to a close
passage by the MW (Mastropietro 2008).
The new LMC orbit,
derived from the new proper motion (Kallivayalil et al. 2006a),
implies that the LMC passed perigalacticon
2 Gyr old. This is
consistent
with ram-pressure gas stripping from the outer LMC disc due to a close
passage by the MW (Mastropietro 2008).
The new LMC orbit,
derived from the new proper motion (Kallivayalil et al. 2006a),
implies that the LMC passed perigalacticon ![]() 1.78 Gyr ago. The
AGB gradient analysed here bears the signature of the star forming
episode, several Gyr ago, responsible for the formation of a thick
disc/halo component. The metal-rich RGB and the cluster stars are the
product of this recent episode while RR Lyrae stars, some RGB stars
and clusters result from the earliest episode.
1.78 Gyr ago. The
AGB gradient analysed here bears the signature of the star forming
episode, several Gyr ago, responsible for the formation of a thick
disc/halo component. The metal-rich RGB and the cluster stars are the
product of this recent episode while RR Lyrae stars, some RGB stars
and clusters result from the earliest episode.
3.2 The small magellanic cloud
3.2.1 Flat gradient or metal-rich ring?
In Cioni et al. (2006b)
it was recognized that the SMC bar region is surrounded by a metal-rich
ring with signatures of dynamical evolution, moving clumps, as a
function of time. This behaviour was un-explained and attributed to the
unknown geometry of the galaxy. A ring feature occurring at ![]() 2.5 Gyr
and persisting until
2.5 Gyr
and persisting until ![]() 1.6 Gyr
was found by Harris & Zaritsky (2004) in their SFH
analysis. Its age agrees with the age of AGB stars, 0.6-2 Gyr
old (Cioni et al. 2003).
Before and after, star formation occurred in the bar. In both studies,
the metallicity was derived from stellar evolution models in terms of Z
that represents the total heavy element abundance. A flat [Fe/H]
gradient, then, would be consistent with an
1.6 Gyr
was found by Harris & Zaritsky (2004) in their SFH
analysis. Its age agrees with the age of AGB stars, 0.6-2 Gyr
old (Cioni et al. 2003).
Before and after, star formation occurred in the bar. In both studies,
the metallicity was derived from stellar evolution models in terms of Z
that represents the total heavy element abundance. A flat [Fe/H]
gradient, then, would be consistent with an ![]() - or O-rich ring.
- or O-rich ring.
Very recently, Gonidakis et al. (2009) suggested that
the old
(K, M and faint C stars) stellar population rotates and resides on a
disc. Combining this information with a central region that started
to form stars ![]() 10 Gyr
ago it is possible that a metal rich ring
is the result of star formation induced by a rotating bar that
sustains gas in the outer parts of the galaxy. The rotation speed of
the bar may be responsible for an age gradient in the ring. The
presence of a bar is also consistent with a flat metallicity gradient
because it acts against a linearly decreasing gradient that would
instead be present in a bar-less disc galaxy (Martin & Roy
1994). A bar,
regardless of the overall structure of the
galaxy (spiral, spheroidal) always resides in a disc (Zaritsky
et al.
1994). On the
other hand, the investigation by Subramaniam &
Subramanian (2009)
shows that the SMC might host a bulge where
metal poor and metal rich stars coexist and trace a similar line of
sight depth. Although the two concepts do not exclude each other
(e.g. Galactic bulge), more evidence is needed to confirm these
sub-structures.
10 Gyr
ago it is possible that a metal rich ring
is the result of star formation induced by a rotating bar that
sustains gas in the outer parts of the galaxy. The rotation speed of
the bar may be responsible for an age gradient in the ring. The
presence of a bar is also consistent with a flat metallicity gradient
because it acts against a linearly decreasing gradient that would
instead be present in a bar-less disc galaxy (Martin & Roy
1994). A bar,
regardless of the overall structure of the
galaxy (spiral, spheroidal) always resides in a disc (Zaritsky
et al.
1994). On the
other hand, the investigation by Subramaniam &
Subramanian (2009)
shows that the SMC might host a bulge where
metal poor and metal rich stars coexist and trace a similar line of
sight depth. Although the two concepts do not exclude each other
(e.g. Galactic bulge), more evidence is needed to confirm these
sub-structures.
![\begin{figure}
\par\includegraphics[width=15.5cm,clip]{12138fg4.ps}
\end{figure}](/articles/aa/full_html/2009/42/aa12138-09/img74.png)
|
Figure 4:
Iron abundance in M33. Points are as in Fig. 2. The least square
fit line thorough all points (blue) and those with small uncertainties
(red) are indicated. Magenta points are confined within |
| Open with DEXTER | |
3.2.2 Halo and chemical enrichment
The data analysed here do not show evidence for a halo population traced by AGB stars. In the literature there is no evidence for such a halo, although there have been a limited number of studies suggesting that the extent of the SMC disc is greater than the more familiar optical appearance of the galaxy (e.g. Nöel & Gallart 2007). There is also an apparent lack of metallicity determinations in RR Lyrae stars, usually populating halos.
The [Fe/H] distribution of stellar clusters (Parisi
et al.
2009;
Da Costa & Hatzidimitriou 1998) also shows a
flat gradient. The cluster metallicities plotted in
Fig. 3
are those obtained after applying Eq. (A.1) to
the original data according to Appendix A. The correction might
not be appropriate for the Da Costa & Hatzidimitriou (1998)
values that rely on a different calibration but their agreement with
the Parisi et al. (2009)
measurements is independent of this
correction. Most clusters are of intermediate age, ![]() Gyr.
There are only three old clusters,
Gyr.
There are only three old clusters, ![]() 9 Gyr, similar to those
found in the metal poor outer disc/halo of the LMC but their
metallicity does not differ from that of younger clusters.
9 Gyr, similar to those
found in the metal poor outer disc/halo of the LMC but their
metallicity does not differ from that of younger clusters.
RGB metallicities by Carrera et al. (2008a) suggest a
steep
gradient, [Fe/H] ![]() with
rms= 0.10 (Fig. 3),
after applying Eq. (A.1)
to
those fields dominated by a stellar population younger than 5 Gyr.
The two fields that drive the steepness of the gradient might not be
representative of all position angles at similar de-projected radii
in the SMC and have very large error bars. A fit that excludes these
points is shallower, [Fe/H]
with
rms= 0.10 (Fig. 3),
after applying Eq. (A.1)
to
those fields dominated by a stellar population younger than 5 Gyr.
The two fields that drive the steepness of the gradient might not be
representative of all position angles at similar de-projected radii
in the SMC and have very large error bars. A fit that excludes these
points is shallower, [Fe/H]
![]() with rms = 0.08. The difference betwen the AGB gradient
and the gradient from young RGB stars implies a chemical enrichment of
0.04 dex kpc-1 Gyr-1
for an average age difference of 2 Gyr.
with rms = 0.08. The difference betwen the AGB gradient
and the gradient from young RGB stars implies a chemical enrichment of
0.04 dex kpc-1 Gyr-1
for an average age difference of 2 Gyr.
Idiart et al. (2007)
measured [O/H] in many PNe and converted
it into [Fe/H] using: [Fe/H]
![]() [O/H]. By de-projecting
the coordinates of each PNe as in this study, a gradient of
[O/H]. By de-projecting
the coordinates of each PNe as in this study, a gradient of
![]() dex is obtained
(Fig. 3).
These PNe are
mostly located within 5 kpc except one at 8 kpc. It is
interesting
to note that with the solar abundance calibration by Asplund
et al.
(2004) PNe are
metal-richer than AGB stars by
dex is obtained
(Fig. 3).
These PNe are
mostly located within 5 kpc except one at 8 kpc. It is
interesting
to note that with the solar abundance calibration by Asplund
et al.
(2004) PNe are
metal-richer than AGB stars by ![]() 0.3 dex
while with the Anders & Grevesse (1989) calibration
there is
good agreement. In the calculation of the PNe gradient I excluded
objects with depressed oxygen abundance and four others for which I
could not find coordinates. Figure 3 shows 39 PNe,
with
no distinction between type I and II, and their
metallicities are
consistent with a flat gradient, but it is somewhat steeper than that
obtained from AGB stars. AGB stars are the precursors of PNe and the
age difference between the two is on average negligible. Known PNe
are, however, biased towards the largest, most asymmetric and luminous
members, that have intermediate-mass stars progenitors (Jacoby
& De Marco 2002).
In addition, the initial metallicity derived
from the oxygen abundance of PNe is questionable (Leisy &
Dennefeld
2006) and it
would be more appropriate to use elements that
are not modified during the AGB evolution. In the SMC only a small
number of HII regions have been observed with the aim of determining
their chemical abundance (Dufour 1984).
Their [O/H] abundance
agrees with that measured in PNe and shows a small scatter,
0.08 dex. A larger sample of both HII regions and PNe
is needed before
relating them to the chemical enrichment of the galaxy. Reid &
Parker
(2006) have shown,
for the LMC, that many PNe await to be
discovered.
0.3 dex
while with the Anders & Grevesse (1989) calibration
there is
good agreement. In the calculation of the PNe gradient I excluded
objects with depressed oxygen abundance and four others for which I
could not find coordinates. Figure 3 shows 39 PNe,
with
no distinction between type I and II, and their
metallicities are
consistent with a flat gradient, but it is somewhat steeper than that
obtained from AGB stars. AGB stars are the precursors of PNe and the
age difference between the two is on average negligible. Known PNe
are, however, biased towards the largest, most asymmetric and luminous
members, that have intermediate-mass stars progenitors (Jacoby
& De Marco 2002).
In addition, the initial metallicity derived
from the oxygen abundance of PNe is questionable (Leisy &
Dennefeld
2006) and it
would be more appropriate to use elements that
are not modified during the AGB evolution. In the SMC only a small
number of HII regions have been observed with the aim of determining
their chemical abundance (Dufour 1984).
Their [O/H] abundance
agrees with that measured in PNe and shows a small scatter,
0.08 dex. A larger sample of both HII regions and PNe
is needed before
relating them to the chemical enrichment of the galaxy. Reid &
Parker
(2006) have shown,
for the LMC, that many PNe await to be
discovered.
3.2.3 Dynamics and the magellanic bridge
The age-metallicity relation as measured in different SMC fields
(Carrera et al. 2008a)
suggests that after an initial episode of
gas enrichment (![]() 7 Gyr
ago; Tosi et al. 2008),
the SMC
experienced a period of quiescent evolution before a new episode
7 Gyr
ago; Tosi et al. 2008),
the SMC
experienced a period of quiescent evolution before a new episode ![]() 3 Gyr
ago. At that time, the SMC had a close encounter with the LMC
(Piatti et al. 2005,
Bekki et al. 2004).
Was this
episode responsible for the formation of the Magellanic Bridge? The
present-day metallicity of the Bridge, from early-type stars, is
[Z/H]
3 Gyr
ago. At that time, the SMC had a close encounter with the LMC
(Piatti et al. 2005,
Bekki et al. 2004).
Was this
episode responsible for the formation of the Magellanic Bridge? The
present-day metallicity of the Bridge, from early-type stars, is
[Z/H]
![]() dex (Lehner
et al. 2008),
where Z includes
oxygen, nitrogen and argon abundances. This value is in good agreement
with the mean metallicity shown in Fig. 3, supporting an
SMC origin for the Bridge dating back a few Gyrs. The [Fe/H] found for
the LMC AGBs is similar to the SMC ones and it is not excluded that the
Bridge also has been influenced by LMC material at an earlier epoch.
dex (Lehner
et al. 2008),
where Z includes
oxygen, nitrogen and argon abundances. This value is in good agreement
with the mean metallicity shown in Fig. 3, supporting an
SMC origin for the Bridge dating back a few Gyrs. The [Fe/H] found for
the LMC AGBs is similar to the SMC ones and it is not excluded that the
Bridge also has been influenced by LMC material at an earlier epoch.
Star formation in the Bridge started 100-200 Myr ago
(Harris
2007), when the
LMC and the SMC had another close encounter
(Kallivayalil et al. 2006a).
This is the same time at which the
SMC tail, a tail of tidal origin located within the Bridge, was
stripped from the galaxy (Gordon et al. 2009). This means
that
if the Bridge material were stripped earlier, it did not form
stars. This scenario would support the very low metal abundances
derived by Dufton et al. (2008),
[Fe/H]
![]() dex from
B-type stars. This value is much lower than any of the values in
Fig. 3.
Note that the LMC metallicity at
dex from
B-type stars. This value is much lower than any of the values in
Fig. 3.
Note that the LMC metallicity at ![]() 5 kpc from
the centre, close to the break radius, corresponds to the metallicity
of the SMC. Was the LMC gas accreted from the SMC via the Bridge? In
the interaction process between the galaxies it is not unreasonable to
expect that the smaller galaxy will suffer more severe disruption in
its outer parts than the largest galaxy. On the other hand, the outer
parts of the largest galaxy will be more loosely bound than its
central parts and prone to disruption. A more systematic investigation
of the stellar population in the Bridge and in the outer region of the
Magellanic Clouds will provide a clearer view of the history of their
interaction.
5 kpc from
the centre, close to the break radius, corresponds to the metallicity
of the SMC. Was the LMC gas accreted from the SMC via the Bridge? In
the interaction process between the galaxies it is not unreasonable to
expect that the smaller galaxy will suffer more severe disruption in
its outer parts than the largest galaxy. On the other hand, the outer
parts of the largest galaxy will be more loosely bound than its
central parts and prone to disruption. A more systematic investigation
of the stellar population in the Bridge and in the outer region of the
Magellanic Clouds will provide a clearer view of the history of their
interaction.
3.3 M33
The metallicity distribution of M33 is bimodal and the dual gradient
suggests that the galaxy has two clearly distinct components, an inner
disc with a typical linearly decreasing gradient away from the centre,
up to ![]() 9 kpc,
and an outer disc/halo population that dominates
beyond this distance with a much shallower gradient. Barker
et al.
(2007)
tentatively conclude that beyond
9 kpc,
and an outer disc/halo population that dominates
beyond this distance with a much shallower gradient. Barker
et al.
(2007)
tentatively conclude that beyond ![]() (
(![]() 13 kpc)
the metallicity gradient flattens but the analysis supporting
this behaviour (Brooks et al. 2004, Davidge 2003) was highly
contaminated by foreground galactic stars and background
galaxies. Ferguson et al. (2007)
identified a break in the
surface brightness profile of M33 at
13 kpc)
the metallicity gradient flattens but the analysis supporting
this behaviour (Brooks et al. 2004, Davidge 2003) was highly
contaminated by foreground galactic stars and background
galaxies. Ferguson et al. (2007)
identified a break in the
surface brightness profile of M33 at ![]() 8 kpc that nicely
corresponds with the change in the slope of the AGB gradient,
suggesting the existence of two components. The analysis of stellar
clusters (Sarajedini et al. 2000,
Ma et al. 2004)
and RR
Lyrae stars (Sarajedini et al. 2006) support this
scenario. Some clusters de-project onto the inner disc gradient while
others do agree, within the errors, with an outer disc/halo
metallicity. Furthermore, Chandar et al. (2002), by analysing
the kinematics of clusters, concluded that old halo candidates have an
[Fe/H] range between -1.0 and -2.0. This is consistent both with
the plateau derived here beyond
8 kpc that nicely
corresponds with the change in the slope of the AGB gradient,
suggesting the existence of two components. The analysis of stellar
clusters (Sarajedini et al. 2000,
Ma et al. 2004)
and RR
Lyrae stars (Sarajedini et al. 2006) support this
scenario. Some clusters de-project onto the inner disc gradient while
others do agree, within the errors, with an outer disc/halo
metallicity. Furthermore, Chandar et al. (2002), by analysing
the kinematics of clusters, concluded that old halo candidates have an
[Fe/H] range between -1.0 and -2.0. This is consistent both with
the plateau derived here beyond ![]() 8 kpc and with the
metal-poor
peak of the metallicity distribution of the Galaxy's globular clusters
(Armandroff 1989).
8 kpc and with the
metal-poor
peak of the metallicity distribution of the Galaxy's globular clusters
(Armandroff 1989).
3.3.1 Chemical enrichment and dynamics
The RGB gradient corresponds to -0.07 dex kpc-1
(Kim et al.
2002; Tiede
et al. 2004;
Barker et al. 2007),
comparable with that derived from AGB stars. If no distinction is made
between inner disc and outer disc/halo AGB stars (Fig. 4),
a gradient of ![]() is obtained; this is
is obtained; this is ![]() 0.01 dex
shallower than the RGB gradient. Considering that AGB stars span a
large range of ages, this indicates that the galaxy did not experience
significant metal enrichment between several to a few Gyr ago. If AGB
stars were younger than the RGB stars, they would provide evidence for
a flattening of the metallicity gradient with time or viceversa. The
latter might explain the offset between the RGB and AGB gradients, but
it may also be influenced by the dispersion in the C/M-[Fe/H]
relation.
0.01 dex
shallower than the RGB gradient. Considering that AGB stars span a
large range of ages, this indicates that the galaxy did not experience
significant metal enrichment between several to a few Gyr ago. If AGB
stars were younger than the RGB stars, they would provide evidence for
a flattening of the metallicity gradient with time or viceversa. The
latter might explain the offset between the RGB and AGB gradients, but
it may also be influenced by the dispersion in the C/M-[Fe/H]
relation.
Recent measurements of the gradient from HII regions (Magrini
et al. 2007;
Rosolowsky & Simon 2008)
point to a flat
gradient, [O/H]
![]() dex kpc-1,
that produces a similar
trend in [Fe/H] using King (2000)
conversion. HII regions
trace the present-day star formation and the difference between their
gradient and that of the certainly older AGB stars indicates a
flattening of the metallicity gradient with time. Magrini
et al.
(2009) found
that HII regions and PNe follow the same [O/H]
gradient. On the one hand, galaxy chemical evolution models indicate a
steeper gradient for iron than for oxygen simply because iron comes
predominantly from slowly evolving SN type I that compared to SN type
II have not yet enriched the outer parts of galaxies. On the other
hand, the similarity between the HII regions and PNe gradients
may
suggest that the PNe sample (
dex kpc-1,
that produces a similar
trend in [Fe/H] using King (2000)
conversion. HII regions
trace the present-day star formation and the difference between their
gradient and that of the certainly older AGB stars indicates a
flattening of the metallicity gradient with time. Magrini
et al.
(2009) found
that HII regions and PNe follow the same [O/H]
gradient. On the one hand, galaxy chemical evolution models indicate a
steeper gradient for iron than for oxygen simply because iron comes
predominantly from slowly evolving SN type I that compared to SN type
II have not yet enriched the outer parts of galaxies. On the other
hand, the similarity between the HII regions and PNe gradients
may
suggest that the PNe sample (![]() 70 older
than 0.3 Gyr) is on
average younger than the AGB population (
70 older
than 0.3 Gyr) is on
average younger than the AGB population (![]() 14 000) in the disc.
14 000) in the disc.
Williams et al. (2009)
have shown that the age of the
population in the inner disc decreases radially contrary to the trend
in the outer disc (Barker et al. 2007; Cioni
et al.
2008a). This
provides evidence for an inside-out formation
scenario for the M33 disc also supported by simulations. How does the
metallicity gradient fit into this picture? Since the majority of the
stars near the centre of the disc had formed by z=1
and the bulk of
the stars farther out formed later (Williams et al. 2009),
more time was available to enrich the gas in the centre than in the
outer part; heavy elements are also found in the centre because the
potential is stronger. The peak of star formation responsible for
younger ages at about the truncation radius corresponds to ![]() 2 Gyr
(Williams et al. 2009;
Fig. 3). This suggests that AGB
stars formed at that time and at that location as a consequence of
accretion of metal poor gas, out of gas that was not enriched in iron
by previous star forming episodes, in agreement with a linearly
decreasing gradient throughout the inner disc region. These AGB stars
are, therefore, older than 2 Gyr.
2 Gyr
(Williams et al. 2009;
Fig. 3). This suggests that AGB
stars formed at that time and at that location as a consequence of
accretion of metal poor gas, out of gas that was not enriched in iron
by previous star forming episodes, in agreement with a linearly
decreasing gradient throughout the inner disc region. These AGB stars
are, therefore, older than 2 Gyr.
The galactic chemical evolution models for the formation of
the M33
disc by Magrini et al. (2007)
indicate a steeper metallicity
gradient in the centre, ![]() -0.11 dex kpc-1,
than in the outer
parts of the galaxy, according to a gas accretion model, with an
almost constant gas in-fall rate. The models by Chiappini
et al.
(2001), for the
MW, assume two main accretion episodes: the
first forming the halo/thick disc and the second forming the thin
disc. In their models the disc forms ``inside-out'', in agreement with
the Williams et al. (2009)
results. A similar picture was
deduced for the formation of the isolated spiral galaxy
NGC 300, a
member of the Sculptor group and very similar to M33, showing a
negative [Fe/H] gradient in the disc and a flat or slighly positive
gradient in the outer parts (Vlajic et al. 2009). The
alternative explanation populates the outer parts with stellar
migration, accounting for the strength of spiral waves (Roskar
et al. 2008;
Sellwood & Binney 2002).
-0.11 dex kpc-1,
than in the outer
parts of the galaxy, according to a gas accretion model, with an
almost constant gas in-fall rate. The models by Chiappini
et al.
(2001), for the
MW, assume two main accretion episodes: the
first forming the halo/thick disc and the second forming the thin
disc. In their models the disc forms ``inside-out'', in agreement with
the Williams et al. (2009)
results. A similar picture was
deduced for the formation of the isolated spiral galaxy
NGC 300, a
member of the Sculptor group and very similar to M33, showing a
negative [Fe/H] gradient in the disc and a flat or slighly positive
gradient in the outer parts (Vlajic et al. 2009). The
alternative explanation populates the outer parts with stellar
migration, accounting for the strength of spiral waves (Roskar
et al. 2008;
Sellwood & Binney 2002).
4 Conclusions
This paper derives the metallicity, [Fe/H], for a large sample AGB
stars in the Magellanic Clouds and M33 and investigates the spatial
gradient with respect to the structure and history of each galaxy as
well as other indicators. The values for iron abundance depend
strongly on the calibration of the ![]() -[Fe/H]
relation. The metallicity in this relation is that of the dominant
population of RGB stars that represents the closest approximation, or a
lower limit, to the metallicity of the AGB progenitors. The relation
provided by Battinelli & Demers (2005) has been revised
in this
study to: [Fe/H]
-[Fe/H]
relation. The metallicity in this relation is that of the dominant
population of RGB stars that represents the closest approximation, or a
lower limit, to the metallicity of the AGB progenitors. The relation
provided by Battinelli & Demers (2005) has been revised
in this
study to: [Fe/H] ![]() .
The
resulting gradients provide new constraints for theoretical models for
the formation and evolution of these galaxies, and for similar systems
where stars cannot yet be resolved.
.
The
resulting gradients provide new constraints for theoretical models for
the formation and evolution of these galaxies, and for similar systems
where stars cannot yet be resolved.
The metallicity of the LMC decreases away from the centre,
[Fe/H]
![]() .
This AGB
gradient is somewhat flatter than that derived from RR Lyrae stars,
.
This AGB
gradient is somewhat flatter than that derived from RR Lyrae stars,
![]() dex kpc-1,
and it is followed by metal-poor
stellar clusters and metal-poor RGB stars, supporting an old and
extended (up to 14 kpc) thick disc or halo population. Most
RGB
stars and stellar clusters are, however, younger and have a constant
metallicity, [Fe/H]
dex kpc-1,
and it is followed by metal-poor
stellar clusters and metal-poor RGB stars, supporting an old and
extended (up to 14 kpc) thick disc or halo population. Most
RGB
stars and stellar clusters are, however, younger and have a constant
metallicity, [Fe/H] ![]() dex.
They probably formed when the
LMC interacted with the MW and SMC a few Gyr ago along with the
formation of the LMC bar and of the Stream (Nidever et al.
2008). A
flattening of the gradient with time is consistent
with ``inside-out'' disc formation (Vlajic et al. 2009),
while a dual formation scenario for the halo and the disc reproduces
the AGB gradient (Chiappini et al. 2001).
dex.
They probably formed when the
LMC interacted with the MW and SMC a few Gyr ago along with the
formation of the LMC bar and of the Stream (Nidever et al.
2008). A
flattening of the gradient with time is consistent
with ``inside-out'' disc formation (Vlajic et al. 2009),
while a dual formation scenario for the halo and the disc reproduces
the AGB gradient (Chiappini et al. 2001).
The metallicity of the SMC is consistent with a flat
distribution. This result is sustained by different stellar
indicators: RGB stars, PNe and clusters regardless of their
age. Together with an [M/H]-rich ring (Cioni et al. 2006b; Harris
& Zaritsky 2004)
and a rotating old stellar population
residing on a disc (Gonidakis et al. 2009), they support
the
idea that gas shocked, during an encounter with the LMC ![]() 3 Gyr
ago, started to form stars in the outer parts of the galaxy, altering
the classical [Fe/H] gradient of a bar-less disc galaxy. Furthermore
an increase in the [
3 Gyr
ago, started to form stars in the outer parts of the galaxy, altering
the classical [Fe/H] gradient of a bar-less disc galaxy. Furthermore
an increase in the [![]() Fe]
ratio in the outermost regions of the
disc or a flat [Fe/H] gradient due to an equal timescale for disc
formation versus distance are also possible scenarios (Chiappini
et al. 2001).
The [Fe/H] abundance of the SMC agrees with the
present-day abundance in the Bridge.
Fe]
ratio in the outermost regions of the
disc or a flat [Fe/H] gradient due to an equal timescale for disc
formation versus distance are also possible scenarios (Chiappini
et al. 2001).
The [Fe/H] abundance of the SMC agrees with the
present-day abundance in the Bridge.
The M33 inner disc extends to ![]() 9 kpc, in agreement
with previous
findings, while the outer disc/halo population reaches
9 kpc, in agreement
with previous
findings, while the outer disc/halo population reaches ![]() 25 kpc.
The inner disc is characterised by a steep metallicity gradient, [Fe/H]
25 kpc.
The inner disc is characterised by a steep metallicity gradient, [Fe/H]
![]() ,
while in the outer regions it flattens to
,
while in the outer regions it flattens to ![]() 1.7 dex. The presence
of two distinct components agrees with an ``inside-out'' galaxy
formation scenario such as for the closely related
NGC 300 galaxy (Vlajic et al. 2009) and is
confirmed by Williams et al. (2009). The AGB
gradient is steeper than that from HII regions, supporting this
scenario.
1.7 dex. The presence
of two distinct components agrees with an ``inside-out'' galaxy
formation scenario such as for the closely related
NGC 300 galaxy (Vlajic et al. 2009) and is
confirmed by Williams et al. (2009). The AGB
gradient is steeper than that from HII regions, supporting this
scenario.
The Magellanic Clouds show a different but linked metallicity history influenced by their structure and dynamical interaction. It is easier to interpret the metallicity of M33 that has, instead, evolved in isolation. The observation of the outer disc/halo population of the Magellanic Clouds as traced here by AGB stars is not complete. Large data bases can be exploited to search for AGBs 8-20 kpc from the centre. There are also fewer studies of chemical abundances and kinematics in the SMC than in the LMC (van der Marel et al. 2008).
The upcoming VISTA survey of the Magellanic System (Cioni et al. 2008b) will provide new data to investigate the metallicity evolution as well as the SFH, extinction and structure across the system. The simultaneous VISTA hemisphere survey will cover the outermost regions of the system. These near-infrared surveys will provide targets for measuring abundances with current and future wide-field spectrographs.
AcknowledgementsI warmly thank Marina Rejkuba for a critical reading of the paper, and Sean Ryan, Ralf Napiwotzki and Janet Drew for interesting scientific discussions contributing to its development.
Appendix A: Ca II triplet metallicity correction
The study by Pompéia et al. (2008)
analyses the spectra of
59 field RGB stars deriving chemical abundances of iron, from both
FeI and FeII lines, and other ![]() elements. The authors indicate
no systematic error for [FeII/H] abundances but a systematic error of
elements. The authors indicate
no systematic error for [FeII/H] abundances but a systematic error of
![]() 0.1 dex
for [FeI/H] abundances. Figure A.1 shows the
comparison between [Fe/H] values from iron lines and from the
Ca II
triplet method; the data points are from their Table 2. The
least
square fit through these points corresponds to:
0.1 dex
for [FeI/H] abundances. Figure A.1 shows the
comparison between [Fe/H] values from iron lines and from the
Ca II
triplet method; the data points are from their Table 2. The
least
square fit through these points corresponds to:
where

|
Figure A.1: ( Top) Iron abundance differences derived from the Ca II triplet and direct observation of iron lines as a function of Ca II triplet values (Pompéia et al. 2008). The line is the least square fit through the data points. ( Bottom) Number distribution of iron abundances. |
| Open with DEXTER | |
Compared to Battaglia et al. (2008), who studied
RGB
metallicities in the Sculptor and Fornax dwarf spheroidal galaxies,
Fig. A.1
shows a strong gradient. These authors concluded
that Ca II triplet metallicities are overestimated by ![]() 0.1 dex
at [Fe/H] < -2.2 dex, underestimated by
0.1 dex
at [Fe/H] < -2.2 dex, underestimated by ![]() 0.1-0.2 dex
at
[Fe/H] > -1.2 dex and have no trend for [Fe/H] >
-0.8 dex in the
range -2.5 < [Fe/H] < - 0.5. Their RGB
stars are >8 Gyr old
(Sculptor) and 3-6 Gyr old (Fornax) while LMC RGB stars are
mostly
young (1-3 Gyr old). Here, Eq. (A.1) is applied only to
measurements for RGB stars younger than
0.1-0.2 dex
at
[Fe/H] > -1.2 dex and have no trend for [Fe/H] >
-0.8 dex in the
range -2.5 < [Fe/H] < - 0.5. Their RGB
stars are >8 Gyr old
(Sculptor) and 3-6 Gyr old (Fornax) while LMC RGB stars are
mostly
young (1-3 Gyr old). Here, Eq. (A.1) is applied only to
measurements for RGB stars younger than ![]() 5 Gyr. A different
SFH also implies a different Ca/Fe abundance, therefore, the
Ca II
triplet is a good proxy for [Fe/H] when the age of RGB stars
with
respect to the calibrating relation is appropriately considered (Pont
et al. 2004).
5 Gyr. A different
SFH also implies a different Ca/Fe abundance, therefore, the
Ca II
triplet is a good proxy for [Fe/H] when the age of RGB stars
with
respect to the calibrating relation is appropriately considered (Pont
et al. 2004).
Appendix B: C/M versus [Fe/H] calibration
Battinelli & Demers (2005) provide a calibration of the metallicity of galaxies versus the C/M ratio. The major uncertainty in their relation lies in the values of metallicity adopted from the literature. These values refer to RGB stars, except for IC 10 where [Fe/H] was converted from [O/H] in HII regions.
Table B.1: RGB metallicity and C/M ratio.
For most of the remaining galaxies, the metallicity was
estimated from
the colour of the RGB in (V-I)0
using the relation by Da Costa &
Armandroff (1990),
or Lee (1993),
defined at a
specific magnitudes below the TRGB. This method is sensitve to
metallicity but not to age, that does in fact represent the extent of
the RGB population. This section re-assesses the [Fe/H] versus C/M
calibration using updated metallicity measurements for a more
homogeneous population. Table B.1 lists the C/M0+
values from Battinelli & Demers (2005) and the
metallicities from different authors. The uncertainty in the
metallicity values is the dispersion, ![]() ,
corresponding to half the width of the RGB at the calibrating colour.
This quantity is a better indicator than the statistical uncertainty of
the range of ages for the RGB population within each galaxy.
,
corresponding to half the width of the RGB at the calibrating colour.
This quantity is a better indicator than the statistical uncertainty of
the range of ages for the RGB population within each galaxy.
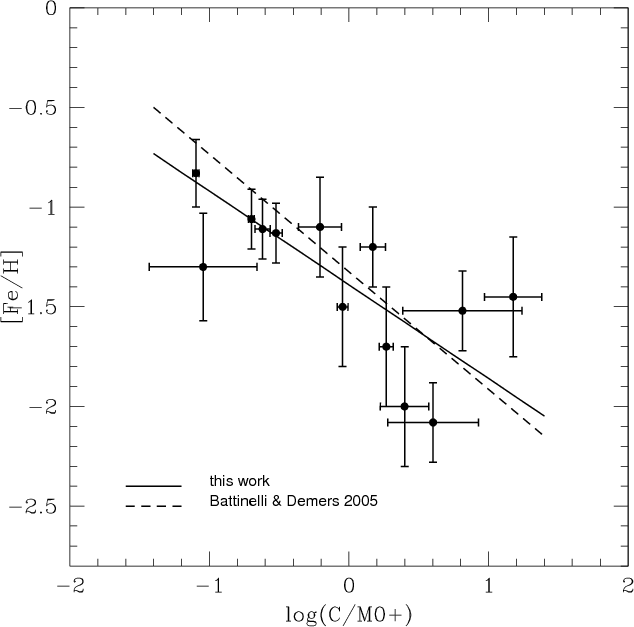
|
Figure B.1: Metallicity as a function of C/M ratio. Points and their weighted least square fit line (solid line) are for RGB stars as discussed in the text. The dashed line is from Battinelli & Demers (2005). |
| Open with DEXTER | |
The RGB parameters for the DDO 190 galaxy, well outside of the Local Group, were obtained by Battinelli & Demers (2006) for the C/M ratio, and Aparicio & Tikhonov (2000) for [Fe/H]. The [Fe/H] for NGC 3109 is the mean of the three values quoted in Battinelli & Demers (2005).
In the case of NGC 6822, the RGB colour gives a
metallicity 0.25 dex
lower. Battinelli & Demers (2005)
averaged this value with the
value obtained from the RGB slope in the near-IR domain. For
DDO 210, McConnachie et al. (2006b) obtained
[Fe/H] = -1.3 dex using the
RGB colour method and corresponding to an RGB population ![]() Gyr
old. This value is 0.6 dex higher than the value used by
Battinelli
& Demers (2005).
A difference of
Gyr
old. This value is 0.6 dex higher than the value used by
Battinelli
& Demers (2005).
A difference of ![]() 0.2 dex
is found for
NGC147, NGC 185 and NGC 205 by Butler &
Martínez-Delgado (2005)
who obtained a mean RGB metallicity of -1.11 dex and
-1.06, respectively.
0.2 dex
is found for
NGC147, NGC 185 and NGC 205 by Butler &
Martínez-Delgado (2005)
who obtained a mean RGB metallicity of -1.11 dex and
-1.06, respectively.
For IC 1613 the metallicity was derived from the SFH
resulting from
fitting colour-magnitude diagrams with synthetic diagrams produced
using stellar evolution models. These models provide metallicity in
terms of the total metallicity, Z, that when
converted to iron represents
an upper limit. The error in [Fe/H] given in Table B.1
coincides with the FWHM of the RGB colour from Bernard et al. (2007). A similar
study has been done recently in M31
resulting in [Fe/H] =-0.83 dex (Brown et al. 2008). This is a
mean value among fields 10-35 kpc from the galaxy centre
corresponding to a RGB population with a mean age of ![]() Gyr.
Gyr.
Among the metallicities used by Battinelli & Demers (2005), that of Leo I refers to spectroscopic iron lines observed in RGB stars. In the meantime there have been no other direct measures of iron lines in the current sample of Local Group galaxies, but several authors have derived iron from the observation of the Ca II triplet in RGB stars. These measurements are not included here because of two uncertainties: the assumption on the [Ca/Fe] abundance ratio, necessary to convert Ca II triplet abundances to iron, and the age of the RGB stars (Appendix A).
Summarizing, updating metallicities obtained from the colour
of the
RGB, including those of RGB populations derived from the SFH method
(IC 1613 only) and iron lines (Leo I only), and excluding
IC 10 gives
the following relation:
| (B.1) |
with
References
- Anders, E., & Grevesse, N. 1989, Geochim. Cosmochim. Acta, 53, 197 [NASA ADS] [CrossRef]
- Aparicio, A. 1994, ApJ, 347, L27 [NASA ADS] [CrossRef]
- Aparicio, A., & Tikhonov, N. 2000, AJ, 119, 2183 [NASA ADS] [CrossRef]
- Armandroff, T. E. 1989, AJ, 97, 375 [NASA ADS] [CrossRef]
- Asplund, M., Grevesse, N., Suval, A. J., et al. 2004, A&A, 417, 751 [NASA ADS] [CrossRef] [EDP Sciences]
- Barker, M. K., Sarajedini, A., Geisler, D., et al. 2007, AJ, 133, 1125 [NASA ADS] [CrossRef]
- Battaglia, G., Irwin, M., Tolstoy, E., et al. 2008, MNRAS, 383, 183
- Battinelli, P., & Demers, S. 2005, A&A, 434, 657 [NASA ADS] [CrossRef] [EDP Sciences]
- Battinelli, P., & Demers, S. 2006, A&A, 447, 473 [NASA ADS] [CrossRef] [EDP Sciences]
- Battinelli, P., & Demers, S. 2009, A&A, 493, 1075 [NASA ADS] [CrossRef] [EDP Sciences]
- Bekki, K., Couch, W. J., Beasley, M. A., et al. 2004, ApJ, 610, L93 [NASA ADS] [CrossRef]
- Bernard, E. J., Aparicio, A., Gallart, C., et al. 2007, AJ, 134, 1124 [NASA ADS] [CrossRef]
- Besla, G., Kallivayalil, N., Hernquist, L., et al. 2007, ApJ, 668, 949 [NASA ADS] [CrossRef]
- Borissova, J., Minniti, D., Rejkuba, M., et al. 2006, A&A, 460, 459 [NASA ADS] [CrossRef] [EDP Sciences]
- Brooks, R. S., Wilson, C. D., & Harris, W. E. 2004, AJ, 128, 237 [NASA ADS] [CrossRef]
- Brown, T. M., Beaton, M., Chiba, M., et al. 2008, ApJ, 685, L121 [NASA ADS] [CrossRef]
- Butler, D. J., & Martínez-Delgado, D. 2005, AJ, 129, 2217 [NASA ADS] [CrossRef]
- Carretta, E., & Gratton, R. G. 1997, A&AS, 121, 95 [NASA ADS] [CrossRef] [EDP Sciences]
- Carrera, R., Gallart, C., Hardy, E., et al. 2008a, AJ, 135, 836 [NASA ADS] [CrossRef]
- Carrera, R., Gallart, C., Aparicio, A., et al. 2008b, AJ, 136, 1039 [NASA ADS] [CrossRef]
- Chandar, R., Bianchi, L., Ford, H. C., et al. 2002, AJ, 564, 712 [NASA ADS] [CrossRef]
- Chiappini, C., Matteucci, F., & Romano, D. 2001, ApJ, 554, 1044 [NASA ADS] [CrossRef]
- Cioni, M.-R. L., & Habing, H. J. 2003, A&A, 402, 133 [NASA ADS] [CrossRef] [EDP Sciences]
- Cioni, M.-R. L., Habing, H. J., & Israel, F. P. 2000a, A&A, 358, L9 [NASA ADS]
- Cioni, M.-R. L., van der Marel, R. P., Loup, C., et al. 2000b, A&A, 359, 601 [NASA ADS]
- Cioni, M.-R. L., Marquette, J.-B., Loup, C., et al. 2001, A&A, 377, 945 [NASA ADS] [CrossRef] [EDP Sciences]
- Cioni, M.-R. L., Blommaert, J. A. D. L., Groenewegen, M. A. T., et al. 2003, A&A, 406, 51 [NASA ADS] [CrossRef] [EDP Sciences]
- Cioni, M.-R. L., Girardi, L., Marigo, P., et al. 2006a, A&A, 448, 77 [NASA ADS] [CrossRef] [EDP Sciences]
- Cioni, M.-R. L., Girardi, L., Marigo, P., et al. 2006b, A&A, 452, 195 [NASA ADS] [CrossRef] [EDP Sciences]
- Cioni, M.-R. L., Irwin, M., Ferguson, A. M. N., et al. 2008a, A&A, 487, 131 [NASA ADS] [CrossRef] [EDP Sciences]
- Cioni, M.-R. L., Bekki, K., Clementini, G., et al. 2008b, PASA, 25, 121 [NASA ADS]
- Cole, A. A., Smecker-Hane, T. A., & Gallagher, J. S. 2000, AJ, 120, 1808 [NASA ADS] [CrossRef]
- Cole, A. A., Tolstoy, E., Gallagher, J. S., et al. 2005, AJ, 129, 1465 [NASA ADS] [CrossRef]
- Da Costa, G. S., & Armandroff, T. E. 1990, AJ, 100, 162 [NASA ADS] [CrossRef]
- Da Costa, G. S., & Hatzidimitriou, D. 1998, AJ, 115, 1934 [NASA ADS] [CrossRef]
- Davidge, T. J. 2003, AJ, 125, 3046 [NASA ADS] [CrossRef]
- Dufour, R. J. 1984, Structure and evolution of the MC's, ed. S. van den Bergh, & K.S. de Boer, IAU Symp., 108, 353
- Dufton, P. L., Ryans, R. S. I., Thompson, H. M. A., et al. 2008, MNRAS, 385, 2261 [NASA ADS] [CrossRef]
- Edvardsson, B., Andersen, J., Gustafsson, B., et al. 1993, A&A, 275, 101 [NASA ADS]
- Ferguson, A., Irwin, M., Chapman, S., et al. 2007, Island Universes (ASSP Springer), 239
- Friedli, D., & Benz, W. 1995, A&A, 301, 649 [NASA ADS]
- Gallart, C., Aparicio, A., & Vilchez, J. M. 1996, AJ, 112, 1928 [NASA ADS] [CrossRef]
- Gallart, C., Stetson, P. B., Meschin, I., et al. 2008, ApJ, 682, L89 [NASA ADS] [CrossRef]
- Glass, I. S., & Schultheis, M. 2003, MNRAS, 345, 39 [NASA ADS] [CrossRef]
- Gonidakis, I., Livanou, E., Kontizas, E., et al. 2009, A&A, 496, 375 [NASA ADS] [CrossRef] [EDP Sciences]
- Gordon, K. D., Bot, C., Muller, E., et al. 2009, ApJ, 690, L76 [NASA ADS] [CrossRef]
- Grocholski, A. J., Cole, A. A., Sarajedini, A., et al. 2006, AJ, 132, 1630 [NASA ADS] [CrossRef]
- Grocholski, A. J., Sarajedini, A., Olsen, K., et al. 2007, AJ, 134, 680 [NASA ADS] [CrossRef]
- Harris, J. 2007, ApJ, 658, 345 [NASA ADS] [CrossRef]
- Harris, J., & Zaritsky, D. 2004, AJ, 127, 1531 [NASA ADS] [CrossRef]
- Hill, V., François, P., Spite, M., et al. 2000, A&A, 364, L19 [NASA ADS]
- Hughes, S. M. G., Wood, P. R., & Reid, N. 1991, AJ, 101, 1304 [NASA ADS] [CrossRef]
- Idiart, T. P., Maciel, W. J., & Costa, R. D. D. 2007, A&A, 472, 101 [NASA ADS] [CrossRef] [EDP Sciences]
- Jacoby, J. H., & De Marco, O. 2002, AJ, 123, 269 [NASA ADS] [CrossRef]
- Kallivayalil, N., van der Marel, R. P., & Alcock, C. 2006a, ApJ, 652, 121 [NASA ADS] [CrossRef]
- Kallivayalil, N., van der Marel, R. P., Alcock, C., et al. 2006b, ApJ, 638, 772 [NASA ADS] [CrossRef]
- Karachentsev, I., Aparicio, A., & Makarova, L. 1999, A&A, 352, 363 [NASA ADS]
- Kim, M., Kim, E., Lee, M. G. et al. 2002, AJ, 123, 244 [NASA ADS] [CrossRef]
- King, J. R. 2000, AJ, 120, 1056 [NASA ADS] [CrossRef]
- Lee, M. G. 1993, ApJ, 408, 409 [NASA ADS] [CrossRef]
- Lehner, R., Howk, J. C., Keenan, F. P., et al. 2008, ApJ, 678, 219 [NASA ADS] [CrossRef]
- Leisy, P., & Dennefled, M. 2006, A&A, 456, 451 [NASA ADS] [CrossRef] [EDP Sciences]
- Ma, J., Zhou, X., & Chen, J. 2004, A&A, 413, 563 [NASA ADS] [CrossRef] [EDP Sciences]
- Magrini, L., Corbelli, E., & Galli, D., 2007, A&A, 470, 843 [NASA ADS] [CrossRef] [EDP Sciences]
- Magrini, L., Stanghellini, L., & Villaver, E. 2009, ApJ, 696, 729 [NASA ADS] [CrossRef]
- Marigo, P., Girardi, L., & Bressan, A. 1999, A&A, 344, 123 [NASA ADS]
- Majewski, S. M., Frinchaboy, P. M., Peter, M., et al. 2005, AJ, 130, 2677 [NASA ADS] [CrossRef]
- Martin, P., & Roy, J.-R. 1994, ApJ, 424, 599 [NASA ADS] [CrossRef]
- Mastropietro, C. 2008, The Magellanic System: Stars, Gas, and Galaxies, ed. J.Th. van Loon, & J.M. Oliveira, IAU Symp., 256, 117
- McConnachie, A.W., Alan W., Chapman, S. C., et al., 2006a, ApJ, 647, L25 [NASA ADS] [CrossRef]
- McConnachie, A. W., Alan, W., Arimoto, N., et al. 2006b, MNRAS, 373, 715 [NASA ADS] [CrossRef]
- McLean, I. S., & Liu, T. 1996, ApJ, 456, 499 [NASA ADS] [CrossRef]
- Minniti, D., & Zijlstra, A. A. 1997, AJ, 114, 147 [NASA ADS] [CrossRef]
- Minniti, D., Borissova, J., Rejkuba, M., et al. 2003, Sci., 301, 1508 [NASA ADS] [CrossRef]
- Momany, Y., Held, E. V., Saviane, I., et al. 2002, A&A, 384, 393 [NASA ADS] [CrossRef] [EDP Sciences]
- Nidever, D. L., Majewski, S. R., & Butler, W. B. 2008, AJ, 679, 432 [NASA ADS] [CrossRef]
- Nöel, N. E., & Gallart, C. 2007, AJ, 665, L23 [NASA ADS] [CrossRef]
- Parisi, M. C., Grocholski, A. J., Geisler, D., et al. 2009, AJ, 138, 517 [NASA ADS] [CrossRef]
- Paturel, G., Petit, C., Prugniel, P., et al. 2003, A&A, 412, 45 [NASA ADS] [CrossRef] [EDP Sciences]
- Piatti, A. E., Sarajedini, A., Geisler, D., et al. 2005, MNRAS, 358, 1215 [NASA ADS] [CrossRef]
- Pompéia, L., Hill, V., Spite, M., et al. 2008, A&A, 480, 379 [NASA ADS] [CrossRef] [EDP Sciences]
- Pont, F., Zinn, R., Gallart, C., et al. 2004, AJ, 127, 840 [NASA ADS] [CrossRef]
- Reid, W. A., & Parker, Q. A. 2006, MNRAS, 373, 521 [NASA ADS] [CrossRef]
- Roskar, R., Debattista, V. P., Stinson, G. S., et al. 2008, ApJ, 675, L65 [NASA ADS] [CrossRef]
- Rosolowsky, E., & Simon, J. D. 2008, ApJ, 675, 1213 [NASA ADS] [CrossRef]
- Sarajedini, A., Geisler, D., Schommer, R., et al. 2000, AJ, 120, 2437 [NASA ADS] [CrossRef]
- Sarajedini, A., Barker, M. K., Geisler, D., et al. 2006, AJ, 132, 1361 [NASA ADS] [CrossRef]
- Schommer, R. A., Christian, C. A., Caldwell, N., et al. 1991, AJ, 101, 873 [NASA ADS] [CrossRef]
- Sellwood, J. A., & Binney, J. J. 2002, MNRAS, 336, 785 [NASA ADS] [CrossRef]
- Skillman, E. D., Tolstoy, E., Cole, A. A., et al. 2003, ApJ, 596, 253 [NASA ADS] [CrossRef]
- Soubiran, C., & Girard, P. 2005, A&A, 438, 139 [NASA ADS] [CrossRef] [EDP Sciences]
- Subramaniam, A. 2006, A&A, 449, 101 [NASA ADS] [CrossRef] [EDP Sciences]
- Subramanian, S., & Subramaniam, A. 2009, A&A, 496, 399 [NASA ADS] [CrossRef] [EDP Sciences]
- Tiede, G. P., Sarajedini, A., & Barker, M. K. 2004, AJ, 128, 224 [NASA ADS] [CrossRef]
- Tolstoy, E., Venn, K. A., Shetrone, M., et al. 2003, AJ, 125, 707 [NASA ADS] [CrossRef]
- Tosi, M., Gallagher, J., & Sabbi, E., et al. 2008, Low-Metallicity Star Formation: From the First Stars to Dwarf Galaxies, ed. L. K. Hunt, S. Madden, & R. Schneider, IAU Symp., 255, 381
- van der Marel, R. P. 2001, AJ, 122, 1827 [NASA ADS] [CrossRef]
- van der Marel, R. P., & Cioni, M.-R. L. 2001, AJ 122, 1807
- van der Marel, R. P., Alves, D. R., Hardy, E., et al. 2002, AJ, 124, 2639 [NASA ADS] [CrossRef]
- van der Marel, R. P., Kallivayalil, N., & Besla, G. 2008, The Magellanic System: Stars, Gas, and Galaxies, ed. J. Th. van Loon, & J. M. Oliveira, IAU Symp., 256, 81
- Vlajic, M., Bland-Hawthorn, J., & Freeman, K. C. 2009, ApJ, 697, 361 [NASA ADS] [CrossRef]
- Wakker, B. P. 2001, ApJS, 136, 463 [NASA ADS] [CrossRef]
- Williams, B. F., Dalcanton, J. J., Dolphin, A. E., et al. 2009, ApJ, 695, L15 [NASA ADS] [CrossRef]
- Zaritsky, D., Kennicutt, R. C., Jr., & Hucra, J. P. 1994, ApJ, 420, 87 [NASA ADS] [CrossRef]
- Zaritsky, D., Harris, J., Thompson, I. B., et al. 2002, AJ, 123, 855 [NASA ADS] [CrossRef]
- Zaritsky, D., Harris, J., Thompson, I. B., et al. 2004, AJ, 128, 1606 [NASA ADS] [CrossRef]
All Tables
Table 1: Parameters of galaxy structures.
Table 2: [Fe/H] abundances in the LMC.
Table B.1: RGB metallicity and C/M ratio.
All Figures
|
|
Figure 1:
Metallicity distribution for the LMC (dashed line), M33 (dotted line)
and the SMC (continuous line) normalized to their peak of 544, 115 and
50 stars, respectively. Shaded areas indicate [Fe/H] values
with |
| Open with DEXTER | |
| In the text | |
|
|
Figure 2:
Iron abundance in the LMC. Points referring to AGB abundances with |
| Open with DEXTER | |
| In the text | |
|
|
Figure 3: Iron abundance in the SMC. Points are as in Fig. 2. The least square fit lines through all points (red) and only those with small uncertainties (blue) are indicated. Filled circles with large error bars (light blue) and their least square fit line (yellow) refer to RGB stars by Carrera et al. (2008a) while filled circles with small error bars (dark blue) are for stellar clusters (Parisi et al. 2009; Da Costa & Hatzidimitriou 1998). Both measurements were corrected as explained in the text. Filled circles without error bars and the best fit line through them (green) are for PNe by Idiart et al. (2007). The colour figure is available electronically. |
| Open with DEXTER | |
| In the text | |
|
|
Figure 4:
Iron abundance in M33. Points are as in Fig. 2. The least square
fit line thorough all points (blue) and those with small uncertainties
(red) are indicated. Magenta points are confined within |
| Open with DEXTER | |
| In the text | |
|
|
Figure A.1: ( Top) Iron abundance differences derived from the Ca II triplet and direct observation of iron lines as a function of Ca II triplet values (Pompéia et al. 2008). The line is the least square fit through the data points. ( Bottom) Number distribution of iron abundances. |
| Open with DEXTER | |
| In the text | |
|
|
Figure B.1: Metallicity as a function of C/M ratio. Points and their weighted least square fit line (solid line) are for RGB stars as discussed in the text. The dashed line is from Battinelli & Demers (2005). |
| Open with DEXTER | |
| In the text | |
Copyright ESO 2009
Current usage metrics show cumulative count of Article Views (full-text article views including HTML views, PDF and ePub downloads, according to the available data) and Abstracts Views on Vision4Press platform.
Data correspond to usage on the plateform after 2015. The current usage metrics is available 48-96 hours after online publication and is updated daily on week days.
Initial download of the metrics may take a while.