| Issue |
A&A
Volume 506, Number 3, November II 2009
|
|
|---|---|---|
| Page(s) | 1229 - 1241 | |
| Section | Interstellar and circumstellar matter | |
| DOI | https://doi.org/10.1051/0004-6361/200911651 | |
| Published online | 03 September 2009 | |
A&A 506, 1229-1241 (2009)
Physical structure and water line spectrum predictions of the intermediate mass protostar OMC2-FIR4
N. Crimier - C. Ceccarelli - B. Lefloch - A. Faure
Laboratoire d'Astrophysique de l'Observatoire de Grenoble, BP 53, 38041 Grenoble Cedex 9, France
Received 12 January 2009 / Accepted 5 August 2009
Abstract
Aims. Intermediate mass (IM) stars are an important component of
our Galaxy, as they significantly contribute to the interstellar FUV
field and, consequently, play an important role in the energy balance
of the ISM. Despite their importance, very little is known about their
formation process and only a few studies have been devoted to
characterizing the first phases in the evolution of IM protostars. Here
we consider in great detail the case of the brightest and closest known
young IM protostar: FIR4 in the OMC2 component of the Orion molecular
cloud complex.
Methods. We analyzed the available continuum emission (maps and
SED) through one-dimensional dust radiative transfer calculations. We
ran large grids of models to find the envelope model that reproduces
the data best. The derived dust density and temperature profiles were
then used to compute the gas temperature profile, equating gas cooling
and heating terms across the envelope. Finally, we computed the water
line spectrum for various possible values of water abundance.
Results. The luminosity of FIR4 has been reevaluated to 1000 ![]() ,
making FIR4 definitively an IM protostar. The envelope surrounding FIR4 has a relatively shallow density power-law index,
,
making FIR4 definitively an IM protostar. The envelope surrounding FIR4 has a relatively shallow density power-law index, ![]() 0.6.
The most surprising result is that the gas and dust are thermally
decoupled in the interior of the envelope, where the dust ices
sublimate at 100 K. This has important consequences in the
interpretation of the line data. We provide the predictions for the
water spectrum, and discuss in detail the lines that will be observed
by the Herschel Space Observatory .
0.6.
The most surprising result is that the gas and dust are thermally
decoupled in the interior of the envelope, where the dust ices
sublimate at 100 K. This has important consequences in the
interpretation of the line data. We provide the predictions for the
water spectrum, and discuss in detail the lines that will be observed
by the Herschel Space Observatory .
Key words: ISM: abundances - ISM: molecules - stars: formation
1 Introduction
Intermediate mass (IM) stars, namely stars whose mass is in the 2 to 8In this context, the Orion Molecular Cloud 2 (OMC2), the closest known
region where high- to low-mass star formation is going on, represents a
precious laboratory for these studies. Observed first by
Gatley et al. (1974), OMC2 is located 15' (![]() 2 pc) north of the Orion
nebula. It has a filamentary structure, elongated in the direction
north-south, with active star formation concentrated in the central
and densest region, shielded from the UV radiation from newly formed
OB stars (Johnson et al. 1990). The mass of the cloud amounts to about 1500
2 pc) north of the Orion
nebula. It has a filamentary structure, elongated in the direction
north-south, with active star formation concentrated in the central
and densest region, shielded from the UV radiation from newly formed
OB stars (Johnson et al. 1990). The mass of the cloud amounts to about 1500 ![]() (Mezger et al. 1990). Several extensive studies have shown that
OMC2 is a rich star-forming region, which harbors several young
protostars, including several Class 0 candidates
(Ali & Depoy 1995; Johnstone & Bally 1999; Chini et al. 1997; Lis et al. 1998; Reipurth et al. 1999). Observations of
molecular lines have revealed several outflows emanating from the
young protostars in the region. Many studies have focused on the
outflows (e.g. Williams et al. 2003) and their impact on the cloud
(Wu et al. 2005; Aso et al. 2000). Only a few of these studies, in contrast, have
addressed the problem of the chemical structure of the forming stars
in OMC2 (Johnstone et al. 2003).
(Mezger et al. 1990). Several extensive studies have shown that
OMC2 is a rich star-forming region, which harbors several young
protostars, including several Class 0 candidates
(Ali & Depoy 1995; Johnstone & Bally 1999; Chini et al. 1997; Lis et al. 1998; Reipurth et al. 1999). Observations of
molecular lines have revealed several outflows emanating from the
young protostars in the region. Many studies have focused on the
outflows (e.g. Williams et al. 2003) and their impact on the cloud
(Wu et al. 2005; Aso et al. 2000). Only a few of these studies, in contrast, have
addressed the problem of the chemical structure of the forming stars
in OMC2 (Johnstone et al. 2003).
Among the several protostars in OMC2, FIR4 stands out as the brightest
submillimeter source (Mezger et al. 1990). Located almost at the center of
the cloud, FIR4 is also a bright IRAS source and a VLA radio source
(Reipurth et al. 1999). All these characteristics led Reipurth et al. (1999) to define
FIR4 as ``a bona fide Class 0 source''. The FIR4 integrated luminosity
was estimated to be about 400 ![]() and the envelope mass is about
35
and the envelope mass is about
35 ![]() .
Such values led to identifying FIR4 as anIM
protostar (Johnstone et al. 2003). Because of its vicinity and its
relatively bright molecular lines, FIR4 is an ideal source for a
detailed study of the physical and chemical structure of an IM
protostar. Existing dust continuum and molecular line observations
point to an envelope with at least two components: a warm component
with an average temperature of about 40 K and a colder component at
about 15 K (Mezger et al. 1990; Johnstone et al. 2003). Jørgensen et al. (2006) modeled the 850
.
Such values led to identifying FIR4 as anIM
protostar (Johnstone et al. 2003). Because of its vicinity and its
relatively bright molecular lines, FIR4 is an ideal source for a
detailed study of the physical and chemical structure of an IM
protostar. Existing dust continuum and molecular line observations
point to an envelope with at least two components: a warm component
with an average temperature of about 40 K and a colder component at
about 15 K (Mezger et al. 1990; Johnstone et al. 2003). Jørgensen et al. (2006) modeled the 850
![]() m SCUBA map towards this source to reconstruct its temperature
and density profiles. Based on the observed CO and H2CO millimeter
line emission, Jørgensen et al. (2006) conclude that the FIR4 envelope is
illuminated by an external FUV field amounting to
m SCUBA map towards this source to reconstruct its temperature
and density profiles. Based on the observed CO and H2CO millimeter
line emission, Jørgensen et al. (2006) conclude that the FIR4 envelope is
illuminated by an external FUV field amounting to
![]() times the interstellar FUV field. However, their interpretation
suffers from some contradictions emphasized by the same authors. For
example, such an intense FUV field would heat up the whole envelope to
a temperature over 25 K, the CO freezing temperature (Öberg et al. 2005), in contradiction to the measured average CO
abundance, ten times lower than the canonical value, which would
instead testify for a large CO-frozen region (Jørgensen et al. 2006). In
addition, the maps of the fine structure lines of the O and C+atoms, together with the CO 1-0 line, led Herrmann et al. (1997) to conclude that
the OMC2 region is illuminated by a FUV field 500 times the
interstellar field.
times the interstellar FUV field. However, their interpretation
suffers from some contradictions emphasized by the same authors. For
example, such an intense FUV field would heat up the whole envelope to
a temperature over 25 K, the CO freezing temperature (Öberg et al. 2005), in contradiction to the measured average CO
abundance, ten times lower than the canonical value, which would
instead testify for a large CO-frozen region (Jørgensen et al. 2006). In
addition, the maps of the fine structure lines of the O and C+atoms, together with the CO 1-0 line, led Herrmann et al. (1997) to conclude that
the OMC2 region is illuminated by a FUV field 500 times the
interstellar field.
Given this puzzling situation, we decided to again derive the temperature and density profiles of FIR4 by taking more data into account than those considered by Jørgensen et al. (2006) (Sect. 2). Using the derived dust temperature and density profiles, we then computed the gas temperature profile by equating the heating and cooling terms across the envelope (Sect. 3). As shown by several authors (e.g. Doty & Neufeld 1997; Ceccarelli et al. 1996), the gas cooling in protostellar envelopes is dominated by the emission from the rotational lines of CO and, more important, H2O and the fine structure lines of OI. Actually, water is a key molecule in the gas thermal balance for two reasons. First, in the warm regions where the grain mantles sublimate, it is the most abundant molecule; second, given its relatively large dipole moment, water is a very powerful line emitter, hence a very powerful gas coolant. Given its major role in the prediction of the gas temperature profile, we discuss the dependence of the derived gas temperature on the assumed water abundance profile, which is poorly known. Not surprisingly, FIR4 is in fact one of the few sources where the full spectrum between 50 and 2000 GHz is planned to be observed at high spectral resolution with the Heterodyne Instrument for the Far Infrared (HIFI) onboard Herschel (http://herschel.esac.esa.int/), to be launched in 2009. HSO, and specifically the high resolution interferometer HIFI, will allow to observe the water lines in the 500 to 2000 GHz range with unprecedented spectral and spatial resolution. Motivated by the Herschel mission, we report the predicted water line spectrum for the different assumed water abundance profiles, and discuss the observability by HIFI and PACS (Sect. 4). Section 5 concludes the article.
2 Dust density and temperature profiles
In this section, we derive the dust density and temperature profiles
by modeling the 350, 450 and 850 ![]() m maps of the region, plus the
Spectral Energy Distribution (SED) from the millimeter to the
Mid-Infrared (MIR) wavelength range. We first describe the
observations we used in our analysis (Sect. 2.1),
then the modeling (Sect. 2.2), and the result
of the modeling (Sect. 2.3).
m maps of the region, plus the
Spectral Energy Distribution (SED) from the millimeter to the
Mid-Infrared (MIR) wavelength range. We first describe the
observations we used in our analysis (Sect. 2.1),
then the modeling (Sect. 2.2), and the result
of the modeling (Sect. 2.3).
2.1 Continuum emission: observational data
In our analysis, we used the maps of the continuum emission at 850, 450,
and 350 ![]() m obtained at JCMT and CSO, respectively. In addition, we
take into account the Spectral Energy Distribution (SED) of FIR4 from
24 to 850
m obtained at JCMT and CSO, respectively. In addition, we
take into account the Spectral Energy Distribution (SED) of FIR4 from
24 to 850 ![]() m obtained considering also the IRAS and Spitzer
observations.
m obtained considering also the IRAS and Spitzer
observations.
a) 850, 450, and 350 ![]() m maps
m maps
We retrieved the 450 and 850 ![]() m maps obtained by Johnstone & Bally (1999)
at the 15 m James Clerk Maxwell Telescope (JCMT) with the
focal-plane instrument SCUBA (Submillimeter Common-User Bolometer
Array). The spatial resolution of the maps is 7.5'', and 14.8'' at
450, and 850
m maps obtained by Johnstone & Bally (1999)
at the 15 m James Clerk Maxwell Telescope (JCMT) with the
focal-plane instrument SCUBA (Submillimeter Common-User Bolometer
Array). The spatial resolution of the maps is 7.5'', and 14.8'' at
450, and 850 ![]() m, respectively. The calibration uncertainty and
noise levels are estimated by those authors
m, respectively. The calibration uncertainty and
noise levels are estimated by those authors
![]() 10% and 0.04 Jy beam-1 at 850
10% and 0.04 Jy beam-1 at 850 ![]() m, and
m, and
![]() 30% and 0.3 Jy
beam-1 at 450
30% and 0.3 Jy
beam-1 at 450 ![]() m, respectively. The 350
m, respectively. The 350 ![]() m map was
obtained by Lis et al. (1998) at the 10.4 m telescope of the Caltech
Submillimeter Observatory (CSO). The instrument used was the bolometer
camera SHARC. The resolution of the map is 12''. The calibration
uncertainty has been evaluated
m map was
obtained by Lis et al. (1998) at the 10.4 m telescope of the Caltech
Submillimeter Observatory (CSO). The instrument used was the bolometer
camera SHARC. The resolution of the map is 12''. The calibration
uncertainty has been evaluated ![]() 25%-30%. The three maps are
reported in Fig. 1.
25%-30%. The three maps are
reported in Fig. 1.
![\begin{figure}
\par\rotatebox{270}{\includegraphics[width=9cm]{11651f01.ps}}
\end{figure}](/articles/aa/full_html/2009/42/aa11651-09/img26.png)
|
Figure 1:
Continuum emission maps around OMC2-FIR4 at 850 |
| Open with DEXTER | |
![\begin{figure}
\par\includegraphics[width=13.8cm,clip]{11651f02.eps}
\end{figure}](/articles/aa/full_html/2009/42/aa11651-09/img27.png)
|
Figure 2:
Observed brightness profiles at 350 ( upper left panel), 450
( upper right panel), 850 |
| Open with DEXTER | |
b) SED
The SED points at 850, 450 and 350 ![]() m, shown in Fig. 2,
were obtained by integrating the continuum emission over the envelope. We
attributed an uncertainty of
m, shown in Fig. 2,
were obtained by integrating the continuum emission over the envelope. We
attributed an uncertainty of ![]() 30% to them to account for the
uncertainty in the envelope size. We also considered the IRAS fluxes
at 60 and 100
30% to them to account for the
uncertainty in the envelope size. We also considered the IRAS fluxes
at 60 and 100 ![]() m, respectively, extracted from the IRAS maps at
these wavelengths. The fluxes were evaluated with the
method previously employed for the maps at 850, 450, and 350
m, respectively, extracted from the IRAS maps at
these wavelengths. The fluxes were evaluated with the
method previously employed for the maps at 850, 450, and 350 ![]() m,
namely excluding the same regions (dashed regions in Fig. 1)
to limit the contamination by FIR3 and FIR5 and integrating over the
rings. We also subtracted the cloud contribution, estimated to be
m,
namely excluding the same regions (dashed regions in Fig. 1)
to limit the contamination by FIR3 and FIR5 and integrating over the
rings. We also subtracted the cloud contribution, estimated to be
![]() 0.06 and
0.06 and ![]() 0.07 Jy arcsec-2 at 60 and 100
0.07 Jy arcsec-2 at 60 and 100 ![]() m,
respectively. To account for the possible contamination of FIR3 and
FIR5 due to the large beam of IRAS and the non-sphericity of the
source, we took an uncertainty of 50% on the fluxes. Finally, we
also considered the integrated flux at 24
m,
respectively. To account for the possible contamination of FIR3 and
FIR5 due to the large beam of IRAS and the non-sphericity of the
source, we took an uncertainty of 50% on the fluxes. Finally, we
also considered the integrated flux at 24 ![]() m extracted from the
Spitzer Space Telescope's Multiband Imaging Photometer (MIPS) maps. To
this end, we retrieved the observations from the Spitzer Science
archive (http://ssc.spitzer.caltech.edu/archanaly/). The
observations were obtained the 6th October 2006 as part of the program
``Infrared Properties of Edge-on Young Stellar Object Disks'' (AOR:
30765, PI: Karl Stapelfeldt). The data reduction was performed using
the pipeline S16.0.1. The flux, (
m extracted from the
Spitzer Space Telescope's Multiband Imaging Photometer (MIPS) maps. To
this end, we retrieved the observations from the Spitzer Science
archive (http://ssc.spitzer.caltech.edu/archanaly/). The
observations were obtained the 6th October 2006 as part of the program
``Infrared Properties of Edge-on Young Stellar Object Disks'' (AOR:
30765, PI: Karl Stapelfeldt). The data reduction was performed using
the pipeline S16.0.1. The flux, (
![]() Jy), in Fig. 2
was obtained by integration over a 15'' radius.
Jy), in Fig. 2
was obtained by integration over a 15'' radius.
2.2 Continuum emission: modeling
To derive the dust physical structure, namely the dust temperature and
density profiles, we used the 1D radiative transfer code DUSTY
(Ivezic & Elitzur 1997). Briefly, giving as input the temperature of the
central object and a dust density profile, DUSTY self-consistently computes
the dust temperature profile and the dust
emission. The comparison between the computed 350, 450, 850 ![]() m
brightness profiles (namely the brightness versus the distance from
the center of the envelope) and SED with the observed profiles and SED
(see previous paragraph) makes it possible to constrain the density
profile and, consequently, the temperature profile of the envelope.
m
brightness profiles (namely the brightness versus the distance from
the center of the envelope) and SED with the observed profiles and SED
(see previous paragraph) makes it possible to constrain the density
profile and, consequently, the temperature profile of the envelope.
To be compared with the observations, the theoretical emission is
convolved with the beam pattern of the telescope. Following the
recommendations for the relevant telescope, the beam is assumed to be
a combination of Gaussian curves: at 850 ![]() m, we use HPBWs of
14.5'', 60'', and 120'', with amplitudes of 0.976, 0.022, and 0.002,
respectively; at 450
m, we use HPBWs of
14.5'', 60'', and 120'', with amplitudes of 0.976, 0.022, and 0.002,
respectively; at 450 ![]() m, the HPBWs are 8'', 30'', and 120''with amplitude ratios of 0.934, 0.06, and 0.006, respectively
(Sandell & Weintraub 2001); at 350
m, the HPBWs are 8'', 30'', and 120''with amplitude ratios of 0.934, 0.06, and 0.006, respectively
(Sandell & Weintraub 2001); at 350 ![]() m, we use HPBWs of 12'' and 22'', with
amplitude ratios of 0.7, 0.3, respectively (Hunter et al. 1996).
m, we use HPBWs of 12'' and 22'', with
amplitude ratios of 0.7, 0.3, respectively (Hunter et al. 1996).
We assumed that the envelope density follows a power-law,
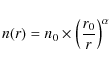
where the power-law index,
In summary, the output of DUSTY depends on ![]() ,
n0,
,
n0,
![]() ,
and
,
and
![]() .
In practice, the DUSTY input parameters are the power-law
index,
.
In practice, the DUSTY input parameters are the power-law
index, ![]() ,
the optical thickness at 100
,
the optical thickness at 100 ![]() m,
m,
![]() ,
the ratio between the inner and outer radius, Y(=
,
the ratio between the inner and outer radius, Y(=
![]() /
/
![]() ), and the temperature at the inner radius
), and the temperature at the inner radius
![]() .
The optical thickness is, in turn, proportional to the dust
column density, which depends on n0 and the physical thickness of
the envelope. Note that, since the beam of the available maps are
relatively large (
.
The optical thickness is, in turn, proportional to the dust
column density, which depends on n0 and the physical thickness of
the envelope. Note that, since the beam of the available maps are
relatively large (![]() 7.5'' which corresponds to a linear length of
7.5'' which corresponds to a linear length of
![]() 3300 AU), the inner region of the envelope is relatively
unconstrained by the available observational data. In practice, we
obtain a lower limit to
3300 AU), the inner region of the envelope is relatively
unconstrained by the available observational data. In practice, we
obtain a lower limit to
![]() of 300 K: any higher value would give
similar results. Finally, as explained in Ivezic & Elitzur (1997), DUSTY gives
scaleless results (which makes it very powerful because the same grid
of models can be applied to different sources). This means that, to
compare the DUSTY output with actual observations, it is necessary to
scale the output by the source bolometric luminosity
of 300 K: any higher value would give
similar results. Finally, as explained in Ivezic & Elitzur (1997), DUSTY gives
scaleless results (which makes it very powerful because the same grid
of models can be applied to different sources). This means that, to
compare the DUSTY output with actual observations, it is necessary to
scale the output by the source bolometric luminosity
![]() and the
distance. Note that the bolometric luminosity is in fact estimated by
integrating the emission over the full spectrum. By definition, this
can only be done when the entire SED is known. This is exactly one of
the outputs of the modeling, we re-evaluated the luminosity of FIR4
iteratively from the best-fit model, by minimizing the
and the
distance. Note that the bolometric luminosity is in fact estimated by
integrating the emission over the full spectrum. By definition, this
can only be done when the entire SED is known. This is exactly one of
the outputs of the modeling, we re-evaluated the luminosity of FIR4
iteratively from the best-fit model, by minimizing the
![]()
![]() . We anticipate here that the new value is 1000 rather than 400
. We anticipate here that the new value is 1000 rather than 400 ![]() ,
where we assumed the most recent estimation of the
distance, namely
(
,
where we assumed the most recent estimation of the
distance, namely
(
![]() )
pc (Hirota et al. 2007).
)
pc (Hirota et al. 2007).
We ran a grid of models to cover the parameter space as reported in
Table 1. The same grid of models were run for four
values of the illuminating FUV field: G0 = 1, 10, 100 and 1000.
In all cases, we used the Inter-Stellar Radiation Field (ISRF)
constructed by Evans et al. (2001): combination of the radiation field
introduced by Black (1994) with that of Draine (1978). Note that,
since DUSTY makes the assumption of isotropic scattering, the computed
MIR emission is largely overestimated in the presence of strong
external fields (Elitzur, private communication). To solve this
problem, we followed the suggestion by Young & Evans (2005) to neglect the
scattering, artificially putting it to zero.
The best-fit model has been found by minimizing the ![]() with an
iterated two-step procedure. First, we use the observed brightness
profiles at 350, 450, and 850
with an
iterated two-step procedure. First, we use the observed brightness
profiles at 350, 450, and 850 ![]() m to constrain
m to constrain ![]() and Y,
assuming a value for
and Y,
assuming a value for
![]() .
Second, we constrain the
optical thickness
.
Second, we constrain the
optical thickness
![]() by comparing the computed and
observed SED, assuming the
by comparing the computed and
observed SED, assuming the ![]() and Y of the previous step. The
new
and Y of the previous step. The
new
![]() is used for a new iteration and so on. In practice,
the iteration converges in two steps. This is because the normalized
brightness profiles very weakly depend on
is used for a new iteration and so on. In practice,
the iteration converges in two steps. This is because the normalized
brightness profiles very weakly depend on
![]() ,
while they
very much depend on the sizes of the envelope and on the slope of the
density profile (see also Jørgensen et al. 2002 and Schöier et al. 2002). In
contrast, the optical thickness depends mostly on the
absolute column density of the envelope, constrained by the SED.
,
while they
very much depend on the sizes of the envelope and on the slope of the
density profile (see also Jørgensen et al. 2002 and Schöier et al. 2002). In
contrast, the optical thickness depends mostly on the
absolute column density of the envelope, constrained by the SED.
2.3 Results
Table 1: Range of the input parameters to DUSTY covered in the present study.
Table 2:
best-fit parameters for the case G0 = 1. Note that
![]() where
where ![]() is the number of degrees of
freedom.
is the number of degrees of
freedom.
![\begin{figure}
\par\includegraphics[width=14cm,clip]{11651f03.eps}
\end{figure}](/articles/aa/full_html/2009/42/aa11651-09/img37.png)
|
Figure 3:
|
| Open with DEXTER | |
We run four grids of models, as discussed separately below: a)
with a standard illumination FUV field (G0 = 1) and b) with a
10, 100, 1000 times enhanced field (
G0=10, 100, 1000) (see
Introduction). In paragraph c), we also discuss why larger G0 was not considered, and in paragraph d) we summarize the results.
a) G0=1
Table 2 presents the set of parameters ![]() , Y, and
, Y, and
![]() ,
which reproduce the observations
assuming G0 = 1 better. Figure 2 shows the relevant derived
brightness profiles and SED against the observed ones. Figure 3 shows the
,
which reproduce the observations
assuming G0 = 1 better. Figure 2 shows the relevant derived
brightness profiles and SED against the observed ones. Figure 3 shows the ![]() contours plots obtained by
considering separately the brightness profiles at 350, 450, and 850
contours plots obtained by
considering separately the brightness profiles at 350, 450, and 850 ![]() m, and by combining the three profiles. Figure 4 shows the
m, and by combining the three profiles. Figure 4 shows the ![]() dependence on the
dependence on the
![]() parameter.
parameter.
The three
![]() ,
,
![]() ,
and
,
and
![]() contour plots point to a value of Y around 100-200. Conversely, the
contour plots point to a value of Y around 100-200. Conversely, the
![]() and
and
![]() contour plots constraint
contour plots constraint
![]() to a lower value than 1, around 0.5-0.6, whereas the
to a lower value than 1, around 0.5-0.6, whereas the
![]() would instead indicate a higher value for
would instead indicate a higher value for ![]() ,
although the value 0.6 is still acceptable. Note that the solution
found by Jørgensen et al. (2006) relies on the 850
,
although the value 0.6 is still acceptable. Note that the solution
found by Jørgensen et al. (2006) relies on the 850 ![]() m profile alone, so it
gives a high
m profile alone, so it
gives a high ![]() value, consistent with our
value, consistent with our
![]() plot. The
plot. The
![]() plot
(Fig. 4) points to a value of
plot
(Fig. 4) points to a value of
![]() of 0.6. In
minimizing the
of 0.6. In
minimizing the
![]() ,
we varied the source luminosity
from 400 to 1500
,
we varied the source luminosity
from 400 to 1500 ![]() .
The best-fit is
obtained for a source luminosity equal to 1000
.
The best-fit is
obtained for a source luminosity equal to 1000 ![]() .
.
b)
G0 = 10, 100, 1000
The best-fit values of ![]() and Y for cases of an enhanced
illumination UV field are presented in Fig. 5. The first thing to notice is that the
and Y for cases of an enhanced
illumination UV field are presented in Fig. 5. The first thing to notice is that the
![]() does not
change appreciably for G0 equal to 1, 10, 100, or 1000: the minimum
does not
change appreciably for G0 equal to 1, 10, 100, or 1000: the minimum
![]() value is 1.24, 1.23, 1.19, and 1.20 for
G0 = 1, 10, 100, and 1000, respectively. In other words, the available
continuum observations, both the profiles and the SED, cannot
distinguish which of the four models is better. Furthermore,
Fig. 5 shows that the
value is 1.24, 1.23, 1.19, and 1.20 for
G0 = 1, 10, 100, and 1000, respectively. In other words, the available
continuum observations, both the profiles and the SED, cannot
distinguish which of the four models is better. Furthermore,
Fig. 5 shows that the
![]() contour
plots point to the same Y and
contour
plots point to the same Y and ![]() values. Similarly, the
values. Similarly, the
![]() value is 0.6 for the four cases
G0 = 1, 10, 100, and
1000. The situation is illustrated in Fig. 2, where the best
fit predictions are compared to the observations for the two cases
G0 = 1 and 1000. Both models reproduce the observations fairly well,
as is implicit in the best-
value is 0.6 for the four cases
G0 = 1, 10, 100, and
1000. The situation is illustrated in Fig. 2, where the best
fit predictions are compared to the observations for the two cases
G0 = 1 and 1000. Both models reproduce the observations fairly well,
as is implicit in the best-![]() similar values. However, note that
the
G0 = 1000 case predicts slightly larger fluxes, due to the
enhanced temperature at the border of the envelope.
similar values. However, note that
the
G0 = 1000 case predicts slightly larger fluxes, due to the
enhanced temperature at the border of the envelope.
![\begin{figure}
\par\includegraphics[width=8cm,clip]{11651f04.eps}
\end{figure}](/articles/aa/full_html/2009/42/aa11651-09/img44.png)
|
Figure 4:
|
| Open with DEXTER | |
![\begin{figure}
\par\rotatebox{90}{\includegraphics[width=5.8cm]{11651f05.ps}}\in...
...1f07.ps}}\rotatebox{90}{\includegraphics[width=5.8cm]{11651f08.ps}}
\end{figure}](/articles/aa/full_html/2009/42/aa11651-09/img45.png)
|
Figure 5:
|
| Open with DEXTER | |
c) larger G0
We did not explore the case of larger G0 in detail for three
reasons. The first one is that previous line observations have shown
that the FUV field in the OMC2 region is ``only'' 500 times the
interstellar field. Indeed, Herrmann et al. (1997) mapped the OMC-2 cloud in
the CII-157 ![]() m, OI-63 and -146
m, OI-63 and -146 ![]() m lines with the
spectrometer FIFI onboard the Kuiper Airborne Observatory. They
detected extended emission associated with the Photo-Dissociation
Region (PDR) enveloping the whole OMC-2 molecular cloud. These
authors concluded that OMC-2 is illuminated by a FUV field whose
intensity is G0
m lines with the
spectrometer FIFI onboard the Kuiper Airborne Observatory. They
detected extended emission associated with the Photo-Dissociation
Region (PDR) enveloping the whole OMC-2 molecular cloud. These
authors concluded that OMC-2 is illuminated by a FUV field whose
intensity is G0 ![]() 500. Note that this is the FUV field
impinging on the cloud, then the effective G0 seen by the FIR4
envelope is probably lower than this. The second reason is that
varying G0 from 1 to 103 does not improve the
500. Note that this is the FUV field
impinging on the cloud, then the effective G0 seen by the FIR4
envelope is probably lower than this. The second reason is that
varying G0 from 1 to 103 does not improve the ![]() value. The third reason is that the
G0 = 104 case suffers from
severe convergence problems, and it was not possible to compute enough
runs for a meaningful
value. The third reason is that the
G0 = 104 case suffers from
severe convergence problems, and it was not possible to compute enough
runs for a meaningful ![]() analysis.
analysis.
d) Summary of the adopted solution
Table 3 summarizes the value of the best
fit parameters, obtained by considering all the profiles and the SED
![]() contour plots and assuming the G0 = 1 case. Some relevant
physical quantities are quoted in the same table. Figure 6
shows the dust density and temperature profiles of the best-fit
models with G0 = 1 and 1000, respectively. Note that the dust
temperature in the skin of the envelope is higher by
contour plots and assuming the G0 = 1 case. Some relevant
physical quantities are quoted in the same table. Figure 6
shows the dust density and temperature profiles of the best-fit
models with G0 = 1 and 1000, respectively. Note that the dust
temperature in the skin of the envelope is higher by ![]() 20-30 K
in the case
G0 = 1000 with respect to the G0 = 1 case. This
increase concerns a relatively small region, of a few thousand
AU. Jørgensen et al. (2006) found a larger warm region, of about
104 AU, because of the steeper adopted density distribution
(
20-30 K
in the case
G0 = 1000 with respect to the G0 = 1 case. This
increase concerns a relatively small region, of a few thousand
AU. Jørgensen et al. (2006) found a larger warm region, of about
104 AU, because of the steeper adopted density distribution
(
![]() ): in this case, the FUV photons can penetrate deeper
into the envelope.
): in this case, the FUV photons can penetrate deeper
into the envelope.
3 Gas temperature profile
3.1 Model description
Ceccarelli et al. (1996), Doty & Neufeld (1997), and Maret et al. (2002) have shown that the gas is thermally decoupled from dust in the inner regions of low- and high-mass protostellar envelopes. The reason for that is the large water abundance in the gas phase caused by the sublimation of the grain mantles. The same phenomenon may occur in the envelopes of IM protostars, so we explicitly computed the gas temperature profile of the envelope surrounding FIR4. For that we explicitly computed the equilibrium temperature by equating the gas cooling and heating terms at each radius. Following the method described in Ceccarelli et al. (1996), we considered heating from the gas compression (due to the collapse), dust-gas collisions, and photo-pumping of H2O and CO molecules by the IR photons emitted by the warm dust close to the centerTable 3: Summary of the dust radiative transfer analysis of OMC2-FIR4.
Table 4: The different run models.
![\begin{figure}
\par\includegraphics[width=8cm,clip]{11651f09.eps}\vspace*{2mm}
\includegraphics[width=8cm,clip]{11651f10.eps}
\end{figure}](/articles/aa/full_html/2009/42/aa11651-09/img72.png)
|
Figure 6: Dust temperature ( upper panel) and H2 density ( lower panel) profiles from the best-fit obtained in the two cases G0=1 and 1000. The plain line and the dotted line represent the cases G0 = 1 and 1000, respectively. |
| Open with DEXTER | |
To compute the cooling from the lines we used the code described in
Ceccarelli et al. (2003,1996) and Parise et al. (2005). The same code has been used in
several earlier studies, whose results have been substantially confirmed
by other groups (e.g. the analysis on IRAS16293-2422 by Schöier et al. 2002).
Briefly, the code is based on the escape probability
formalism in the presence of warm dust (see Takahashi et al. 1983), where the
escape probability ![]() is computed at each point by integrating
the line and dust absorption over the solid angle
is computed at each point by integrating
the line and dust absorption over the solid angle ![]() as
as
![\begin{displaymath}\beta = \frac{k_{\rm d}}{k_{\rm L} + k_{\rm d}} +
\frac{k_{...
...m d} \right)
\Delta L_{\rm th} \right]} {\Delta L_{\rm th}}
\end{displaymath}](/articles/aa/full_html/2009/42/aa11651-09/img75.png)
|
(2) |
where
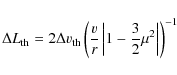
|
(3) |
in the infalling region of the envelope (where
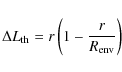
|
(4) |
in the static region (where
For the collisional coefficients of water with hydrogen molecules, we
used the data by Faure et al. (2007) available for the temperature range
20-2000 K. This data set includes quasi-classical results for the
highest rates (those over 10-12 cm3 s-1) and quantum
scaled H2O-He results for the lowest rates. Recent quantum
calculations on ortho-H2O by Dubernet and co-workers have shown
that the quasi-classical rates can be in error by as much as a factor
of 100 but that, in general, they are accurate to within a factor of
1-3 (Dubernet et al. 2009). It should be noted that
the rates of Faure et al. (2007) are currently the only complete and
consistent set of data for both ortho- and para-H2O colliding with
H2. We also note that these rates have been recently extrapolated
to cover energy levels and temperatures up to 5000 K
(Faure & Josselin 2008). Since the ortho-to-para conversion process of H2 is
chemical rather than radiative, the ortho-to-para ratio H2 OPR is
highly uncertain in the interstellar medium. Here we assume that in
warmer gas it is in Local Thermal Equilibrium (LTE) and, therefore, follows
the Boltzmann distribution:
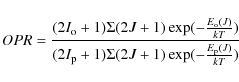
|
(5) |
where
3.2 Results
Figure 7 shows the computed gas temperature profile obtained
with different values of X(H2O)![]() in the case G0 = 1.
in the case G0 = 1.
![\begin{figure}
\par\rotatebox{0}{\includegraphics[width=8.8cm]{11651f11.ps}}
\end{figure}](/articles/aa/full_html/2009/42/aa11651-09/img91.png)
|
Figure 7:
The gas temperature profile of the collapsing envelope of
OMC2-FIR4. The different curves refer to different values of the
inner envelope water abundance X(H2O) |
| Open with DEXTER | |
![\begin{figure}
\par\rotatebox{0}{\includegraphics[width=9cm]{11651f12.ps}}\par\rotatebox{0}{\includegraphics[width=9cm]{11651f13.ps}}
\end{figure}](/articles/aa/full_html/2009/42/aa11651-09/img92.png)
|
Figure 8:
Heating ( top panel) and cooling ( bottom panel) rates as
function of the radius, computed assuming that the inner H2O
abundance is equal to
|
| Open with DEXTER | |
We emphasize that this result is a consequence of the derived shallow dependence of the density distribution, which is constrained from the fit of the maps. The dependence is strictly valid only on scales larger than the smaller telescope beam, namely 8'' (equivalent to a radius of about 1700 AU), and the SED fit only gives the total column density, which, coupled with the density dependence on the radius (constrained by the maps), constrains the density on these scales. While we cannot exclude the presence of a denser compact object hidden by the envelope, it seems unlikely that the envelope density gradient increases inwards, because this would be unphysical.
Clearly, the water abundance in the inner region of FIR4 will have a
strong impact not only on the emerging water spectrum but also on the
emerging line spectrum of any molecule (abundant in the inner region),
and has to be correctly taken into account to give reliable molecular
abundances. Conversely, given the strong effect, in principle
appropriate multiline observations of any molecule will be able to
constrain the inner region water abundance and the present model
predictions. Note that varying the outer abundance X(H2O)
![]() has no effect on the gas temperature, as in the outer region
the cooling is dominated by the CO and O lines.
has no effect on the gas temperature, as in the outer region
the cooling is dominated by the CO and O lines.
4 Predicted water line spectrum
4.1 Reference model
Here we report and discuss the predicted spectrum of our reference model. The next paragraph will discuss how it depends on the parameters of the model. We adopted Model 1 of Table 4 as reference model. We first discuss the general water line spectrum by means of the synthetic rotational diagram, and then discuss the specific predictions for the two spectrometers onboard Herschel: HIFI and PACS.![\begin{figure}
\par\rotatebox{0}{\includegraphics[width=9cm]{11651f14.ps}}
\end{figure}](/articles/aa/full_html/2009/42/aa11651-09/img93.png)
|
Figure 9: Synthetic rotational diagram derived from the water line emission using the reference model (Model 1, Table 4) integrated over the whole envelope. Crosses trace the ortho and diamonds the parawater. |
| Open with DEXTER | |
Figure 9 shows the synthetic rotational diagram
derived from the line emission integrated over the whole envelope. As
expected,
the theoretical points do not lie on a compact and straight
line, reflecting the different line optical depths, the gradients
in density and temperature of the envelope, and non-LTE effects. An
illuminating example is represented by the fundamental transitions of
the ortho and para water lines at 557 and 1113 GHz, respectively. We
discuss these two lines in detail because, first, they will
certainly be important observational diagnostics and, second, they
offer a good pedagogical case. The situation is illustrated in
Fig. 10, where we report the profile of the emission
of the ortho and para H216O and H218O fundamental lines as a
function of the radius. Figure 11, with the beta
escape probability as function of the radius for the two fundamental
H216O lines, also helps for interpreting the emerging line
fluxes for the two lines. The ortho-H216O fundamental line
emission (Fig. 10) peaks at the border of the
envelope, and it decreases inwards because of the decreasing emitting
volume. The para-H2O fundamental line shows approximately the same
behavior. If the lines were optically thin and LTE populated, the
expected flux ratio of the para over ortho fundamental line would be
between 3 and 4 for a temperature between 50 and 200 K. Any departure
from this value originates from a combination of line opacity and
non-LTE effects. In the outer region, the ratio is lower than 1: the
para-H2O line is optically thin, whereas the ortho-H2O lines is
moderately optically thick (Fig. 11). Therefore,
the much lower emission of the para-H2O line than the
ortho-line is due to the non-LTE population effect, which is more accentuated
in the para-H2O line. The situation is reversed in the inner
region, where ices sublimate: the para-H2O fundamental line becomes
about ten times brighter than the ortho-H2O fundamental line
because of the line opacity, which is much greater in the ortho-H2O
line than in the para-H2O line (Fig. 11). In
fact, the increase in the water abundance by a factor 1000 gives rise to a jump in the
line emission by a factor 3 in the ortho-H2O line and 30 in the
para-H2O line, and this can only stem from the higher opacity of
the ortho-H2O line as the excitation conditions do not change when
ices sublimate. In summary, the emission from the water lines comes,
in principle, from a rather complex combination of line opacity, non-LTE
effects and emitting volume (namely temperature and density
gradient). Evidently, the intensity ratio of lines from the
H216O and H218O isotopologues is not enough to obtain the
``opacity'' of the line, as it is a combination of the penetration of
the line and the opacity itself.
![\begin{figure}
\par\rotatebox{0}{\includegraphics[width=8.5cm]{11651f15.ps}}\vspace*{2mm}
\rotatebox{0}{\includegraphics[width=8.5cm]{11651f16.ps}}
\end{figure}](/articles/aa/full_html/2009/42/aa11651-09/img95.png)
|
Figure 10:
Emission profile,
|
| Open with DEXTER | |
![\begin{figure}
\par\rotatebox{0}{\includegraphics[width=9cm]{11651f17.ps}}
\end{figure}](/articles/aa/full_html/2009/42/aa11651-09/img96.png)
|
Figure 11: Ratio of the H216O escape probability over the H218O escape probability of the ortho (solid line) and para (dashed line) water fundamental lines obtained with the reference model (model 1 of Table 4) at 557 and 1113 GHz, respectively, as function of the radius. |
| Open with DEXTER | |
Table 5 lists the
predicted water line fluxes
for the two spectrometers on board Herschel: HIFI and PACS. Note that,
in both cases, we computed the signal after convolving the theoretical
line intensity map with the instrument beam which vary from 39'' to
13'' with the frequency varying from 500 GHz to 2000 GHz (HIFI
frequency range) and from 13'' to 5'' for wavelengths from 210 ![]() m and 60
m and 60 ![]() m (PACS wavelength range).
m (PACS wavelength range).
Table 5: Predictions of the line fluxes (after subtraction of the continuum) of the water lines observable with the Herschel spectrometers, HIFI and PACS.
Based on the (preliminary) sensitivities reported on the Herschel Observation Planning Tool HSpot: http://herschel.esac.esa.int/Tools.shtml), several ortho and para lines are predicted to be detectable by the two Herschel spectrometers: about a dozen in the HIFI frequency range and twice more in the PACS wavelength range. The H218O ortho and para lines are also predicted to be detectable by HIFI, and 100 and 20 times fainter than the respective lines of the H216O. We note the counter-intuitive result: the para-H216O line seems to be more optically thick than the ortho-H216O line! As explained above, this is not the case, of course: the line intensity ratio (from which the line optical depth is usually derived) comes from the combination of optical depth and excitation (non-LTE) effects, and the final result is not easily predictable. In our reference model, no observable line is predicted to be in absorption.
4.2 Other models
Here we explore the sensitivity of the results reported in the previous paragraph against the variation in the three main parameters of the model: the water abundance in the inner (X(H2O)Figures 12 and 13 show the ratio
between the line intensities of the reference model (Model 1 of Table
4) and the line intensities predicted by models with
different X(H2O)
![]() and X(H2O)
and X(H2O)![]() ,
respectively. As
noted by other authors (Maret et al. 2002; Ceccarelli et al. 2000), lines with upper level
energies lower than about 200 cm-1 are sensitive to
X(H2O)
,
respectively. As
noted by other authors (Maret et al. 2002; Ceccarelli et al. 2000), lines with upper level
energies lower than about 200 cm-1 are sensitive to
X(H2O)
![]() and insensitive to X(H2O)
and insensitive to X(H2O)![]() ,
because these
lines mostly originate in the outer envelope for excitation and line
opacity reasons. A variation of a factor 10 in X(H2O)
,
because these
lines mostly originate in the outer envelope for excitation and line
opacity reasons. A variation of a factor 10 in X(H2O)
![]() leads
to an almost similar variation in the line intensity of the lowest
lying lines. The higher the upper level energy, the lesser the
variation. Conversely, lines with upper level energies higher than
about 200 cm-1 are sensitive to X(H2O)
leads
to an almost similar variation in the line intensity of the lowest
lying lines. The higher the upper level energy, the lesser the
variation. Conversely, lines with upper level energies higher than
about 200 cm-1 are sensitive to X(H2O)![]() and insensitive
to X(H2O)
and insensitive
to X(H2O)
![]() .
In this case, variations by a factor 10 in
X(H2O)
.
In this case, variations by a factor 10 in
X(H2O)![]() ,
going from
,
going from
![]() to
to
![]() ,
can
lead to variations in the lines fluxes even 100 times greater. This
extreme variation, 10 times greater than the difference in the
X(H2O)
,
can
lead to variations in the lines fluxes even 100 times greater. This
extreme variation, 10 times greater than the difference in the
X(H2O)![]() variation, occurs to some lines in the 50-200
variation, occurs to some lines in the 50-200 ![]() m
wavelength range. This phenomenon occurs because those lines
are in absorption rather than in emission in the region just after the
ice sublimation, resulting in an additional decrease in the emerging
line flux. The higher the X(H2O)
m
wavelength range. This phenomenon occurs because those lines
are in absorption rather than in emission in the region just after the
ice sublimation, resulting in an additional decrease in the emerging
line flux. The higher the X(H2O)![]() ,
the lesser the absorption
depth. When X(H2O)
,
the lesser the absorption
depth. When X(H2O)![]() reaches
reaches
![]() the absorption
region generally vanishes. In addition, many high lying lines are
prevalently populated by absorption of the photons emitted by the
dust, so that they are particularly sensitive to the dust
continuum.
the absorption
region generally vanishes. In addition, many high lying lines are
prevalently populated by absorption of the photons emitted by the
dust, so that they are particularly sensitive to the dust
continuum.
![\begin{figure}
\par\includegraphics[width=8cm,clip]{11651f18.eps}\vspace*{2mm}
\includegraphics[width=8cm,clip]{11651f19.eps} %
\end{figure}](/articles/aa/full_html/2009/42/aa11651-09/img110.png)
|
Figure 12:
Ratio between the line fluxes of the reference model
(model 1 of Table 4) and the line fluxes predicted
by models with same X(H2O) |
| Open with DEXTER | |
![\begin{figure}
\par\rotatebox{90}{\includegraphics[width=6.4cm]{11651f20.ps}}\vspace*{2mm}
\rotatebox{90}{\includegraphics[width=6.4cm]{11651f21.ps}}
\end{figure}](/articles/aa/full_html/2009/42/aa11651-09/img111.png)
|
Figure 13:
Ratio between the line fluxes of the reference model
(model 1 of Table 4) and the line fluxes predicted
by models with same X(H2O)
|
| Open with DEXTER | |
Note that as mentioned in the Sect. 2.2,
the inner region of the envelope is relatively unconstrained by the
available observational data. Therefore we derived water line spectrum
predictions by varying the power-law index of the density profile ![]() of about
of about ![]() 30
30![]() in the inner part. We observed a variation in the line intensity of a factor 5-10 for the transitions with upper level energy
in the inner part. We observed a variation in the line intensity of a factor 5-10 for the transitions with upper level energy ![]() 300-400 cm-1 and less than 2 for the lower lines.
Finally, the predicted line intensities do not vary appreciably when
the illuminating FUV field changes from 1 to 1000. Therefore, observations of
water lines will be extremely helpful in constraining the water abundance across
the envelope, but will not be sensitive to the illuminating FUV field.
300-400 cm-1 and less than 2 for the lower lines.
Finally, the predicted line intensities do not vary appreciably when
the illuminating FUV field changes from 1 to 1000. Therefore, observations of
water lines will be extremely helpful in constraining the water abundance across
the envelope, but will not be sensitive to the illuminating FUV field.
4.3 Effect of gas-dust thermal decoupling
As presented in Sect. 3, the large quantity of
water vapor injected into the gas in the inner part of the envelope
causes a dramatic decoupling between the dust and gas temperatures
(see Fig. 7). Obviously, this effect has a strong impact on
the interpretation of the water line emission. This is illustrated in
Fig. 14, where we report the ratio of the water
line intensities obtained by considering the gas temperature
self-consistently computed (model 1) over the case where
![]() is
assumed to be equal to
is
assumed to be equal to
![]() .
.
![\begin{figure}
\par\rotatebox{90}{\includegraphics[width=6.4cm]{11651f22.ps}}\vs...
...atebox{90}{\includegraphics[width=6.4cm]{11651f23.ps}}\vspace{-1mm}
\end{figure}](/articles/aa/full_html/2009/42/aa11651-09/img115.png)
|
Figure 14:
Ratios between the line fluxes of the reference model
(model 1) and the reference model with gas-dust non-thermally
decoupled (namely
|
| Open with DEXTER | |
4.4 Constraints from ISO data
Observations of FIR4 were obtained by the spectrometer ISO-LWS in the grating mode (spectral resolution5 Concluding remarks
We analyzed in great detail the continuum emission from the IM protostar OMC2-FIR4, with the aim of deriving the physical structure of its envelope, a mandatory first step for further studies to understand the formation process. Our analysis led to a new estimate of the FIR4 luminosity, which is 1000Table 6: The brightest lines predicted by models 1 and 6 (the model with the largest water abundance) compared with the upper limits derived by the ISO observations.)
Given the suggestion by Jørgensen et al. (2006) that a strong FUV field
(
![]() )
illuminates the FIR4 envelope, we explored
the cases of different FUV fields. As already noted by the same
authors, however, the dust continuum cannot really distinguish
whether a strong illuminating FUV field is impinging on the
envelope. In fact, Jørgensen et al. (2006) adopted a steeper density distribution (
)
illuminates the FIR4 envelope, we explored
the cases of different FUV fields. As already noted by the same
authors, however, the dust continuum cannot really distinguish
whether a strong illuminating FUV field is impinging on the
envelope. In fact, Jørgensen et al. (2006) adopted a steeper density distribution (
![]() )
that allows the FUV photons to penetrate deeper into the envelope. Their conclusions were based on
submillimeter lines from CO and H2CO, which would be exceedingly
bright if they were emitted in the envelope. They attributed the
lines to the warm gas at the border of the envelope, heated up by
the hypothetical large FUV field. However, as discussed in Sect. 2.3, OI and CII maps by Herrmann et al. (1997) show
that the entire OMC2 region is illuminated by a G0 = 500 FUV field,
which would imply an even lower FUV field on the FIR4 envelope. One
has also to notice here that large scale maps by Schloerb & Loren (1982) show
that the CO (
)
that allows the FUV photons to penetrate deeper into the envelope. Their conclusions were based on
submillimeter lines from CO and H2CO, which would be exceedingly
bright if they were emitted in the envelope. They attributed the
lines to the warm gas at the border of the envelope, heated up by
the hypothetical large FUV field. However, as discussed in Sect. 2.3, OI and CII maps by Herrmann et al. (1997) show
that the entire OMC2 region is illuminated by a G0 = 500 FUV field,
which would imply an even lower FUV field on the FIR4 envelope. One
has also to notice here that large scale maps by Schloerb & Loren (1982) show
that the CO (
![]() )
line is bright (
)
line is bright (![]() 40 K) over the
whole OMC2 region, a fact that led Herrmann et al. (1997) to attribute the
CO emission to the PDR associated with the cloud. In addition,
several outflows are known to ``pollute'' the CO emission in the
region, in particular the one originating from FIR3 (25'' North of FIR4: Fig. 1) and reaching FIR4 and FIR5
(Williams et al. 2003).
All the above considerations together lead to the
conclusion that the FUV field impinging FIR4 is not anomalously large
and less than 500. Therefore, given the presence of a bright PDR
and a ``polluting'' outflow from FIR3, caution is needed in
interpreting the low lying water lines, as much as lines from any
molecule, separately from the whole molecular cloud emission.
40 K) over the
whole OMC2 region, a fact that led Herrmann et al. (1997) to attribute the
CO emission to the PDR associated with the cloud. In addition,
several outflows are known to ``pollute'' the CO emission in the
region, in particular the one originating from FIR3 (25'' North of FIR4: Fig. 1) and reaching FIR4 and FIR5
(Williams et al. 2003).
All the above considerations together lead to the
conclusion that the FUV field impinging FIR4 is not anomalously large
and less than 500. Therefore, given the presence of a bright PDR
and a ``polluting'' outflow from FIR3, caution is needed in
interpreting the low lying water lines, as much as lines from any
molecule, separately from the whole molecular cloud emission.
One major motivation of the present work is to predict of the
water line spectrum from FIR4, as this source will be observed in the
500-2000 GHz frequency range by the incoming Herschel Space
Observatory (FIR4 is a target of the Key Program ``HIFI Spectral
Surveys of Star Formation Regions'': http://www-laog.obs.ujf-grenoble.fr/heberges/hs3f/). In the present
study, we have shown that water is indeed a key molecular species,
because of its strong impact on the gas cooling in the region where the
dust temperature exceeds 100 K, the sublimation temperature of the
dust grain ices. The large quantity of water vapor injected into the
gas by the sublimated ices very efficiently cools the gas, causing a
dramatic decoupling between the dust and gas temperatures. Depending
on the abundance of the injected water vapor, the difference in the
temperature can be as high as 50 K at the sublimation radius (namely
50%!) and even higher going inward. For example, at 100 AU the dust
temperature is predicted to be around 280 K, whereas the gas
temperature is 80 K if the water abundance is
![]() .
Obviously, this has a strong impact in the
interpretation of the water line emission, as much as, the emission from
any molecular species emitting in the inner region. In fact, the
comparison of the water line emission between the case where dust and
gas are assumed to be thermally coupled and the case where the gas
temperature is self-consistently computed shows that the difference in
the line intensity can reach two orders of magnitudes for lines with
large upper level energies (namely the lines excited in the innermost
region, where gas and dust decouple). Therefore, our important second
conclusion is that caution has to be applied in interpreting the line
emission from FIR4, as much as any source with a similar luminosity
and envelope structure. Gas and dust temperature can be very different,
and to derive correct molecular abundances (including water
abundance), they have to be both estimated, accounting for all terms of
heating and cooling. Avoiding that may lead to very wrong conclusions.
.
Obviously, this has a strong impact in the
interpretation of the water line emission, as much as, the emission from
any molecular species emitting in the inner region. In fact, the
comparison of the water line emission between the case where dust and
gas are assumed to be thermally coupled and the case where the gas
temperature is self-consistently computed shows that the difference in
the line intensity can reach two orders of magnitudes for lines with
large upper level energies (namely the lines excited in the innermost
region, where gas and dust decouple). Therefore, our important second
conclusion is that caution has to be applied in interpreting the line
emission from FIR4, as much as any source with a similar luminosity
and envelope structure. Gas and dust temperature can be very different,
and to derive correct molecular abundances (including water
abundance), they have to be both estimated, accounting for all terms of
heating and cooling. Avoiding that may lead to very wrong conclusions.
We warmly thank Moshe Elitzur for his valuable help in using the DUSTY code. We also wish to thank Neal Evans and Doug Johnstone for helpful discussions, and Doug Johnstone and Darek Lis for providing us with the JCMT and CSO continuum maps of the OMC2-FIR4 region. We thank an anonymous referee and Malcolm Walmsley for comments that helped in improving the manuscript. One of us (N.Crimier) is supported by a fellowship of the Ministère de l'Enseignement Supérieur et de la Recherche.
References
- Ali, B., & Depoy, D. L. 1995, AJ, 109, 709 [NASA ADS] [CrossRef]
- Aso, Y., Tatematsu, K., Sekimoto, Y., et al. 2000, ApJS, 131, 465 [NASA ADS] [CrossRef]
- Beuther, H., Churchwell, E. B., McKee, C. F., & Tan, J. C. 2007, in Protostars and Planets V, ed. B. Reipurth, D. Jewitt, & K. Keil, 165
- Black, J. H. 1994, in The First Symposium on the Infrared Cirrus and Diffuse Interstellar Clouds. Astron. Soc. Pac., San Francisco, ed. R. M. Cutri, W. B. Latter, ASP Conf. Ser., 58, 355
- Ceccarelli, C., Hollenbach, D. J., & Tielens, A. G. G. M. 1996, ApJ, 471, 400 [NASA ADS] [CrossRef]
- Ceccarelli, C., Castets, A., Caux, E., et al. 2000, A&A, 355, 1129 [NASA ADS]
- Ceccarelli, C., Maret, S., Tielens, A. G. G. M., Castets, A., & Caux, E. 2003, A&A, 410, 587 [NASA ADS] [CrossRef] [EDP Sciences]
- Ceccarelli, C., Caselli, P., Herbst, E., Tielens, A. G. G. M., & Caux, E. 2007, in Protostars and Planets V, ed. B. Reipurth, D. Jewitt, & K. Keil, 47
- Chini, R., Reipurth, B., Ward-Thompson, D., et al. 1997, ApJ, 474, L135 [NASA ADS] [CrossRef]
- Di Francesco, J., Evans, II, N. J., Harvey, P. M., et al. 1997, ApJ, 482, 433 [NASA ADS] [CrossRef]
- Di Francesco, J., Evans, II, N. J., Caselli, P., et al. 2007, in Protostars and Planets V, ed. B. Reipurth, D. Jewitt, & K. Keil, 17
- Doty, S. D., & Neufeld, D. A. 1997, ApJ, 489, 122 [NASA ADS] [CrossRef]
- Draine, B. T. 1978, ApJS, 36, 595 [NASA ADS] [CrossRef]
- Dubernet, M.-L., Daniel, F., Grosjean, A., & Lin, C. Y. 2009, A&A, 497, 911 [NASA ADS] [CrossRef] [EDP Sciences]
- Evans, II, N. J., Rawlings, J. M. C., Shirley, Y. L., & Mundy, L. G. 2001, ApJ, 557, 193 [NASA ADS] [CrossRef]
- Faure, A., & Josselin, E. 2008, A&A, 492, 257 [NASA ADS] [CrossRef] [EDP Sciences]
- Faure, A., Crimier, N., Ceccarelli, C., et al. 2007, A&A, 472, 1029 [NASA ADS] [CrossRef] [EDP Sciences]
- Fuente, A., Ceccarelli, C., Neri, R., et al. 2007, A&A, 468, L37 [NASA ADS] [CrossRef] [EDP Sciences]
- Gatley, I., Becklin, E. E., Mattews, K., et al. 1974, ApJ, 191, L121 [NASA ADS] [CrossRef]+
- Gomez, M., Hartmann, L., Kenyon, S. J., & Hewett, R. 1993, AJ, 105, 1927 [NASA ADS] [CrossRef]
- Gondhalekar, P. M., & Wilson, R. 1975, A&A, 38, 329 [NASA ADS]
- Habing, H. J. 1968, Bull. Astron. Inst. Netherlands, 19, 421 [NASA ADS]
- Herrmann, F., Madden, S. C., Nikola, T., et al. 1997, ApJ, 481, 343 [NASA ADS] [CrossRef]
- Hillenbrand, L. A., & Hartmann, L. W. 1998, ApJ, 492, 540 [NASA ADS] [CrossRef]
- Hirota, T., Bushimata, T., Choi, Y. K., et al. 2007, PASJ, 59, 897 [NASA ADS]
- Hunter, T. R., Benford, D. J., & Serabyn, E. 1996, PASP, 108, 1042 [NASA ADS] [CrossRef]
- Ivezic, Z., & Elitzur, M. 1997, MNRAS, 287, 799 [NASA ADS]
- Johnson, J. J., Gehrz, R. D., Jones, T. J., Hackwell, J. A., & Grasdalen, G. L. 1990, AJ, 100, 518 [NASA ADS] [CrossRef]
- Johnstone, D., & Bally, J. 1999, ApJ, 510, L49 [NASA ADS] [CrossRef]
- Johnstone, D., Boonman, A. M. S., & van Dishoeck, E. F. 2003, A&A, 412, 157 [NASA ADS] [CrossRef] [EDP Sciences]
- Jørgensen, J. K., Schöier, F. L., & van Dishoeck, E. F. 2002, A&A, 389, 908 [NASA ADS] [CrossRef] [EDP Sciences]
- Jørgensen, J. K., Johnstone, D., van Dishoeck, E. F., & Doty, S. D. 2006, A&A, 449, 609 [NASA ADS] [CrossRef] [EDP Sciences]
- Lis, D. C., Serabyn, E., Keene, J., et al. 1998, ApJ, 509, 299 [NASA ADS] [CrossRef]
- Mannings, V., & Sargent, A. I. 1997, ApJ, 490, 792 [NASA ADS] [CrossRef]
- Mannings, V., & Sargent, A. I. 2000, ApJ, 529, 391 [NASA ADS] [CrossRef]
- Maret, S., Ceccarelli, C., Caux, E., Tielens, A. G. G. M., & Castets, A. 2002, A&A, 395, 573 [NASA ADS] [CrossRef] [EDP Sciences]
- Mezger, P. G., Zylka, R., & Wink, J. E. 1990, A&A, 228, 95 [NASA ADS]
- Neri, R., Fuente, A., Ceccarelli, C., et al. 2007, A&A, 468, L33 [NASA ADS] [CrossRef] [EDP Sciences]
- Öberg, K. I., van Broekhuizen, F., Fraser, H. J., et al. 2005, ApJ, 621, L33 [NASA ADS] [CrossRef]
- Ossenkopf, V., & Henning, T. 1994, A&A, 291, 943 [NASA ADS]
- Parise, B., Ceccarelli, C., & Maret, S. 2005, A&A, 441, 171 [NASA ADS] [CrossRef] [EDP Sciences]
- Reipurth, B., Rodríguez, L. F., & Chini, R. 1999, AJ, 118, 983 [NASA ADS] [CrossRef]
- Sandell, G., & Weintraub, D. A. 2001, ApJS, 134, 115 [NASA ADS] [CrossRef]
- Schloerb, F. P., & Loren, R. B. 1982, New York Academy Sciences Annals, 395, 32 [NASA ADS] [CrossRef]
- Schöier, F. L., Jørgensen, J. K., van Dishoeck, E. F., & Blake, G. A. 2002, A&A, 390, 1001 [NASA ADS] [CrossRef] [EDP Sciences]
- Shirley, Y. L., Evans, II, N. J., & Rawlings, J. M. C. 2002, ApJ, 575, 337 [NASA ADS] [CrossRef]
- Takahashi, T., Silk, J., & Hollenbach, D. J. 1983, ApJ, 275, 145 [NASA ADS] [CrossRef]
- Testi, L., & Sargent, A. I. 1998, ApJ, 508, L91 [NASA ADS] [CrossRef]
- Testi, L., Palla, F., & Natta, A. 1999, A&A, 342, 515 [NASA ADS]
- van der Tak, F. F. S., van Dishoeck, E. F., Evans, II, N. J., Bakker, E. J., & Blake, G. A. 1999, ApJ, 522, 991 [NASA ADS] [CrossRef]
- van der Tak, F. F. S., van Dishoeck, E. F., Evans, II, N. J., & Blake, G. A. 2000, ApJ, 537, 283 [NASA ADS] [CrossRef]
- Williams, J. P., Plambeck, R. L., & Heyer, M. H. 2003, ApJ, 591, 1025 [NASA ADS] [CrossRef]
- Wu, Y., Zhang, Q., Chen, H., et al. 2005, AJ, 129, 330 [NASA ADS] [CrossRef]
- Young, C. H., & Evans, II, N. J. 2005, ApJ, 627, 293 [NASA ADS] [CrossRef]
- Young, C. H., Shirley, Y. L., Evans, II, N. J., & Rawlings, J. M. C. 2003, ApJS, 145, 111 [NASA ADS] [CrossRef]
Footnotes
- ...

![[*]](/icons/foot_motif.png)
- Note that, in the case of OMC2-FIR4, integrating the model SED gives the same results as integrating under the observed SED.
- ... center
- Cosmic rays ionization is a minor heating term in the protostellar envelopes.
All Tables
Table 1: Range of the input parameters to DUSTY covered in the present study.
Table 2:
best-fit parameters for the case G0 = 1. Note that
![]() where
where ![]() is the number of degrees of
freedom.
is the number of degrees of
freedom.
Table 3: Summary of the dust radiative transfer analysis of OMC2-FIR4.
Table 4: The different run models.
Table 5: Predictions of the line fluxes (after subtraction of the continuum) of the water lines observable with the Herschel spectrometers, HIFI and PACS.
Table 6: The brightest lines predicted by models 1 and 6 (the model with the largest water abundance) compared with the upper limits derived by the ISO observations.)
All Figures
|
|
Figure 1:
Continuum emission maps around OMC2-FIR4 at 850 |
| Open with DEXTER | |
| In the text | |
|
|
Figure 2:
Observed brightness profiles at 350 ( upper left panel), 450
( upper right panel), 850 |
| Open with DEXTER | |
| In the text | |
|
|
Figure 3:
|
| Open with DEXTER | |
| In the text | |
|
|
Figure 4:
|
| Open with DEXTER | |
| In the text | |
|
|
Figure 5:
|
| Open with DEXTER | |
| In the text | |
|
|
Figure 6: Dust temperature ( upper panel) and H2 density ( lower panel) profiles from the best-fit obtained in the two cases G0=1 and 1000. The plain line and the dotted line represent the cases G0 = 1 and 1000, respectively. |
| Open with DEXTER | |
| In the text | |
|
|
Figure 7:
The gas temperature profile of the collapsing envelope of
OMC2-FIR4. The different curves refer to different values of the
inner envelope water abundance X(H2O) |
| Open with DEXTER | |
| In the text | |
|
|
Figure 8:
Heating ( top panel) and cooling ( bottom panel) rates as
function of the radius, computed assuming that the inner H2O
abundance is equal to
|
| Open with DEXTER | |
| In the text | |
|
|
Figure 9: Synthetic rotational diagram derived from the water line emission using the reference model (Model 1, Table 4) integrated over the whole envelope. Crosses trace the ortho and diamonds the parawater. |
| Open with DEXTER | |
| In the text | |
|
|
Figure 10:
Emission profile,
|
| Open with DEXTER | |
| In the text | |
|
|
Figure 11: Ratio of the H216O escape probability over the H218O escape probability of the ortho (solid line) and para (dashed line) water fundamental lines obtained with the reference model (model 1 of Table 4) at 557 and 1113 GHz, respectively, as function of the radius. |
| Open with DEXTER | |
| In the text | |
|
|
Figure 12:
Ratio between the line fluxes of the reference model
(model 1 of Table 4) and the line fluxes predicted
by models with same X(H2O) |
| Open with DEXTER | |
| In the text | |
|
|
Figure 13:
Ratio between the line fluxes of the reference model
(model 1 of Table 4) and the line fluxes predicted
by models with same X(H2O)
|
| Open with DEXTER | |
| In the text | |
|
|
Figure 14:
Ratios between the line fluxes of the reference model
(model 1) and the reference model with gas-dust non-thermally
decoupled (namely
|
| Open with DEXTER | |
| In the text | |
Copyright ESO 2009
Current usage metrics show cumulative count of Article Views (full-text article views including HTML views, PDF and ePub downloads, according to the available data) and Abstracts Views on Vision4Press platform.
Data correspond to usage on the plateform after 2015. The current usage metrics is available 48-96 hours after online publication and is updated daily on week days.
Initial download of the metrics may take a while.