| Issue |
A&A
Volume 506, Number 2, November I 2009
|
|
|---|---|---|
| Page(s) | 901 - 911 | |
| Section | The Sun | |
| DOI | https://doi.org/10.1051/0004-6361/200912229 | |
| Published online | 27 August 2009 | |
A&A 506, 901-911 (2009)
Coronal current sheet signatures during the 17 May 2002 CME-flare
H. Aurass1 - F. Landini2 - G. Poletto3
1 - Astrophysikalisches Institut Potsdam (AIP), 14482 Potsdam, Germany
2 - University of Firenze, Astronomy and Space Science Deptm., 50125 Firenze, Italy
3 - INAF - Osservatorio Astrofisico di Arcetri, 50125 Firenze, Italy
Received 30 March 2009 / Accepted 17 August 2009
Abstract
Context. The relation between current sheets (CSs)
associated with flares, revealed by characteristic radio signatures,
and current sheets associated with coronal mass ejections (CMEs),
detected in coronal ultraviolet (UV) and white light data, has not been
analyzed, yet.
Aims. We aim at establishing the relationship between CSs
associated with a limb flare and CSs associated with the CME that
apparently develops after the flare. We use a unique data set, acquired
on May 17, 2002, which includes radio and extreme
ultraviolet (XUV) observations.
Methods. Spectral radio diagnostics, UV spectroscopic
techniques, white light coronograph imaging, and (partly) radio imaging
are used to illustrate the relation between the CSs and to infer the
physical parameters of the radially aligned features that develop in
the aftermath of the CME.
Results. During the flare, several phenomena are interpreted in
accordance with earlier work and with reference to the common eruptive
flare scenario as evidence of flare CSs in the low corona. These are
drifting pulsating structures in dynamic radio spectra, an erupting
filament, expanding coronal loops morphologically recalling the later
white light CME, and associated with earlier reported hard X-ray source
sites. In the aftermath of the CME, UV spectra allowed us to estimate
the CS temperature and density, over the 1.5-2.1 ![]() interval of heliocentric altitudes. The UV detected CS, however,
appears to be only one of many current sheets that exist underneath the
erupting flux rope. A type II burst following the CME radio
continuum in time at lower frequencies is considered as the radio
signature of a coronal shock excited at the flank of the CME.
interval of heliocentric altitudes. The UV detected CS, however,
appears to be only one of many current sheets that exist underneath the
erupting flux rope. A type II burst following the CME radio
continuum in time at lower frequencies is considered as the radio
signature of a coronal shock excited at the flank of the CME.
Conclusions. The results show that we can build an overall
scenario where the CME is interpreted in terms of an erupting arcade
crossing the limb of the Sun and connected to underlying structures via
multiple CSs. Eventually, the observed limb flare seems to be a
consequence of the ongoing CME.
Key words: Sun: magnetic fields - Sun: coronal mass ejections - Sun: flares - Sun: radio radiation - Sun: UV radiation
1 Introduction
During coronal energy release phenomena such as confined or eruptive
flares, eruptive prominences, and coronal mass ejections (CMEs),
structural changes of the coronal magnetic field take place. It is now
(at least after the YOHKOH mission, Tsuneta et al. 1992) generally accepted that magnetic reconnection (Biskamp 2000)
is a key process in the solar corona. When two oppositely directed
magnetic flux elements approach each other to more than some ion
cyclotron radii![]() their connectivity with the photosphere can be changed, a ``field
diffusion'' region is formed. In 2D geometry, a current flows in
the diffusion region perpendicular to the plane of the field lines. In
a real case, the diffusion region may have a large extent in that
direction (as a thin, possibly curved surface) justifying the term
``current sheet'' (see e.g. Somov 2000).
their connectivity with the photosphere can be changed, a ``field
diffusion'' region is formed. In 2D geometry, a current flows in
the diffusion region perpendicular to the plane of the field lines. In
a real case, the diffusion region may have a large extent in that
direction (as a thin, possibly curved surface) justifying the term
``current sheet'' (see e.g. Somov 2000).
Independently of how a coronal CS can be directly ``seen'', its presence during coronal energy release is highly probable. The CS is a central part of cartoons, theoretical and numerical models of prominence eruptions (e.g. Anzer & Pneuman 1982), flares (e.g. Martens & Kuin 1989; Masuda et al. 1994; Priest & Forbes 1999), and CMEs (e.g. Hundhausen 1998; Saint-Hilaire et al. 2009) as a site for energy release.
Flares and CMEs proceed on different time- and spatial scales, and can
occur in association, but also be independent of each other. Zhang
et al. (2004) conclude that ``CMEs and flares are physically integrated phenomena ![]() both are the results of more fundamental processes''.
both are the results of more fundamental processes''.
Models of flares and CMEs involve a CS as an essential part. How do these ``flare-CSs'' and ``CME-CSs'' fit together? How are they associated in space and time? Is it the same situation as with the erupting active region filament or the erupting prominence that can be (sometimes) later seen in white light as a bright part of the CME, or is the situation completely different?
We search for an answer using an example, a near-limb flare and an associated CME, and analyze several indirect indicators for the presence of CSs. These are characteristic radiative signatures in radio and HXR excited by electrons accelerated in the flare-CS, on the one hand, and excessively heated regions (observable by UV spectroscopy) of more or less radial extent trailing the white light CME above the coronograph occulter, on the other.
![\begin{figure}
\par\mbox{a)\includegraphics[width=8.8cm]{12229f1a.eps} b)\includegraphics[width=8.8cm]{12229f1b.eps} }\end{figure}](/articles/aa/full_html/2009/41/aa12229-09/img5.png) |
Figure 1: SOHO-EIT 171 Å image a) and SOHO-MDI magnetogram b) on May 17, 2002 that show the context within which the CME analyzed in this paper took place. North at top, East to the left. ARs 9957 and 9958 are denoted in both panels. |
| Open with DEXTER | |
The problem we mean to face implies using different diagnostics at different times and applying them at data originating in different coronal sites. We need to fit observations that have been taken sequentially and build a unique temporal and spatial scenario. In an attempt to closely reproduce what is occurring during our event we first examine radio spectral and X-ray flux records and try to establish a temporal sequence with the help of white light images, while we resort to a potential field extrapolation to organize data in a spatial frame. Before describing the event, we give some basic information about the data we used in different spectral ranges.
Decimetric radio bursts are a characteristic impulsive flare phase signature, correlated with the flare HXR emission and excited at the lowest levels of the solar corona (Dulk et al. 1985). Benz (1986), Aurass & Kliem (1992), Karlický et al. (2002), and Karlický (2004) were the first who noticed that characteristic spectral fine structures in the dynamic spectrograms of decimeter emission are indicative of the dynamic behavior of the primary energy release site. Hori (1998) has confirmed that idea-she has shown that decimetric drifting pulsating structures (DPS) are associated with rising blobs of matter seen in soft X-rays. Following Karlický (2004) we consider such fine structures as an indicator of the very existence of a CS in the early stage of the flare, when an associated CME is not yet visible in coronograph images. Kliem et al. (2001) and Bárta & Karlický (2007) have stressed the significance of associating DPSs with the dynamic evolution of flare CSs by MHD-model calculations, and combined MHD-model and particle-in-cell-code simulations, respectively.
Table 1: May 17, 2002-time line.
Later on the event time scale, the CME rises over the LASCO coronograph
occulter. Its morphology is well described by the terms leading loops,
cavity and core (Hundhausen 1998). Underneath that expanding structure, a current sheet is predicted (see, e.g. Hundhausen 1998; Priest & Forbes 1999),
and sometimes thin and twisted plasma structures are reported to
connect the CME with low-corona features covered by the coronograph
occulter. A breakthrough observation by the SOHO-UVC spectrograph
revealed in such a thin radial structure between the CME and the
occulter high emission in the [Fe XVIII]![]() 974 Å line, pointing to the presence of temperatures
974 Å line, pointing to the presence of temperatures ![]()
![]() K over spatial scales on the order of
K over spatial scales on the order of
![]() to
to
![]() km (Ciaravella et al. 2002). These hot features have been
found in many CMEs (see, e.g. Ko et al. 2003;
Bemporad et al. 2006; Ciaravella & Raymond 2008) and their
identification with CSs has been further supported by observations of
plasma flowing along the radial structures, identified as reconnection
outflows (see, e.g. Ko et al. 2003), and of blobs, interpreted in terms of the dynamic behavior of a CS (see e.g. Lin et al. 2005).
km (Ciaravella et al. 2002). These hot features have been
found in many CMEs (see, e.g. Ko et al. 2003;
Bemporad et al. 2006; Ciaravella & Raymond 2008) and their
identification with CSs has been further supported by observations of
plasma flowing along the radial structures, identified as reconnection
outflows (see, e.g. Ko et al. 2003), and of blobs, interpreted in terms of the dynamic behavior of a CS (see e.g. Lin et al. 2005).
![\begin{figure}
\par {\hspace*{5mm}a)\includegraphics[width=16cm]{12229f2a.eps}\hspace*{5mm}}
\par b)\includegraphics[width=17cm]{12229f2b.eps}
\end{figure}](/articles/aa/full_html/2009/41/aa12229-09/img14.png) |
Figure 2:
SOHO data of May 17, 2002. North is top, East to the left. The limb of the sun is the white arch. a)
EIT 195 Å running difference images from 7:36 to
8:24 UT. Between 7:32 and 7:37 UT, RHESSI recorded
30-40 keV sources at PA76 |
| Open with DEXTER | |
In the literature the UVCS features are referred to as CSs although
this term is not consistent with its use in analyzing lower corona data
as e.g. radio observations. There is no doubt that the flare CS can be
observed indirectly, only. Estimates (Vrsnak et al. 2009) demonstrate that coronograph images can also include the slow-mode shock range above and below the diffusion region![]() so that the derived dimensions in heights above the LASCO-C2 occulter
are not unreasonable. In principle, so the coronograph images give CS
evidence in the same manner as the limb-flare X-ray images of Masuda
et al. (1994) which was
also considered as a breakthrough observation: the X-ray images do not
show the diffusion region but the surrounding heated corona and a part
of the slow-mode shocks with the characteristic inverted Y-shaped hot
matter. It is beyond the purpose of the present work to continue this
discussion. We will, for the moment, accept both CS indicators based on
the quoted previous work.
so that the derived dimensions in heights above the LASCO-C2 occulter
are not unreasonable. In principle, so the coronograph images give CS
evidence in the same manner as the limb-flare X-ray images of Masuda
et al. (1994) which was
also considered as a breakthrough observation: the X-ray images do not
show the diffusion region but the surrounding heated corona and a part
of the slow-mode shocks with the characteristic inverted Y-shaped hot
matter. It is beyond the purpose of the present work to continue this
discussion. We will, for the moment, accept both CS indicators based on
the quoted previous work.
2 May 17, 2002-data analysis
2.1 Overview
The event we analyze started at about 7:30 UT, on May 17, 2002, at the East
limb of the Sun, above the active region complex which includes AR 9957 and
9958, located at, respectively, N06, E53 and N03, E45 and
followed, at a slightly higher latitude, by AR 9960 (see Fig. 1). AR 9960 appears at the
limb of the Sun, on May 18, at a latitude of ![]() 18
18![]() and
in the southern hemisphere, AR 9955 and AR 9954 are at,
respectively, S14, E 41, and S22, E41. This complex has been the site
of frequent activity, both before and after 7:30 UT. In
Table 1 we give a list of the relevant observations that have
been done at the time of our event. We also list the H
and
in the southern hemisphere, AR 9955 and AR 9954 are at,
respectively, S14, E 41, and S22, E41. This complex has been the site
of frequent activity, both before and after 7:30 UT. In
Table 1 we give a list of the relevant observations that have
been done at the time of our event. We also list the H![]() -
and/or GOES-detected flares, and CMEs that occurred prior and after our
event, on the same day and, most likely, from the same AR complex: when
the AR number appears in the Solar Geophysical Data,
its number is given in the Table. Data have been arranged sequentially
in time.
-
and/or GOES-detected flares, and CMEs that occurred prior and after our
event, on the same day and, most likely, from the same AR complex: when
the AR number appears in the Solar Geophysical Data,
its number is given in the Table. Data have been arranged sequentially
in time.
The EIT 195 Å images show diffuse emission, centered at a latitude of ![]() 12-14
12-14![]() (PA = 76-78
(PA = 76-78![]() ,
PA = Position Angle (degrees), measured counterclockwise from solar North), above this AR complex. Figure 2
gives a sequence of EIT 195 Å running difference images that cover
the time interval from 07:36 to 08:24 UT and illustrate
the initial phase of our event: bright loops are seen to form and rise
upwards
in agreement with reports of an eruptive prominence at PA = 75
,
PA = Position Angle (degrees), measured counterclockwise from solar North), above this AR complex. Figure 2
gives a sequence of EIT 195 Å running difference images that cover
the time interval from 07:36 to 08:24 UT and illustrate
the initial phase of our event: bright loops are seen to form and rise
upwards
in agreement with reports of an eruptive prominence at PA = 75![]() at < 08:27 UT. Evidence for a progressive rising and weakening of these structures comes from later images.
at < 08:27 UT. Evidence for a progressive rising and weakening of these structures comes from later images.
Indeed, looking at the C2 images in Fig. 2b, we see a CME first appearing above the occulter at ![]() 8:06 UT. The CME is well seen
in these images (and in, e.g., the wavelet enhanced images in Fig. 4):
however, it is not easy to understand whether
we see two CMEs that develop successively - the northern one
originating slightly after the first one -
or whether we look at a single event, which spans over a large latitude
interval, partially extending behind the limb. If this is the case,
and the event spans over a large longitude interval as well, loops
which originate from behind the limb, when projected onto the plane of
the sky, culminate closer to the limb. In the C3 coronagraph our
event is first imaged around 08:42 UT
8:06 UT. The CME is well seen
in these images (and in, e.g., the wavelet enhanced images in Fig. 4):
however, it is not easy to understand whether
we see two CMEs that develop successively - the northern one
originating slightly after the first one -
or whether we look at a single event, which spans over a large latitude
interval, partially extending behind the limb. If this is the case,
and the event spans over a large longitude interval as well, loops
which originate from behind the limb, when projected onto the plane of
the sky, culminate closer to the limb. In the C3 coronagraph our
event is first imaged around 08:42 UT![]() confirming that the eruptive events imaged in the lower corona reach the outer coronal levels.
confirming that the eruptive events imaged in the lower corona reach the outer coronal levels.
The EIT and LASCO data set the stage for the following discussion of the event in radio (AIP and AOO) and SOHO-UVCS observations (see Table 1).
2.2 Radio and X-ray observations
![\begin{figure}
\par\includegraphics[width=18cm]{12229f3.eps}\par
\end{figure}](/articles/aa/full_html/2009/41/aa12229-09/img16.png) |
Figure 3: Dynamic radio spectra of AIP ( top) and AOO ( middle, after Karlický et al. 2004, and http://www.asu.cas.cz/%7Eradio/). Lines parallel to the time axis are disturbances, time-parallel lanes are frequency bands completely covered by strong radio and TV signals. The AIP spectrum is the difference with respect to a first spectral scan in the plot. Flux data (grey shaded) are in arb. units and logarithmic. Bottom: GOES flux (W m-2) and 1-8 Å (positive valued) time derivative in arb. units. |
| Open with DEXTER | |
In this work we use the dynamic radio spectra of AIP and the corresponding time intervals of AOO (Karlický et al. 2004) shown in Fig. 3, and the NRH images available after 08:27 UT. The radio burst emission is of nonthermal origin-it is driven by the presence of nonthermal electrons in the coronal plasma.
Taking into account that we aim at establishing the spatial/temporal relationship between flare CSs and the later observations of CSs below a CME, we summarize the information from radio data as follows:
- The continous presence of nonthermal electrons in the corona over a
large time interval, at least from 07:36-08:23 UT. GOES X-ray flux
records (Fig. 3) and RHESSI HXR observations (Karlický et al. 2004) extend this time interval to 07:29-
 08:20 UT.
NRH imaging data show at the PA of the former HXR source site a
long-duration postflare continuum source centroid, and - more to
the South-a type III burst group source at 09:10-09:12 UT.
08:20 UT.
NRH imaging data show at the PA of the former HXR source site a
long-duration postflare continuum source centroid, and - more to
the South-a type III burst group source at 09:10-09:12 UT.
- In the spectrum, a low-frequency cut-off drifts toward lower
frequencies, conservatively at least between 400 and 40 MHz,
and between 07:48 and 08:23 UT. At still lower frequencies,
type III bursts occur only sometimes. In 08:15-08:23 UT, 55-
 MHz, the radio record of the event terminates with a single type II burst lane.
- The dm effects between 2 GHz and 800 MHz are classified as drifting pulsating structures (DPS, Karlický et al. 2004, and personal communication) pointing to the presence of dynamic processes in flare CSs (Karlický 2004).
- The correlation between radio spectral data and X-ray data is
changing over time. This is not unusual but has, nevertheless, recently
been further discussed in an independent analysis (Benz et al.
2007). We note the following relation:
- The event is radio-quiet in the dm-m range in the early impulsive phase (07:29-07:38 UT);
- After 07:38 UT, and during the decay of X-ray emission (07:40-07:46 UT) there is DPS and type III group emission (170- < 40 MHz);
- In a next energy release phase (07:46-07:59 UT) we find DPS emission between >2 GHz and 350 MHz with spectral fine structures in 07:57-07:59 UT, 800-600 MHz. It is interesting that the type III bursts (previous item) extend down to very low frequencies (see the 14-1 MHz data from WIND, not shown here) exactly until 07:59 UT. Later occuring type III bursts (08:10:30 and 09:11:30 UT) do not reach the WIND frequency range;
- After a gap in the spectrum (07:59-08:02 UT) there is
only faint DPS emission remaining (1.2 GHz-500 MHz), and a
smooth ``CME-continuum'' (in the sense of Aurass et al. 1999; Bastian et al. 2001) occurs in >300-
 100 MHz (08:02-08:14 UT).
A single type III burst is superposed at 08:10:30 UT. All
this is accompanied by a slow-down of the decay or a faint
re-enhancement of the X-ray flux.
100 MHz (08:02-08:14 UT).
A single type III burst is superposed at 08:10:30 UT. All
this is accompanied by a slow-down of the decay or a faint
re-enhancement of the X-ray flux.
We consider the radio observations as a link connecting X-ray flare
imaging, on the one hand, and LASCO-CME imaging, on the other hand. The
radio spectral diagnostics informs about the presence of dynamic flare
CSs (DPS), and about the presence and motion of the CME in the
lowest coronal heights (CME-continuum). Eventually, sudden changes or
interruptions of ongoing radio emission![]() , point to large-scale dynamics in the corona associated with the CME motion (comp. Khan & Aurass 2006).
, point to large-scale dynamics in the corona associated with the CME motion (comp. Khan & Aurass 2006).
![\begin{figure}
\par\mbox{\includegraphics[width=9cm]{12229f4a.eps}\includegraphics[width=9cm]{12229f4b.eps} }
\end{figure}](/articles/aa/full_html/2009/41/aa12229-09/img21.png) |
Figure 4:
Combined SOHO white light coronograph images processed using a
technique developed by Stenborg, and NRH 327 MHz maps (white
isolines at the limb, source PA indicated by the long dashed lines).
The vertical line represents the UVCS spectrograph slit length and
position. The short-dashed line denotes PA90 |
| Open with DEXTER | |
Table 2: UVCS slit positions and time intervals used in our analysis.
2.3 Ultraviolet Coronagraph Spectrometer (UVCS) observations
At the time of the event, on May 17, 2002, UVCS was operating in
the synoptic mode: that is, the UVCS slit, set normal to the solar
radius, at different altitudes, moves sequentially all around the Sun,
in steps of 45![]() .
From 8:28 to 9:58 UT, the slit was normal to the equatorial
radius, in the eastern hemisphere, and covered a range of altitudes
from 1.5 to 3.1
.
From 8:28 to 9:58 UT, the slit was normal to the equatorial
radius, in the eastern hemisphere, and covered a range of altitudes
from 1.5 to 3.1 ![]() .
UVCS acquired
spectra in three wavelength intervals,
.
UVCS acquired
spectra in three wavelength intervals,
![]() ,
997.97
,
997.97
![]() ,
,
![]() with a spatial binning of 21 arcsec/pixel and a spectral binning
of 0.27 Å per pixel in the first spectral interval and of
0.18 Å per pixel in the others.
The exposure time was 120 s. The total observing time-5 min at
1.5
with a spatial binning of 21 arcsec/pixel and a spectral binning
of 0.27 Å per pixel in the first spectral interval and of
0.18 Å per pixel in the others.
The exposure time was 120 s. The total observing time-5 min at
1.5 ![]() -increased to longer durations when UVCS takes
data at higher altitudes. Within the spectral range covered by the spectrograph, the strongest spectral lines are the H Ly-
-increased to longer durations when UVCS takes
data at higher altitudes. Within the spectral range covered by the spectrograph, the strongest spectral lines are the H Ly-![]() ,
the O VI 1032 Å and the Si XII 499 Å line, observed in the second order. Notice that the slit is first set at the highest altitude (3.1
,
the O VI 1032 Å and the Si XII 499 Å line, observed in the second order. Notice that the slit is first set at the highest altitude (3.1 ![]() for this data set) and then moves down. Hence the lower coronal
plasma is observed at the end of the observations.
for this data set) and then moves down. Hence the lower coronal
plasma is observed at the end of the observations.
The data have been wavelength and flux calibrated. We first integrated
over the line profile, to obtain the total intensity of the observed
lines. However, we had to integrate over 5 spatial pixels (thus
decreasing the spatial resolution) and sum, at each slit position, over
the whole exposure time to obtain a statistically significant signal.
We ended up with six spectra, acquired at R = 1.5, 1.7, 1.9, 2.1, 2.55,
![]() ,
each corresponding to a different time interval. Table 2 summarizes the times and slit positions. The two spectra acquired at 3.1 and 2.55
,
each corresponding to a different time interval. Table 2 summarizes the times and slit positions. The two spectra acquired at 3.1 and 2.55 ![]() were discarded, because line intensities decrease with altitude and in spite of the longer exposures the Si XII line became too weak to be statistically significant. Figure 4 has shown the slit positions at 8:50 and 09:26 UT superposed onto LASCO-C2 contrast-enhanced images.
were discarded, because line intensities decrease with altitude and in spite of the longer exposures the Si XII line became too weak to be statistically significant. Figure 4 has shown the slit positions at 8:50 and 09:26 UT superposed onto LASCO-C2 contrast-enhanced images.
![\begin{figure}
\par\includegraphics[width=17cm,clip]{12229f5.eps}
\end{figure}](/articles/aa/full_html/2009/41/aa12229-09/img27.png) |
Figure 5:
Profiles of line intensity along the UVCS slit at 1.9 |
| Open with DEXTER | |
We aim at finding evidence for the presence of a CS at the heliocentric heights
sampled by UVCS. As described in Sect. 1, CSs have been identified
via the emission in the 974 Å line of the [Fe XVIII] ion. Unfortunately,
this line is not included in synoptic UVCS spectra and we have to adopt
alternative techniques. In the past, in a comparable situation, e.g. Lin et al. (2005) resorted to an analysis of UVCS HI Ly-![]() data. Aligned with the LASCO white light CS
data. Aligned with the LASCO white light CS![]() Lin et al. (2005) noticed a spatial interval over which the UVCS Ly-
Lin et al. (2005) noticed a spatial interval over which the UVCS Ly-![]() line had a decreased brightness, as expected if the region is filled with hot plasma. Also, the
width of the interval with reduced Ly-
line had a decreased brightness, as expected if the region is filled with hot plasma. Also, the
width of the interval with reduced Ly-![]() intensity decreased in
time, as expected in case of reconnection inflows.
intensity decreased in
time, as expected in case of reconnection inflows.
The faint Ly-![]() ,
the temporal behavior of the spatial interval where this occurred, and
the spatial correlation with the LASCO bright feature, were deemed by
the authors to point to the presence of a CS. In the present work,
we resort to an analogous procedure to identify signatures of a CS in
UVCS data.
,
the temporal behavior of the spatial interval where this occurred, and
the spatial correlation with the LASCO bright feature, were deemed by
the authors to point to the presence of a CS. In the present work,
we resort to an analogous procedure to identify signatures of a CS in
UVCS data.
Figure 5 gives the total line intensity profiles, along the UVCS slit, of Si XII and O VI lines at 1.9 ![]() .
The coronograph occulter and the disk of the sun (white) are shown at right. A radius is plotted through
.
The coronograph occulter and the disk of the sun (white) are shown at right. A radius is plotted through
![]() for reference (see Fig. 4). The x-axis of the two plots are set normal to the equatorial radius, to reproduce the UVCS slit position and cover the
for reference (see Fig. 4). The x-axis of the two plots are set normal to the equatorial radius, to reproduce the UVCS slit position and cover the ![]() 2000 arcsec over which UVCS took data. The x-axis
of the OVI plot is set at an heliocentric distance of 1.9 solar
radii, in agreement with the position of the UVCS slit. Each unit on
this axis is 100 arcsec. The y-axis gives the total counts observed in the lines.
2000 arcsec over which UVCS took data. The x-axis
of the OVI plot is set at an heliocentric distance of 1.9 solar
radii, in agreement with the position of the UVCS slit. Each unit on
this axis is 100 arcsec. The y-axis gives the total counts observed in the lines.
Figure 5 shows that:
- a O VI line minimum appears at a position, along the UVCS slit, corresponding to PA 83
 and;
and;
- at this position the Si XII line peaks, as expected in a region of enhanced temperature.
LASCO C2 wavelet enhanced images show the CME rising at increasingly larger heliocentric distances. Under the rising core, a bright ``stem'' is recognizable, at the position where, according to the Lin and Forbes (2000) model, we expect a CS. Its PA coincides with the position angle where the O VI/Si XII line intensities minimizes/maximizes.
The examined images and spectra lead us to conclude that the bright white light
feature corresponds, at the lower levels sampled by UVCS, to an enhanced
temperature structure, that maintains its identity over a radial interval
of ![]() 0.6
0.6 ![]() .
This association, and the previous results from
EIT and radio observations lead us to suggest that UVCS is observing
the
hot plasma of the CS region that extends from the low corona to the
bottom
part of the CME core. Hence, because the synoptic spectra we analyze do
not include the FeXVIII line, we used the anticorrelated Si 499
and O 1032 Å line intensities, their spatial coincidence with a
LASCO-C2 bright feature and the earlier discussed facts
from HXR, EIT, radio spectral and imaging data as evidence of a
flare-CME-related CS site.
.
This association, and the previous results from
EIT and radio observations lead us to suggest that UVCS is observing
the
hot plasma of the CS region that extends from the low corona to the
bottom
part of the CME core. Hence, because the synoptic spectra we analyze do
not include the FeXVIII line, we used the anticorrelated Si 499
and O 1032 Å line intensities, their spatial coincidence with a
LASCO-C2 bright feature and the earlier discussed facts
from HXR, EIT, radio spectral and imaging data as evidence of a
flare-CME-related CS site.
3 Temperature and density derived from UV spectral lines
Based on the UVCS data, we can demonstrate that a radial pattern in LASCO-C2 data which is situated between the plane-of-sky-cut through the rising CME-flux rope and the previously identified probable position of the near-limb flare CS is filled with hot matter millions K above the surrounding corona. Here we explain some problems in deriving plasma temperatures from UVCS observations which are specific for the analyzed case.
As a result of our data analysis it turns out that we have a rare and extremely well adjusted data set crossing over several spectral ranges. The UVCS spectroscopic information is available just in spatial and time coincidence with one of the twisted and radially elongated white light features formed in the corona during the CME evolution, that are radially aligned with the lower coronal radio and HXR sources observed during the earlier stages of the event.
In order to evaluate the temperature and density in the region where the
high density white light feature crosses the UVCS spectral slit we need to take into account that while the Si XII lines form, as usual for coronal lines, by collisional excitation, the H Ly-![]() and O VI
coronal lines form also by resonant scattering of the disk radiation
(the so called ``radiative component''). The intensity of the radiative
component, however, is a function of the speed of the emitting plasma,
because of the Doppler Dimming effect (Beckers & Chipman 1974) and may be completely eroded if the emitting plasma is moving outwards at a high enough speed.
and O VI
coronal lines form also by resonant scattering of the disk radiation
(the so called ``radiative component''). The intensity of the radiative
component, however, is a function of the speed of the emitting plasma,
because of the Doppler Dimming effect (Beckers & Chipman 1974) and may be completely eroded if the emitting plasma is moving outwards at a high enough speed.
| Figure 6: Estimate of temperature and density in a current sheet (CS) region embedded within the coronal plasma: a) emissivities of OVI 1032 Å and SiXII 499 Å, and their ratio, from CHIANTI v5.0 with the photospheric abundances of Grevesse and Sauval (1998); b) along the line of sight (LOS) we suppose that the CS is surrounded by quiet coronal background plasma. |
|
| Open with DEXTER | |
The collisional line intensity (photons cm![]() s
s![]() sr
sr![]() )
may be written as:
)
may be written as:
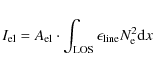
where
The ratio of intensities of two collisionally formed lines depends only on the electron temperature, once the element abundance is known. Hence, if we assume that O VI and Si XII form in a plasma with photospheric abundances, and we are able:
- to identify the contribution to the total line intensities originating from the CS region, and;
- to derive the O VI collisional component,
In order to apply the line ratio technique and derive the temperature in the CS region, we need first to separate the contribution of the quiet corona from the contribution arising in the CS region. We hypothesize that the hot plasma in the CS region is embedded within the quiet corona, as shown in the right panel of Fig. 6. Hence we need to subtract the quiet coronal background contribution from the line intensity before taking the ratio of their signals. This can be easily done for the SiXII line, whose quiet corona emission is given by the measured line intensity sideways of the CS region. However, the intensity of the O VI line in the CS region is undistiguishable from that of the background corona. Hence we conclude that the OVI emission originating there is, if any, too weak to be identifiable and is completely blurred within the background emission. As a consequence, we may only assume, as an upper limit to the intensity of the O VI line in the CS-related parts of the image, a value given by the statistical uncertainty in the O VI intensity of the ambient corona.
![\begin{figure}
\par\mbox{a)\includegraphics[width=8.8cm]{12229f7a.eps} b)\includegraphics[width=8.8cm]{12229f7b.eps} }
\end{figure}](/articles/aa/full_html/2009/41/aa12229-09/img43.png) |
Figure 7: Potential field (SOHO-MDI, 17 May 2002 06 UT) after Schrijver & DeRosa (2003), closed field lines out of an a priori selected bounding box and inward field line tracing. Two perspectives are shown: a) as it appears on May 17, 2002; b) the same after rotating view a) 90 deg westward. A kinked arcade turns around the north-east limb from behind the sun. According to our view (Fig. 8b) the arcade between active regions A and B has a fundamental role in the formation of the CME and the flux rope embedded in it, as well as in triggering the flare in B. |
| Open with DEXTER | |
We do not know whether lines in the CS form exclusively by collisional excitation (as it would occur if the CS region is pervaded by fast outflowing plasma) or whether we should consider also a radiatively excited component. This issue, however, is not relevant in our case, because the presence of a radiatively excited component would only decrease the value of the hypothesized collisional emission of the O VI line, which we already assumed to be an upper limit to its actual intensity in the CS.
The OVI/SiXII line intensity ratios, the infered temperatures and the electron
densities corresponding to the minimum and maximum temperatures are summarized
in Table 3. Higher temperatures would be obtained
in case a radiative component contributes to the CS O VI
line intensity.
We notice, however, that the values we derived compare well with
previous
estimates of CS temperatures from the ratio of lines observed by UVCS
and formed by collisional excitation only (e.g. Ciaravella &
Raymond 2008, derived values
![]() -6.9).
-6.9).
Once the temperature is known, it is possible to derive the emission measure
(EM, cm-5),
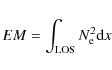
and get an estimate of the electron density. This is only possible if a reliable estimate for the extension of the emitting plasma along the LOS is available. We assume the electron density to be roughly constant within the CS in question, so that we can approximate the integral with
4 Discussion
Based on the described observations we have been able to define a timeline of processes which should be summarized once again (compare Table 1):
- X-ray, radio data, and prominence observations show at the East limb a flare in AR 9957 (region B in Fig. 7b). Over the limb, HXR sources are reported associated with expanding coronal loops probably enclosing the eruptive flare filament.
- Radio- and X-ray flux over time are not simply related, the radio spectrum of the impulsive phase is quiet at meter- and Dekameter waves. Decimeter waves show characteristic drifting pulsating structures (DPS) indicating dynamic processes in the stretched flare CSs underneath the rising filament.
- Radio data reveal between 07:56 and 08:00 UT:
- a faint narrowband pattern between 360 and 420 MHz;
- the diffuse onset of the CME continuum;
- a sudden reduction of the type III bandwidth;
- White light coronographs show the expanding CME. We identify stretched radial structures between the rising flux rope and the occulter.
- In one of the radial structures UVCS data reveal - after
applying a specific line ratio method - an enhanced plasma
temperature of
 K well above the average corona.
- Radio data show after the fade-out of the CME continuum a single narrowband lane suggestive for a type II burst.
Figure 7a shows the sun in
terrestrial observer's perspective. Overplotted are potential field
lines rooted with one end in an a priori chosen starting box around
active region 9957 (B). For simplicity, we have drawn the closed
field lines in our region of interest, only. Looking from the Earth we
see an arcade bridging over the NE-limb and apparently extending from
region B up to the North pole. Figure 7b is a view from the East limb (after rotating the sun from panel a) by 90 deg westward)![]() .
We see now a giant kinked arcade visualized by field lines turning
around the East and North limb and linking the behind-limb active
region 9969/70 (NOAA SGD, A in Fig. 8b), and the region B. It is surprising how misleading the view a) of Fig. 7 can be, with respect to the 3D configuration we obtained.
.
We see now a giant kinked arcade visualized by field lines turning
around the East and North limb and linking the behind-limb active
region 9969/70 (NOAA SGD, A in Fig. 8b), and the region B. It is surprising how misleading the view a) of Fig. 7 can be, with respect to the 3D configuration we obtained.
Assuming that the (already kinked) arcade or a similar field structure further down gets de-stabilized starting behind the limb (e.g. in active region A of panel b) the different observed facts become well compatible. Structures around B are always visible, structures near A must firstly reach the limb. This is one explanation of the impression of two CMEs in Fig. 2b. The features noticed in the radio spectra between 07:56 and 08:00 UT indicate the appearance of the CME over the limb and the corresponding disturbance and reconfiguration of the background field and the paths of energetic particle propagation (sudden type III bandwidth reduction).
Table 3: Temperature and electron density estimate at various heliocentric heights (here corresponding to different observation times).
The limb flare (Fig. 3) turns out to be the last energy release stage of the eruption before the CME lift-off in active region B near the E limb. The type III burst source at 9:11 UT (Fig. 4b) occurs where the potential field extrapolation consists of open field lines (not shown here). The burst source probably marks the outer rim of the CME-related disturbance projected on the disk. Due to the explained perspective effects the CME's leading edge in Fig. 7a is its last-detached part, and most of it moves away from earth behind the limb.
![\begin{figure}
\par a)\includegraphics[width=8.5cm]{12229f8a.eps}\par b)\includegraphics[width=8.5cm]{12229f8b.eps}
\end{figure}](/articles/aa/full_html/2009/41/aa12229-09/img55.png) |
Figure 8:
The CME in the plane of sky. a)
Part of SOHO-LASCO-C3 FOV, difference frame 12:42-12:18 UT.
Dark arrows: some Y-patterns; white arrows: a white arch. b) Cartoon (not to scale) sketching authors viewpoint. The circle is the occulter at 5 |
| Open with DEXTER | |
Figure 8a shows a
LASCO-C3 difference image 12:42-12:18 UT. Dark arrows point to
some white concave upward (Y-shaped) structures that trace the SE-NW
inclination of the longitudinal axis of the rising flux-rope. In the
foreground, the CME is diffuse, only one Y-shaped feature clearly
showing up, while more can be seen at the NW section, although the
(projected) CME morphology looks more complex in that region. White
arrows in this difference image point to a bright arch situated under
the large CME loops, and overlying a dark area![]() near the coronograph's occulter. These bright / dark features
in the difference frame might be formed by a rising pattern looking
like an arch in projection. We argue that this features are the
superposed lower ends of white light-visible structures (Y) which
still connect the flux rope and the tops of post eruption loops.
near the coronograph's occulter. These bright / dark features
in the difference frame might be formed by a rising pattern looking
like an arch in projection. We argue that this features are the
superposed lower ends of white light-visible structures (Y) which
still connect the flux rope and the tops of post eruption loops.
Figure 8b is a cartoon sketching the situation. Our scenario consists of a flux rope turning behind the limb and underneath supported by occasionally visible Y-shaped magneto-plasma structures. Klimchuk (1996) suggested - in agreement with soft X-ray and prominence observations - that there is no long plane CS existing under the rising destabilized arcade. He assumes that only a narrow fraction of the arcade field reconnects thus forming the flux rope with several singular CSs underneath. With this argument Klimchuk (1996) solves the energy budget problem which occurs if a huge plane CS reconnects. The repeated reconnection at different sites leads to repeated electron acceleration and to the repeated DPS patterns in decimeter radio spectra.
We have demonstrated that one of the radial coronographic structures corresponds to a hot plasma region in the wake of the rising CME (Hundhausen 1998; Saint-Hilaraire et al. 2009). We found that probably the flare CSs evolve into one or several of the larger-scale CME-wake CSs near the flare site. Our result coincides with predictions about the transition from a 2.5D to a 3D model of solar eruptive processes (summarized e.g. in Priest & Forbes 1999; Somov 2000). It fits with earlier work on CSs in the wake of CMEs (e.g. Ko et al. 2003; Ciaravella & Raymond 2008) that show regions of overheated coronal plasma aligned with white light-bright elongated plasma structures. Generally UVCS data refer to lower heights than those visible in LASCO C2, so we do not have a superposition (as we have here).
The analyzed case is an interesting example illustrating the difficulties of the causality question between flares and CMEs. If our understanding of the observations is correct it is tempting to assume that the limb flare is driven by the already rising CME. The reconstruction of the global magnetic field structure yields a huge arcade extended from an active region on the backside of the sun to a near-E-limb region on the disk (regions A and B in Fig. 8b). A detailed analysis leads to the conclusion that the destabilization of a part of the corona and the formation of a CME probably starts behind the limb (near region A), and that the rising CME initiates later on the flare at position B. Our findings about the flare/CME relation in the given case are in agreement with the results of Zhang et al. (2001) and Gary & Moore (2004) about the association between ongoing CMEs and flares.
From our interpretation of the data there follows another interesting conclusion with regard to the radio spectrum Fig. 3,
the type II lane late in the event. Frequently the question is
posed what drives the shock wave which eventually emits the radio
radiation - the flare blast or the CME piston (e.g. Aurass 1997, but see also Warmuth & Mann 2005).
The type II burst definitely occurs much too late for a
flare-blast driven shock from region A or from B. Therefore we
conclude that in this event, the coronal shock radio signature is
driven by the expanding CME. Moreover, we can speculate![]() because of the frequency range of the lane in the spectrum that this
burst is driven by the flank of the CME because the head of the
disturbance has already passed the corresponding height levels at that
time.
because of the frequency range of the lane in the spectrum that this
burst is driven by the flank of the CME because the head of the
disturbance has already passed the corresponding height levels at that
time.
5 Conclusions
In this paper we present the analysis of a comparatively simple
event in several spectral ranges, and in a well suited position on the
disk. From an analysis of radio and SOHO (UVCS, LASCO, EIT, MDI) data
we derived independent indications favoring an interpretation in terms
of one (or several radially elongated) current sheet(-s) formed early
in the flare event and being later on observed above the
C2 occulter in the wake of an ongoing CME. Some indications are
indirect ones-in radio due to missing imaging, in white light due to
the lack of information at heights covered by the occulter. So, we
refer in radio on specific broadband drifting decimetric pulsations
pointing on developing flare current sheets; and in white light on
stable and radially elongated twisted features at sites where a current
sheet is expected during the magnetic re-closure of the corona behind
the CME. The integrating element of the observations is the temporal
and spatial sequence of effects during the flare/CME event considered
together with the potential field extrapolation of photopheric field
data in the expected magnetic footpoint range of the CME. UVCS
observations have shown that one of the elongated features in white
light images, radially linked with the previous limb flare site, is
really associated with ![]()
![]() K
(heated) coronal matter. This means the coincidence of several
indications of a current sheet in the expected timing, and in agreement
with the coronal magnetic field structure confirms our view at least in
the present case. To our knowledge this is one of the first published
examples where it seems possible to argue for an interconnection
between flare current sheets (usually underneath the rising active
region filament) and one (of several) post-CME-current sheets
underneath the flux rope which rises as a part of the CME.
K
(heated) coronal matter. This means the coincidence of several
indications of a current sheet in the expected timing, and in agreement
with the coronal magnetic field structure confirms our view at least in
the present case. To our knowledge this is one of the first published
examples where it seems possible to argue for an interconnection
between flare current sheets (usually underneath the rising active
region filament) and one (of several) post-CME-current sheets
underneath the flux rope which rises as a part of the CME.
H.A. and G.P. thank the International Space Science Institute, Berne (ISSI) for the hospitality provided to the members of the team Role of Current sheets in Solar Eruptive Events where some of the ideas presented in this work have been discussed. We acknowledge the use of the Nançay Radio Heliograph, the SOHO instruments (Ultraviolet Coronal Spectrometer, Michelson Doppler Imager, Extreme Ultraviolet Telescope, and the Large Angle Spectroscopic Imager), the GOES satellite data, and the NOAA Solar Geophysical Data. SOHO is a project of international cooperation between ESA and NASA. We are grateful to M. Karlický (A.O. Ondrejov) for the access to the spectral and the 3 GHz data. The LASCO-C2 images in Figs. 4 and 5 have been enhanced with a technique developed by Guillermo Stenborg. G.P. acknowledges support from ASI/INAF I/015/07/0. The critical remarks of the referee, Dr. K.-L. Klein, led to a substantial improvement of the presentation of the manuscript.
References
- Anzer, U., & Pneuman, G. W. 1982, Solar Phys. 79, 129
- Aurass, H. 1997, in Coronal Physics from Radio and Space Observations, ed. G. Trottet, LNP, 483, 135
- Aurass, H., & Kliem, B. 1992, Solar Phys., 141, 371 [NASA ADS] [CrossRef]
- Aurass, H., Vourlidas, A., Andrews, M. D., et al. 1999, ApJ, 511, 451 [NASA ADS] [CrossRef]
- Bastian, T., Pick, M., Kerdraon, A., et al. ApJ, 558, 65
- Bárta, M., Karlický, M., & Büchner, J. 2009, Centr. Europ. Astrophys. Bull. 33, 299
- Beckers, J. M., & Chipman, E. 1974, Solar Phys. 34, 151
- Benz, A. O. 1986, Solar Phys. 104, 99
- Benz, A. O., Brajsa, R., & Magdalenic, J. 2007, Solar Phys. 270, 263
- Biskamp, D. 2000, Magnetic Reconnection in Plasmas (Cambridge: Cambridge Univ. Press)
- Ciaravella, A., & Raymond, J. C. 2008, ApJ, 686, 1372 [NASA ADS] [CrossRef]
- Crooker, N., Joselyn, J. A., & Feynman, J. 1998, Coronal Mass Ejections, AGU Geophys. Monographs, 99
- Dulk, G. A., McLean, D. J., & Nelson, G. J. 1985, in Solar Radiophysics, ed. D. J. McLean, & N. R. Labrum (Cambridge Univ. Press), 53
- Gary, G. A., & Moore, R. L. 2004, ApJ, 611, 545 [NASA ADS] [CrossRef]
- Grevesse, N., & Sauval, A. J. 1998, Space Sci. Rev., 85, 161 [NASA ADS] [CrossRef]
- Hori, K. 1999, in Solar Physics with Radio Observations, ed. T. Bastian, N. Gopalswamy, & K. Shibasaki, NRO Report, 479, 267
- Hundhausen, A. 1998, in The Many Faces of the Sun (New York: Springer), 143
- Karlický, M. 2004, A&A, 417, 325 [NASA ADS] [CrossRef] [EDP Sciences]
- Karlický, M., Fárnik, F., & Mészárosová, H. 2002, A&A, 395, 677 [NASA ADS] [CrossRef] [EDP Sciences]
- Karlický, M., Fárnik, F., & Krucker, S. 2004, A&A, 419, 365 [NASA ADS] [CrossRef] [EDP Sciences]
- Khan, J. I., & Aurass, H. 2006, A&A, 457, 319 [NASA ADS] [CrossRef] [EDP Sciences]
- Kliem, B., Karlický, M., & Benz, A. O. 2000, A&A, 360, 715 [NASA ADS]
- Klimchuk, J. A. 1996, in Magnetic Reconnection in the Solar Atmosphere, ASP Conf. Ser. 111, 319
- Ko, Y.-K., Raymond, J. C., Lin, J., et al. 2003, ApJ, 594, 1068 [NASA ADS] [CrossRef]
- Lin, J., Ko, Y.-K., Raymond, J. C., et al., ApJ, 622, 1251
- Mann, G., Jansen, F., MacDowall, R. J., Kaiser, M. L., & Stone, R. G. 1999, A&A, 348, 614 [NASA ADS]
- Martens, P. C. H., & Kuin, N. P. M. 1989, Solar Phys. 122, 263
- Masuda, S., Kosugi, T., Hara, H., Tsuneta, S., & Ogawara, Y. 1994, Nature, 371, 495 [NASA ADS] [CrossRef]
- Noci, G., Kohl, J. L., & Withbroe, G. L. 1987, ApJ, 315, 706 [NASA ADS] [CrossRef]
- Newkirk, G. A. 1961, ApJ, 133, 983 [NASA ADS] [CrossRef]
- Poletto, G., Suess, S. T., Bemporad, A., et al. 2004, ApJ, 613, L173 [NASA ADS] [CrossRef]
- Priest, E., & Forbes, T. 1999, Magnetic Reconnection-MHD Theory and Applications (Cambridge Univ. Press)
- Saint-Hilaire, P., Krucker, S., & Lin, R. P. 2009, ApJ, 697, 245 [NASA ADS] [CrossRef]
- Schrijver, C. J., & DeRosa, M. L., Solar Phys. 2003, 212, 165
- Somov, B. V. 2000 Cosmic Plasma Physics (Dordrecht: Kluwer), 574
- Svestka, Z. F., Poletto, G., Fontenla, J., et al. in The Many Faces of the Sun, ed. K. T. Strong, J. L. R. Saba, B. M. Haisch, & J. T. Schmelz (New York: Springer), 409
- Tsuneta, S., Hara, H., Shimizu, T., et al. Proc. Astron, Soc. Jap. 44, L63
- Vrsnak, B., Poletto, G., Vujic, E., et al. 2009, A&A, 499, 905 [NASA ADS] [CrossRef] [EDP Sciences]
- Warmuth, A., & Mann, G. 2005, A&A, 435, 1123 [NASA ADS] [CrossRef] [EDP Sciences]
- Webb, D. F., Burkepile, J., Forbes, T. G., et al. 2003, JGR, 108, A12, 1440
- Zhang, J., Dere, K. P., Howard, R. A. 2004, et al. ApJ, 604, 420, 2004
Footnotes
- ... radii
![[*]](/icons/foot_motif.png)
- Some meters in the corona.
- ... region
- We refer to the same paper also for the explanation of terms.
- ... 08:42 UT
- The CME speed should be almost twice as large as appears in the CME catalog!
- ... emission
- Here: dm radiation depletion between 07:59 and 08:02 UT, and type III burst total bandwidth reduction thereafter.
- ... CS
- Identified by the bright ``stem'' located below the CME core.
- ... westward)
- For the source of behind-sun information we refer to Schrijver & DeRosa (2003).
- ... area
- No change in the time interval of the difference image!
- ... speculate
- No imaging data available in this frequency range on that day.
All Tables
Table 1: May 17, 2002-time line.
Table 2: UVCS slit positions and time intervals used in our analysis.
Table 3: Temperature and electron density estimate at various heliocentric heights (here corresponding to different observation times).
All Figures
| |
Figure 1: SOHO-EIT 171 Å image a) and SOHO-MDI magnetogram b) on May 17, 2002 that show the context within which the CME analyzed in this paper took place. North at top, East to the left. ARs 9957 and 9958 are denoted in both panels. |
| Open with DEXTER | |
| In the text | |
| |
Figure 2:
SOHO data of May 17, 2002. North is top, East to the left. The limb of the sun is the white arch. a)
EIT 195 Å running difference images from 7:36 to
8:24 UT. Between 7:32 and 7:37 UT, RHESSI recorded
30-40 keV sources at PA76 |
| Open with DEXTER | |
| In the text | |
| |
Figure 3: Dynamic radio spectra of AIP ( top) and AOO ( middle, after Karlický et al. 2004, and http://www.asu.cas.cz/%7Eradio/). Lines parallel to the time axis are disturbances, time-parallel lanes are frequency bands completely covered by strong radio and TV signals. The AIP spectrum is the difference with respect to a first spectral scan in the plot. Flux data (grey shaded) are in arb. units and logarithmic. Bottom: GOES flux (W m-2) and 1-8 Å (positive valued) time derivative in arb. units. |
| Open with DEXTER | |
| In the text | |
| |
Figure 4:
Combined SOHO white light coronograph images processed using a
technique developed by Stenborg, and NRH 327 MHz maps (white
isolines at the limb, source PA indicated by the long dashed lines).
The vertical line represents the UVCS spectrograph slit length and
position. The short-dashed line denotes PA90 |
| Open with DEXTER | |
| In the text | |
| |
Figure 5:
Profiles of line intensity along the UVCS slit at 1.9 |
| Open with DEXTER | |
| In the text | |
| |
Figure 6: Estimate of temperature and density in a current sheet (CS) region embedded within the coronal plasma: a) emissivities of OVI 1032 Å and SiXII 499 Å, and their ratio, from CHIANTI v5.0 with the photospheric abundances of Grevesse and Sauval (1998); b) along the line of sight (LOS) we suppose that the CS is surrounded by quiet coronal background plasma. |
| Open with DEXTER | |
| In the text | |
| |
Figure 7: Potential field (SOHO-MDI, 17 May 2002 06 UT) after Schrijver & DeRosa (2003), closed field lines out of an a priori selected bounding box and inward field line tracing. Two perspectives are shown: a) as it appears on May 17, 2002; b) the same after rotating view a) 90 deg westward. A kinked arcade turns around the north-east limb from behind the sun. According to our view (Fig. 8b) the arcade between active regions A and B has a fundamental role in the formation of the CME and the flux rope embedded in it, as well as in triggering the flare in B. |
| Open with DEXTER | |
| In the text | |
| |
Figure 8:
The CME in the plane of sky. a)
Part of SOHO-LASCO-C3 FOV, difference frame 12:42-12:18 UT.
Dark arrows: some Y-patterns; white arrows: a white arch. b) Cartoon (not to scale) sketching authors viewpoint. The circle is the occulter at 5 |
| Open with DEXTER | |
| In the text | |
Copyright ESO 2009
Current usage metrics show cumulative count of Article Views (full-text article views including HTML views, PDF and ePub downloads, according to the available data) and Abstracts Views on Vision4Press platform.
Data correspond to usage on the plateform after 2015. The current usage metrics is available 48-96 hours after online publication and is updated daily on week days.
Initial download of the metrics may take a while.