| Issue |
A&A
Volume 506, Number 1, October IV 2009
The CoRoT space mission: early results
|
|
|---|---|---|
| Page(s) | 167 - 173 | |
| Section | Stellar structure and evolution | |
| DOI | https://doi.org/10.1051/0004-6361/200911930 | |
| Published online | 19 May 2009 | |
The CoRoT space mission: early results
Hydrodynamical simulations of convection-related stellar micro-variability
II. The enigmatic granulation background of the CoRoT target
HD 49933![[*]](/icons/foot_motif.png)
H.-G. Ludwig1,![]() - R. Samadi2 - M. Steffen3 - T. Appourchaux4 - F. Baudin4 - K. Belkacem5 - P. Boumier2 - M.-J. Goupil2 -
E. Michel2
- R. Samadi2 - M. Steffen3 - T. Appourchaux4 - F. Baudin4 - K. Belkacem5 - P. Boumier2 - M.-J. Goupil2 -
E. Michel2
1 - GEPI, Observatoire de Paris, CNRS, Univ. Paris 7, 92195 Meudon Cedex, France
2 - LESIA, Observatoire de Paris, CNRS (UMR 8109), Univ. Paris 6, Univ. Paris 7, 92195 Meudon Cedex, France
3 - Astrophysikalisches Institut Potsdam, An der Sternwarte 16, 14482 Potsdam, Germany
4 - Institut d'Astrophysique Spatiale, Univ. Paris 11, CNRS (UMR 8617), 91405 Orsay, France
5 - Institut d'Astrophysique et de Géophysique de l'Université de Liège, Allée du 6 Août 17, 4000 Liège, Belgium
Received 23 February 2009 / Accepted 17 April 2009
Abstract
Context. Local-box hydrodynamical model atmospheres provide statistical information about a star's emergent radiation field which allows one to predict the level of its granulation-related micro-variability. Space-based photometry is now sufficiently accurate to test model predictions.
Aims. We aim to model the photometric granulation background of HD 49933 as well as the Sun, and compare the predictions to the measurements obtained by the CoRoT and SOHO satellite missions.
Methods. We construct hydrodynamical model atmospheres representing HD 49933 and the Sun, and use a previously developed scaling technique to obtain the observable disk-integrated brightness fluctuations. We further performed exploratory magneto-hydrodynamical simulations to gauge the impact of small scale magnetic fields on the synthetic light-curves.
Results. We find that the granulation-related brightness fluctuations depend on metallicity. We obtain a satisfactory correspondence between prediction and observation for the Sun, validating our approach. For HD 49933, we arrive at a significant over-estimation by a factor of two to three in total power. Locally generated magnetic fields are unlikely to be responsible, otherwise existing fields would need to be rather strong to sufficiently suppress the granulation signal. Presently suggested updates on the fundamental stellar parameters do not improve the correspondence; however, an ad-hoc increase of the HD 49933 surface gravity by about 0.2 dex would eliminate most of the discrepancy.
Conclusions. We diagnose a puzzling discrepancy between the predicted and observed granulation background in HD 49933, with only rather ad-hoc ideas for remedies at hand.
Key words: convection - hydrodynamics - methods: numerical - stars: atmospheres - stars: late-type - stars: individual: HD 49933
1 Introduction
The bright (
![]() )
F-type dwarf HD 49933 (HR 2530, ADS 5505A)
was the first prime seismic target of the CoRoT space photometry mission
(Auvergne et al. 2009). A clear signature of solar-like oscillations was
detected in the acquired light-curve (Appourchaux et al. 2008; Michel et al. 2008). This confirms expectations about the presence of solar-like oscillations in HD 49933 which were anticipated from results of ground-based observations of
radial velocity (Mosser et al. 2005).
)
F-type dwarf HD 49933 (HR 2530, ADS 5505A)
was the first prime seismic target of the CoRoT space photometry mission
(Auvergne et al. 2009). A clear signature of solar-like oscillations was
detected in the acquired light-curve (Appourchaux et al. 2008; Michel et al. 2008). This confirms expectations about the presence of solar-like oscillations in HD 49933 which were anticipated from results of ground-based observations of
radial velocity (Mosser et al. 2005).
It is now generally accepted that solar-like oscillations are excited by stochastic convective motions taking place in the stellar surface layers on time-scales of the same order as the periods of the excited modes. The convective flows are thermally driven, and imprint a time-varying brightness pattern - granulation - on the stellar surface. While the oscillations manifest themselves as discrete peaks in a temporal power spectrum of a star's light-curve, the stochastic evolution of the granulation pattern leads to a continuous signal, the so-called granulation background, since it usually constitutes the background on which oscillatory peaks are superimposed in a spectrum. Oscillations, as well as granulation, induce very small brightness fluctuations, challenging the sensitivity level of photometry achievable from the ground, and motivating photometry from space such as that performed by CoRoT.
Table 1: CO5BOLD radiation-hydrodynamics model atmospheres.
The modelling of stellar granulation - mainly driven by the need for improved stellar atmosphere models of late-type stars - made substantial progress over the last two decades. It has now reached a level that should allow a direct comparison between the predicted and observed granulation properties, in particular the granulation background (Trampedach et al. 1998; Svensson & Ludwig 2005; Ludwig 2006; Guenther et al. 2008). Hitherto, the comparison was somewhat hampered by the limited photometric accuracy, duty cycle, and duration of existing stellar measurements. The outstanding accuracy achieved on HD 49933 by CoRoT offers a new opportunity for a stringent comparison between predicted and observed granulation background, and is attempted here. We will see, however, that some problems are encountered.
The paper is organized as follows: we briefly describe the photometric data (Sect. 2), and the hydrodynamical granulation models (Sect. 3), comment on how we derive the synthetic background spectra (Sect. 3.1), present comparisons for the Sun and HD 49933 (Sect. 4), and finish by discussing effects which may play a role in the encountered problems (Sects. 5 and 6).
2 CoRoT photometric data and power spectra
We used reduced photometric data of the N2-level (Samadi et al. 2006) covering
137 d for HD 49933 from long run LRa01, and 157 d for the F-dwarfs
HD 181420 and HD 181906 from long run LRc01. We applied the same bolometric
correction (Michel et al. 2009) to all targets, amounting to a factor of 1.11
in amplitude of the brightness fluctuations. We calculated power spectra
by applying a standard Fast Fourier Transform from the bolometric light-curve
without further processing. In particular, we did not apply any correction to
the long-term trend apparent in the light-curve of HD 49933. The reason was
that applying the measured loss of instrumental sensitivity due to aging
again produced a trend but in the opposite sense. This in turn resulted in a
power spectrum almost indistinguishable from the power spectrum of the
uncorrected data. On the other hand, simply de-trending by removing any linear
long-term variation had an impact on the power - but at frequencies
![]() only. These frequencies are not relevant to the conclusions
drawn in this paper. Hence, we did not further investigate this issue, but
remark that there is an instrument-related uncertainty in the measured power
and its slope in the range
only. These frequencies are not relevant to the conclusions
drawn in this paper. Hence, we did not further investigate this issue, but
remark that there is an instrument-related uncertainty in the measured power
and its slope in the range
![]() .
.
When we refer to ``power'' in this paper we always mean power
spectral density. We follow the normalization that the power
integrated over the interval between zero (excluded) and the Nyquist frequency
equals the variance
![]() of the signal in the time domain.
of the signal in the time domain.
3 CO BOLD radiation-hydrodynamics simulations
We used the radiation-hydrodynamics code CO5BOLD (for further
information about the code and applications see Freytag et al. 2002; Wedemeyer et al. 2004)
to construct three 3D Cartesian ``local-box'' model atmospheres. Two models were
intended to represent HD 49933, and one - for reference - the Sun.
Table 1 summarizes the model properties. The atmospheric
parameters for HD 49933 were chosen close to values recommended in the
literature,
![]() (Bruntt et al. 2008), and
(Bruntt et al. 2008), and
![]() (Appourchaux et al. 2008). The metallicity of the star
is
(Appourchaux et al. 2008). The metallicity of the star
is
![]() (Solano et al. 2005; Gillon & Magain 2006). The
opacities used in the models for HD 49933 are based on detailed
low-temperature opacities from the MARCS stellar atmosphere package
(Gustafsson et al. 2008). We only had these data available for particular
metallicities, and not for arbitrary element mixtures. Due to this
restriction, we decided to compute two 3D models with metallicities which
bracket the star's observed metallicity. As will be demonstrated below, the
chemical composition has an important impact on the model properties. The
solar model Sun1 is a CO5BOLD model of an older generation employing
opacities from the ATLAS model atmosphere package (Kurucz 2005). While
this leads to some systematic differences between the models, we believe that
they so not influence the comparisons performed in this paper.
Our two hydrodynamical model atmospheres for HD 49933 were also employed to predict excitation rates of oscillatory modes (Samadi et al. 2008, 2009).
(Solano et al. 2005; Gillon & Magain 2006). The
opacities used in the models for HD 49933 are based on detailed
low-temperature opacities from the MARCS stellar atmosphere package
(Gustafsson et al. 2008). We only had these data available for particular
metallicities, and not for arbitrary element mixtures. Due to this
restriction, we decided to compute two 3D models with metallicities which
bracket the star's observed metallicity. As will be demonstrated below, the
chemical composition has an important impact on the model properties. The
solar model Sun1 is a CO5BOLD model of an older generation employing
opacities from the ATLAS model atmosphere package (Kurucz 2005). While
this leads to some systematic differences between the models, we believe that
they so not influence the comparisons performed in this paper.
Our two hydrodynamical model atmospheres for HD 49933 were also employed to predict excitation rates of oscillatory modes (Samadi et al. 2008, 2009).
Unfortunately, the aforementioned stellar parameters are not completely
reliable. Bruntt et al. (2004) list effective temperatures and surface
gravities from various determinations which differ by almost 500 K and
0.5 dex, and the debate about the exact parameters is still ongoing
(Bruntt 2009; Kallinger et al. 2008). It may turn out that HD 49933 is
200-300 K cooler than assumed in our models. More important for the
level of the granulation background, however, is the the value of the surface
gravity. We will come back to this point later but want to emphasize that
HD 49933 has an accurately known parallax of
![]() from HIPPARCOS (van Leeuwen 2007 which helps to constrain its surface gravity
and stellar radius. In this paper, we use a radius of 1.35
from HIPPARCOS (van Leeuwen 2007 which helps to constrain its surface gravity
and stellar radius. In this paper, we use a radius of 1.35
![]() for
HD 49933, within the error box given by Appourchaux et al. (2008) of
for
HD 49933, within the error box given by Appourchaux et al. (2008) of
![]() .
.
Since the brightness fluctuations which are central to the present
investigation are intimately linked to the heating and cooling provided by
the radiation field to the gas, we give here some details about the treatment of
the radiative transfer in the hydrodynamical models. All models employ
![]() grid points for the spatial mesh in the x-, y-, and
(vertical) z-direction, respectively. For all models, the mesh spacing is
equidistant in the horizontal directions. In vertical direction, S0 and
S1 employ a non-equidistant spacing, Sun1 again an equidistant mesh. In the
important layers around
grid points for the spatial mesh in the x-, y-, and
(vertical) z-direction, respectively. For all models, the mesh spacing is
equidistant in the horizontal directions. In vertical direction, S0 and
S1 employ a non-equidistant spacing, Sun1 again an equidistant mesh. In the
important layers around ![]() the spacing in vertical direction amounts
to 46.9 km (0.19
the spacing in vertical direction amounts
to 46.9 km (0.19
![]() ,
definition see Table 1), 48.2 km
(0.20
,
definition see Table 1), 48.2 km
(0.20
![]() ), and 15.1 km (0.11
), and 15.1 km (0.11
![]() )
for models S0, S1, and
Sun1, respectively. Note that the models S0 and S1 use the same
vertical mesh. The difference in resolution at
)
for models S0, S1, and
Sun1, respectively. Note that the models S0 and S1 use the same
vertical mesh. The difference in resolution at ![]() is the result of
how the model adjusts on the computational mesh. The radiative
transfer is solved along long characteristics employing Feautrier's method
(e.g., Mihalas 1978) assuming strict LTE. Corresponding ``rays'' are
started at each point of the spatial mesh in the top-most layer. All models
use bundles of rays in one vertical and two inclined directions, as well as
four azimuthal directions (M = 3 case described in Ludwig 2006)
coinciding with the coordinate axes. In total this amounts to 176 400 rays
along which the radiative transfer equation is solved at each time step.
The number of equivalent wavelength points
is the result of
how the model adjusts on the computational mesh. The radiative
transfer is solved along long characteristics employing Feautrier's method
(e.g., Mihalas 1978) assuming strict LTE. Corresponding ``rays'' are
started at each point of the spatial mesh in the top-most layer. All models
use bundles of rays in one vertical and two inclined directions, as well as
four azimuthal directions (M = 3 case described in Ludwig 2006)
coinciding with the coordinate axes. In total this amounts to 176 400 rays
along which the radiative transfer equation is solved at each time step.
The number of equivalent wavelength points
![]() to represent the
wavelength dependence of the radiation field is five for models S0, and
Sun1, six for S1, as given in Table 1. The necessary
interpolation of the radiative heating or cooling between the system of rays
and spatial mesh (for hydrodynamics) is performed in an energy-conserving
fashion. To optimize performance, the treatment of the
radiative transfer is switched to the diffusion approximation in the deep,
optically thick layers.
to represent the
wavelength dependence of the radiation field is five for models S0, and
Sun1, six for S1, as given in Table 1. The necessary
interpolation of the radiative heating or cooling between the system of rays
and spatial mesh (for hydrodynamics) is performed in an energy-conserving
fashion. To optimize performance, the treatment of the
radiative transfer is switched to the diffusion approximation in the deep,
optically thick layers.
Finally, we want to point out two aspects which are of particular importance
for the interpretation of the granular background. Qualitatively, the lower
metallicity in model S1 in comparison to S0 leads to a lower overall
opacity (primarily due to the lower H- opacity at lower electron
pressure). This in turn implies an increase of the mass density at given
optical depth. At optical depth unity, we find an increase of the mass
density by ![]()
![]() in model S1 relative to S0. At fixed
flow geometry, the higher density would require a smaller temperature
contrast or smaller velocity differences between up- and down-flowing
material to transport the prescribed stellar energy flux. What actually
happens in S1 is an increase of the temperature contrast reflected by an
increase of the intensity contrast (see Table 1). This is
likely a consequence of the dependence of the opacity on temperature. On the
other hand, as expected, the typical velocity amplitudes in model S1 are
smaller by about
in model S1 relative to S0. At fixed
flow geometry, the higher density would require a smaller temperature
contrast or smaller velocity differences between up- and down-flowing
material to transport the prescribed stellar energy flux. What actually
happens in S1 is an increase of the temperature contrast reflected by an
increase of the intensity contrast (see Table 1). This is
likely a consequence of the dependence of the opacity on temperature. On the
other hand, as expected, the typical velocity amplitudes in model S1 are
smaller by about ![]()
![]() at the maximum of the vertical
velocity. Finally, the typical granular scales become shorter in S1. The
combination of these factors determines the amplitude and characteristic
frequency of the granulation background.
at the maximum of the vertical
velocity. Finally, the typical granular scales become shorter in S1. The
combination of these factors determines the amplitude and characteristic
frequency of the granulation background.
3.1 Synthetic power spectra of the observable flux
The hydrodynamical models provide time series of the radiation intensity at
different limb-angles including the temporal convection-related fluctuations.
Ludwig (2006) showed that, together with an assumption about the stellar
radius, this information is sufficient to predict the power
spectrum of the disk-integrated, observable, relative
brightness variations. He obtained for the frequency component of the power
spectrum the relation
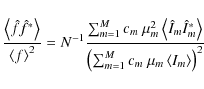
where
 |
(2) |
Angular brackets denote expectation values,
Due to the finite duration of a simulation, the obtained power spectra of the
relative brightness fluctuations exhibit appreciable noise. To improve the
effective signal-to-noise level and facilitate the comparison to observations
we fit a simple analytical model to the simulated spectra. The
analytical model reflects our prejudice that the frequency dependence of the
granulation-related background signal should show rather little structure.
Moreover, it allows us to eliminate the acoustic eigenmodes of the
computational domain which are excited by the convection-related fluctuations
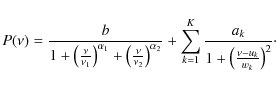
but are not directly comparable to the observed modes. We applied a model for
the spectral power density P which is a generalized Harvey model
(Harvey 1985) for the background, plus a sum of Lorentzians for the
box-modes according to
To maximize the likelihood function we used the POWELL function implemented in IDL. The maximization problem turned out not to be well conditioned, and some manual intervention was always necessary to obtain a stable and acceptable fit. This points to the need for a more sophisticated fitting procedure with suitable regularization. However, for the present purposes we considered the fitting rather a kind of constrained smoothing so that the shortcomings from the viewpoint of statistical stringency were not considered vital. We verified that our fitting resulted in a representation close to what was obtained by direct smoothing of the simulated spectra.
4 Results
4.1 Fitting the simulated raw spectra
Figure 1 illustrates the result of fitting the analytical model
of Eq. (3) to the simulated raw spectra calculated from the time
series with the help of Eq. (1). Table 2 lists the
fitted parameters. As already mentioned, the simulated spectra show an
appreciable level of noise. In the figure, the simulated spectra were smoothed
to allow a clearer comparison. By comparing solar models with different
numerical set-ups, we estimated that the absolute uncertainty in the simulated
spectra amounts to about ![]() 20% in total (i.e. frequency integrated)
amplitude; we expect the relative accuracy among models of similar numerical
set-ups to be somewhat better. Note that we left out the contribution of the
box modes in the fitting functions in Fig. 1. The simulated
spectra show clear differences in the total power between the Sun and
HD 49933 - primarily reflecting the change of the granular cell size
relative to the stellar radius among the stars. The metal-depleted model for
HD 49933 S1 shows only 58% of the model S0 in total power. This is
the result of a reduction of the granular scale at lower metallicity, over-compensating of the increase in the contrast (cf. Eq. (5)). Moreover, the power in model S1 is shifted towards lower frequencies. This we trace back to longer granular life-times in S1, presumably related to the lower typical velocities in S1. All models predict a rather steep drop of the granular background signal towards high frequencies, similar to the
one observed in the Sun.
20% in total (i.e. frequency integrated)
amplitude; we expect the relative accuracy among models of similar numerical
set-ups to be somewhat better. Note that we left out the contribution of the
box modes in the fitting functions in Fig. 1. The simulated
spectra show clear differences in the total power between the Sun and
HD 49933 - primarily reflecting the change of the granular cell size
relative to the stellar radius among the stars. The metal-depleted model for
HD 49933 S1 shows only 58% of the model S0 in total power. This is
the result of a reduction of the granular scale at lower metallicity, over-compensating of the increase in the contrast (cf. Eq. (5)). Moreover, the power in model S1 is shifted towards lower frequencies. This we trace back to longer granular life-times in S1, presumably related to the lower typical velocities in S1. All models predict a rather steep drop of the granular background signal towards high frequencies, similar to the
one observed in the Sun.
![\begin{figure}
\par\includegraphics[angle=90,width=8.5cm,clip]{1930fig1.ps}
\end{figure}](/articles/aa/full_html/2009/40/aa11930-09/img55.png) |
Figure 1: Inter-comparison of the raw (solid lines) and fitted (dashed lines) spectra (power spectral density) of the three hydrodynamical simulations. The contribution of box-modes to the fitted signal was left out in the graphs. |
| Open with DEXTER | |
Table 2: Fitted parameters of Eq. (3) for the synthetic power spectra of the three hydrodynamical models.
4.2 Comparison with VIRGO observations of the sun
Figure 2 constitutes an update of results presented by
Svensson & Ludwig (2005), and shows a comparison (not fit) between the
disk-integrated, photometric fluctuations derived from the solar model Sun1,
and observational data from the VIRGO instrument on board the SOHO satellite. Our focus is the high frequency region of the solar signal in
which granular contributions dominate. The VIRGO power spectrum was
calculated from (level 2) time series data provided by the VIRGO team.
One year of data (1996.5-1997.5) was chosen close to solar minimum
activity to minimize the possible contribution of activity related
variability. The plotted power spectrum is based on data of the green channel
of the VIRGO three-channel sun-photometer (SPM, see Fröhlich et al. #Fr&).
Following the procedure of Svensson & Ludwig (2005), it has been converted to
white light fluctuations by matching (by shifting in power) a corresponding
power spectrum based on VIRGO PMO6V-A absolute radiometer data in the
frequency range 0.3 to 2.0 mHz. Instead of using the PMO6V-A power
spectrum directly, this rather involved procedure was necessary since PMO6V-A
and SPM power spectra deviate substantially in the high frequency region. The
authors found little information about this mismatch in the literature.
However, it appears to be agreed that the SPM spectrum reflects the actual
solar behavior (Fröhlich et al. #Fr&; Andersen et al. 1998), in particular showing the steep (roughly as ![]() )
decline at the highest frequencies.
)
decline at the highest frequencies.
![\begin{figure}
\par\includegraphics[angle=90,width=8.5cm,clip]{1930fig2.ps}
\end{figure}](/articles/aa/full_html/2009/40/aa11930-09/img58.png) |
Figure 2: Power spectra of disk-integrated photometric fluctuations for the Sun: the predicted background signal of model Sun1 (green/grey solid line) and observational data from SOHO/ VIRGO (black solid line). Note the steep decline in power towards high frequencies. |
| Open with DEXTER | |
We find a satisfactory agreement of the continuous background signal between model predictions and observations between 0.1 and 8.0 mHz. In particular, the background in the p-mode frequency range is matched quite well. The observed background power shows a ``kink'' at frequencies slightly above 1 mHz relative to the model prediction, and the ``plateau'' power around 0.2 mHz is not exactly represented. Michel et al. (2009) interpreted the ``kink'' as the sign of the transition between a meso-granular and granular contribution to the power spectrum. This interpretation is obviously not supported by our granulation model, which already provides too much power around 1 mHz, and has a geometrical dimension which would not allow the development of meso-granular convection cells of 5-10 Mm size (November et al. 1981). Moreover, Michel and co-workers attribute a similar total fluctuation amplitude to meso-granulation and granulation. According to Eq. (5), this would correspond to a spatial brightness contrast which would be a sizable fraction of the granulation contrast and should be easily recognizable in images of the solar surface - which is not the case.
Towards low frequencies (
![]() ), the increase of the observed
signal is due to the solar magnetic activity, and cannot be represented by the
pure (non-MHD) hydrodynamical model applied here. We also considered the power
spectrum at solar maximum (year 2000.5-2001.5, not shown). Towards solar
maximum, the activity-related power increases but leaves the
granulation-related signal intact; the power spectrum is essentially identical
at frequencies
), the increase of the observed
signal is due to the solar magnetic activity, and cannot be represented by the
pure (non-MHD) hydrodynamical model applied here. We also considered the power
spectrum at solar maximum (year 2000.5-2001.5, not shown). Towards solar
maximum, the activity-related power increases but leaves the
granulation-related signal intact; the power spectrum is essentially identical
at frequencies
![]() .
It is difficult to provide an objective
criterion to determine to which lowest temporal frequency our model can make reliable
predictions. A limit is set by the maximum size that features can develop in
the simulation. However, it is not obvious how this relates to their
life-time, hence the frequencies on which they will have an impact.
.
It is difficult to provide an objective
criterion to determine to which lowest temporal frequency our model can make reliable
predictions. A limit is set by the maximum size that features can develop in
the simulation. However, it is not obvious how this relates to their
life-time, hence the frequencies on which they will have an impact.
A conspicuous feature exhibited by the observations as well as the model is the ``step-like'' shape of the granular background signal. As it will be shown later, this feature is not obvious in the observations of HD 49933, while it is predicted by the simulations.
4.3 Comparison with CoRoT observations of HD 49933
Figure 3 shows a comparison between the predicted power spectra (power spectral density) of models S0 and S1. Ideally, the observed spectrum should fall somewhere between models S0 and S1. This is not at all the case; the predictions lie noticeably higher with a power almost a factor of two greater than observed around 0.9 mHz. Moreover, the overall shape of the observed spectrum is not well represented by the models. In particular, the conspicuous drop of the background level is not obvious in the observations.
In Fig. 3 we added two spectra of F-dwarfs which were also
observed by CoRoT. The stars have parameters not too different from HD 49933
(HD 181420:
![]() = 6650 K,
= 6650 K,
![]() = 4.17, [M/H] = -0.04; HD 181906:
6380/4.15/-0.14; see Michel et al. 2008). The overall levels of the
brightness fluctuations differ, however, the spectra show a remarkable similarity in shape. We take this as an indication that HD 49933 is a typical representative of its class, and not an exceptional case among F-dwarfs. We note here that the similarity of the spectral shape at
= 4.17, [M/H] = -0.04; HD 181906:
6380/4.15/-0.14; see Michel et al. 2008). The overall levels of the
brightness fluctuations differ, however, the spectra show a remarkable similarity in shape. We take this as an indication that HD 49933 is a typical representative of its class, and not an exceptional case among F-dwarfs. We note here that the similarity of the spectral shape at
![]() might be connected to the rather similar rotational periods of the stars of 3.4 d for HD 49933 (Appourchaux et al. 2008), 2.8 d for HD 181906 (García et al. #Garcí<#1969), and
might be connected to the rather similar rotational periods of the stars of 3.4 d for HD 49933 (Appourchaux et al. 2008), 2.8 d for HD 181906 (García et al. #Garcí<#1969), and
![]() d for
HD 181420 (Barban et al. 2009).
d for
HD 181420 (Barban et al. 2009).
![\begin{figure}
\par\includegraphics[angle=90,width=8.5cm,clip]{1930fig3.ps}
\end{figure}](/articles/aa/full_html/2009/40/aa11930-09/img63.png) |
Figure 3: Power spectra for HD 49933: dashed lines depict the predictions from models S0 and S1. The solid lines are again the predicted spectra but increased by a constant corresponding to the observed photometric white noise level. The black line depicts the spectrum of HD 49933. The other two solid lines depict spectra of the similar F-dwarfs HD 181420 and HD 181906. |
| Open with DEXTER | |
Michel et al. (2008) assumed that the continuum in the p-mode region indeed
corresponds to the granulation background, fitted it with a standard Harvey
model, and arrived at granulation-related brightness fluctuations of
![]() with appreciable uncertainty. This would put
the fluctuations in HD 49933 on the same level as observed in the Sun, and is
significantly lower than our predictions. However, accepting for the moment a
much lower level of fluctuations, we experimented in an ad-hoc fashion by
adding (besides photometric noise) an activity-like signal (assuming a
power-law) to our simulated granulation spectra, and simultaneously scaled
their power and characteristic frequency to enforce correspondence with the
observations. Figure 4 illustrates the outcome after scaling
the power derived from the models by a factor of 0.33 and the frequency by a
factor of 1.6. This resulted in a plausible - albeit not entirely
satisfactory - correspondence. Later we shall try to interpret the scaling in
terms of a change of fundamental stellar parameters (see
Sect. 5.1).
with appreciable uncertainty. This would put
the fluctuations in HD 49933 on the same level as observed in the Sun, and is
significantly lower than our predictions. However, accepting for the moment a
much lower level of fluctuations, we experimented in an ad-hoc fashion by
adding (besides photometric noise) an activity-like signal (assuming a
power-law) to our simulated granulation spectra, and simultaneously scaled
their power and characteristic frequency to enforce correspondence with the
observations. Figure 4 illustrates the outcome after scaling
the power derived from the models by a factor of 0.33 and the frequency by a
factor of 1.6. This resulted in a plausible - albeit not entirely
satisfactory - correspondence. Later we shall try to interpret the scaling in
terms of a change of fundamental stellar parameters (see
Sect. 5.1).
![\begin{figure}
\par\includegraphics[angle=90,width=8.5cm,clip]{1930fig4.ps}
\end{figure}](/articles/aa/full_html/2009/40/aa11930-09/img65.png) |
Figure 4: Like Fig. 3, but with scaled models S0 and S1 (for details see text) and adding an ad-hoc signal for magnetic activity and photometric noise (solid lines). The dashed lines depict the models after scaling without added ad-hoc components. |
| Open with DEXTER | |
5 Discussion
Can we find a reason for the mismatch between model and observation for HD 49933? In the following we discuss the impact of uncertainties in the fundamental parameters and the influence of magnetic activity on the mismatch.
5.1 Uncertainties in the fundamental parameters
As alluded to before, the fundamental parameters of HD 49933 (in particular
![]() ,
,
![]() ,
and
,
and
![]() )
might be noticeably different from the values we
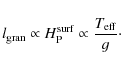
assumed in our modeling. Ludwig (2006) give an approximate relation
between the spatial contrast of the granulation and the photocentric
variability, which can be equivalently stated in terms of the relative
temporal (rms) brightness fluctuations
)
might be noticeably different from the values we
assumed in our modeling. Ludwig (2006) give an approximate relation
between the spatial contrast of the granulation and the photocentric
variability, which can be equivalently stated in terms of the relative
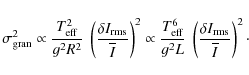
temporal (rms) brightness fluctuations
![]() as
as
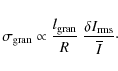
 |
(6) |
When writing the last proportionality, we assumed a constant mean molecular weight. For the total (frequency integrated) power
Introducing the luminosity in the second proportionality in Eq. (7) was motivated by the notion that the accurately known parallax and visual magnitude of HD 49933 essentially fixes its luminosity. Relation (7) is not exact since the scaling of the granular size with stellar parameters is not exactly accounted for; for instance, the formula does not accurately represent the scaling of
The ad-hoc scaling in power and frequency described in Sect. 4.3 to
enforce the correspondence to observations was motivated by Eq. (7),
and by the notion that the granular life-time scales with the atmospheric
acoustic cut-off frequency (Kjeldsen & Bedding 1995; Svensson & Ludwig 2005) as
![]() .
This allows us to associate the scaling factors in
power and characteristic frequency with changes of -200 K in
.
This allows us to associate the scaling factors in
power and characteristic frequency with changes of -200 K in
![]() and
+0.2 dex in
and
+0.2 dex in
![]() of HD 49933 (assuming constant luminosity). Again,
while helping to reduce the present discrepancies, in particular the increase
of the gravity is at odds with the latest determinations of the star's fundamental
parameters.
of HD 49933 (assuming constant luminosity). Again,
while helping to reduce the present discrepancies, in particular the increase
of the gravity is at odds with the latest determinations of the star's fundamental
parameters.
5.2 Influence of magnetic activity
By analogy to the rise of power towards low frequencies due to magnetic
activity in the Sun (Fig. 2), one is tempted to attribute the
rise of power seen in HD 49933 to magnetic activity as well. This is quite
plausible, since the light-curve of HD 49933 exhibits clear signatures of
spottedness (Mosser, private commun.)
. Moreover, HD 49933 is a rather rapid rotator,
favoring dynamo action. However, polarimetric observations (with NARVAL
and ESPADONS) indicate that there is no magnetic field present above
![]()
![]() which is structured on spatial scales of the order of the
stellar radius (Catala et al., in prep.).
This raises the question of what kind of
mechanism could produce the apparently ubiquitous field on smaller scales?
which is structured on spatial scales of the order of the
stellar radius (Catala et al., in prep.).
This raises the question of what kind of
mechanism could produce the apparently ubiquitous field on smaller scales?
There is mounting theoretical and observational evidence (Cattaneo 1999; Trujillo Bueno et al. 2004; Vögler & Schüssler 2007) that dynamo action is possible in convective surface flows generating magnetic fields on very small scales. To investigate whether such magnetic fields can explain the puzzling shape of the spectrum around 1 mHz in HD 49933, we performed exploratory MHD simulations with CO5BOLD (Steffen et al. 2009). They were restricted to two spatial dimensions, and performed for solar atmospheric conditions. We calculated several runs with different, prescribed magnetic flux levels corresponding to field-free to weak plage regions. Figure 5 shows temporal power spectra of the light curves of the simulation runs (not scaled to full disk). Despite that the simulations were tailored to solar conditions, we think that the very similar topology of granular flows among solar-type stars makes them qualitatively also applicable to HD 49933. The power spectra of the light-curves show a trend towards lower power at higher frequencies for increasing total magnetic flux. Obviously, small scale magnetic fields alter the convective dynamics on small spatial scales but do not lead to the formation of structures on large scales which may leave an imprint at lower frequencies in the brightness fluctuations. The results are preliminary, and further work is necessary. However, for the time being we consider it unlikely that local dynamo action in the granular flow - if at all present - can explain the shape of the power spectrum of HD 49933 in the p-mode frequency region.
![\begin{figure}
\par\includegraphics[angle=90,width=8.5cm,clip]{1930fig5.ps}
\end{figure}](/articles/aa/full_html/2009/40/aa11930-09/img76.png) |
Figure 5: Temporal power spectra of the horizontally averaged emergent intensity in vertical direction of different 2D MHD runs assuming different levels of initial field strength (solid lines of different colors/shades of grey). The simulations were performed assuming solar atmospheric parameters. |
| Open with DEXTER | |
Equation (5) shows that a reduction of the granular scale at fixed stellar radius could reduce the observed granulation-related brightness fluctuations. It is known that magnetic fields of sufficient strength have this effect (for a recent example see Jacoutot et al. 2008, and references therein). However, to obtain a sizable reduction one would need a mean field strength of several 100 G. A local dynamo appears unlikely to sustain such magnetic flux levels (Vögler & Schüssler 2007), which leaves us with the need for an efficient generation of magnetic fields on larger scales.
6 Conclusions
3D hydrodynamical model atmospheres can be applied to predict granulation-related disk-integrated brightness fluctuations. We demonstrated that the theoretical approach successfully reproduces the convection-related background signal in the frequency region of the observed solar p-modes. Unexpectedly, we found a mismatch between predicted and observed background when applying the same approach to HD 49933, which we argued is a normal representative among the F-dwarfs observed by CoRoT. We excluded local dynamo action in the granular flow as the culprit for the mismatch. The existence of a magnetic field for other reasons with a large filling factor and sufficient strength (several 100 G) able to noticeably influence the granular dynamics could qualitatively explain the observed low level of granular brightness fluctuations. Whether this is viable from the viewpoint of dynamo theory is unclear. In this context we discussed the observational finding that the star, while magnetically rather active, does not exhibit a magnetic field organized on scales comparable to the stellar radius (Catala et al., in prep.).
Recently suggested new sets of fundamental stellar parameters
for HD 49933 (Kallinger et al. 2008; Bruntt 2009) are unlikely to remove the discrepancy - primarily since they suggest a lower surface gravity than we
assumed in the present modelling. In contrast, when increasing the gravity by
0.2 dex (to about
![]() = 4.45), and decreasing the effective temperature
by 200 K (to about 6550 K) we can enforce a plausible, albeit not
perfect, correspondence between theory and observation. Whether this is
compatible with constraints from stellar structure, 3D atmospheric modelling,
and p-mode excitation needs to be assessed. For the moment we are left with a
puzzling discrepancy between the predicted and observed granulation background
in HD 49933, with only a rather ad-hoc idea for a remedy at hand.
= 4.45), and decreasing the effective temperature
by 200 K (to about 6550 K) we can enforce a plausible, albeit not
perfect, correspondence between theory and observation. Whether this is
compatible with constraints from stellar structure, 3D atmospheric modelling,
and p-mode excitation needs to be assessed. For the moment we are left with a
puzzling discrepancy between the predicted and observed granulation background
in HD 49933, with only a rather ad-hoc idea for a remedy at hand.
The granulation-related brightness fluctuations are sensitive
to the stellar metallicity. A reduction of the metallicity from solar to 1/10
solar reduced the total fluctuation power by a factor of 0.58 at the studied
![]() and
and
![]() .
.
If in the future one is able to devise an observational or theoretical calibration of the granular background signal, its high sensitivity to the surface gravity could render it an effective gravimeter. CoRoT has obtained high-precision photometry for many giants. The stronger convection-related background signal makes this easy to detect and quantify. We consider giants as additional, interesting test cases for our understanding of the dynamics of convective flows on the surface of stars.
Acknowledgements
The authors thank Michel Auvergne for providing information on the change of instrumental sensitivity, and Hans Bruntt for communicating his latest results on the fundamental parameters of HD 49933 before publication. H.G.L. would like to thank Claude Catala for discussions aboutspectroscopy and polarimetry of HD 49933 on several occasions. H.G.L. acknowledges financial support from EU contract MEXT-CT-2004-014265 (CIFIST).
References
- Andersen, B., Appourchaux, T., Crommelynck, D., et al. 1998, in Sounding Solar and Stellar Interiors, ed. J. Provost, & F.-X. Schmider (Kluwer Academic Publishers), IAU Symp. 181, 147 (In the text)
- Appourchaux, T., Michel, E., Auvergne, M., et al. 2008, A&A, 488, 705 [NASA ADS] [CrossRef] [EDP Sciences] (In the text)
- Auvergne, P., Bodin, P., Boisnard, L., et al. 2009, A&A, 506, 411 [CrossRef] [EDP Sciences] (In the text)
- Barban, C., Deheuvels, S., Baudin, F., et al. 2009, A&A, 506, 51 [CrossRef] [EDP Sciences] (In the text)
- Bruntt, H. 2009, A&A, 506, 235 [CrossRef] [EDP Sciences] (In the text)
- Bruntt, H., Bikmaev, I. F., Catala, C., et al. 2004, A&A, 425, 683 [CrossRef] [EDP Sciences] (In the text)
- Bruntt, H., De Cat, P., & Aerts, C. 2008, A&A, 478, 487 [NASA ADS] [CrossRef] [EDP Sciences] (In the text)
- Cattaneo, F. 1999, ApJ, 515, L39 [NASA ADS] [CrossRef] (In the text)
- Freytag, B., Holweger, H., Steffen, M., & Ludwig, H.-G. 1997, in Science with the VLT Interferometer, ed. F. Paresce (Springer), 316 (In the text)
- Freytag, B., Steffen, M., & Dorch, B. 2002, AN, 323, 213 [NASA ADS] (In the text)
- Fröhlich, C., Andersen, B. N., Appourchaux, T., et al. 1997, Sol. Phys., 170, 1 [NASA ADS] [CrossRef]
- García, R. A., Régulo, C., Samadi, R., et al. 2009, A&A, 506, 41 [EDP Sciences]
- Gillon, M., & Magain, P. 2006, A&A, 448, 341 [NASA ADS] [CrossRef] [EDP Sciences] (In the text)
- Guenther, D. B., Kallinger, T., Gruberbauer, M., et al. 2008, ApJ, 687, 1448 [NASA ADS] [CrossRef] (In the text)
- Gustafsson, B., Edvardsson, B., Eriksson, K., et al. 2008, A&A, 486, 951 [NASA ADS] [CrossRef] [EDP Sciences] (In the text)
- Harvey, J. 1985, in Future Missions in Solar, Heliospheric & Space Plasma Physics, ed. E. Rolfe, & B. Battrick, ESA SP, 235, 199 (In the text)
- Jacoutot, L., Kosovichev, A. G., Wray, A., & Mansour, N. N. 2008, ApJ, 684, L51 [NASA ADS] [CrossRef] (In the text)
- Kallinger, T., Gruberbauer, M., Guenther, D. B., Fossati, L., & Weiss, W. W. 2008, A&A, submitted (In the text)
- Kjeldsen, H., & Bedding, T. 1995, A&A, 293, 87 [NASA ADS] (In the text)
- Kurucz, R. L. 2005, MSAIt Suppl., 8, 14 [NASA ADS] (In the text)
- Ludwig, H.-G. 2006, A&A, 445, 661 [NASA ADS] [CrossRef] [EDP Sciences] (In the text)
- Michel, E., Baglin, A., Auvergne, M., et al. 2008, Science, 322, 558 [NASA ADS] [CrossRef] (In the text)
- Michel, E., Samadi, R., Baudin, F., et al. 2009, A&A, 495, 979 [NASA ADS] [CrossRef] [EDP Sciences] (In the text)
- Mihalas, D. 1978, Stellar Atmospheres (Freeman and Company) (In the text)
- Mosser, B., Bouchy, F., Catala, C., et al. 2005, A&A, 431, L13 [NASA ADS] [CrossRef] [EDP Sciences] (In the text)
- November, L. J., Toomre, J., Gebbie, K. B., & Simon, G. W. 1981, ApJ, 245, L123 [NASA ADS] [CrossRef] (In the text)
- Samadi, R., Fialho, F., Costa, J. E. S., et al. 2006, ESA SP 1306, 317, corrected in [arXiv:astro-ph/0703354] (In the text)
- Samadi, R., Belkacem, K., Goupil, M.-J., Ludwig, H.-G., & Dupret, M.-A. 2008, Commun. Asteroseismol., 157, 130 [NASA ADS] (In the text)
- Samadi, R., Ludwig, H.-G., Belkacem, K., Goupil, M.-J., & Dupret, M.-A. 2009, A&A, submitted (In the text)
- Solano, E., Catala, C., Garrido, R., et al. 2005, AJ, 129, 547 [NASA ADS] [CrossRef] (In the text)
- Steffen, M., Ludwig, H. G., & Steiner, O. 2009, in Proc. IAU Symp. 259, Cosmic Magnetic Fields: from Planets, to Stars and Galaxies, ed. K. G. Strassmeier, A. G. Kosovichev and J. E. Beckman, 233 (In the text)
- Svensson, F., & Ludwig, H.-G. 2005, in Stellar Systems, and the Sun, ed. F. Favata, G. Hussain, & B. Battrick (ESA Publications Devision), Proceedings of the 13th Cambridge Workshop on Cool Stars, ESA SP 560, 979, (In the text)
- Trampedach, R., Christensen-Dalsgaard, J., Nordlund, Å., & Stein, R. 1998, in The First MONS Workshop: Science with a Small Space Telescope, ed. H. Kjeldsen, & T. Bedding (Aarhus Universitet), 59 (In the text)
- Trujillo Bueno, J., Shchukina, N., & Asensio Ramos, A. 2004, Nature, 430, 326 [NASA ADS] [CrossRef] (In the text)
- van Leeuwen, F. 2007, A&A, 474, 653 [NASA ADS] [CrossRef] [EDP Sciences] (In the text)
- Vögler, A., & Schüssler, M. 2007, A&A, 465, L43 [NASA ADS] [CrossRef] [EDP Sciences] (In the text)
- Wedemeyer, S., Freytag, B., Steffen, M., Ludwig, H.-G., & Holweger, H. 2004, A&A, 414, 1121 [NASA ADS] [CrossRef] [EDP Sciences] (In the text)
Footnotes
- ... HD 49933
- The CoRoT space mission, launched on December 27th 2006, has been developed and is operated by CNES, with the contribution of Austria, Belgium, Brazil, ESA, Germany and Spain.
- ...
- CIFIST Marie Curie Excellence Team.
All Tables
Table 1: CO5BOLD radiation-hydrodynamics model atmospheres.
Table 2: Fitted parameters of Eq. (3) for the synthetic power spectra of the three hydrodynamical models.
All Figures
| |
Figure 1: Inter-comparison of the raw (solid lines) and fitted (dashed lines) spectra (power spectral density) of the three hydrodynamical simulations. The contribution of box-modes to the fitted signal was left out in the graphs. |
| Open with DEXTER | |
| In the text | |
| |
Figure 2: Power spectra of disk-integrated photometric fluctuations for the Sun: the predicted background signal of model Sun1 (green/grey solid line) and observational data from SOHO/ VIRGO (black solid line). Note the steep decline in power towards high frequencies. |
| Open with DEXTER | |
| In the text | |
| |
Figure 3: Power spectra for HD 49933: dashed lines depict the predictions from models S0 and S1. The solid lines are again the predicted spectra but increased by a constant corresponding to the observed photometric white noise level. The black line depicts the spectrum of HD 49933. The other two solid lines depict spectra of the similar F-dwarfs HD 181420 and HD 181906. |
| Open with DEXTER | |
| In the text | |
| |
Figure 4: Like Fig. 3, but with scaled models S0 and S1 (for details see text) and adding an ad-hoc signal for magnetic activity and photometric noise (solid lines). The dashed lines depict the models after scaling without added ad-hoc components. |
| Open with DEXTER | |
| In the text | |
| |
Figure 5: Temporal power spectra of the horizontally averaged emergent intensity in vertical direction of different 2D MHD runs assuming different levels of initial field strength (solid lines of different colors/shades of grey). The simulations were performed assuming solar atmospheric parameters. |
| Open with DEXTER | |
| In the text | |
Copyright ESO 2009
Current usage metrics show cumulative count of Article Views (full-text article views including HTML views, PDF and ePub downloads, according to the available data) and Abstracts Views on Vision4Press platform.
Data correspond to usage on the plateform after 2015. The current usage metrics is available 48-96 hours after online publication and is updated daily on week days.
Initial download of the metrics may take a while.