| Issue |
A&A
Volume 506, Number 1, October IV 2009
The CoRoT space mission: early results
|
|
|---|---|---|
| Page(s) | 183 - 188 | |
| Section | Stellar structure and evolution | |
| DOI | https://doi.org/10.1051/0004-6361/200911914 | |
| Published online | 04 June 2009 | |
The CoRoT space mission: early results
Mode identification in rapidly rotating stars
D. R. Reese1 - M. J. Thompson1 - K. B. MacGregor2 - S. Jackson2 - A. Skumanich2 - T. S. Metcalfe2
1 - Department of Applied Mathematics, University of Sheffield, Hicks Building, Hounsfield Road, Sheffield S3 7RH, UK
2 -
High Altitude Observatory, National Center for Atmospheric Research,
Boulder, CO 80307, USA
Received 20 February 2009 / Accepted 24 May 2009
Abstract
Context. Recent calculations of pulsation modes in rapidly rotating polytropic models and models based on the Self-Consistent Field method have shown that the frequency spectrum of low degree pulsation modes can be described by an empirical formula similar to Tassoul's asymptotic formula, provided that the underlying rotation profile is not too differential.
Aims. Given the simplicity of this asymptotic formula, we investigate whether it can provide a means by which to identify pulsation modes in rapidly rotating stars.
Methods. We develop a new mode identification scheme which consists in scanning a multidimensional parameter space for the formula coefficients which yield the best-fitting asymptotic spectra. This mode identification scheme is then tested on artificial spectra based on the asymptotic formula, on random frequencies and on spectra based on full numerical eigenmode calculations for which the mode identification is known beforehand. We also investigate the effects of adding random frequencies to mimic the effects of chaotic modes which are also expected to show up in such stars.
Results. In the absence of chaotic modes, it is possible to accurately find a correct mode identification for most of the observed frequencies provided these frequencies are sufficiently close to their asymptotic values. The addition of random frequencies can very quickly become problematic and hinder correct mode identification. Modifying the mode identification scheme to reject the worst fitting modes can bring some improvement but the results still remain poorer than in the case without chaotic modes.
Key words: stars: oscillations - stars: rotation
1 Introduction
Many stars with intermediate or high masses are rapid rotators (e.g. Reese et al. 2008, and references therein). Rapid rotation causes a number of additional physical phenomena which make it much more difficult to model the structure and evolution of these stars. These include centrifugal deformation, gravity darkening, baroclinic flows, various forms of turbulence and transport phenomena (e.g. Rieutord 2006a). Much theoretical work has gone into modelling these stars (e.g. Meynet & Maeder 1997; Roxburgh 2004, 2006; Jackson et al. 2005; MacGregor et al. 2007; Rieutord 2006b; Espinosa Lara & Rieutord 2007). Naturally, such models are subject to uncertainties and therefore require observational constraints. Asteroseismology, the study of stellar pulsations, is currently the best way to probe the internal structure of stars and therefore to constrain such models. A number of recent works have therefore focused on the effects of rapid rotation, and in particular stellar deformation, on stellar pulsations. For acoustic modes, these include studies based on full eigenmode calculations (Espinosa et al. 2004; Lovekin & Deupree 2008; Lovekin et al. 2009; Lignières et al. 2006; Reese et al. 2006, 2009) and studies based on ray dynamics (Lignières & Georgeot 2008,2009). There are also a number of works on other types of pulsation modes. On the observational side, the CoRoT mission is providing stellar pulsation data with unprecedented accuracy. However, in order to exploit such data, it is necessary to correctly match theoretically calculated pulsation modes with observed ones. This process is known as mode identification.
Until now, it has been very difficult to identify pulsation modes in rapidly rotating stars (e.g. Goupil et al. 2005). This is because mode identification requires a proper understanding of the frequency spectrum of these stars. Such an understanding has only been reached recently for acoustic modes. Using ray dynamics, Lignières & Georgeot (2008) and Lignières & Georgeot (2009) recently showed that the acoustic spectrum of a rapidly rotating star is a superposition of spectra from different classes of modes, each with their own frequency organisation. The main classes are island, chaotic, whispering gallery modes and modes corresponding to a periodic orbit of period 6. Of particular interest are the island modes. These are the most visible of the regular modes since they are
the rotating counterparts to modes with low ![]() values. Their frequency organisation has been studied in Lignières et al. (2006); Lignières & Georgeot (2008,2009) and Reese et al. (2008) for polytropic models and in
Reese et al. (2009) for models based on the Self-Consistent Field method
(Jackson et al. 2005; MacGregor et al. 2007). A new asymptotic formula, similar to Tassoul's formula (Tassoul 1980), was derived involving a new set of quantum numbers based on the geometry of these modes. This naturally raises the question as to whether such a formula can be used to identify pulsation modes.
values. Their frequency organisation has been studied in Lignières et al. (2006); Lignières & Georgeot (2008,2009) and Reese et al. (2008) for polytropic models and in
Reese et al. (2009) for models based on the Self-Consistent Field method
(Jackson et al. 2005; MacGregor et al. 2007). A new asymptotic formula, similar to Tassoul's formula (Tassoul 1980), was derived involving a new set of quantum numbers based on the geometry of these modes. This naturally raises the question as to whether such a formula can be used to identify pulsation modes.
In order to address this question, we develop a new mode identification scheme which is described in Sect. 2. In Sect. 3, we run an initial series of tests on the mode identification scheme using frequencies based on the asymptotic formula, random frequencies and numerical frequencies based on full 2D eigenmode calculations. This is then followed by tests using composite spectra in which random frequencies have been added to a set of numerical frequencies. The final section concludes by discussing the results.
2 A new mode identification scheme
Various methods for identifying pulsation modes or detecting underlying regularities in frequency spectra have been invented over the past few years. For instance, Breger et al. (1999) and Breger et al. (2009) have worked with histograms of frequency differences in order to interpret pulsation spectra of
![]() Scuti stars. Other similar techniques include calculating the autocorrelation function or the Fourier transform of the power spectrum to identify the large frequency separation in solar-like pulsators (e.g. Chaplin et al. 2008, and references therein). These procedures yield information on the structure of the frequency spectrum rather than a detailed identification for
each pulsation mode. Another type of approach has consisted in directly comparing the set of observed pulsation modes to numerically calculated
frequency spectra from models in a large parameter space. Given the
computational cost involved in computing each pulsation spectrum, various methods have been created in order to search through parameter space in an intelligent way. For instance, Metcalfe & Charbonneau (2003) and Charpinet et al. (2005)
have used genetic algorithms to find best matching models for white dwarfs and sdB stars, and Bazot et al. (2008) have used a Monte Carlo Markov Chain (MCMC) approach when studying
Scuti stars. Other similar techniques include calculating the autocorrelation function or the Fourier transform of the power spectrum to identify the large frequency separation in solar-like pulsators (e.g. Chaplin et al. 2008, and references therein). These procedures yield information on the structure of the frequency spectrum rather than a detailed identification for
each pulsation mode. Another type of approach has consisted in directly comparing the set of observed pulsation modes to numerically calculated
frequency spectra from models in a large parameter space. Given the
computational cost involved in computing each pulsation spectrum, various methods have been created in order to search through parameter space in an intelligent way. For instance, Metcalfe & Charbonneau (2003) and Charpinet et al. (2005)
have used genetic algorithms to find best matching models for white dwarfs and sdB stars, and Bazot et al. (2008) have used a Monte Carlo Markov Chain (MCMC) approach when studying ![]() Cen A. As opposed to other methods, this type of approach yields potential mode identifications for each frequency in the observed spectrum.
Cen A. As opposed to other methods, this type of approach yields potential mode identifications for each frequency in the observed spectrum.
The mode identification scheme described here combines some of the
characteristics of the previous methods. On the one hand, it would be nice to
get more detailed information than what is available from histograms of frequency differences or autocorrelation functions and Fourier transforms of power spectra. Furthermore, such methods may fail in rapidly rotating stars because the geometric term ![]() due to advection of modes by rotation may
give rise to frequency spacings which are comparable to the separation between
island modes with consecutive
due to advection of modes by rotation may
give rise to frequency spacings which are comparable to the separation between
island modes with consecutive ![]() values (which corresponds to half the
large frequency separation). On the other hand, it is not currently feasible to calculate complete pulsation spectra of rapidly rotating 2D models at each point
in a large multidimensional parameter space, even with schemes such as genetic algorithms or the MCMC approach. A useful compromise is therefore to use an
asymptotic formula to calculate approximate frequency spectra and to explore the parameter space based on the coefficients of this formula in search of best fitting spectra.
values (which corresponds to half the
large frequency separation). On the other hand, it is not currently feasible to calculate complete pulsation spectra of rapidly rotating 2D models at each point
in a large multidimensional parameter space, even with schemes such as genetic algorithms or the MCMC approach. A useful compromise is therefore to use an
asymptotic formula to calculate approximate frequency spectra and to explore the parameter space based on the coefficients of this formula in search of best fitting spectra.
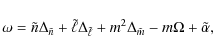
In what follows, we used the following asymptotic formula based on
Reese et al. (2009) to construct approximate frequency spectra:
 |
(1) |
where
A number of preliminary choices are made before applying this method. Suitable ranges of ![]() ,
,
![]() and m values must be selected. These will determine which frequencies are calculated in the asymptotic spectra. Also, bounds must be set for the parameter space. Besides these choices, the set of
observed frequencies is assumed to be sorted in ascending order as this is needed when matching these frequencies with those from the asymptotic spectra. The following procedure is then applied to each point in the parameter space:
and m values must be selected. These will determine which frequencies are calculated in the asymptotic spectra. Also, bounds must be set for the parameter space. Besides these choices, the set of
observed frequencies is assumed to be sorted in ascending order as this is needed when matching these frequencies with those from the asymptotic spectra. The following procedure is then applied to each point in the parameter space:
- 1.
- an artificial spectrum based on the asymptotic formula is created using the values of the different parameters and the ranges chosen for
 ,
,
 and m;
- 2.
- the artificial spectrum is sorted in ascending order using a heapsort method;
- 3.
- the observed frequencies are matched to neighbouring asymptotic frequencies using dichotomy. When two or more observed frequencies are nearest to the same artificial frequency, only the first one is matched to the frequency, the others being matched to following frequencies. In some cases this can produce sub-optimal solutions;
- 4.
- this match between the artificial and observed frequencies yields a mode identification. Based on this mode identification, the formula coefficients are then recalculated through a least-squares minimisation of the standard deviation between the artificial frequencies and the observed ones.
| |
Figure 1: Schematic diagram which shows how one asymptotic spectrum can be compared with a set of observed frequencies to produce a plausible mode identification. |
| Open with DEXTER | |
The search domain is in terms of the following parameters rather than
the original coefficients from the asymptotic formula:
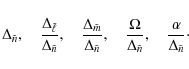
The advantage of working with these parameters is that the artificial spectrum does not need to be sorted again when the value of
It is important to note that the synthetic spectra are periodic with a period equal to
![]() ,
except for the ends where frequencies will be missing due to the cutoff in
,
except for the ends where frequencies will be missing due to the cutoff in ![]() values. As a result of this, it is only necessary to test the parameter
values. As a result of this, it is only necessary to test the parameter
![]() within
a unit interval. Choosing the wrong interval will offset all of the
within
a unit interval. Choosing the wrong interval will offset all of the ![]() values by a fixed amount. Since this is probably one of the least robust parameters, it is likely that the mode identification scheme will only yield relative rather than absolute
values by a fixed amount. Since this is probably one of the least robust parameters, it is likely that the mode identification scheme will only yield relative rather than absolute ![]() values for real stars.
values for real stars.
Table 1: Description of the ``observed'' frequencies and parameters/results from the mode identification scheme.
3 Results
3.1 Initial tests
A number of artificial spectra in which the identification of the frequencies is
known beforehand were used to test the mode identification scheme. These
spectra included artificial frequencies which follow exactly the asymptotic
formula, random frequencies, and frequencies of low and high order modes of a
![]() ZAMS model rotating uniformly at
ZAMS model rotating uniformly at ![]() of the
critical rotation rate (for details on the eigenmode calculations, see Reese et al. 2009). Results from these tests are summarised in Table 1. In cases 1, 2, 4 and 5, 50 frequencies were randomly selected with
of the
critical rotation rate (for details on the eigenmode calculations, see Reese et al. 2009). Results from these tests are summarised in Table 1. In cases 1, 2, 4 and 5, 50 frequencies were randomly selected with
![]() values equal to 0 or 1 and m values between -3 and 3. The
values equal to 0 or 1 and m values between -3 and 3. The ![]() values are given in the fourth
column of Table 1. For cases 1, 2 and 4, this corresponds to 50 out of 84 possible modes, whereas there are 224 possible modes for the last case. Case 3 corresponds to a set of 50 frequencies with random values in the same frequency range as case 2. As such, these frequencies have
no corresponding identifications. The third column gives the standard
deviation
values are given in the fourth
column of Table 1. For cases 1, 2 and 4, this corresponds to 50 out of 84 possible modes, whereas there are 224 possible modes for the last case. Case 3 corresponds to a set of 50 frequencies with random values in the same frequency range as case 2. As such, these frequencies have
no corresponding identifications. The third column gives the standard
deviation
![]() between the frequencies and their asymptotic
approximations, normalised by
between the frequencies and their asymptotic
approximations, normalised by
![]() .
This deviation is defined
as follows:
.
This deviation is defined
as follows:
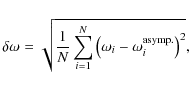 |
(3) |
where N is the number of observed modes,
The mode identification scheme was then applied using the same
![]() and m ranges. The range on
and m ranges. The range on ![]() used by the scheme was chosen to be larger than the range used to generate the observations (except for the first case), as can be seen in the fifth column of Table 1. The bounds of
the parameter space are given in Table 2 along with the values of
the parameters corresponding to the exact solution. The parameter space was discretised using 50 uniformly distributed grid points in each direction, thus
yielding a total of
used by the scheme was chosen to be larger than the range used to generate the observations (except for the first case), as can be seen in the fifth column of Table 1. The bounds of
the parameter space are given in Table 2 along with the values of
the parameters corresponding to the exact solution. The parameter space was discretised using 50 uniformly distributed grid points in each direction, thus
yielding a total of
![]() combinations, except for case 5 where 100 uniformly distributed points were used in each direction. The average computational time was approximately 1 h on a single PC for cases 1-4, and around 20 h for case 5.
combinations, except for case 5 where 100 uniformly distributed points were used in each direction. The average computational time was approximately 1 h on a single PC for cases 1-4, and around 20 h for case 5.
Table 2: Bounds to parameter space and solutions.
![\begin{figure}
\par\includegraphics[width=12cm,clip]{11914fg2.eps}
\end{figure}](/articles/aa/full_html/2009/40/aa11914-09/img42.png) |
Figure 2:
Plots which show the standard deviation,
|
| Open with DEXTER | |
Column 6 of Table 1 gives the success rate in correctly identifying modes, averaged over the 100 best solutions given by the identification scheme. The last column gives the lowest standard deviation between the fitted frequencies and observations, normalised by the
![]() of the output solutions.
of the output solutions.
As could be expected, using frequencies which follow exactly the asymptotic formula yields the best results. Although the exact solution is within the bounds of the parameter space tested, it was not actually found - the nearest grid points yielded mode identifications which were slightly different than the original.
Using low order numerical frequencies does not yield good results, as can be seen from case 2. The reason for this failure seems straightforward. At low
radial orders, the deviations caused by avoided crossings between the
frequencies and their asymptotic values can be substantial. As a result, the
mode identification scheme found erroneous identifications which actually led to
closer fits to the numerical frequencies than the original identifications. This
point is further confirmed by case 3, in which the mode identification
scheme is able to reproduce a set of random frequencies with no underlying
regularities with a standard deviation equal to
![]() .
This is marginally worse than the standard deviation obtained in case 2.
.
This is marginally worse than the standard deviation obtained in case 2.
Going to higher radial orders substantially reduces the deviations between the numerical frequencies and their asymptotic values. This can be seen by comparing the standard deviations of cases 2 and 4 (see 3
![]() Column of Table 1) which shows a tenfold decrease at higher radial
orders. This leads to good results when applying the mode identification scheme. Figure 2 shows a series of ten plots arranged
in triangular form which give an idea of the accuracy of the fits in parameter space. Each plot corresponds to different pairs of parameters, which we shall
generically denote as p1 and p2. The plots show the standard deviation,
Column of Table 1) which shows a tenfold decrease at higher radial
orders. This leads to good results when applying the mode identification scheme. Figure 2 shows a series of ten plots arranged
in triangular form which give an idea of the accuracy of the fits in parameter space. Each plot corresponds to different pairs of parameters, which we shall
generically denote as p1 and p2. The plots show the standard deviation,
![]() ,
as a function of p1 and p2, the remaining variables being
optimised over the parameter space. The colour bar on the righthand side
indicates the meaning of the different colour levels. Since these plots are
based on the parameters after the least-squares adjustment, the different
positions in each plots are actually bins in which only the best solution is
retained. Using the adjusted parameters also means that some regions will be
avoided, and these are indicated in yellow.
,
as a function of p1 and p2, the remaining variables being
optimised over the parameter space. The colour bar on the righthand side
indicates the meaning of the different colour levels. Since these plots are
based on the parameters after the least-squares adjustment, the different
positions in each plots are actually bins in which only the best solution is
retained. Using the adjusted parameters also means that some regions will be
avoided, and these are indicated in yellow.
![\begin{figure}
\par\includegraphics[width=8cm,clip]{11914fg3.eps}
\end{figure}](/articles/aa/full_html/2009/40/aa11914-09/img45.png) |
Figure 3: The average success rate of the 100 best-fitting solutions (solid line) and the success rate of the best solution (dotted line). |
| Open with DEXTER | |
Superimposed on these plots are the positions of the 100 best solutions, as represented by the red crosses. As can be expected, these crosses are concentrated in the dark regions which correspond to the best fits. The white diamonds show the exact solution. The plot in the upper right corner, besides the colour bar, indicates the number of modes correctly identified. As can be seen from these plots, the correct solution has a basin around it which attracts most of the 100 best-fitting solutions. Some other secondary basins around other solutions also appear and attract a few of the best-fitting solutions.
The last case in Table 1 tests the effects of using a larger
range of ![]() values and therefore a sparser set of observed
frequencies. In order to obtain good results, it was necessary to use a finer grid, hence the reason why 100 rather than 50 points were used in each
direction. This need for a higher resolution indicates that the basin around
the exact solution is smaller, probably as a result of the larger range of
values and therefore a sparser set of observed
frequencies. In order to obtain good results, it was necessary to use a finer grid, hence the reason why 100 rather than 50 points were used in each
direction. This need for a higher resolution indicates that the basin around
the exact solution is smaller, probably as a result of the larger range of ![]() values. Once a sufficient grid resolution is chosen, then the mode
identification scheme can yield very good results in spite of the sparseness of
the set.
values. Once a sufficient grid resolution is chosen, then the mode
identification scheme can yield very good results in spite of the sparseness of
the set.
![\begin{figure}
\par\mbox{\includegraphics[width=8.5cm,clip]{11914f4a.eps}\hspace*{1.2cm}
\includegraphics[width=8.5cm,clip]{11914f4b.eps} }\end{figure}](/articles/aa/full_html/2009/40/aa11914-09/img46.png) |
Figure 4: Average success rate as a function of the number of additional random frequencies. The left plot corresponds to low order modes (case 2 of Table 1) and the right plot to high orders (case 4). |
| Open with DEXTER | |
Another interesting test consists in changing the number of observed modes. This has been done for case 4 of Table 1. Two different measurements of the success rate are shown in Fig. 3. The solid line shows the average success rate of the 100 best-fitting solutions whereas the dotted line shows that of the best solution. As the number of observed frequencies decreases, many additional local minima appear in parameter space due to the lower number of constraints. These cause the average success rate to decrease, especially when there are fewer than 30 modes, by attracting an increasing number of the 100 best-fitting solutions away from the true solution. The dotted line, on the other hand, shows that in most cases, the best-fitting solution still remains the true solution. However, in some cases, one or several other local minima with completely different mode identifications produce solutions which fit the observations even better than the true solution, thereby causing a dramatic drop in the accuracy of the best solution. This is illustrated for 11 and 16 observed modes in Fig. 3. As a result, the best-fitting solution must be used with caution.
3.2 Tests with additional random frequencies
As was shown in Lignières & Georgeot (2009) based on geometric visibility calculations, chaotic modes are likely to be visible in the pulsation spectrum of rapidly rotating stars. The frequencies of these modes do not follow an asymptotic formula but rather a statistical distribution. These will naturally make mode identification more difficult as it is not possible to know a priori which modes are regular and which ones are chaotic in an observed frequency spectrum. In order to mimic the presence of chaotic modes, we have done a number of tests in which random frequencies were added to the frequencies from cases 2 and 4 of Table 1.
Figure 4 shows two plots with the average success rate as a function of the number of additional random frequencies, one for case 2 (left panel) and the other for case 4 (right panel). Although low order modes yielded worse results without random frequencies, they seem to be less affected by the presence of random frequencies than high order modes. The reason why the results for high order modes are so poor seems to be that random frequencies shift the basin of best-fitting solutions away from the true solution. Even a small deviation between the two can be sufficient to throw off the identification of modes.
One way of trying to deal with random frequencies is to add another
step in the mode identification procedure. At each point in parameter space, after matching the artificial frequency spectrum with the observed frequencies (step 3 of the procedure described in Sect. 2), one can remove the
![]() worst modes, where
worst modes, where
![]() is a fixed number. Figure 5 illustrates the mode identification procedure with this extra step.
is a fixed number. Figure 5 illustrates the mode identification procedure with this extra step.
Figure 6 shows the effects of removing
![]() frequencies on the average success rate as a function of the number of additional random frequencies. The frequency sets are the same as those used in
the right panel of Fig. 4. The success rate has been calculated only using the modes which have been retained: rejecting non-random frequencies has not been penalised. As can be seen, having a comparable number of random
frequencies to
frequencies on the average success rate as a function of the number of additional random frequencies. The frequency sets are the same as those used in
the right panel of Fig. 4. The success rate has been calculated only using the modes which have been retained: rejecting non-random frequencies has not been penalised. As can be seen, having a comparable number of random
frequencies to
![]() yields the best results. The reason why the results are poor when there are no random frequencies is because additional solutions with lower standard deviations than the original solution are
appearing. This is similar to what happened when the number of observed modes was reduced (see Fig. 3), although this time the problem is worse
because the mode identification is carefully choosing the subset of frequencies so as to reduce the standard deviation. When random frequencies are added, these tend to be rejected rather than the true frequencies, thereby leading to
more favourable results. Even in the best of situations, identifying modes remains difficult when random frequencies are present.
yields the best results. The reason why the results are poor when there are no random frequencies is because additional solutions with lower standard deviations than the original solution are
appearing. This is similar to what happened when the number of observed modes was reduced (see Fig. 3), although this time the problem is worse
because the mode identification is carefully choosing the subset of frequencies so as to reduce the standard deviation. When random frequencies are added, these tend to be rejected rather than the true frequencies, thereby leading to
more favourable results. Even in the best of situations, identifying modes remains difficult when random frequencies are present.
| |
Figure 5:
Same diagram as Fig. 1 except for an
additional step in which the
|
| Open with DEXTER | |
4 Conclusion
In this paper we have created and tested a new method for identifying pulsation
modes in rapidly rotating stars, based on an asymptotic formula for island
modes, the rotating counterparts to acoustic modes with low ![]() values
(Reese et al. 2009; Lignières & Georgeot 2008). This method consists in scanning a parameter
space in search of the formula coefficients which lead to the best agreement
with observations. Results show that it is possible to correctly identify
pulsation modes provided they are sufficiently numerous and their frequencies
close enough to their asymptotic values. Such a situation occurs for
30 or more high order modes, typically in the
values
(Reese et al. 2009; Lignières & Georgeot 2008). This method consists in scanning a parameter
space in search of the formula coefficients which lead to the best agreement
with observations. Results show that it is possible to correctly identify
pulsation modes provided they are sufficiently numerous and their frequencies
close enough to their asymptotic values. Such a situation occurs for
30 or more high order modes, typically in the
![]() range. Bearing in mind that
range. Bearing in mind that ![]() is roughly twice the spherical radial
order, this range is similar to that of the solar p-modes. This method may
apply to
is roughly twice the spherical radial
order, this range is similar to that of the solar p-modes. This method may
apply to ![]() Scuti stars thanks to their numerous pulsation frequencies,
but these will have to be of sufficiently high radial order.
Scuti stars thanks to their numerous pulsation frequencies,
but these will have to be of sufficiently high radial order.
![\begin{figure}
\par\includegraphics[width=9cm]{11914fg6.eps}
\end{figure}](/articles/aa/full_html/2009/40/aa11914-09/img49.png) |
Figure 6:
Average success rate as a function of the number of additional random frequencies. The frequency sets are the same as those used in the right panel of Fig. 4. This time, the
|
| Open with DEXTER | |
However, when even a few random frequencies are added in order to mimic the
presence of chaotic modes, results can become quite poor. Adding an extra step,
in which the worst modes are removed, can bring a small improvement but this
still remains insufficient to enable a reliable mode identification. Recent
calculations by Lignières & Georgeot (2009) suggest that chaotic modes may be as much
as 5 times as numerous as island modes for a star at ![]() of the critical
rotation rate, which is far more than what is considered here. One way to try
to deal with this problem is to start with stars at lower rotation rates, where
a smaller fraction of the modes are chaotic.
of the critical
rotation rate, which is far more than what is considered here. One way to try
to deal with this problem is to start with stars at lower rotation rates, where
a smaller fraction of the modes are chaotic.
One of the weaknesses of this method is the large number of input parameters. These include the ranges on the different quantum numbers and the bounds on parameter space. In order to set these parameters correctly, prior knowledge of the star through other observations will be needed as well as an understanding of the relationships between the coefficients in the asymptotic formula and fundamental stellar parameters such as the mass, age and rotation rate. Such an understanding can only be reachedthrough a systematic study of the frequency spectra of a grid of stellar models.
Potential improvements in this method are as follows. Rather than doing a simple scan of the parameter space, using a more sophisticated search method like a genetic algorithm (e.g. Charpinet et al. 2005; Metcalfe & Charbonneau 2003) or an MCMC method (e.g. Bazot et al. 2008) would enable a more detailed investigation of regions of interest while spending less time in other less important parts of the parameter space. This would be beneficial to case 4 of Table 1 as the solutions that were found were not as optimal as the true solution, and case 5 because the basin around the true solution is smaller. Also, correlating mode visibilities with observed mode amplitudes could provide supplementary constraints. This, of course, is only viable if a simple way to estimate mode visibilities exists. It is then hoped that the results from this method would provide a useful starting point for comparing full 2D calculations with observations.
Acknowledgements
Many of the numerical calculations were carried out on Iceberg (University of Sheffield) and on the Altix 3700 of CALMIP (``CALcul en MIdi-Pyrénées''), both of which are gratefully acknowledged. D.R.R. gratefully acknowledges support from the UK Science and Technology Facilities Council through grant ST/F501796/1, and from the European Helio- and Asteroseismology Network (HELAS), a major international collaboration funded by the European Commission's Sixth Framework Programme. The National Center for Atmospheric Research is sponsored by the National Science Foundation.
References
- Bazot, M., Bourguignon, S., & Christensen-Dalsgaard, J. 2008, Mem. Soc. Astron. Ital., 79, 660 [NASA ADS] (In the text)
- Breger, M., Lenz, P., & Pamyatnykh, A. A. 2009, MNRAS, 601 (In the text)
- Breger, M., Pamyatnykh, A. A., Pikall, H., & Garrido, R. 1999, A&A, 341, 151 [NASA ADS] (In the text)
- Chaplin, W. J., Appourchaux, T., Arentoft, T., et al. 2008, Astron. Nachr., 329, 549 [NASA ADS] [CrossRef] (In the text)
- Charpinet, S., Fontaine, G., Brassard, P., Green, E. M., & Chayer, P. 2005, A&A, 437, 575 [NASA ADS] [CrossRef] [EDP Sciences] (In the text)
- Espinosa, F., Pérez Hernández, F., & Roca Cortés, T. 2004, in SOHO 14 Helio- and Asteroseismology: Towards a Golden Future, ESA SP-559, 424 (In the text)
- Espinosa Lara, F., & Rieutord, M. 2007, A&A, 470, 1013 [NASA ADS] [CrossRef] [EDP Sciences] (In the text)
- Goupil, M.-J., Dupret, M. A., Samadi, R., et al. 2005, JA&A, 26, 249 [NASA ADS] (In the text)
- Jackson, S., MacGregor, K. B., & Skumanich, A. 2005, ApJS, 156, 245 [NASA ADS] [CrossRef] (In the text)
- Lignières, F., & Georgeot, B. 2008, Phys. Rev. E, 78, 016215 [NASA ADS] [CrossRef]
- Lignières, F., & Georgeot, B. 2009, A&A, 500, 1173 [NASA ADS] [CrossRef] [EDP Sciences]
- Lignières, F., Rieutord, M., & Reese, D. 2006, A&A, 455, 607 [NASA ADS] [CrossRef] [EDP Sciences] (In the text)
- Lovekin, C. C., & Deupree, R. G. 2008, ApJ, 679, 1499 [NASA ADS] [CrossRef] (In the text)
- Lovekin, C. C., Deupree, R. G., & Clement, M. J. 2009, ApJ, 693, 677 [NASA ADS] [CrossRef] (In the text)
- MacGregor, K. B., Jackson, S., Skumanich, A., & Metcalfe, T. S. 2007, ApJ, 663, 560 [NASA ADS] [CrossRef] (In the text)
- Metcalfe, T. S., & Charbonneau, P. 2003, J. Comp. Phys., 185, 176 [NASA ADS] [CrossRef] (In the text)
- Meynet, G., & Maeder, A. 1997, A&A, 321, 465 [NASA ADS] (In the text)
- Reese, D. 2008, J. Phys. Conf. Ser., 118, 012023 [NASA ADS] [CrossRef] (In the text)
- Reese, D., Lignières, F., & Rieutord, M. 2006, A&A, 455, 621 [NASA ADS] [CrossRef] [EDP Sciences] (In the text)
- Reese, D., Lignières, F., & Rieutord, M. 2008, A&A, 481, 449 [NASA ADS] [CrossRef] [EDP Sciences] (In the text)
- Reese, D., MacGregor, K. B., Jackson, S., Skumanich, A., & Metcalfe, T. S. 2009, A&A, 506, 189 [CrossRef] [EDP Sciences] (In the text)
- Rieutord, M. 2006a, in Semaine de l'Astrophysique Française, ed. D. Barret, F. Casoli, G. Lagache, A. Lecavelier, & L. Pagani, SF2A-2006, 501 (In the text)
- Rieutord, M. 2006b, A&A, 451, 1025 [NASA ADS] [CrossRef] [EDP Sciences] (In the text)
- Roxburgh, I. W. 2004, A&A, 428, 171 [NASA ADS] [CrossRef] [EDP Sciences] (In the text)
- Roxburgh, I. W. 2006, A&A, 454, 883 [NASA ADS] [CrossRef] [EDP Sciences]
- Tassoul, M. 1980, ApJS, 43, 469 [NASA ADS] [CrossRef] (In the text)
All Tables
Table 1: Description of the ``observed'' frequencies and parameters/results from the mode identification scheme.
Table 2: Bounds to parameter space and solutions.
All Figures
| |
Figure 1: Schematic diagram which shows how one asymptotic spectrum can be compared with a set of observed frequencies to produce a plausible mode identification. |
| Open with DEXTER | |
| In the text | |
| |
Figure 2:
Plots which show the standard deviation,
|
| Open with DEXTER | |
| In the text | |
| |
Figure 3: The average success rate of the 100 best-fitting solutions (solid line) and the success rate of the best solution (dotted line). |
| Open with DEXTER | |
| In the text | |
| |
Figure 4: Average success rate as a function of the number of additional random frequencies. The left plot corresponds to low order modes (case 2 of Table 1) and the right plot to high orders (case 4). |
| Open with DEXTER | |
| In the text | |
| |
Figure 5:
Same diagram as Fig. 1 except for an
additional step in which the
|
| Open with DEXTER | |
| In the text | |
| |
Figure 6:
Average success rate as a function of the number of additional random frequencies. The frequency sets are the same as those used in the right panel of Fig. 4. This time, the
|
| Open with DEXTER | |
| In the text | |
Copyright ESO 2009
Current usage metrics show cumulative count of Article Views (full-text article views including HTML views, PDF and ePub downloads, according to the available data) and Abstracts Views on Vision4Press platform.
Data correspond to usage on the plateform after 2015. The current usage metrics is available 48-96 hours after online publication and is updated daily on week days.
Initial download of the metrics may take a while.