| Issue |
A&A
Volume 505, Number 3, October III 2009
|
|
|---|---|---|
| Page(s) | 1075 - 1086 | |
| Section | Extragalactic astronomy | |
| DOI | https://doi.org/10.1051/0004-6361/200811269 | |
| Published online | 18 August 2009 | |
GALICS. II: the [ /Fe]-mass relation in elliptical galaxies
A. Pipino1 - J. E. G. Devriendt1,2 - D. Thomas3 - J. Silk1 - S. Kaviraj1
1 - Astrophysics, University of Oxford, Denys Wilkinson Building, Keble Road, Oxford OX1 3RH, UK
2 -
Observatoire Astronomique de Lyon, 9 avenue Charles André, 69561 Saint Genis Laval Cedex, France
3 -
Institute of Cosmology and Gravitation, University of Portsmouth, Mercantile House, Hampshire Terrace, Portsmouth, PO1 2EG, UK
Received 31 October 2008 / Accepted 3 August 2009
Abstract
Aims. We test whether the mass- and ![]() -[
-[![]() /Fe] relations in the stellar populations of early-type galaxies can be reproduced by a cosmologically motivated assembly history for spheroids.
/Fe] relations in the stellar populations of early-type galaxies can be reproduced by a cosmologically motivated assembly history for spheroids.
Methods. We implement a detailed treatment for the chemical evolution of H, He, O, and Fe in GalICS, a semi-analytical model for galaxy formation that successfully reproduces basic low- and high-redshift galaxy properties. We take the contribution of supernovae into account (both type Ia and II), as well as low- and intermediate-mass stars, to chemical feedback. The model predictions are compared with the most recent observational results.
Results. We find that the model shows significant improvement at the highest masses with respect to previous work, where the most massive galaxies were also the most ![]() -depleted. In fact the predicted [
-depleted. In fact the predicted [![]() /Fe] ratios in this regime are now marginally consistent with observed values. We show that this result comes from the implementation of AGN quenching of star formation in massive haloes. However, this does not help with the creation of the mass-metallicity relation. Instead, at intermediate masses, the scatter in the predicted [
/Fe] ratios in this regime are now marginally consistent with observed values. We show that this result comes from the implementation of AGN quenching of star formation in massive haloes. However, this does not help with the creation of the mass-metallicity relation. Instead, at intermediate masses, the scatter in the predicted [![]() /Fe] ratios is much larger than the observed dispersion. This problem is related to inadequacies of the model in treating satellite galaxies. In particular, we find an excess of low-mass strongly
/Fe] ratios is much larger than the observed dispersion. This problem is related to inadequacies of the model in treating satellite galaxies. In particular, we find an excess of low-mass strongly ![]() -enhanced satellites.
-enhanced satellites.
Conclusions. The final stellar [![]() /Fe] of a single galaxy is determined by the star formation history summed over all the progenitors. In particular, a longer duration the integrated star formation history leads to a lower
/Fe] of a single galaxy is determined by the star formation history summed over all the progenitors. In particular, a longer duration the integrated star formation history leads to a lower ![]() -enhancement, as might be expected from the results of closed box chemical evolution models. However, non-negligible differences between closed box and hierarchical model predictions are found, due to processes such as dry mergers and hot gas-phase metal recycling in the latter case. These processes help to build up the galactic mass while keeping the
-enhancement, as might be expected from the results of closed box chemical evolution models. However, non-negligible differences between closed box and hierarchical model predictions are found, due to processes such as dry mergers and hot gas-phase metal recycling in the latter case. These processes help to build up the galactic mass while keeping the ![]() element abundance in the stars at a super-solar level. To match the observed mass-[
element abundance in the stars at a super-solar level. To match the observed mass-[![]() /Fe] relation at low and intermediate masses, we suggest that the next generation of semi-analytical model should feature either stellar or AGN feedback schemes that allow galaxies to self-regulate their own star formation history, rather than being crudely linked to the halo mass. At the same time, mechanisms that allow the very old and passively evolving satellite galaxies that do not merge to accrete fresh gas and form stars at later times should be implemented.
/Fe] relation at low and intermediate masses, we suggest that the next generation of semi-analytical model should feature either stellar or AGN feedback schemes that allow galaxies to self-regulate their own star formation history, rather than being crudely linked to the halo mass. At the same time, mechanisms that allow the very old and passively evolving satellite galaxies that do not merge to accrete fresh gas and form stars at later times should be implemented.
Key words: galaxies: elliptical and lenticular, cD - galaxies: abundances - galaxies: formation - galaxies: evolution - galaxies: stellar content
1 Introduction
The cold dark matter (CDM) scenario (Peebles 1982) successfully explains the
growth of the large-scale structure of the universe (Springel et al. 2006). Since, the
original attempts to model the galaxy formation process within the CDM framework
(Kauffmann & White 1993; Cole et al. 1994), several modifications
to the assembly of the baryonic building blocks have been introduced to deal
with the complexity of gas physics. Among the main open issues,
we mention the anti-hierarchical behaviour of the AGNs (e.g. Hasinger
et al. 2005), the evolution of luminosity function with redshift
(e.g. Bundy et al. 2005), and the
increase in mean stellar [![]() /Fe] with galaxy mass (or
/Fe] with galaxy mass (or
![]() )
in elliptical galaxies (e.g., Worthey et al. 1992; Trager et al. 2000; Thomas et al. 2005; Nelan et al. 2005; Bernardi et al. 2006; Graves et al. 2007).
This relationship, together with the old inferred ages, implies that more massive ellipticals formed earlier and faster with respect to smaller objects (Matteucci 1994; Thomas et al. 2005).
)
in elliptical galaxies (e.g., Worthey et al. 1992; Trager et al. 2000; Thomas et al. 2005; Nelan et al. 2005; Bernardi et al. 2006; Graves et al. 2007).
This relationship, together with the old inferred ages, implies that more massive ellipticals formed earlier and faster with respect to smaller objects (Matteucci 1994; Thomas et al. 2005).
Thomas (1999) and Thomas & Kauffmann (1999) were the first to study the chemical enrichment of ![]() and Fe-peak elements in the framework of hierarchical models of galaxy formation. In a very simplistic approach, Thomas (1999) ran chemical evolution simulations over the star formation histories predicted by Kauffmann (1996). However, he
neglected the complex merger history of the galaxies and modelled the galaxies in the closed box approximation. It turned out that the predicted star formation histories of massive elliptical galaxies were too extended to produce
and Fe-peak elements in the framework of hierarchical models of galaxy formation. In a very simplistic approach, Thomas (1999) ran chemical evolution simulations over the star formation histories predicted by Kauffmann (1996). However, he
neglected the complex merger history of the galaxies and modelled the galaxies in the closed box approximation. It turned out that the predicted star formation histories of massive elliptical galaxies were too extended to produce ![]() /Fe ratios consistent with observations. This conclusion was later reinforced by Nagashima et al. (2005), who include a self-consistent treatment of chemical enrichment in semi-analytic galaxy formation models.
/Fe ratios consistent with observations. This conclusion was later reinforced by Nagashima et al. (2005), who include a self-consistent treatment of chemical enrichment in semi-analytic galaxy formation models.
More recently, a plethora of new models have been presented (e.g. Croton et al. 2006; De Lucia et al. 2006; Bower et al. 2006; Cattaneo et al. 2005; Sommerville et al. 2008; Fontanot et al. 2007), and one of
the key new ingredients in these models is feedback from super massive black holes, which either suddenly halt the star formation by triggering a wind or suppress residual star formation at later times in the so-called ``radio mode'' (Croton et al. 2006; Bower et al. 2006), thus controlling the evolution of massive galaxies (Granato et al. 2004). Such a scenario seems to be supported by observations
at both high (e.g. Nesvadba et al. 2006) and low redshifts (Schawinski et al. 2007, 2009).
The preferred mechanism for the assembly
of massive spheroids is a sequence of dissipationless (dry)
mergers (e.g. Kochfar & Burkert 2003). For instance, dry mergers are invoked to explain the so-called boxy ellipticals (e.g., Naab et al. 2006) and linked to the evolution of
the most massive galaxies, including the brightest cluster galaxies (e.g. De Lucia & Blaizot 2007).
In practice, mass assembly still occurs at late times in these models, whereas most of the stars have been formed at high redshift in small sub units.
However, according to other studies
(e.g. Cimatti et al. 2006), star formation and galaxy assembly could have occurred together at high redshift. In fact, the most massive elliptical galaxies (L > L*),
seem to be in place and do not show any signs of significant evolution
in mass since ![]() (Scarlata et al. 2006).
(Scarlata et al. 2006).
As the [![]() /Fe]-mass relation has not been studied in these new generation models,
and since they differ in many respects (e.g. via the adopted cosmology, the merger trees, the star formation histories) from the work
on which Thomas (1999) based his analysis, the aim of this paper is to fill this gap.
/Fe]-mass relation has not been studied in these new generation models,
and since they differ in many respects (e.g. via the adopted cosmology, the merger trees, the star formation histories) from the work
on which Thomas (1999) based his analysis, the aim of this paper is to fill this gap.
To this end we implement a fully self-consistent treatment of chemical
evolution, which includes a robust estimate of the type Ia supernova
rate and of Fe production in GalICS (Hatton et al. 2003, Paper I hereafter), a state-of-the-art semi-analytical model for galaxy formation, and
evolution based on CDM-driven growth of the
structures. Our main goal is to check model predictions against the latest
observational results for the ![]() /Fe-mass relation and the mass-metallicity relation (MMR, e.g. Faber 1973; Bender
et al. 1993; Trager et al. 2000; Thomas et al. 2005; Nelan et al. 2005; Bernardi et al. 2006; Gallazzi et al. 2006; Graves et al. 2007),
that so far could be simultaneously accounted for only by numerical models based on the ``revised monolithic'' approach
(Pipino & Matteucci 2004, PM04).
The new results will be then interpreted in the light of our
previous work with the chemical evolution models (Thomas 1999; PM04).
/Fe-mass relation and the mass-metallicity relation (MMR, e.g. Faber 1973; Bender
et al. 1993; Trager et al. 2000; Thomas et al. 2005; Nelan et al. 2005; Bernardi et al. 2006; Gallazzi et al. 2006; Graves et al. 2007),
that so far could be simultaneously accounted for only by numerical models based on the ``revised monolithic'' approach
(Pipino & Matteucci 2004, PM04).
The new results will be then interpreted in the light of our
previous work with the chemical evolution models (Thomas 1999; PM04).
The structure of the paper is as follows: the main improvements with respect to Paper I are given in Sect. 2; in Sect. 3 the chemical evolution scheme is tested against the Milky Way and the local ellipticals SNIa rate. In Sects. 4-6 the results are presented and discussed, respectively. Conclusions are given in Sect. 7.
2 The model
2.1 The GalICS galaxy formation model
GalICS is a model of hierarchical galaxy formation which combines high
resolution cosmological N-body simulations to describe the dark matter
content of the Universe with semi-analytic prescriptions to follow the
physics of the baryonic matter. GalICS has been thoroughly presented in Paper I, which we refer the reader to for a detailed discussion of the model
assumptions and properties. It has already been used for the study
of the colour-magnitude relation and the progenitor bias of elliptical galaxies (Kaviraj et al. 2005),
the reproduction of the Galex NUV-optical colours (Kaviraj et al. 2007), and
the black-hole mass - ![]() relation (Cattaneo et al. 2005).
It has also been used to explore the consequences the halo-quenching mechanism
(Keres et al. 2005) by Cattaneo et al. (2008, and references
therein).
The above mentioned papers represent a comprehensive set of benchmark tests that we will not
repeat here, but simply point out that results are preserved to a large extent in our
present implementation. We adopt the Paper I model set-up, unless otherwise stated.
relation (Cattaneo et al. 2005).
It has also been used to explore the consequences the halo-quenching mechanism
(Keres et al. 2005) by Cattaneo et al. (2008, and references
therein).
The above mentioned papers represent a comprehensive set of benchmark tests that we will not
repeat here, but simply point out that results are preserved to a large extent in our
present implementation. We adopt the Paper I model set-up, unless otherwise stated.
We briefly summarize the specifications of the cosmological N-body simulation
used to construct the halo merger trees. This simulation is a realization of
a flat cold dark matter universe with a cosmological constant
![]() .
The simulated volume is a cube of side
.
The simulated volume is a cube of side
![]() Mpc, with
Mpc, with
![]() ,
which contains 2563 particles of mass
,
which contains 2563 particles of mass
![]() each, and the cold dark matter power spectrum
was normalised in agreement with the present day abundance of rich
clusters (
each, and the cold dark matter power spectrum
was normalised in agreement with the present day abundance of rich
clusters (
![]() ).
One should bear in mind that the dark
matter simulation cannot resolve haloes less massive than
).
One should bear in mind that the dark
matter simulation cannot resolve haloes less massive than
![]() ,
which implies that a galaxy less massive than
,
which implies that a galaxy less massive than
![]() is formally below our resolution limit.
is formally below our resolution limit.
As hot gas cools and falls to the centre of its dark matter halo,
it settles in a rotationally supported disc. According to Paper I, if the specific
angular momentum of the accreted gas is conserved and starts off with
the specific angular momentum of the dark matter halo,
we assume it forms an exponential disc with scale length ![]() given by (Mo et al. 1998):
given by (Mo et al. 1998):

Galaxies remain pure discs if their disc is globally stable (i.e.
In Paper I galaxy morphologies are predicted according to the ratio of B-band luminosities
of the disc and the bulge components because this ratio correlates well with Hubble type (Simien
& De Vacoulers 1986). In particular,
the galaxy morphology in the model is determined by the ratio of the
B-band luminosities of the disc and bulge components. A morphology
index is defined as
 |
(2) |
Then, following the analysis of observed galaxies made by Baugh et al. (1996), their classification via the index I, is translated into morphological classes by assuming ellipticals have I < 0.219, S0s have 0.219 < I < 0.507, and spirals have I > 0.507. By construction, a pure disc has I=1, whereas a pure bulge has I=0. According to Paper I (to which we refer for a detailed comparison with observations), the morphological mix predicted by GalICS is E:S0:SP+Irr = 17:16:67. This simple prescription is clearly incapable of capturing the complex spectrum of real galaxy morphologies. Therefore, in what follows, we will refer to galaxies with a dominant spheroidal component when I < 0.507, whereas ``spirals'' refer to all other systems. Observationally, the latter group includes not only systems with distinctive spiral morphologies, but also peculiar or irregular systems.
2.2 Chemical evolution
The main novelty of the present version of GalICS is the
implementation of a self-consistent treatment of the chemical
evolution with finite stellar lifetimes and both type Ia and type II
supernovae ejecta. In practice, we follow the chemical evolution of
only four elements, namely H, He, O and Fe. This set of elements is
good enough to characterise our simulated elliptical galaxy from the
chemical evolution point of view as well as small enough in order to
minimise computational resources. In fact, [O/Fe
![]() /Fe]
ratio, since O is by
far the most important
/Fe]
ratio, since O is by
far the most important ![]() element. Such a ratio is a powerful estimator of the duration of star formation (Matteucci & Greggio 1986)
and it will be the primary constraint used in our analysis. Also, the reader should remember that
O is the major contributor to the total
metallicity, therefore its abundance summed with Fe is a good tracer of the total (i.e. summed
over all elements but H and He) metal abundance Z.
element. Such a ratio is a powerful estimator of the duration of star formation (Matteucci & Greggio 1986)
and it will be the primary constraint used in our analysis. Also, the reader should remember that
O is the major contributor to the total
metallicity, therefore its abundance summed with Fe is a good tracer of the total (i.e. summed
over all elements but H and He) metal abundance Z.
In the following the [![]() /Fe] ratio will always refer to
the V-band luminosity-weighted average over the stellar populations
that make a galaxy, unless stated otherwise. This value guarantees a robust comparison with
its observational counterpart, namely to the ``SSP-equivalent''
value inferred from the integrated spectra of elliptical
galaxies. We refer to Pipino et al. (2006) for details
and caveats on the use of``SSP-equivalent'' abundances and abundance ratios
as proxies for the mean properties of a composite stellar populations
like an elliptical galaxy. Here we just mention the main, well-known, problems of the interpretation
of the data by reducing the complexity of a spectrum to a SSP. First of all - and even for an actual SSP - one should take into
account the age-metallicity degeneracy, namely stronger absorption features in the spectra
can arise either because a stellar population is old or because it
is rather metal rich. Moreover, since luminosity-weighted quantities
are strongly affected by the presence of a small fraction of young stars, they
do not always reflect the mean age and composition of the bulk of the population.
/Fe] ratio will always refer to
the V-band luminosity-weighted average over the stellar populations
that make a galaxy, unless stated otherwise. This value guarantees a robust comparison with
its observational counterpart, namely to the ``SSP-equivalent''
value inferred from the integrated spectra of elliptical
galaxies. We refer to Pipino et al. (2006) for details
and caveats on the use of``SSP-equivalent'' abundances and abundance ratios
as proxies for the mean properties of a composite stellar populations
like an elliptical galaxy. Here we just mention the main, well-known, problems of the interpretation
of the data by reducing the complexity of a spectrum to a SSP. First of all - and even for an actual SSP - one should take into
account the age-metallicity degeneracy, namely stronger absorption features in the spectra
can arise either because a stellar population is old or because it
is rather metal rich. Moreover, since luminosity-weighted quantities
are strongly affected by the presence of a small fraction of young stars, they
do not always reflect the mean age and composition of the bulk of the population.
The star formation rate in the disc is

Here
The parameter ![]() ,
which determines the
efficiency of star formation has the same fiducial value of
,
which determines the
efficiency of star formation has the same fiducial value of
![]() (Guiderdoni et al. 1998) adopted in Paper I.
However, we identify the SF recipe as one of the prescriptions
which one can improve upon. For instance,
a short (
106-107 yr) super-Eddington phase in the growth of the central black hole can
provide the accelerated triggering of star formation by means of black hole positive feedback (Silk 2005;
Pipino et al. 2009). In a sense, GalICS already turns gas into stars
at the maximum possible rate during the merger-induced star-burst phase.
A direct implementation of the above recipe
will be tested in the forthcoming version of GalICS.
(Guiderdoni et al. 1998) adopted in Paper I.
However, we identify the SF recipe as one of the prescriptions
which one can improve upon. For instance,
a short (
106-107 yr) super-Eddington phase in the growth of the central black hole can
provide the accelerated triggering of star formation by means of black hole positive feedback (Silk 2005;
Pipino et al. 2009). In a sense, GalICS already turns gas into stars
at the maximum possible rate during the merger-induced star-burst phase.
A direct implementation of the above recipe
will be tested in the forthcoming version of GalICS.
A Salpeter (1955) initial mass function (IMF) that is constant in time over the
range
![]() is assumed for the sake of simplicity and to allow a comparison with previous
work (Thomas 1999, PM04) and with elemental abundances inferred from observations (Thomas et al. 2007).
We warn the reader that several observational studies in the literature
point out problems related to the Salpeter IMF; such as, for instance, the over-prediction
of the M/L ratio in ellipticals (e.g. Humphrey et al. 2006). These claims find support in theoretical efforts to study
the origin of the IMF (e.g. Kroupa 2007).
Nevertheless, PM04 showed that
the majority of the photochemical properties of an elliptical galaxy
can be reproduced with this choice for the IMF and only a slight
modification below 1
is assumed for the sake of simplicity and to allow a comparison with previous
work (Thomas 1999, PM04) and with elemental abundances inferred from observations (Thomas et al. 2007).
We warn the reader that several observational studies in the literature
point out problems related to the Salpeter IMF; such as, for instance, the over-prediction
of the M/L ratio in ellipticals (e.g. Humphrey et al. 2006). These claims find support in theoretical efforts to study
the origin of the IMF (e.g. Kroupa 2007).
Nevertheless, PM04 showed that
the majority of the photochemical properties of an elliptical galaxy
can be reproduced with this choice for the IMF and only a slight
modification below 1 ![]() may be required to solve the above mentioned
issues (e.g. Renzini 2005). Such a modification does not affect the predicted abundance
ratios (Thomas 1999). Also, note that a flatter IMF has been used by
Nagashima et al. (2005). In particular, their galaxies could achieve a supersolar alpha/Fe ratio only when
a top-heavy IMF was adopted during merger-induced starburst. However such an assumption
is not enough (in the context of hierarchical mergers)
to reproducing the correct
may be required to solve the above mentioned
issues (e.g. Renzini 2005). Such a modification does not affect the predicted abundance
ratios (Thomas 1999). Also, note that a flatter IMF has been used by
Nagashima et al. (2005). In particular, their galaxies could achieve a supersolar alpha/Fe ratio only when
a top-heavy IMF was adopted during merger-induced starburst. However such an assumption
is not enough (in the context of hierarchical mergers)
to reproducing the correct ![]() /Fe-mass relation. Therefore we do not repeat the exercise here.
We expect that a flattening of the IMF
regardless of the galaxy mass leads to a overall shift towards
higher values of the predicted [
/Fe-mass relation. Therefore we do not repeat the exercise here.
We expect that a flattening of the IMF
regardless of the galaxy mass leads to a overall shift towards
higher values of the predicted [![]() /Fe] ratio, but does not
affect the slope of the
/Fe] ratio, but does not
affect the slope of the ![]() /Fe-mass relation unless one finds a good reason to
make the IMF flatter as the galactic mass increases (as for the integrated galactic IMF, Weidner & Kroupa 2005). However,
this modification alone seems not to suffice, as recently shown by Recchi et al. (2009).
/Fe-mass relation unless one finds a good reason to
make the IMF flatter as the galactic mass increases (as for the integrated galactic IMF, Weidner & Kroupa 2005). However,
this modification alone seems not to suffice, as recently shown by Recchi et al. (2009).
We adopted the yields
from Iwamoto et al. (1999, and references therein) for both SNIa and
SNII.
The reader should note that a change in the stellar yields will introduce
a systematic offset of a few tenths of a dex in the model predictions (see Thomas
et al. 1999, PM04), hence it might leave room for some fine-tuning
for a suitable choice of stellar nucleosynthesis![]() .
However, being only an offset, this change cannot create nor
modify the slope of the predicted
.
However, being only an offset, this change cannot create nor
modify the slope of the predicted ![]() /Fe-mass relation.
But, most importantly, the successful calibration of our model with element ratios observed in Milky Way stars (see below) does not allow significant modifications of the underlying stellar yields.
/Fe-mass relation.
But, most importantly, the successful calibration of our model with element ratios observed in Milky Way stars (see below) does not allow significant modifications of the underlying stellar yields.
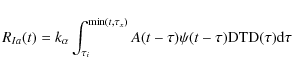
The SNIa rate for a SSP formed at a given time is
calculated assuming the single degenerate scenario and the Matteucci
& Recchi (2001) Delay Time Distribution (DTD). The convolution of
this DTD with ![]() (see Greggio 2005) gives the total SNIa rate, according to the following
equation:
(see Greggio 2005) gives the total SNIa rate, according to the following
equation:
where
 |
(5) |
where
The simulation produced 70 output snapshots spaced logarithmically in the expansion factor from z=100 to 0. This implies that the snapshots are taken at 50-100 Myr intervals at redshifts above 3 and at 200 Myr intervals at later times. Stars - and baryonic processes at the galactic scale that need finer detail - are evolved between time-steps using sub-stepping of at least 1 Myr. During each sub-step, stars release mass and energy into the interstellar medium. In GalICS, the enriched material released in the late stages of stellar evolution is mixed to the cold phase, while the energy released from supernovae is used to re-heat the cold gas and return it to the hot phase in the halo. The re-heated gas can also be ejected from the halo if the potential is shallow enough (see also Paper I). The rate of mass loss in the supernova-driven wind that flows out of the disc is directly proportional to the supernova rate (see below).
The original formula for the chemical processing
of the total metal content (see Paper I) has been extended to the elemental species we
deal with, so that the ejecta in the gas mass from the stellar
population are:
![\begin{displaymath}
{\mathcal E_i}(t) = \!\!\!\int_{m(t)}^\infty \!\psi(t\!-\!t_...
...] Z_{i,{\rm cold}}(t\!- \!t_m) \!+\! m Y_i(m))\phi(m) {\rm d}m
\end{displaymath}](/articles/aa/full_html/2009/39/aa11269-08/img41.png)
where m(t) is the mass of a star having lifetime tm, w(m) is the mass of the remnant left after the star has died, and
2.3 Galaxy evolution and properties
The fundamental assumption is that all galaxies are born as discs at
the centre of a dark matter halo. The transformation of disc stars
into bulge stars and of disc gas into star-bursting gas is due to
bar instabilities and mergers. The
star-bursting gas forms a young stellar population that becomes part of
the bulge stellar population when the stars have reached an age of
100 Myr. We do not readjust the bulge radius when this happens.
The star-burst scale is
![]() with
with
![]() .
.
The fraction of the disc mass transferred to the spheroidal component (the bulge and the star-burst) depends on the mass ratio of the merging galaxies. Separation between a minor and a major merger is defined to be for a mass ratio of 1:3.
According to Paper I, during a merger a fraction X of gas and stars originally sitting in the disc remain in the disc. The rest of the gas from the disc goes into the starburst, as well as its stars. Any stars that were already in the bulge stay in the bulge, but all the gas is consumed in the starburst. All the material (gas and stars) that was originally in a starburst remains in that starburst. Note that gas is never added to the bulge in this process, but that a small amount of gas is generally present in the bulges, coming from stellar mass loss.
2.4 Energetics
The SNII feedback is given by:
where
Equation (7) is applied to find the fraction of
gas in the ISM that is lost by the galaxy and ejected in the intra halo medium.
We then equate the fraction of this gas that is completely ejected from the halo,
to the galaxy/halo escape velocity ratio. The gas ejected from the halo is added
to the halo reservoir where it may subsequently be accreted. There is no specific timescale
for such accretion to occur. In Paper I it is assumed that, when the halo subsequently
accretes dark matter from the background, some of this
dark matter will carry ``primordial'' baryons (i.e with the baryon fraction
![]() ,
and zero
metallicity), and the rest will have the same baryon fraction and metal
content as that of the halo reservoir, up to the point
where the reservoir is fully used up. In Paper I this effect is parametrized
with the halo recycling efficiency
,
and zero
metallicity), and the rest will have the same baryon fraction and metal
content as that of the halo reservoir, up to the point
where the reservoir is fully used up. In Paper I this effect is parametrized
with the halo recycling efficiency
![]() (see Hatton et al. 2003, for details).
(see Hatton et al. 2003, for details).
In contrast to chemical evolution models as PM04, where the total Ia+II SNe feedback
is sufficient to halt the SF, Paper I relies onto the observed correlation between black-hole mass and velocity dispersion
(Ferrarese & Merrit 2000; Gebhardt et al. 2000), and simply mimics the AGN feedback by preventing the gas from cooling in a halo
which has a mass above the critical value of ![]()
![]() to quench cold gas accretion.
Another halo-quenching mechanism has been implemented into GalICS by Cattaneo et al. (2008), who
showed how this further refinement leads to a better agreement between
our model predictions and SDSS observations of the luminosity function
and the colour bimodality (Baldry et al. 2004). We also tested models in
which we implemented Cattaneo et al.'s recipe. Since this modification does not significantly change our findings
we will present the results obtained with the original Hatton et al. (2003) model.
to quench cold gas accretion.
Another halo-quenching mechanism has been implemented into GalICS by Cattaneo et al. (2008), who
showed how this further refinement leads to a better agreement between
our model predictions and SDSS observations of the luminosity function
and the colour bimodality (Baldry et al. 2004). We also tested models in
which we implemented Cattaneo et al.'s recipe. Since this modification does not significantly change our findings
we will present the results obtained with the original Hatton et al. (2003) model.
3 Calibration of the model
To provide a consistency check for our model, we adopt a procedure typical of chemical evolution studies. We first compare MW-like galaxies in our simulations with the known properties of our galaxy. We, then, check that the predictions of the present-day SNIa in both spiral and elliptical galaxies match the observed values.
3.1 Comparison to the abundances in the stars of the Milky Way
Since many properties of such galaxies have already been tested in the calibration of Paper I, here we use the same selection criteria for MW-like galaxies namely
In Fig. 1 we compare the [O/Fe] ratio as a function of [Fe/H]
in the stars of the MW-like spirals predicted by GalICS to observations.
As the metallicity in the range [-1.5, 0] pertains to the typical composition
of the MW disc stars, and since GalICS cannot model MW halo stars, we
show the predictions only for the disc component of the MW-like galaxies.
The points are observations for individual stars in the MW disc taken from the compilation by François et al. (2004),
whereas the solid line give the typical predicted trend, averaged
over the model galaxies.
The dotted lines bracket the region of the plane [Fe/H]-[O/Fe] where ![]() 90% of our model predictions
lie.
The agreement with the overall trend observed in our own Galaxy
makes us confident that the model is correctly calibrated.
Unfortunately, due to the metallicity resolution (five bins in total metallicity Z,
namely 0.001, 0.004, 0.008, 0.02 and 0.04) of the code and
the fact that galaxies are identified only once their host
DM haloes are quite massive (
90% of our model predictions
lie.
The agreement with the overall trend observed in our own Galaxy
makes us confident that the model is correctly calibrated.
Unfortunately, due to the metallicity resolution (five bins in total metallicity Z,
namely 0.001, 0.004, 0.008, 0.02 and 0.04) of the code and
the fact that galaxies are identified only once their host
DM haloes are quite massive (
![]() ),
we cannot explore the region at [Fe/H] < -1.5.
),
we cannot explore the region at [Fe/H] < -1.5.
![\begin{figure}
\par\includegraphics[width=8cm,clip]{11269fg1.eps}
\end{figure}](/articles/aa/full_html/2009/39/aa11269-08/img56.png) |
Figure 1: The solid line shows the average [O/Fe] as a function of [Fe/H] as predicted by GalICS for a MW-like spirals. The dotted lines bracket the region where GalICS predictions are. Triangles: observational data for individual stars in the MW disc as compiled and homogenised by François et al. (2004). |
| Open with DEXTER | |
3.2 Present-day SNIa rate
We now verify that the model galaxies predict a present-day
morphology-dependent SNIa rate in agreement with observations.
The MW-like spirals presented above exhibit a SNIa rate of 0.09 SNuM
(i.e. specific SN explosion rate in units of
![]() of stars per century),
which is in fair agreement with the observational estimates
(
0.06-0.015+0.019 for S0a/b and
0.14-0.035+0.045 for
Sbc/d, respectively, see Mannucci et al. 2008) given the fact the GalICS does not allow a finer
morphological classification.
In particular, in order to reproduce the present-day observed
SNIa rate, we assume A=0.0025 which is the value typically
adopted in chemical evolution models of the Milky Way (see
Matteucci et al. 2006).
of stars per century),
which is in fair agreement with the observational estimates
(
0.06-0.015+0.019 for S0a/b and
0.14-0.035+0.045 for
Sbc/d, respectively, see Mannucci et al. 2008) given the fact the GalICS does not allow a finer
morphological classification.
In particular, in order to reproduce the present-day observed
SNIa rate, we assume A=0.0025 which is the value typically
adopted in chemical evolution models of the Milky Way (see
Matteucci et al. 2006).
Once this check is done, we can also compare the prediction for the SNIa
rate in ellipticals to the observed rate.
As shown in Fig. 2 the vast majority of our simulated ellipticals
exhibit a present-day SNIa rate within 1![]() from the observational mean value given by Mannucci et al. (2008) for ellipticals.
The few objects that have an SNIa rate higher than
the observational range in Fig. 2,
are intermediate mass galaxies with a luminosity-weighted age lower than
7 Gyr. They experienced a relatively recent star formation
with respect to the bulk of the population and, hence, have a higher
supernova rate. We will see that they have the lowest [
from the observational mean value given by Mannucci et al. (2008) for ellipticals.
The few objects that have an SNIa rate higher than
the observational range in Fig. 2,
are intermediate mass galaxies with a luminosity-weighted age lower than
7 Gyr. They experienced a relatively recent star formation
with respect to the bulk of the population and, hence, have a higher
supernova rate. We will see that they have the lowest [![]() /Fe] ratios.
This test basically guarantees that, given the star formation history
of the model galaxies, we have calibrated the uncertainties
in the progenitor nature and delay time distribution of SNIa which are
incorporated in the parameter A (see Eq. (4)).
/Fe] ratios.
This test basically guarantees that, given the star formation history
of the model galaxies, we have calibrated the uncertainties
in the progenitor nature and delay time distribution of SNIa which are
incorporated in the parameter A (see Eq. (4)).
As a result, the Fe production rate from SNIa is also calibrated.
![\begin{figure}
\par\includegraphics[width=8cm,clip]{11269fg2.eps}
\end{figure}](/articles/aa/full_html/2009/39/aa11269-08/img58.png) |
Figure 2:
Present-day SNIa rate in SNuM units as a function of the
galactic mass for our model ellipticals (black crosses). The hatched region
outlines the 1 |
| Open with DEXTER | |
4 The  - and mass-[/Fe] relations
4.1 Overall trends
![\begin{figure}
\par\includegraphics[width=7.5cm,clip]{11269fg3.eps}\par\vspace*{2mm}
\includegraphics[width=7.5cm,clip]{11269fg4.eps}
\end{figure}](/articles/aa/full_html/2009/39/aa11269-08/img59.png) |
Figure 3:
The |
| Open with DEXTER | |
![\begin{figure}
\par\includegraphics[width=8cm,clip]{11269fg5.eps}
\end{figure}](/articles/aa/full_html/2009/39/aa11269-08/img60.png) |
Figure 4:
Normalized distribution of central galaxies ( left column) and elliptical galaxies with a bulge to
total ratio larger than 0.8 ( right column, see text) as a function of the [ |
| Open with DEXTER | |
From this section onwards we deal with the main novelty
of the present work, namely the study of the predicted
![]() /Fe-mass relation and its comparison to observations.
To be consistent with observed values, we present
luminosity-weighted values which take into account the disc
component (if any).
We stress, however, that the mass-weighted quantities
do not differ much from the luminosity-weighted ones
especially at the high mass end of the sample,
where star formation has been suppressed at high redshift.
Here we present our predictions for the [
/Fe-mass relation and its comparison to observations.
To be consistent with observed values, we present
luminosity-weighted values which take into account the disc
component (if any).
We stress, however, that the mass-weighted quantities
do not differ much from the luminosity-weighted ones
especially at the high mass end of the sample,
where star formation has been suppressed at high redshift.
Here we present our predictions for the [![]() /Fe]
ratio in the whole galaxy
and consistently compare them to the recent observational
estimates by Thomas et al. (2007).
Thomas et al. (2007) have collected a magnitude-limited sample of 1652 elliptical galaxies in the redshift
range
0.05 < z < 0.055 with apparent r-band magnitude brighter than 16.8 from the
SDSS Data Release 4. The most radical difference with respect to other galaxy samples
constructed from SDSS is their choice of pure morphological selection of galaxy type by visual inspection.
An important improvement in this approach is that stellar
population and emission line templates are fitted simultaneously to the galaxy spectrum.
On each spectrum, Thomas et al., then measure the 25 standard Lick absorption line indices following
the index definitions of Trager et al. (1998).
The stellar population models of Thomas et al. (2003, 2004) are used to derive luminosity-weighted ages, metallicities, and
/Fe]
ratio in the whole galaxy
and consistently compare them to the recent observational
estimates by Thomas et al. (2007).
Thomas et al. (2007) have collected a magnitude-limited sample of 1652 elliptical galaxies in the redshift
range
0.05 < z < 0.055 with apparent r-band magnitude brighter than 16.8 from the
SDSS Data Release 4. The most radical difference with respect to other galaxy samples
constructed from SDSS is their choice of pure morphological selection of galaxy type by visual inspection.
An important improvement in this approach is that stellar
population and emission line templates are fitted simultaneously to the galaxy spectrum.
On each spectrum, Thomas et al., then measure the 25 standard Lick absorption line indices following
the index definitions of Trager et al. (1998).
The stellar population models of Thomas et al. (2003, 2004) are used to derive luminosity-weighted ages, metallicities, and ![]() /Fe
ratios by means of a fit to all 25 indices.
/Fe
ratios by means of a fit to all 25 indices.
We also note that the observed radial
gradient slope in the [![]() /Fe] has, on average, a null value (e.g. Mehlert et al. 2003; Rawle et al. 2008,
from the observational point of view; Pipino et al. 2008, for the models).
Hence, any impact on the slope of the [
/Fe] has, on average, a null value (e.g. Mehlert et al. 2003; Rawle et al. 2008,
from the observational point of view; Pipino et al. 2008, for the models).
Hence, any impact on the slope of the [![]() /Fe]-mass relation
because of aperture effects due to the fixed fiber size in the SDSS, is negligible.
/Fe]-mass relation
because of aperture effects due to the fixed fiber size in the SDSS, is negligible.
The results for our fiducial GalICS version are presented in Fig. 3,
where we present our models as points (in particular crosses refer to satellite galaxies,
whereas diamonds represent central galaxies) and Thomas et al. (2007)'s
data as contours. We also show a fit to the Thomas et al. data by means of a solid line
to help the visualization of the mean [![]() /Fe] at a given mass.
We note a factor of 2 offset between our mass scale and the one used by Thomas et al. (2007).
This is due to the fact that Thomas et al. derived the dynamical masses from the measure of the line of
sight velocity dispersion and how they selected their sample.
We remind the reader that we classify as ellipticals galaxies that have I < 0.219.
Galaxies with bulge-to-total luminosity ratio larger than, e.g., 0.8 amount to
/Fe] at a given mass.
We note a factor of 2 offset between our mass scale and the one used by Thomas et al. (2007).
This is due to the fact that Thomas et al. derived the dynamical masses from the measure of the line of
sight velocity dispersion and how they selected their sample.
We remind the reader that we classify as ellipticals galaxies that have I < 0.219.
Galaxies with bulge-to-total luminosity ratio larger than, e.g., 0.8 amount to ![]() 50% of the points shown
in Fig. 3. In particular, they typically
correspond to central galaxies (diamonds, upper panel of Fig. 3) with mass >
50% of the points shown
in Fig. 3. In particular, they typically
correspond to central galaxies (diamonds, upper panel of Fig. 3) with mass >
![]() .
No significant changes in the conclusions for central galaxies are obtained if only these objects are
compared to observations (cf. Fig. 4).
.
No significant changes in the conclusions for central galaxies are obtained if only these objects are
compared to observations (cf. Fig. 4).
We notice that the most massive galaxies attain a typical level of ![]() -enhancement
that is only 1
-enhancement
that is only 1![]() off (below) the value suggested by the observations at a given mass.
This is an improvement with respect to the situation depicted by Thomas (1999) and Nagashima et al. (2005), where the most
massive galaxies harboured the most
off (below) the value suggested by the observations at a given mass.
This is an improvement with respect to the situation depicted by Thomas (1999) and Nagashima et al. (2005), where the most
massive galaxies harboured the most ![]() -depleted stellar populations. As we will see in Sect. 4.2, fundamental ingredients are the fact that
i) these galaxies assemble through dry (gas-poor) mergers and ii) assemble most of their mass over a very short time-scale.
Indeed, this ensures that the pollution from SNIa is kept at
a low level and, hence, that they maintain a super-solar [
-depleted stellar populations. As we will see in Sect. 4.2, fundamental ingredients are the fact that
i) these galaxies assemble through dry (gas-poor) mergers and ii) assemble most of their mass over a very short time-scale.
Indeed, this ensures that the pollution from SNIa is kept at
a low level and, hence, that they maintain a super-solar [![]() /Fe] ratio in their stars.
In order to meet condition i), low-mass and highly
/Fe] ratio in their stars.
In order to meet condition i), low-mass and highly ![]() -enhanced building blocks are needed at high redshift.
Indeed, GalICS predicts that a small number of these (crosses in the upper panel of Fig. 3), with masses
-enhanced building blocks are needed at high redshift.
Indeed, GalICS predicts that a small number of these (crosses in the upper panel of Fig. 3), with masses ![]()
![]() should
survive down to redshift zero. Unfortunately, such galaxies are not observed in such a high number
should
survive down to redshift zero. Unfortunately, such galaxies are not observed in such a high number![]() .
We will discuss this problem in greater detail in Sect. 6.
More massive galaxies tend to be older than lower mass ones (see also Sect. 4.2),
in agreement with observations and at variance with Thomas (1999)'s and Nagashima et al. (2005)'s findings.
.
We will discuss this problem in greater detail in Sect. 6.
More massive galaxies tend to be older than lower mass ones (see also Sect. 4.2),
in agreement with observations and at variance with Thomas (1999)'s and Nagashima et al. (2005)'s findings.
As far as the [![]() /Fe]-mass relation for the entire sample is concerned,
in agreement with Nagashima et al. (2005), the
/Fe]-mass relation for the entire sample is concerned,
in agreement with Nagashima et al. (2005), the ![]() /Fe ratios do not show any correlation with mass (Fig. 3, top panel).
A linear fit of the simulation results in the [
/Fe ratios do not show any correlation with mass (Fig. 3, top panel).
A linear fit of the simulation results in the [![]() /Fe]-mass plane would give a flat relationship (excluding
the lowest mass objects). Whilst the
simulations seem to produce decreasing [
/Fe]-mass plane would give a flat relationship (excluding
the lowest mass objects). Whilst the
simulations seem to produce decreasing [![]() /Fe] ratios with increasing galaxy mass
for masses below
/Fe] ratios with increasing galaxy mass
for masses below ![]()
![]() ,
we notice an upturn at the high-mass end, as in
the case of central galaxies (diamonds in the upper panel of Fig. 3).
However, a linear fit of the [
,
we notice an upturn at the high-mass end, as in
the case of central galaxies (diamonds in the upper panel of Fig. 3).
However, a linear fit of the [![]() /Fe]-mass relation for central galaxies would return a positive,
yet significantly flatter, trend (dashed line, Fig. 3, top panel).
The reader should note that even if we offset our mass scale in order to match the Thomas et al. (2007) one, the
slope of the predicted the average trend (dashed line in the upper panel of Fig. 3, see below) will not change.
Also, the average
/Fe]-mass relation for central galaxies would return a positive,
yet significantly flatter, trend (dashed line, Fig. 3, top panel).
The reader should note that even if we offset our mass scale in order to match the Thomas et al. (2007) one, the
slope of the predicted the average trend (dashed line in the upper panel of Fig. 3, see below) will not change.
Also, the average ![]() -enhancement at a given mass is lower than the observed value.
At intermediate masses, instead, the predicted scatter is larger than the observed one.
Finally, central galaxies (diamonds in the upper panel of Fig. 3) do exhibit a somehow smaller scatter than the entire sample
of model ellipticals. This happens because the baryonic mass is more strongly correlated with the mass of the DM halo in a fashion
similar to the behaviour of the
-enhancement at a given mass is lower than the observed value.
At intermediate masses, instead, the predicted scatter is larger than the observed one.
Finally, central galaxies (diamonds in the upper panel of Fig. 3) do exhibit a somehow smaller scatter than the entire sample
of model ellipticals. This happens because the baryonic mass is more strongly correlated with the mass of the DM halo in a fashion
similar to the behaviour of the ![]() /Fe-
/Fe-![]() relation (lower panel of Fig. 3, see below)
than for the rest of the model galaxies. In order to look at the central galaxy properties in more
detail, in Fig. 4 we show the
normalized distribution of central galaxies (left column) and elliptical galaxies with a bulge to
total ratio larger than 0.8 (right column, see above) as a function of the [
relation (lower panel of Fig. 3, see below)
than for the rest of the model galaxies. In order to look at the central galaxy properties in more
detail, in Fig. 4 we show the
normalized distribution of central galaxies (left column) and elliptical galaxies with a bulge to
total ratio larger than 0.8 (right column, see above) as a function of the [![]() /Fe] ratio in different
mass slices. The hatched histograms refer to our model prediction, whereas the empty histograms
are for Thomas et al.'s data. Note the tail at low [
/Fe] ratio in different
mass slices. The hatched histograms refer to our model prediction, whereas the empty histograms
are for Thomas et al.'s data. Note the tail at low [![]() /Fe] in the model predictions not
present in the data. Even if the model predictions were able to reproduce the mean
[
/Fe] in the model predictions not
present in the data. Even if the model predictions were able to reproduce the mean
[![]() /Fe] at a given mass, the distributions would still differ.
/Fe] at a given mass, the distributions would still differ.
Similar results are obtained when plotting the [![]() /Fe] as a function of
the stellar velocity dispersion
/Fe] as a function of
the stellar velocity dispersion ![]() (Fig. 3, bottom panel).
Comparing the two panels in Fig. 3,
we notice that the scatter is reduced and that the galaxies
follow a trend which is closer to the observational
results. We can understand this as we expect the
velocity dispersion to be more correlated with the properties
of the DM host haloes, whereas the baryonic mass
is more sensitive to our modelling of feedback processes.
However, one should bear in mind that GalICS
assumes virialization and a fixed density profile (see Paper I)
to calculate
(Fig. 3, bottom panel).
Comparing the two panels in Fig. 3,
we notice that the scatter is reduced and that the galaxies
follow a trend which is closer to the observational
results. We can understand this as we expect the
velocity dispersion to be more correlated with the properties
of the DM host haloes, whereas the baryonic mass
is more sensitive to our modelling of feedback processes.
However, one should bear in mind that GalICS
assumes virialization and a fixed density profile (see Paper I)
to calculate ![]() .
Whilst these assumptions are reasonable at z=0,
they very likely should be revised
at high redshifts.
.
Whilst these assumptions are reasonable at z=0,
they very likely should be revised
at high redshifts.
If we consider the subsample of galaxies whose luminosity-weighted
ages are larger than 10 Gyr (lighter asterisks in the lower panel of Fig. 3),
we notice the paucity of galaxies populating the region below the observed
area in the [![]() /Fe]-mass plane.
We attribute this to the fact that these galaxies live
in massive haloes where the original AGN feedback
implemented in GalICS halted the cooling in the gas a long time ago.
Indeed, by looking at the asterisks in the lower panel of Fig. 3, they seem to better
correlate with sigma than the entire population. This is because of the way AGN feedback is modelled.
The same is true if we adopt the the halo-quenching mechanism introduced in GaLICS by Cattaneo et al. (2008).
This finding confirms the interpretation of the [
/Fe]-mass plane.
We attribute this to the fact that these galaxies live
in massive haloes where the original AGN feedback
implemented in GalICS halted the cooling in the gas a long time ago.
Indeed, by looking at the asterisks in the lower panel of Fig. 3, they seem to better
correlate with sigma than the entire population. This is because of the way AGN feedback is modelled.
The same is true if we adopt the the halo-quenching mechanism introduced in GaLICS by Cattaneo et al. (2008).
This finding confirms the interpretation of the [![]() /Fe] ratios below
the observed range as being related to too long a duration of star formation,
as we will discuss below.
/Fe] ratios below
the observed range as being related to too long a duration of star formation,
as we will discuss below.
Moreover, we note that the scatter is still much larger
than the observed one and that, for a given velocity
dispersion, the model galaxies tend to have on average a lower [![]() /Fe] ratio
than the observed ones.
The latter problem can be handled in several ways
/Fe] ratio
than the observed ones.
The latter problem can be handled in several ways![]() (stellar yields, IMF,
feedback, SF efficiency), whereas the former is
intrinsic to the model and linked
to the nature of the merger process where
the scatter in the duration of individual SF histories augments
as galaxies merge together.
(stellar yields, IMF,
feedback, SF efficiency), whereas the former is
intrinsic to the model and linked
to the nature of the merger process where
the scatter in the duration of individual SF histories augments
as galaxies merge together.
In order to better understand the origin of this scatter, we now
focus on those few selected galaxies with the same mass, but very
different [O/Fe] and we study their star formation histories.
We perform this exercise for typical ellipticals of ![]()
![]() but
the results apply also to massive ellipticals of
but
the results apply also to massive ellipticals of ![]()
![]() .
.
4.2 The star formation history in detail
We present the analysis in the ![]()
![]() mass range, where
most of the predicted galaxies scatter outside the region of the observed
values.
A useful test for understanding the behaviour of such galaxies
is provided by running chemical evolution models with the same
stellar yields, IMF and the same integral star formation rate
as the selected semi-analytic galaxies.
We are aware that the predictions from chemical evolution models that deal with the formation
and evolution of single galaxies under the monolithic framework might be very different from
the GalICS predictions. For instance, numerical models based on the monolithic approach
often lack a background cosmological framework (but see, e.g. Merlin & Chiosi 2006), hence the lack of mergers and differences in feedback are important
caveat that the reader should keep in mind. Nevertheless, since the constraints on the duration of the SFH arising from the
observed
mass range, where
most of the predicted galaxies scatter outside the region of the observed
values.
A useful test for understanding the behaviour of such galaxies
is provided by running chemical evolution models with the same
stellar yields, IMF and the same integral star formation rate
as the selected semi-analytic galaxies.
We are aware that the predictions from chemical evolution models that deal with the formation
and evolution of single galaxies under the monolithic framework might be very different from
the GalICS predictions. For instance, numerical models based on the monolithic approach
often lack a background cosmological framework (but see, e.g. Merlin & Chiosi 2006), hence the lack of mergers and differences in feedback are important
caveat that the reader should keep in mind. Nevertheless, since the constraints on the duration of the SFH arising from the
observed ![]() -enhancement are always inferred by means of a chemical evolution model, it is important
to compare the two approaches. Particular care has been dedicated to the fact that both GalICS
and the PM04 model have the same IMF, stellar yields, SNIa DTD, namely the main actors as far as
the chemical evolution is concerned.
In Figs. 5 and 6, we present the integral star formation history (summed
over all progenitors) of two galaxies of the same mass as a function of look-back time (solid lines).
-enhancement are always inferred by means of a chemical evolution model, it is important
to compare the two approaches. Particular care has been dedicated to the fact that both GalICS
and the PM04 model have the same IMF, stellar yields, SNIa DTD, namely the main actors as far as
the chemical evolution is concerned.
In Figs. 5 and 6, we present the integral star formation history (summed
over all progenitors) of two galaxies of the same mass as a function of look-back time (solid lines).
![\begin{figure}
\par\includegraphics[width=7.5cm,clip]{11269fg6.eps}
\end{figure}](/articles/aa/full_html/2009/39/aa11269-08/img64.png) |
Figure 5:
Integral star formation history for a |
| Open with DEXTER | |
In general, the integral
star formation history appears to be broader than
the one obtained by means of a monolithic collapse
which would predict the same [![]() /Fe] ratio.
Indeed when we force the SFH pictured in
Fig. 5 (solid line) to happen in a standard chemical evolution
model (PM04), the predicted [O/Fe] is lower by 0.2 dex than that
obtained with GalICS. This brings the galaxy from a value of [
/Fe] ratio.
Indeed when we force the SFH pictured in
Fig. 5 (solid line) to happen in a standard chemical evolution
model (PM04), the predicted [O/Fe] is lower by 0.2 dex than that
obtained with GalICS. This brings the galaxy from a value of [![]() /Fe]=0.31 down to
a value of [
/Fe]=0.31 down to
a value of [![]() /Fe]=0.12. This partly explains why our results at the high mass
end lie closer to the observational values than those in Thomas (1999), who
adopted a closed-box chemical evolution model and predicted [
/Fe]=0.12. This partly explains why our results at the high mass
end lie closer to the observational values than those in Thomas (1999), who
adopted a closed-box chemical evolution model and predicted [![]() /Fe] as low as 0 for
the most massive galaxies. The rest of the difference between Thomas (1999)'s findings and our results
is due to the dramatic
improvement in the star formation histories predicted by the most recent
hierarchical models (cf. Fig. 9, this work, as well as Fig. 10 in De Lucia et al. 2006; or Figs. 5 and 6 in Cattaneo et al. 2008).
/Fe] as low as 0 for
the most massive galaxies. The rest of the difference between Thomas (1999)'s findings and our results
is due to the dramatic
improvement in the star formation histories predicted by the most recent
hierarchical models (cf. Fig. 9, this work, as well as Fig. 10 in De Lucia et al. 2006; or Figs. 5 and 6 in Cattaneo et al. 2008).
![\begin{figure}
\par\includegraphics[width=7.8cm,clip]{11269fg7.eps}
\end{figure}](/articles/aa/full_html/2009/39/aa11269-08/img67.png) |
Figure 6:
Integral star formation history for a |
| Open with DEXTER | |
The galaxy whose SFH is portrayed
in Fig. 5 has 9 progenitors with 4 of them
merging very early on (i.e. at z < 4.7), and which is
passively evolving from red-shift 2.
Looking at Fig. 5 (dashed and dotted lines) we see that all the progenitors
of this galaxy actually have individual SF time-scales which are shorter
than the one that would be inferred from the mass-weighted SFH of the galaxy
itself.
To better explain this point, we consider the ideal case in
which we have only two progenitors with the same masses, similar star formation histories (such that
their final [![]() /Fe] is appropriate for their mass), but assume also that the peak in their
star formation rates are shifted by about 1 Gyr (one is younger than the other
and this difference in age cannot be detected with the standard
line-strength indices technique if these objects are more than 10 Gyr old).
Let us also assume that these two galaxies coalesce via a dry merger later
in their evolution. The final object
has the same [
/Fe] is appropriate for their mass), but assume also that the peak in their
star formation rates are shifted by about 1 Gyr (one is younger than the other
and this difference in age cannot be detected with the standard
line-strength indices technique if these objects are more than 10 Gyr old).
Let us also assume that these two galaxies coalesce via a dry merger later
in their evolution. The final object
has the same [![]() /Fe] as the progenitors, while its mass is only doubled; hence it still matches the observations, given the spread in the
/Fe] as the progenitors, while its mass is only doubled; hence it still matches the observations, given the spread in the ![]() /Fe-mass relation (Pipino & Matteucci 2008, hereafter PM08).
The integral star formation history, instead, will look like the one
in Fig. 5, thus broader than the 0.5-0.7 Gyr expected by PM04 (their
model II) in order to satisfy the
/Fe-mass relation (Pipino & Matteucci 2008, hereafter PM08).
The integral star formation history, instead, will look like the one
in Fig. 5, thus broader than the 0.5-0.7 Gyr expected by PM04 (their
model II) in order to satisfy the ![]() /Fe-mass relation.
This explains why the [
/Fe-mass relation.
This explains why the [![]() /Fe] ratio calculated by GalICS is
higher than the one derived by a pure chemical evolution model
of a single object with the same mass-weighted SFH.
According to Pipino & Matteucci (2006, PM06), the above example will lead to similar conclusions
even if star formation is allowed to occur when the two galaxies merge.
PM06 found, in fact that if a starburst triggered by significant accretion of pristine gas
(comparable with the mass of stars already formed - roughly similar to a major wet merger in a galaxy formation picture)
occurred at a significantly high redshift and just after the main
burst of SF, the present day photo-chemical properties of the
final elliptical galaxy may match the observed ones.
/Fe] ratio calculated by GalICS is
higher than the one derived by a pure chemical evolution model
of a single object with the same mass-weighted SFH.
According to Pipino & Matteucci (2006, PM06), the above example will lead to similar conclusions
even if star formation is allowed to occur when the two galaxies merge.
PM06 found, in fact that if a starburst triggered by significant accretion of pristine gas
(comparable with the mass of stars already formed - roughly similar to a major wet merger in a galaxy formation picture)
occurred at a significantly high redshift and just after the main
burst of SF, the present day photo-chemical properties of the
final elliptical galaxy may match the observed ones.
![\begin{figure}
\par\includegraphics[width=7.8cm,clip]{11269fg8.eps}
\end{figure}](/articles/aa/full_html/2009/39/aa11269-08/img68.png) |
Figure 7:
The |
| Open with DEXTER | |
For the SFH presented in Fig. 6,
we have an ![]() -depletion with GalICS which does
not occur in PM04. Even though this change is enough to bring
the galaxy back within the range of observed values, the discrepancy
between the two model predictions is much smaller than in the previous
case. The difference here is that
we have only one progenitor which explains why the [
-depletion with GalICS which does
not occur in PM04. Even though this change is enough to bring
the galaxy back within the range of observed values, the discrepancy
between the two model predictions is much smaller than in the previous
case. The difference here is that
we have only one progenitor which explains why the [![]() /Fe]
ratios of GalICS and the pure chemical evolution model are in much better
agreement.The small offset is mostly due to the fact that PM04 is a closed box.
/Fe]
ratios of GalICS and the pure chemical evolution model are in much better
agreement.The small offset is mostly due to the fact that PM04 is a closed box.
For comparison, we also show
the SFH for a ![]()
![]() galaxy with [
galaxy with [![]() /Fe]=0.3 (dashed line)
and for a low-mass (
/Fe]=0.3 (dashed line)
and for a low-mass (![]()
![]() )
strongly
)
strongly ![]() -enhanced satellite (dotted line).
For the comparison between a stacked specific (i.e. per unit stellar mass) SFH for galaxies in different
mass bins and the observations (e.g. Thomas et al. 2005), we refer to Cattaneo et al. (2008, cf. their Figs. 5 and 6)
and we do not repeat the analysis here. We just mention that Cattaneo et al. (2008)
show that the average duration of the SFH is shorter in the more massive systems
in a way that resembles that inferred by Thomas et al. (2005).
However, this is not enough to imply a
-enhanced satellite (dotted line).
For the comparison between a stacked specific (i.e. per unit stellar mass) SFH for galaxies in different
mass bins and the observations (e.g. Thomas et al. 2005), we refer to Cattaneo et al. (2008, cf. their Figs. 5 and 6)
and we do not repeat the analysis here. We just mention that Cattaneo et al. (2008)
show that the average duration of the SFH is shorter in the more massive systems
in a way that resembles that inferred by Thomas et al. (2005).
However, this is not enough to imply a ![]() /Fe-mass relation. On the other hand,
with the help of the SFH presented in this section, we
explained why the average duration of the SF is a factor of 3-5 longer
(and consequently the peak value a factor of 3-5 lower)
than that required from pure chemical evolution studies
on line-strength indices analysis to reproduce the [
/Fe-mass relation. On the other hand,
with the help of the SFH presented in this section, we
explained why the average duration of the SF is a factor of 3-5 longer
(and consequently the peak value a factor of 3-5 lower)
than that required from pure chemical evolution studies
on line-strength indices analysis to reproduce the [![]() /Fe] in massive ellipticals.
/Fe] in massive ellipticals.
Looking at statistics with the help of Fig. 7 no merger case (crosses)
represents 42% of the total number of elliptical galaxies
and is biased towards lower masses as we would expect
since massive ellipticals are built by multiple mergers in the
hierarchical galaxy formation scenario (triangles
in Fig. 7 indicate galaxies which experienced at least
two mergers.).
One might be worried that these results depend on the mass
resolution of the N-body simulation, however
as stated earlier in the paper our mass resolution
is such that galaxies more massive than
![]() are resolved and this mass is about a factor of 10 lower
than the mass of ellipticals considered in our analysis.
are resolved and this mass is about a factor of 10 lower
than the mass of ellipticals considered in our analysis.
We also note that in GalICS, the galaxies do not
evolve as closed boxes. They instead exchange metals
with the surrounding hot halo, and
stars originally created in discs can become part of bulges
because of instabilities and mergers. Such processes, render
the interpretation of the final [![]() /Fe] ratio
on the basis of the SFH alone even more complicated.
/Fe] ratio
on the basis of the SFH alone even more complicated.
5 The mass-metallicity relation
![\begin{figure}
\par\includegraphics[width=7.8cm,clip]{11269fg9.eps}
\end{figure}](/articles/aa/full_html/2009/39/aa11269-08/img69.png) |
Figure 8:
The MMR as predicted by GalICS for the whole
sample of ellipticals (black points).
Contours: data by Thomas et al. (2007) along with the linear-regression best fit (solid line).
Note that elliptical galaxies exhibit quite strong
[Z/H] gradients within one effective radius (e.g Carollo et al. 1993; Davies et al. 1993)
and the Thomas et al. (2007) galaxies were observed with a fixed fiber size.
Therefore it is difficult to make a meaningful comparison between our predictions
and observations as in the case of the [ |
| Open with DEXTER | |
The reader should keep in mind that elliptical galaxies do exhibit quite strong (i.e. -0.3 dex per decade in radius) [Z/H] and [Fe/H] gradients within one effective radius (e.g. Carollo et al. 1993; Davies et al. 1993; Rawles et al. 2008). In practice, given the fixed aperture set by the SDSS fiber size, it is likely that smaller galaxies contributed with most of their light, whereas only the central regions (more metal rich) are observed in bigger galaxies, thus biasing the observed slope of the MMR towards steeper values than the reality. However, a MMR does exist for the central regions of elliptical galaxies (e.g. Thomas et al. 2005). Therefore, the bias, if any, is not sufficient to explain the slope.
A failure in reproducing the MMR is expected on the basis of the preliminary analysis
by PM08.
In particular, they started with the assumption that,
if one wants to create a large elliptical with a suitable ![]() -enhancement by means of a series of exclusively dry-mergers
starting from small building blocks, such small objects should have the correct final [
-enhancement by means of a series of exclusively dry-mergers
starting from small building blocks, such small objects should have the correct final [![]() /Fe]
/Fe]![]() , much higher than required by the observations
for their mass.
PM08 showed that, as we expect that at least the building blocks can be treated in the monolithic
collapse approximation, in order to have a very high [
, much higher than required by the observations
for their mass.
PM08 showed that, as we expect that at least the building blocks can be treated in the monolithic
collapse approximation, in order to have a very high [![]() /Fe], they will have a very low metallicity.
Hence, the final outcome of the mergers, namely that the large ellipticals will have a low-metallicity
at variance with the observed MMR.
Our models are considerably more complicated than the extreme assumptions used in the PM08 exercise.
Nonetheless, the fact that the MMR is not reproduced may hint at
i) the need for a more efficient conversion of gas into stars in the progenitors; ii) a lower dilution
of metals from pristine gas (which will not affect the abundance ratios); iii) a lower ejection efficiency of metals by SNe feedback. This last solution leads
to a worsening of the predicted [
/Fe], they will have a very low metallicity.
Hence, the final outcome of the mergers, namely that the large ellipticals will have a low-metallicity
at variance with the observed MMR.
Our models are considerably more complicated than the extreme assumptions used in the PM08 exercise.
Nonetheless, the fact that the MMR is not reproduced may hint at
i) the need for a more efficient conversion of gas into stars in the progenitors; ii) a lower dilution
of metals from pristine gas (which will not affect the abundance ratios); iii) a lower ejection efficiency of metals by SNe feedback. This last solution leads
to a worsening of the predicted [![]() /Fe]-mass relation (see the Discussion), whereas
the first one may help with both problems.
/Fe]-mass relation (see the Discussion), whereas
the first one may help with both problems.
We do not show other predictions, such as the age-mass and colour magnitude relations.
We refer the reader to Cattaneo et al. (2008) and Kaviraj et al. (2005)
who show a remarkable agreement of the predictions made by means of GalICS
with the latest observational results.
We only note that the predicted scatter in the predicted MMR
and (SSP-equivalent) age-mass relationships
is comparable to the intrinsic scatter derived by Thomas et al. (2005, 2007).
On the other hand, the scatter in the ![]() /Fe-mass relation is about twice as big.
/Fe-mass relation is about twice as big.
6 Discussion
![\begin{figure}
\par\includegraphics[width=7.8cm,clip]{11269fg10.eps}
\end{figure}](/articles/aa/full_html/2009/39/aa11269-08/img70.png) |
Figure 9:
The |
| Open with DEXTER | |
![\begin{figure}
\par\includegraphics[width=7.8cm,clip]{11269fg11.eps}\par\vspace*{2mm}
\includegraphics[width=7.8cm,clip]{11269fg12.eps}
\end{figure}](/articles/aa/full_html/2009/39/aa11269-08/img71.png) |
Figure 10:
|
| Open with DEXTER | |
In the previous section, we showed the sensitivity of [![]() /Fe] to the integral
star formation history of the galaxy and estimated the offset in the predicted
value with respect to pure monolithic formation. Moreover,
we studied the scatter in the predicted [
/Fe] to the integral
star formation history of the galaxy and estimated the offset in the predicted
value with respect to pure monolithic formation. Moreover,
we studied the scatter in the predicted [![]() /Fe]-mass relation
at a fixed mass.
In order to understand these results, it is important to understand
how the quenching mechanism works in GalICS. In order to do this, we present a model in which
we switch off the SMBH heating of the intra-halo gas. In this case,
we predict that the more massive galaxies are younger than the less massive
ones - with a typical age of 6 Gyr (at variance with
the observational results) - and that they are strongly
/Fe]-mass relation
at a fixed mass.
In order to understand these results, it is important to understand
how the quenching mechanism works in GalICS. In order to do this, we present a model in which
we switch off the SMBH heating of the intra-halo gas. In this case,
we predict that the more massive galaxies are younger than the less massive
ones - with a typical age of 6 Gyr (at variance with
the observational results) - and that they are strongly ![]() -depleted.
As can be seen in Fig. 9, we basically confirm
with a more self-consistent model the results that Thomas (1999)
obtained. Note, however, that several differences between current models and the model that
was used by Thomas (1999), e.g. the cosmological parameters and the merger trees, hamper us from
a proper quantitative comparison. Nonetheless it is surprising that our results agree with
those by Thomas (1999) and also, again at least from a qualitative point of view, with
Nagashima et al. (2005)'s results.
Therefore a dramatic improvement in the star formation histories by means
of a quenching mechanism is responsible for the
-depleted.
As can be seen in Fig. 9, we basically confirm
with a more self-consistent model the results that Thomas (1999)
obtained. Note, however, that several differences between current models and the model that
was used by Thomas (1999), e.g. the cosmological parameters and the merger trees, hamper us from
a proper quantitative comparison. Nonetheless it is surprising that our results agree with
those by Thomas (1999) and also, again at least from a qualitative point of view, with
Nagashima et al. (2005)'s results.
Therefore a dramatic improvement in the star formation histories by means
of a quenching mechanism is responsible for the ![]() -enhanced
massive galaxies that we predict.
On the other hand,
in the case without AGN feedback (not shown here), the slope of the predicted mass-metallicity relation
is closer to the observed one than in the fiducial case. However, the
overall metallicity is lower due to the fact that nothing stops
cold gas, hence metal dilution, from being accreted at later times.
-enhanced
massive galaxies that we predict.
On the other hand,
in the case without AGN feedback (not shown here), the slope of the predicted mass-metallicity relation
is closer to the observed one than in the fiducial case. However, the
overall metallicity is lower due to the fact that nothing stops
cold gas, hence metal dilution, from being accreted at later times.
Therefore, in order to satisfy the mass-[![]() /Fe] relation, some kind of SF quenching is needed. The recipe adopted in the present work assumes that
only the most massive galaxies are affected by SMBH feedback in a way that
helps to predict higher [
/Fe] relation, some kind of SF quenching is needed. The recipe adopted in the present work assumes that
only the most massive galaxies are affected by SMBH feedback in a way that
helps to predict higher [![]() /Fe] ratios and relaxes, but does not yet solve, the problem at high masses. However, little attention is paid to what becomes of the less massive objects which are the building blocks of the relation and responsible for the bulk of the scatter. Suppression of star formation at low and intermediate masses is required in the model.
/Fe] ratios and relaxes, but does not yet solve, the problem at high masses. However, little attention is paid to what becomes of the less massive objects which are the building blocks of the relation and responsible for the bulk of the scatter. Suppression of star formation at low and intermediate masses is required in the model.
Interestingly, according to Fig. 10, on average the final [![]() /Fe] ratio seems
to be independent of the the total number
of mergers (top panel) as well as of the number of major mergers (bottom panel). Moreover such a relationship also holds if we consider
the number of either dry or wet mergers, and is independent of the merger
classification
/Fe] ratio seems
to be independent of the the total number
of mergers (top panel) as well as of the number of major mergers (bottom panel). Moreover such a relationship also holds if we consider
the number of either dry or wet mergers, and is independent of the merger
classification![]() .
There is a trend such that galaxies with more than
.
There is a trend such that galaxies with more than ![]() 5 mergers in their formation histories always have relatively high
5 mergers in their formation histories always have relatively high ![]() /Fe ratios. As the most massive galaxies are those which underwent
the highest number of both total and wet mergers in their lifetime, these objects display relatively high
/Fe ratios. As the most massive galaxies are those which underwent
the highest number of both total and wet mergers in their lifetime, these objects display relatively high ![]() /Fe ratios and old ages.
If we select again the galaxies with SSP-weighted ages larger
than 10 Gyr, we find that all the galaxies with a number of mergers larger than 7 belong
to this category. (Not) surprisingly they are also the most massive
(stellar masses larger than
/Fe ratios and old ages.
If we select again the galaxies with SSP-weighted ages larger
than 10 Gyr, we find that all the galaxies with a number of mergers larger than 7 belong
to this category. (Not) surprisingly they are also the most massive
(stellar masses larger than
![]() ).
This is because larger haloes are the first to form and to reach
the mass where the feedback turns on.
The majority of galaxies with a number of mergers in their lifetime lower than 4 (2) have formation epochs larger than 1 (2) Gyr, and have mostly
stellar masses smaller than 2 (1
).
This is because larger haloes are the first to form and to reach
the mass where the feedback turns on.
The majority of galaxies with a number of mergers in their lifetime lower than 4 (2) have formation epochs larger than 1 (2) Gyr, and have mostly
stellar masses smaller than 2 (1
![]() .
.
The model predicts a lot of
galaxies that underwent 0 mergers which exhibit a large scatter in the final [![]() /Fe] ratio.
These are galaxies which
evolve from disc to bulge morphology through instabilities at late times, but keep a non-negligible
disc component (i.e. they have
0.219<I<0.01). These galaxies have masses below
/Fe] ratio.
These are galaxies which
evolve from disc to bulge morphology through instabilities at late times, but keep a non-negligible
disc component (i.e. they have
0.219<I<0.01). These galaxies have masses below
![]() and are satellites
(crosses, upper panel of Fig. 3). If they are
located in environments where the AGN-quenching
threshold occurs too late, they will
populate the [
and are satellites
(crosses, upper panel of Fig. 3). If they are
located in environments where the AGN-quenching
threshold occurs too late, they will
populate the [![]() /Fe]-mass plane at values lower than the
observed ones. In this case a better treatment of the feedback at galactic scales,
possibly including (SNIa-driven) winds, might represent a solution.
On the other hand, small galaxies in environments where the AGN-quenching
threshold occurs too early and that did not merge to form the most massive spheroids,
will populate the [
/Fe]-mass plane at values lower than the
observed ones. In this case a better treatment of the feedback at galactic scales,
possibly including (SNIa-driven) winds, might represent a solution.
On the other hand, small galaxies in environments where the AGN-quenching
threshold occurs too early and that did not merge to form the most massive spheroids,
will populate the [![]() /Fe]-mass plane at values higher than the
observed ones.
We argue
that this may be a common feature in the most recent models available in the literature. For instance, Kimm et al. (2009),
compared five different galaxy formation models to recent observations and found that all of them
over predict the fraction
of red and passive satellite galaxies. Fontanot et al. (2009) argue that this problem is linked
to excessively efficient formation of central galaxies in high redshift haloes.
The existence of such a problem in models in which most of the galaxy assembly occurs via dry mergers has been foreseen
on more general grounds by PM08 by means of simple arguments which do not depend
on processes as feedback or merger history.
In a sense one could turn the argument around and say that a robust prediction
of semi-analytic models of hierarchical galaxy formation is the
presence of low-mass, highly [
/Fe]-mass plane at values higher than the
observed ones.
We argue
that this may be a common feature in the most recent models available in the literature. For instance, Kimm et al. (2009),
compared five different galaxy formation models to recent observations and found that all of them
over predict the fraction
of red and passive satellite galaxies. Fontanot et al. (2009) argue that this problem is linked
to excessively efficient formation of central galaxies in high redshift haloes.
The existence of such a problem in models in which most of the galaxy assembly occurs via dry mergers has been foreseen
on more general grounds by PM08 by means of simple arguments which do not depend
on processes as feedback or merger history.
In a sense one could turn the argument around and say that a robust prediction
of semi-analytic models of hierarchical galaxy formation is the
presence of low-mass, highly [![]() /Fe]-enhanced satellite galaxies
at high redshift because it is the only way
in these models to build local massive ellipticals with
the observed [
/Fe]-enhanced satellite galaxies
at high redshift because it is the only way
in these models to build local massive ellipticals with
the observed [![]() /Fe] ratios. We know from observations that such objects do not seem to exist at moderately high redshifts around
/Fe] ratios. We know from observations that such objects do not seem to exist at moderately high redshifts around ![]() (Ziegler et al. 2005).
One interesting (but probably not unique) possibility
is if these systems accrete some
fresh gas over a long time-scale to keep SF going and, therefore,
decrease the [
(Ziegler et al. 2005).
One interesting (but probably not unique) possibility
is if these systems accrete some
fresh gas over a long time-scale to keep SF going and, therefore,
decrease the [![]() /Fe] ratio.
Alternatively, as suggested by Font et al. (2008 - but for a different galaxy formation model), a less aggressive
role of the environment (e.g. ram-pressure stripping) may leave more gas in the satellite galaxies.
/Fe] ratio.
Alternatively, as suggested by Font et al. (2008 - but for a different galaxy formation model), a less aggressive
role of the environment (e.g. ram-pressure stripping) may leave more gas in the satellite galaxies.
In conclusion, for the most massive spheroids, the interplay between
the peak in the merger rate and the subsequent AGN quenching of the star formation
act together in such a way that most of the star formation process and the galactic assembly occur
at roughly the same time and the same place, thus mimicking a sort
of ``monolithic'' behaviour. In other words, even though the duration
of the star formation would lead to quite low [![]() /Fe] ratios
from the point of view of a pure chemical evolution model,
the fact that this happened in several sub-units makes the final [
/Fe] ratios
from the point of view of a pure chemical evolution model,
the fact that this happened in several sub-units makes the final [![]() /Fe] ratios
higher and in better agreement with observations.
Intermediate and small objects, instead, do not have a quenching mechanism
acting directly at the scales which can self-regulate the duration
of the star formation. Therefore they end up having either too high
or too low [
/Fe] ratios
higher and in better agreement with observations.
Intermediate and small objects, instead, do not have a quenching mechanism
acting directly at the scales which can self-regulate the duration
of the star formation. Therefore they end up having either too high
or too low [![]() /Fe] ratios.
/Fe] ratios.
In order to improve the agreement between predictions and observations,
we modified the model by modifying the other source of feedback present in GalICS,
namely the SN feedback, by changing the efficiency of mass-loading during
the triggering of a galactic wind by SNII explosions.
Increasing ![]() in Eq. (7) produces more feedback, heating more cold
gas, ejecting more hot gas from haloes, and thus reduces the amount of
gas that can potentially form stars. In this case,
we find that the predicted stellar masses are smaller
than in the fiducial case. The galaxies look slightly
more
in Eq. (7) produces more feedback, heating more cold
gas, ejecting more hot gas from haloes, and thus reduces the amount of
gas that can potentially form stars. In this case,
we find that the predicted stellar masses are smaller
than in the fiducial case. The galaxies look slightly
more ![]() -enhanced as expected since the SF process is
strongly disfavoured by the SNe explosions.
However, this is not a viable solution for the
-enhanced as expected since the SF process is
strongly disfavoured by the SNe explosions.
However, this is not a viable solution for the ![]() /Fe-mass relation problem,
since the high mass-loading also implies a very low
metal content in the stars. The predicted MMR
is offset downwards by at least 0.5 dex from the observational one.
On the other hand, if we switch the SN feedback off, we
tend to slightly worsen the
/Fe-mass relation problem,
since the high mass-loading also implies a very low
metal content in the stars. The predicted MMR
is offset downwards by at least 0.5 dex from the observational one.
On the other hand, if we switch the SN feedback off, we
tend to slightly worsen the ![]() /Fe-mass relation, whereas the agreement
for the MMR improves.
/Fe-mass relation, whereas the agreement
for the MMR improves.
Following the above line of thoughts, we further modify GalICS
by introducing SNIa contributions into Eq. (7).
Since ![]() elements and Fe are still ejected at the same rate,
this change has the same effects of increasing
elements and Fe are still ejected at the same rate,
this change has the same effects of increasing ![]()
![]() .
A 0.1 dex increase in the final [
.
A 0.1 dex increase in the final [![]() /Fe] ratios can be achieved
when a differential wind is invoked, namely if we assume that twice
more Fe than O can be ejected in the hot phase due to
SNIa explosions.
Again, given the nature of such a mechanism, neither the slope
of the predicted
/Fe] ratios can be achieved
when a differential wind is invoked, namely if we assume that twice
more Fe than O can be ejected in the hot phase due to
SNIa explosions.
Again, given the nature of such a mechanism, neither the slope
of the predicted ![]() /Fe-mass relation can be steepened nor its scatter
reduced. Further investigation will tell us if a change
in the SNe feedback, namely by allowing them to quench the star formation
as in monolithic numerical simulations (e.g. Pipino et al. 2008, 2009), might be the required galactic scale
source of feedback.
/Fe-mass relation can be steepened nor its scatter
reduced. Further investigation will tell us if a change
in the SNe feedback, namely by allowing them to quench the star formation
as in monolithic numerical simulations (e.g. Pipino et al. 2008, 2009), might be the required galactic scale
source of feedback.
7 Conclusions
We implemented a detailed treatment for the chemical evolution of H, He, O and Fe in GalICS, a semi-analytical model for galaxy formation which successfully reproduces basic low and high redshift galaxy properties. The contribution of supernovae (both type Ia and II) as well as low and intermediate mass stars to chemical feedback is taken into account.
As expected from chemical evolution studies,
it is the shape of the SFH which sets the final [![]() /Fe]:
a galaxy with a shorter duration of the SFH (summed
over all the progenitors) will have a higher [
/Fe]:
a galaxy with a shorter duration of the SFH (summed
over all the progenitors) will have a higher [![]() /Fe]
than a galaxy with a longer one, even if the latter had fewer mergers.
Moreover the [
/Fe]
than a galaxy with a longer one, even if the latter had fewer mergers.
Moreover the [![]() /Fe] values achieved by the galaxies
are in general 0.1-0.3 higher than expected
by feeding the integral SFH in a pure chemical evolution model.
This happens because in GalICS galaxies do not
evolve as closed boxes.
/Fe] values achieved by the galaxies
are in general 0.1-0.3 higher than expected
by feeding the integral SFH in a pure chemical evolution model.
This happens because in GalICS galaxies do not
evolve as closed boxes.
The model predictions are
compared to the most recent observational results by Thomas et al. (2007).
The model shows significant improvement at the highest masses and velocity dispersions with
respect to the earlier (albeit not the same) model by Thomas (1999),
where the predicted [![]() /Fe] ratios are now marginally consistent with observed values.
This is due to the fact that much attention has been paid to the predicted star formation histories of central galaxies.
The latest semi-analytical models, in fact, predict their stars to be on average older than their low
mass counterparts. Efficient and early star formation of their progenitors make massive
galaxies red and
/Fe] ratios are now marginally consistent with observed values.
This is due to the fact that much attention has been paid to the predicted star formation histories of central galaxies.
The latest semi-analytical models, in fact, predict their stars to be on average older than their low
mass counterparts. Efficient and early star formation of their progenitors make massive
galaxies red and ![]() -enhanced.
However, we find that this chemically improved GalICS still does not produce the overall observed mass and
-enhanced.
However, we find that this chemically improved GalICS still does not produce the overall observed mass and ![]() -[
-[![]() /Fe] relations.
The slope is too shallow and the scatter too large,
in particular in the low and intermediate mass range.
Moreover, an excess of low-mass ellipticals
with too high a [
/Fe] relations.
The slope is too shallow and the scatter too large,
in particular in the low and intermediate mass range.
Moreover, an excess of low-mass ellipticals
with too high a [![]() /Fe] ratio is predicted.
This latter result agrees with the recent finding that several other (independently-developed) galaxy formation
models exhibit far too many red and passive satellite galaxies.
/Fe] ratio is predicted.
This latter result agrees with the recent finding that several other (independently-developed) galaxy formation
models exhibit far too many red and passive satellite galaxies.
We suggest that
the failure to reproduce the mass- and ![]() -[
-[![]() /Fe] relations can partly
be attributed to the way in which star formation and feedback are currently modelled.
The merger process is responsible for part of the scatter. We suggest that the next generation of semi-analytical
models should feature, especially in the low and intermediate mass range,
stellar (SNIa?) feedback mechanisms linked to the star formation history of single galaxies and not only to their host halo
properties. This modification to the current implementation of the galaxy formation process in the CDM scenario
should be pursued in order to halt late-time star formation in intermediate mass ellipticals.
In particular, we showed that an increase in the star formation efficiency
and Fe-enhanced winds driven by the SNIa activity
may play a role in removing galaxies
with too low [
/Fe] relations can partly
be attributed to the way in which star formation and feedback are currently modelled.
The merger process is responsible for part of the scatter. We suggest that the next generation of semi-analytical
models should feature, especially in the low and intermediate mass range,
stellar (SNIa?) feedback mechanisms linked to the star formation history of single galaxies and not only to their host halo
properties. This modification to the current implementation of the galaxy formation process in the CDM scenario
should be pursued in order to halt late-time star formation in intermediate mass ellipticals.
In particular, we showed that an increase in the star formation efficiency
and Fe-enhanced winds driven by the SNIa activity
may play a role in removing galaxies
with too low [![]() /Fe] ratios.
However, given the way they act on galaxy
evolution, these effects cannot be effective in either making
the slope of the predicted
/Fe] ratios.
However, given the way they act on galaxy
evolution, these effects cannot be effective in either making
the slope of the predicted ![]() /Fe-mass relation steeper or
in reducing its scatter.
In particular, it seems hard to get rid of the low mass
galaxies which are too
/Fe-mass relation steeper or
in reducing its scatter.
In particular, it seems hard to get rid of the low mass
galaxies which are too ![]() -enhanced.
To reduce the number of such low mass red satellites, other mechanisms, (e.g. Font et al. 2008) should also be implemented.
-enhanced.
To reduce the number of such low mass red satellites, other mechanisms, (e.g. Font et al. 2008) should also be implemented.
Furthermore, a drawback of the model
is the fact that the MMR cannot be fit simultaneously.
In fact, the AGN quenching that alleviates the problems in the ![]() -[
-[![]() /Fe] relation
at high masses seems to erase the slope in the MMR.
Both effects can be explained by the fact that
the model is still lacking a quasi-monolithic
formation for all of the spheroids, which is needed in order
to reproduce the
/Fe] relation
at high masses seems to erase the slope in the MMR.
Both effects can be explained by the fact that
the model is still lacking a quasi-monolithic
formation for all of the spheroids, which is needed in order
to reproduce the ![]() /Fe-mass relation and the MMR at the same time.
/Fe-mass relation and the MMR at the same time.
Acknowledgements
We thank the referee for insightful comments that improved the quality of the paper. A.P. acknowledges useful discussions with A. Cattaneo.
References
- Athannasoula, E. 2008, MNRAS, 390, 69 [NASA ADS]
- Baugh, C. M., Cole, S., & Frenk, C. S. 1996, MNRAS, 283, 1361 [NASA ADS] (In the text)
- Baldry, I. K., Glazebrook, K., Brinkmann, J., et al. 2004, ApJ, 600, 681 [NASA ADS] [CrossRef] (In the text)
- Bender, R., Burnstein, D., & Faber, S. M. 1993, ApJ, 411, 153 [NASA ADS] [CrossRef] (In the text)
- Bernardi, M., Nichol, R. C., Sheth, R. K., Miller, C. J., & Brinkmann, J. 2006, AJ, 131, 1288 [NASA ADS] [CrossRef] (In the text)
- Bower, R. G., Lucey, J. R., & Ellis, R. S. 1992, MNRAS, 254, 589 [NASA ADS]
- Bower, R. G., Benson, A. J., Malbon, R., et al. 2006, MNRAS, 370, 645 [NASA ADS] (In the text)
- Bundy, K., Ellis, R. S., & Conselice, C. J. 2005, ApJ, 625, 621 [NASA ADS] [CrossRef] (In the text)
- Carollo, C. M., Danziger, I. J., & Buson, L. 1993, MNRAS, 265, 553 [NASA ADS] (In the text)
- Cattaneo, A., Blaizot, J., Devriendt, J., & Guiderdoni, B. 2005, MNRAS, 364, 407 [NASA ADS] (In the text)
- Cattaneo, A., Dekel, A., Faber, S. M., & Guiderdoni, B. 2008, MNRAS, 389, 567 [NASA ADS] [CrossRef] (In the text)
- Cimatti, A., Daddi, E., & Renzini, A. 2006, A&A, 453, 29 [NASA ADS] [CrossRef] (In the text)
- Cole, S., Aragon-Salamanca, A., Frenk, C., Navarro J., & Zepf, S. 1994, MNRAS, 271, 781 [NASA ADS] (In the text)
- Croton, D. J., Springel, V., White, S. D. M., et al. 2006, MNRAS, 365, 11 [NASA ADS] [CrossRef] (In the text)
- Davies, R. L., Sadler, E. M., & Peletier, R. F. 1993, MNRAS, 262, 650 [NASA ADS] (In the text)
- Dekel, A., & Silk, J. 1986, ApJ, 303, 39 [NASA ADS] [CrossRef]
- De Lucia, G., Springel, V., White, S. D. M., Croton, D., & Kauffmann, G. 2006, MNRAS, 366, 499 [NASA ADS] [CrossRef] (In the text)
- Faber, S. M. 1973, ApJ, 179, 423 [NASA ADS] [CrossRef] (In the text)
- Font, A. S, Bower, R. G., McCarthy, I. G., et al. 2008, MNRAS, 389, 1619 [NASA ADS] [CrossRef] (In the text)
- Fontanot, F., Monaco, P., Silva, L., & Grazian, A. 2007, MNRAS, 382, 903 [NASA ADS] [CrossRef] (In the text)
- Fontanot, F., De Lucia, G., Monaco, P., Somerville, R. S., & Santini, P. 2009, MNRAS, 397, 1776 [NASA ADS] [CrossRef] (In the text)
- François, P., Matteucci, F., Cayrel, R., et al. 2004, A&A, 421, 613 [NASA ADS] [CrossRef] [EDP Sciences] (In the text)
- Ferrarese, L., & Merritt, D. 2000, ApJ, 539, L9 [NASA ADS] [CrossRef] (In the text)
- Gallazzi, A., Charlot, S., Brinchmann, J., & White, S. D. M. 2006, MNRAS, 370, 1106 [NASA ADS] [CrossRef] (In the text)
- Granato, G. L., De Zotti, G., Silva, L., Bressan, A., & Danese, L. 2004, ApJ, 600, 580 [NASA ADS] [CrossRef] (In the text)
- Gebhardt, K., Bender, R., Bower, G., et al. 2000, ApJ, 539, L13 [NASA ADS] [CrossRef] (In the text)
- Graves, G. J., Faber, S. M., Schiavon, R. P., & Yan, R. 2007, ApJ, 671, 243 [NASA ADS] [CrossRef] (In the text)
- Greggio, L. 2005, A&A, 441, 1055 [NASA ADS] [CrossRef] [EDP Sciences] (In the text)
- Guiderdoni, B., Hivon, E., Bouchet, F. R., & Maffei, B. 1998, MNRAS, 295, 877 [NASA ADS] [CrossRef] (In the text)
- Hasinger, G., Miyaji, T., & Schmidt, M. 2005, A&A, 441, 417 [NASA ADS] [CrossRef] [EDP Sciences] (In the text)
- Hatton, S., Devriendt, J. E. G., Ninin, S., et al. 2003, MNRAS, 343, 75 [NASA ADS] [CrossRef] (Paper I) (In the text)
- Hernquist, L. 1990, ApJ, 356, 359 [NASA ADS] [CrossRef] (In the text)
- Humphrey, P. J., Buote, D. A. Gastaldello, F., et al. 2006, ApJ, 646, 899 [NASA ADS] [CrossRef] (In the text)
- Iwamoto, K., Brachwitz, F., Nomoto, K., et al. 1999, ApJS, 125, 439 [NASA ADS] [CrossRef] (In the text)
- Kauffmann, G. 1996, MNRAS, 281, 487 [NASA ADS] (In the text)
- Kauffmann, G., & Charlot, S. 1998, MNRAS, 294, 705 [NASA ADS] [CrossRef]
- Kauffmann, G., & White, S. D. M. 1993, MNRAS, 261, 921 [NASA ADS] (In the text)
- Kaviraj, S., Devriendt, J. E. G., Ferreras, I., & Yi, S. K. 2005, MNRAS, 360, 60 [NASA ADS] [CrossRef] (In the text)
- Kaviraj, S., Schawinski, K., Devriendt, J. E. G., et al. 2007, ApJS, 173, 619 [NASA ADS] [CrossRef] (In the text)
- Keres, D., Katz, N., Weinberg, D. H., & Dave', R. 2005, MNRAS, 363, 2 [NASA ADS] [CrossRef] (In the text)
- Khochfar, S., & Burkert, A. 2003, ApJ, 597, L117 [NASA ADS] [CrossRef]
- Kimm, T., Somerville, R. S., Yi, S. K., et al. 2009, MNRAS, 394, 1131 [NASA ADS] [CrossRef] (In the text)
- Kroupa, P. 2007 [arXiv:astro-ph/0703124] (In the text)
- Matteucci, F. 1994, A&A, 288, 57 [NASA ADS] (In the text)
- Matteucci, F., & Greggio, L. 1986, A&A, 154, 279 [NASA ADS] (In the text)
- Matteucci, F., & Recchi, S. 2001, ApJ, 558, 351 [NASA ADS] [CrossRef] (In the text)
- Matteucci, F., Panagia, N., Pipino, A., et al. 2006, MNRAS, 372, 265 [NASA ADS] [CrossRef] (In the text)
- Mannucci, F., Maoz, D., Sharon, K., et al. 2007, MNRAS, 383, 1121 [NASA ADS] [CrossRef]
- Mehlert, D., Thomas, D., Saglia, R. P., Bender, R., & Wegner, G. 2003, A&A, 407, 423 [NASA ADS] [CrossRef] [EDP Sciences] (In the text)
- Merlin, E., & Chiosi, C. 2006, A&A, 457, 437 [NASA ADS] [CrossRef] [EDP Sciences] (In the text)
- Mo, H. J., Mao, S., & White, S. D. M. 1998, MNRAS, 295, 319 [NASA ADS] [CrossRef] (In the text)
- Nagashima, M., Lacey, C. G., Okamoto, T., et al. 2005, MNRAS, 363, L31 [NASA ADS] (In the text)
- Nesvadba, N. P. H., Lehnert, M. D., Eisenhauer, F., et al. 2006, Apj, 650, 693 [NASA ADS] [CrossRef] (In the text)
- Nelan, J. E., Smith, R. J., Hudson, M. J., et al. 2005, ApJ, 632, 137 [NASA ADS] [CrossRef] (In the text)
- Peebles, P. 1982, ApJ, 263, L1 [NASA ADS] [CrossRef] (In the text)
- Pipino, A., & Matteucci, F. 2004, MNRAS, 347, 968 [NASA ADS] [CrossRef] (PM04) (In the text)
- Pipino, A., & Matteucci, F. 2006, MNRAS, 365, 1114 [NASA ADS] (PM06) (In the text)
- Pipino, A., & Matteucci, F. 2008, A&A, 486, 763 [NASA ADS] [CrossRef] [EDP Sciences] (PM08) (In the text)
- Pipino, A., Matteucci, F., & Chiappini, C. 2006, ApJ, 638, 739 [NASA ADS] [CrossRef] (In the text)
- Pipino, A., D'Ercole, A., & Matteucci, F. 2008, A&A, 484, 679 [NASA ADS] [CrossRef] [EDP Sciences] (In the text)
- Pipino, A., Silk, J., & Matteucci, F. 2009, MNRAS, 392, 475 [NASA ADS] [CrossRef] (In the text)
- Rawle, T. D., Smith, R. J., Lucey, J. R., & Swinbank, A. M. 2008, MNRAS, 389, 1891 [NASA ADS] [CrossRef] (In the text)
- Recchi, S., Matteucci, F., D'Ercole, A., & Tosi, M. 2004, A&A, 426, 37 [NASA ADS] [CrossRef] [EDP Sciences] (In the text)
- Recchi, S., Calura, F., & Kroupa, P. 2009, A&A, 499, 711 [NASA ADS] [CrossRef] [EDP Sciences] (In the text)
- Renzini, A. 2005, ASSL, 327, 221 [NASA ADS] (In the text)
- Salpeter, E. E. 1955, ApJ, 121, 161 [NASA ADS] [CrossRef] (In the text)
- Schawinski, K., Thomas, D., Sarzi, M., et al. 2007, MNRAS, 382, 1415 [NASA ADS] (In the text)
- Schawinski, K., Lintott, C. J., Thomas, D., et al. 2009, ApJ, 690, 1672 [NASA ADS] [CrossRef] (In the text)
- Silk, J. 2001, MNRAS, 324, 313 [NASA ADS] [CrossRef] (In the text)
- Silk, J. 2005, MNRAS, 364, 1337 [NASA ADS] [CrossRef] (In the text)
- Simien, F., & de Vaucouleurs, G. 1986, ApJ, 302, 564 [NASA ADS] [CrossRef] (In the text)
- Somerville, R. S., Hopkins, P. F., Cox, T. J., Robertson, B. E., & Hernquist, L. 2008, MNRAS, 391, 481 [NASA ADS] [CrossRef]
- Springel, V., Frenk, C. S., & White, S. D. M. 2006, Nature, 440, 1137 [NASA ADS] [CrossRef] (In the text)
- Strickland, D. K., & Heckman, T. M. 2009, ApJ, 697, 2030 [NASA ADS] [CrossRef] (In the text)
- Thomas, D. 1999, MNRAS, 306, 655 [NASA ADS] [CrossRef] (In the text)
- Thomas, D., Maraston, C., Bender, R., & Mendes de Oliveira, C. 2005, ApJ, 621, 673 [NASA ADS] [CrossRef] (In the text)
- Thomas, D., Maraston, C., Schawinski, K., et al. 2007, IAUS, 241, 546 [NASA ADS] (In the text)
- Trager, S. C., Faber, S. M., Worthey, G., & Gonzalez, J. J. 2000, AJ, 119, 1654 [NASA ADS] [CrossRef] (In the text)
- van den Bosch, F. C. 1998, ApJ, 507, 601 [NASA ADS] [CrossRef]
- Worthey, G., Faber, S. M., & Gonzalez, J. J. 1992, ApJ, 398, 69 [NASA ADS] [CrossRef] (In the text)
- Weidner, C., & Kroupa, P. 2005, ApJ, 625, 754 [NASA ADS] [CrossRef] (In the text)
- Ziegler, B. L., Thomas, D., Bohm, A., et al. 2005, A&A, 433, 519 [NASA ADS] [CrossRef] [EDP Sciences] (In the text)
Footnotes
- ... nucleosynthesis
![[*]](/icons/foot_motif.png)
- For
instance by: i) extending the upper mass limit of the IMF to 100
 ;
ii) neglecting the ejecta of the stars in the mass range 8-11 (whose O/Fe is slightly sub-solar); iii) setting the SNIa rate
to the lowest value permitted by observations.
;
ii) neglecting the ejecta of the stars in the mass range 8-11 (whose O/Fe is slightly sub-solar); iii) setting the SNIa rate
to the lowest value permitted by observations.
- ... number
- Also, note that GalICS does
not predict low mass satellite galaxies with [/Fe] equal or lower than the observational mean in that mass regime.
- ... ways
- Provided that one can still reproduce the [O/Fe]-[Fe/H] trend in the Milky Way with this new choice.
- .../Fe]
- Dry mergers
do not change the metallicity and the -enhancement because they do not trigger star formation.
- ...
classification
- Since gas is always present in the model galaxies, we tested three wet merger definitions - namely when the total mass in gas divided by the total baryon mass of a newly formed galaxy exceed 0.01, 0.05 and 0.1 - and we did not find substantial differences between them. Note that dry mergers are then defined by subtracting the number of wet mergers to the total for a given galaxy.
- ...

- With the obvious difference that we can have ejection of matter also when the SF is zero, because of the nature of SNIa progenitors.
All Figures
| |
Figure 1: The solid line shows the average [O/Fe] as a function of [Fe/H] as predicted by GalICS for a MW-like spirals. The dotted lines bracket the region where GalICS predictions are. Triangles: observational data for individual stars in the MW disc as compiled and homogenised by François et al. (2004). |
| Open with DEXTER | |
| In the text | |
| |
Figure 2:
Present-day SNIa rate in SNuM units as a function of the
galactic mass for our model ellipticals (black crosses). The hatched region
outlines the 1 |
| Open with DEXTER | |
| In the text | |
| |
Figure 3:
The |
| Open with DEXTER | |
| In the text | |
| |
Figure 4:
Normalized distribution of central galaxies ( left column) and elliptical galaxies with a bulge to
total ratio larger than 0.8 ( right column, see text) as a function of the [ |
| Open with DEXTER | |
| In the text | |
| |
Figure 5:
Integral star formation history for a |
| Open with DEXTER | |
| In the text | |
| |
Figure 6:
Integral star formation history for a |
| Open with DEXTER | |
| In the text | |
| |
Figure 7:
The |
| Open with DEXTER | |
| In the text | |
| |
Figure 8:
The MMR as predicted by GalICS for the whole
sample of ellipticals (black points).
Contours: data by Thomas et al. (2007) along with the linear-regression best fit (solid line).
Note that elliptical galaxies exhibit quite strong
[Z/H] gradients within one effective radius (e.g Carollo et al. 1993; Davies et al. 1993)
and the Thomas et al. (2007) galaxies were observed with a fixed fiber size.
Therefore it is difficult to make a meaningful comparison between our predictions
and observations as in the case of the [ |
| Open with DEXTER | |
| In the text | |
| |
Figure 9:
The |
| Open with DEXTER | |
| In the text | |
| |
Figure 10:
|
| Open with DEXTER | |
| In the text | |
Copyright ESO 2009
Current usage metrics show cumulative count of Article Views (full-text article views including HTML views, PDF and ePub downloads, according to the available data) and Abstracts Views on Vision4Press platform.
Data correspond to usage on the plateform after 2015. The current usage metrics is available 48-96 hours after online publication and is updated daily on week days.
Initial download of the metrics may take a while.