| Issue |
A&A
Volume 505, Number 1, October I 2009
|
|
|---|---|---|
| Page(s) | 1 - 20 | |
| Section | Cosmology (including clusters of galaxies) | |
| DOI | https://doi.org/10.1051/0004-6361/200912119 | |
| Published online | 03 August 2009 | |
Non-circular motions and the cusp-core discrepancy in dwarf galaxies
J. van Eymeren1,2,3 - C. Trachternach2 - B. S. Koribalski3 - R.-J. Dettmar2
1 - Jodrell Bank Centre for Astrophysics, School of Physics &
Astronomy, The University of Manchester, Alan Turing Building,
Oxford Road, Manchester, M13 9PL, UK
2 -
Astronomisches Institut der Ruhr-Universität Bochum,
Universitätsstraße 150, 44780 Bochum, Germany
3 -
Australia Telescope National Facility, CSIRO,
PO Box 76, Epping, NSW 1710, Australia
Received 20 March 2009 / Accepted 22 June 2009
Abstract
Context. The cusp-core discrepancy is one of the major problems in astrophysics. It results from comparing the observed mass distribution of galaxies with the predictions of cold dark matter simulations. The latter predict a cuspy density profile in the inner parts of galaxies, whereas observations of dwarf and low surface brightness galaxies show a constant-density core.
Aims. We want to determine the shape of the dark matter potential in the nuclear regions of a sample of six nearby irregular dwarf galaxies.
Methods. In order to quantify the amount of non-circular motions that could potentially affect a mass decomposition, we first perform a harmonic decomposition of the H I Hermite velocity fields of all sample galaxies. We then decompose the H I rotation curves into different mass components by fitting NFW and pseudo-isothermal halo models to the H I rotation curves using a ![]() minimisation. We model the minimum-disc, the minimum-disc + gas, and the maximum-disc cases.
minimisation. We model the minimum-disc, the minimum-disc + gas, and the maximum-disc cases.
Results. The non-circular motions are in all cases studied here of the order of only a few
![]() (generally corresponding to less than 25% of the local rotation velocity), which means that they do not significantly affect the rotation curves. The observed rotation curves can better be described by the cored pseudo-isothermal halo than by the NFW halo. The slopes of the dark matter density profiles confirm this result and are in good agreement with previous studies. The quality of the fits can often be improved when including baryons, which suggests that they contribute significantly to the inner part of the density profile of dwarf galaxies.
(generally corresponding to less than 25% of the local rotation velocity), which means that they do not significantly affect the rotation curves. The observed rotation curves can better be described by the cored pseudo-isothermal halo than by the NFW halo. The slopes of the dark matter density profiles confirm this result and are in good agreement with previous studies. The quality of the fits can often be improved when including baryons, which suggests that they contribute significantly to the inner part of the density profile of dwarf galaxies.
Key words: dark matter - galaxies: dwarf - kinematics and dynamics
1 Introduction
Early observations of spiral galaxies have shown that their
dynamical mass, as inferred from their surprisingly flat rotation
curves, cannot be explained by luminous matter alone
(e.g., Bosma 1978; Rubin et al. 1978). Since then, ``dark matter''
has become part of modern cosmology. Currently, the most
successful models use a cosmological constant
![]() as
well as collisionless and dissipationless cold dark matter (CDM).
as
well as collisionless and dissipationless cold dark matter (CDM).
![]() CDM simulations, e.g., the Millennium Simulation by
Springel et al. (2005) have been very successful in describing the
observed large-scale structures in the Universe
(Spergel et al. 2007,2003), but they do not work properly on
galaxy scales.
CDM simulations, e.g., the Millennium Simulation by
Springel et al. (2005) have been very successful in describing the
observed large-scale structures in the Universe
(Spergel et al. 2007,2003), but they do not work properly on
galaxy scales.
Table 1: Some general properties of the sample galaxies.
Table 2: The main observational parameters.
Next to the ``missing satellite'' problem (Moore et al. 1999), the
``cusp-core'' discrepancy (e.g., de Blok et al. 2001b) is still
causing debate between observers and cosmologists. Numerical
simulations predict cuspy haloes in the inner parts with a density
distribution described by a power law
![]() with
with ![]() ranging from -1 (e.g., Navarro et al. 1996) to
-1.5 (e.g., Moore et al. 1998,1999). This cusp leads to a
steeply rising rotation curve. However, observations of dwarf and
low surface brightness galaxies show that their rotation curves
rise less steeply than predicted by CDM simulations
(e.g., de Blok & Bosma 2002). Similar conclusions have also been
made from observations of high surface brightness disc galaxies
(Salucci 2001). At small radii (typically a few kpcs), the
mass distribution can better be described by a central,
constant-density core
(e.g.,Marchesini et al. 2002; Flores & Primack 1994; Côté et al. 2000; Gentile et al. 2004).
ranging from -1 (e.g., Navarro et al. 1996) to
-1.5 (e.g., Moore et al. 1998,1999). This cusp leads to a
steeply rising rotation curve. However, observations of dwarf and
low surface brightness galaxies show that their rotation curves
rise less steeply than predicted by CDM simulations
(e.g., de Blok & Bosma 2002). Similar conclusions have also been
made from observations of high surface brightness disc galaxies
(Salucci 2001). At small radii (typically a few kpcs), the
mass distribution can better be described by a central,
constant-density core
(e.g.,Marchesini et al. 2002; Flores & Primack 1994; Côté et al. 2000; Gentile et al. 2004).
This interpretation has been met with skepticism by cosmologists.
Thus, systematic effects in the data, like beam smearing, slit
misplacement, slit width, and seeing, as well as the inclination
of the galaxy and non-circular motions have been used to argue
against the fact that the observations are incompatible with cusps
(van den Bosch et al. 2000; Hayashi et al. 2004; Spekkens et al. 2005; Swaters et al. 2003).
However, repeated one-dimensional long-slit spectra observed by
independent observers with different telescopes (de Blok et al. 2003)
as well as high-resolution H![]() observations using a
two-dimensional velocity field
(Kuzio de Naray et al. 2006; Simon et al. 2005; Spano et al. 2008; Kuzio de Naray et al. 2008) rule out
uncertainties related to slit spectroscopy and still suggest the
presence of an isothermal dark matter core in the inner parts of
disc galaxies. Non-circular motions can indeed affect the results
of rotation curve studies, as it is generally assumed that the
particles are on circular orbits. Several authors report that CDM
haloes are triaxial objects with a globally elongated potential
(e.g., Hayashi et al. 2004; Hayashi & Navarro 2006). They suggest that this
triaxiality induces large non-circular motions in the inner parts
of galaxies (up to 15% of the maximum rotation velocity),
leading to the observed cored profiles. Rhee et al. (2004) tried to
quantify non-circular motions caused by bars, projection effects
based on the thickness of the disc, and bulges, and found that
they add up to a 30-50% underestimation of the rotation curve.
However, de Blok et al. (2003) simulated rotation curves showing that
non-circular motions of the order of 20
observations using a
two-dimensional velocity field
(Kuzio de Naray et al. 2006; Simon et al. 2005; Spano et al. 2008; Kuzio de Naray et al. 2008) rule out
uncertainties related to slit spectroscopy and still suggest the
presence of an isothermal dark matter core in the inner parts of
disc galaxies. Non-circular motions can indeed affect the results
of rotation curve studies, as it is generally assumed that the
particles are on circular orbits. Several authors report that CDM
haloes are triaxial objects with a globally elongated potential
(e.g., Hayashi et al. 2004; Hayashi & Navarro 2006). They suggest that this
triaxiality induces large non-circular motions in the inner parts
of galaxies (up to 15% of the maximum rotation velocity),
leading to the observed cored profiles. Rhee et al. (2004) tried to
quantify non-circular motions caused by bars, projection effects
based on the thickness of the disc, and bulges, and found that
they add up to a 30-50% underestimation of the rotation curve.
However, de Blok et al. (2003) simulated rotation curves showing that
non-circular motions of the order of 20
![]() over a large
fraction of the disc are needed to make them consistent with CDM
haloes. Furthermore, the observations by Gentile et al. (2005) and
Trachternach et al. (2008) reveal that non-circular motions are
typically of the order of a few
over a large
fraction of the disc are needed to make them consistent with CDM
haloes. Furthermore, the observations by Gentile et al. (2005) and
Trachternach et al. (2008) reveal that non-circular motions are
typically of the order of a few
![]() ,
i.e., too low to explain the
cusp-core discrepancy. This might not always be the case, as
Spekkens & Sellwood (2007) found high non-circular motions in the spiral
galaxy NGC 2976, which have a major effect on the rotation curve
and which they explained by a bar in the inner 500 pc.
,
i.e., too low to explain the
cusp-core discrepancy. This might not always be the case, as
Spekkens & Sellwood (2007) found high non-circular motions in the spiral
galaxy NGC 2976, which have a major effect on the rotation curve
and which they explained by a bar in the inner 500 pc.
In this paper, the cusp-core discrepancy is addressed by using the rotation curves derived from H I synthesis data for a mass decomposition of a sample of six nearby irregular dwarf galaxies. The galaxies have been chosen to be a subsample of dwarf irregular galaxies in the Local Volume (D<10 Mpc), which have been observed in H I with sufficiently high spatial resolution (<1 kpc). Some general properties are given in Table 1.
![\begin{figure}\par\includegraphics[width=18cm,bb=34 143 564 793, clip=]{12119fg1.ps}\end{figure}](/articles/aa/full_html/2009/37/aa12119-09/img30.png) |
Figure 1:
The H I kinematics of all sample galaxies. Left
panels:
Hermite h3 velocity fields. The systemic velocity is marked
by a bold line, the beam is placed in the lower left corner. Contour
levels are overlaid in steps of 10
|
| Open with DEXTER | |
In order to rule out systematic effects in the data, we first measure the non-circular motions. Non-circular motions can have two major causes: chaotic non-circular motions can be induced, for example, by star formation (Oh et al. 2008); systematic non-circular motions relate to the potential (e.g., spiral arms, triaxiality of the halo, see Schoenmakers et al. 1997). By performing a harmonic decomposition of the velocity fields, we are able to quantify the systematic non-circular motions.
This paper is organised as follows: in Sect. 2, the different data sets and the creation of the velocity fields are briefly described. The velocity fields and rotation curves are presented in Sect. 3. In Sect. 4, we describe the procedure of the harmonic decomposition and show and discuss our results. Section 5 presents the theoretical background of the mass modelling, which is followed by a discussion of the results from the mass decomposition in Sect. 6. In Sect. 7, the main results are summarised.
2 Observations and data reduction
For this study we selected six nearby irregular dwarf galaxies. Some observational details are given in Table 2.H I data for the two northern galaxies, NGC 2366 and NGC 4861, were obtained with the Very Large Array (VLA). The IB(s)m galaxy NGC 2366 forms part of ``The H I Nearby Galaxy Survey'' (THINGS, Walter et al. 2008). Its peculiar kinematics were the subject of several recent publications (de Blok et al. 2008; Trachternach et al. 2008; van Eymeren et al. 2009a; Oh et al. 2008, hereafter dB08, Oh08, CT08, and vE09a). The SB(s)m galaxy NGC 4861 was studied by Wilcots et al. (1996) and Thuan et al. (2004). A detailed kinematic analysis of this galaxy by van Eymeren et al. (2009b) is based on the combined H I data of two C array and one D array observation. The data reduction process of NGC 2366 is described in Walter et al. (2008), that of NGC 4861 in van Eymeren et al. (2009b).
Table 3: Kinematic parameters of the sample galaxies.
The four southern dwarf galaxies, ESO 059-G001, ESO 215-G?009, NGC 5408, and
IC 5152, are selected from the ``Local Volume H I Survey''
(LVHIS![]() ; Koribalski & Jerjen 2008; Koribalski et al. 2009). H I data for these galaxies were obtained with the Australia Telescope Compact
Array (ATCA) and reduced by the LVHIS team (for details
see Koribalski et al. 2009). All galaxies were observed for
12 h each in at least three different configurations (see
Table 2).
; Koribalski & Jerjen 2008; Koribalski et al. 2009). H I data for these galaxies were obtained with the Australia Telescope Compact
Array (ATCA) and reduced by the LVHIS team (for details
see Koribalski et al. 2009). All galaxies were observed for
12 h each in at least three different configurations (see
Table 2).
For the purpose of this paper, H I velocity fields are created
from the naturally weighted data cubes by fitting Gauss-Hermite h3
polynomials to all line profiles using the GIPSY![]() (The Groningen Image
Processing System; van der Hulst et al. 1992) task xgaufit. This method
allows us to accurately define the peak velocities, whereas the
standard intensity-weighted mean velocities are biased towards the
longest tail of the velocity profiles as soon as the distribution
is not symmetric (see also discussion in dB08). In order to
separate true emission from noise, we set some limits for the
fitting algorithm (see dB08): the fitted profiles need to have
amplitudes higher than 3
(The Groningen Image
Processing System; van der Hulst et al. 1992) task xgaufit. This method
allows us to accurately define the peak velocities, whereas the
standard intensity-weighted mean velocities are biased towards the
longest tail of the velocity profiles as soon as the distribution
is not symmetric (see also discussion in dB08). In order to
separate true emission from noise, we set some limits for the
fitting algorithm (see dB08): the fitted profiles need to have
amplitudes higher than 3
![]() ,
where
,
where
![]() is the average noise in the line-free velocity channels of
the cube. The minimum dispersion to be fitted has to be higher
than the spectral resolution of the cube (see Table 2
for the noise values and channel separations). After creating the
velocity maps, a small amount of noise pixels has to be removed
that was admitted by the filter criteria. Therefore, we again
follow dB08 and use the integrated H I column density map as a
mask: fits are only retained if the total flux in the integrated
H I map is higher than 3
is the average noise in the line-free velocity channels of
the cube. The minimum dispersion to be fitted has to be higher
than the spectral resolution of the cube (see Table 2
for the noise values and channel separations). After creating the
velocity maps, a small amount of noise pixels has to be removed
that was admitted by the filter criteria. Therefore, we again
follow dB08 and use the integrated H I column density map as a
mask: fits are only retained if the total flux in the integrated
H I map is higher than 3
![]() where
where
![]() is the noise in the integrated H I map. It is defined as
is the noise in the integrated H I map. It is defined as
![]() ,
where N is the number of
channels with signal contributing to each pixel. No smoothing is
applied. Altogether, this gives us high quality velocity fields.
,
where N is the number of
channels with signal contributing to each pixel. No smoothing is
applied. Altogether, this gives us high quality velocity fields.
3 The velocity fields and the rotation curves
Figure 1 shows the H I velocity fields (left panels). In order to derive a rotation curve, we use the GIPSY task rotcur: tilted rings of half the beam width are fitted to both sides of the H I velocity fields. The systemic velocity, the centre position, the inclination, and the position angle of each ring are iteratively defined by keeping all parameters fixed except for the one we want to measure. As initial estimates we use kinematic parameters derived from fitting isophotes to the integrated H I intensity map (GIPSY task ellfit). The final rotation curve is then created by keeping the best-fitting parameters fixed. We also derive rotation curves for the receding and approaching side only by keeping the systemic velocity and the centre position fixed to the values obtained in the joint approach and by defining the inclination and the position angle iteratively.
The resulting rotation curves of all sample galaxies are shown in the middle
panels of Fig. 1. The error bars of the rotation curves
indicate the rotation curves of the receding (top) and approaching side
(bottom). We then take the iteratively defined kinematic parameters from the
tilted-ring analysis (see Table 3) in order to create a model
velocity field for each galaxy, which is subsequently subtracted from the
observed velocity field. This shows how well the kinematics of each galaxy
have been measured in the tilted-ring analysis. The residual maps are
presented in Fig. 1, right panels. In most of the cases, the
derived parameters describe the kinematics of the galaxies quite well and
the absolute values of the residuals are below an absolute value of
10
![]() .
A comparison of the positions of the optical and dynamic centres
shows that the offsets (given in the last two columns of Table 3)
are generally smaller than one beam size.
.
A comparison of the positions of the optical and dynamic centres
shows that the offsets (given in the last two columns of Table 3)
are generally smaller than one beam size.
A different test to prove the quality of the rotation curves was done, e.g.,
in vE09a for NGC 2366. They chose different approaches in order to derive
the rotation curve. First, the initial estimates from ellfit were
kept fixed. Then, a rotation curve with the best-fitting parameters kept
fixed was derived (see above). As a third approach, the best-fitting
parameters were left free. vE09a could show that the deviations between
these three approaches are generally small with higher deviations in the
outer parts of the rotation curve. In the inner 1 kpc, the deviations are
less than ![]()
![]() .
We perform this test for all galaxies of our sample
and generally measure equally small deviations in velocity, at least in the
inner kpc.
.
We perform this test for all galaxies of our sample
and generally measure equally small deviations in velocity, at least in the
inner kpc.
The neutral gas distribution in ESO 215-G?009 and its kinematics (including the derivation of a rotation curve) have been studied in detail by Warren et al. (2004). Rotation curves of ESO 059-G001 and ESO 215-G?009 have also been derived by Kirby et al. (2009). A comparison reveals that their parameters are in good agreement with our values.
![\begin{figure}
\par\includegraphics[width=18cm,bb=48 173 570 653, clip=]{12119fg2.ps}\end{figure}](/articles/aa/full_html/2009/37/aa12119-09/img40.png) |
Figure 2:
The results of the unconstrained (black triangles) and constrained
(light grey crosses) harmonic decomposition of NGC 2366. For the constrained
fit the inclination and the position angle were fixed to the values given in
Table 3. Upper left: following Eq. (1),
circular (c1) and non-circular (c2, c3, s1, s2, s3)
harmonic components corrected for inclination and plotted vs. radius
r. Upper right: systemic velocity c0, inclination
i, and position angle PA, again plotted vs. radius
r. The dashed horizontal lines represent the error weighted means of
the unconstrained fit. The inclination and position angle are from the
tilted-ring fit assuming circular rotation. For the unconstrained case the
error bars represent the formal errors. Lower left: the median
amplitudes of the individual harmonic components derived from
Eqs. (2) and (3) plotted vs. harmonic number
m. The error bars denote the upper and lower quartile of the
distribution of the unconstrained
|
| Open with DEXTER | |
4 Harmonic decomposition
In order to search for non-circular motions, we decompose the velocities detected along the tilted rings into multiple terms of sine and cosine. Following Schoenmakers (1999), the line of sight velocity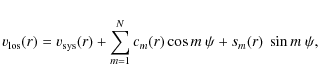
where N is the maximum fit order used, r is the radial distance from the dynamic centre,
The decomposition is performed with the GIPSY task reswri, which fits a tilted-ring model to the original velocity field using circular rotation, and decomposes the line-of-sight velocity along each ring into multiple terms of sine and cosine. Subsequently, a model velocity field is created and subtracted from the original velocity field producing a residual velocity field. Note that the centre coordinates should be kept fixed (see Schoenmakers 1999). We run the routine with two different parameter sets: in the first case, all parameters except for the centre position (listed in Table 3) are left free. In the second case, inclination and position angle are fixed to the values given in Table 3.
![\begin{figure}
\par\includegraphics[width=18cm,bb=48 173 570 653, clip=]{12119fg3.ps}\end{figure}](/articles/aa/full_html/2009/37/aa12119-09/img45.png) |
Figure 3: The same as in Fig. 2 for ESO 059-G001. The inclination and the position angle for the constrained fit are listed in Table 3. |
| Open with DEXTER | |
Table 4: Derived quantities from the harmonic decomposition.
![\begin{figure}
\par\includegraphics[width=18cm,bb=48 173 570 653, clip=]{12119fg4.ps}\end{figure}](/articles/aa/full_html/2009/37/aa12119-09/img75.png) |
Figure 4:
The same as in Fig. 2 for ESO 215-G?009. The
inclination and the position angle for the constrained fit are listed in
Table 3. The analysis of this galaxy is based on the constrained
case (see Sect. 4.3). Therefore, no
|
| Open with DEXTER | |
The quadratically-added amplitude for each order of the harmonic decomposition
is calculated using

for m=1 (c1 is the circular rotation velocity) and
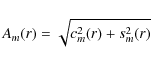
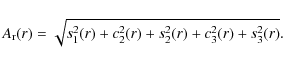
for m>1. Additionally, the quadratically-added amplitude of all non-circular harmonic components (up to N=3 in this case) was calculated from
We also derive the median value of Am(r) for each harmonic order m in two different ways: once, using the entire radial range and once, using the inner 1 kpc only, which is the region where the distinction between a cusp and a core becomes most obvious (de Blok 2004). More information about harmonic decompositions in general can be found in Schoenmakers et al. (1997).
In the following subsections the results for each galaxy are discussed separately. For a better understanding of the interpretation, see the rules of thumb given in Schoenmakers (1999).
4.1 NGC 2366
Using accurately defined centre coordinates, CT08 performed a harmonic decomposition of the Hermite velocity field of NGC 2366 (see also dB08). We also use the Hermite velocity field, but different centre coordinates (see Table 3). The radial distribution of all fitted parameters is shown in Fig. 2. The black filled triangles represent the case where all parameters except for the centre position are left free. The inclination varies significantly in the inner 1.5 kpc. As NGC 2366 is dominated by close to solid body rotation, it is difficult to determine
The light grey crosses in Fig. 2 show the
constrained case where we use a fixed inclination of 63![]() and
a fixed position angle of 43
and
a fixed position angle of 43![]() (see Table 3). For
most of the tilted rings, the values are in very good agreement
with the ones of the unconstrained fit. A pronounced deviation can
be seen in the s1 term, where the constrained fit leads to
higher amplitudes between 1 and 2 kpc than the unconstrained fit.
This is due to the constant position angle which differs
significantly from the unconstrained values.
(see Table 3). For
most of the tilted rings, the values are in very good agreement
with the ones of the unconstrained fit. A pronounced deviation can
be seen in the s1 term, where the constrained fit leads to
higher amplitudes between 1 and 2 kpc than the unconstrained fit.
This is due to the constant position angle which differs
significantly from the unconstrained values.
The median value of the quadratically-added amplitude for each
order is given in the lower left panel of Fig. 2. In
both cases the amplitudes are below 3
![]() .
As the innermost
region of a galaxy is most significant for the cusp-core debate
(de Blok 2004), we also show the median values within 1 kpc
(open triangles). These are generally below 1
.
As the innermost
region of a galaxy is most significant for the cusp-core debate
(de Blok 2004), we also show the median values within 1 kpc
(open triangles). These are generally below 1
![]() and therefore
even smaller than the ones averaged over the entire radial range.
and therefore
even smaller than the ones averaged over the entire radial range.
![]() is below 3
is below 3
![]() in the inner 2.5 kpc and rises to
9
in the inner 2.5 kpc and rises to
9
![]() in the outer parts, contributing about 9% (constrained
case) and 6% (unconstrained case) to the maximum rotation
velocity of NGC 2366 (see Table 4).
in the outer parts, contributing about 9% (constrained
case) and 6% (unconstrained case) to the maximum rotation
velocity of NGC 2366 (see Table 4).
In general, our results agree very well with the results of CT08 despite the different centre coordinates. This is to be expected, as CT08 have already addressed the problem of inaccurate centre positions. They showed that for dwarf galaxies, which are characterised by solid body rotation in the inner parts, the results of the harmonic decomposition are insensitive to small offsets in the centre position.
4.2 ESO 059-G001
The results of the harmonic decomposition of ESO 059-G001 are shown in Fig. 3. The inclination at 2 kpc drops to 30
The median amplitudes are below 1
![]() .
.
![]() stays below 3
stays below 3
![]() over the entire radial range and only contributes 2% (constrained case) and
1% (unconstrained case) to the maximum rotation velocity (see
Table 4).
over the entire radial range and only contributes 2% (constrained case) and
1% (unconstrained case) to the maximum rotation velocity (see
Table 4).
ESO 059-G001 is dominated by close to solid body rotation and additionally,
the inclination is low. A tilted-ring analysis with free parameters is
therefore difficult to perform. However, the constrained case with a fixed
inclination of 44![]() and a position angle of 325
and a position angle of 325![]() still gives
acceptable values. As long as i does not differ too much from the
median value, the fits are in good agreement with the unconstrained ones. The
residual map given in Fig. 1 also shows that the kinematic
parameters derived from the constrained approach represent the galaxy quite
well.
still gives
acceptable values. As long as i does not differ too much from the
median value, the fits are in good agreement with the unconstrained ones. The
residual map given in Fig. 1 also shows that the kinematic
parameters derived from the constrained approach represent the galaxy quite
well.
4.3 ESO 215-G?009
ESO 215-G?009 has a strongly varying and very low inclination in the inner 3.5 kpc (see Fig. 4). As shown for ESO 059-G001, a low inclination makes it very difficult to perform a tilted-ring analysis by leaving all parameters free. The partially unreasonable values for the inclination in the inner 3.5 kpc of the unconstrained case (with i as low as 5
Most of the amplitudes of
the harmonic components are close to zero. The values of
![]() are
typically below 10
are
typically below 10
![]() contributing about 8.5% to the maximum rotation
velocity (see Table 4). The median amplitudes are below 5
contributing about 8.5% to the maximum rotation
velocity (see Table 4). The median amplitudes are below 5
![]() ,
in
the inner kpc below 3
,
in
the inner kpc below 3
![]() .
.
We also show the results of the unconstrained fit: the low
inclination causes very large circular velocity components (note
that we do not plot the values between 1 and 3 kpc that have high
formal errors). The low inclination also becomes noticeable in the
non-circular components, which are partly as high as 20
![]() .
.
4.4 NGC 4861
The results of the harmonic decomposition of NGC 4861 are given in Fig. 5. The amplitudes of the non-circular components are usually close to zero. No pronounced deviation can be seen, which fits into the picture of a quiescent galaxy without spiral arm structure as described in van Eymeren et al. (2009b). The median values of the quadratically-added amplitudes for each harmonic order are below 2.5 ![\begin{figure}
\par\includegraphics[width=18cm,bb=48 173 570 653, clip=]{12119fg5.ps}\end{figure}](/articles/aa/full_html/2009/37/aa12119-09/img79.png) |
Figure 5: The same as in Fig. 2 for NGC 4861. The inclination and the position angle for the constrained fit are listed in Table 3. |
| Open with DEXTER | |
4.5 NGC 5408
Figure 6 shows the results for NGC 5408. In her PhD thesis, van Eymeren (2008) suggested that this galaxy has two kinematic systems, which is probably the reason for the clear and well-defined radial variation of the inclination in the unconstrained fit. Nevertheless, the amplitudes of the non-circular motions are small.
For the constrained case we use a fixed inclination of 58![]() and a fixed position angle of 300
and a fixed position angle of 300![]() (see Table 3).
In the inner 2.5 kpc this inclination agrees with the one from the
unconstrained fit. However, it differs significantly from the
inclination of the outer kinematic system. For r>2.5 kpc this
results in different inclination corrections for the constrained
and the unconstrained cases, which can be seen, e.g., in the small
offset in c1.
(see Table 3).
In the inner 2.5 kpc this inclination agrees with the one from the
unconstrained fit. However, it differs significantly from the
inclination of the outer kinematic system. For r>2.5 kpc this
results in different inclination corrections for the constrained
and the unconstrained cases, which can be seen, e.g., in the small
offset in c1.
![\begin{figure}
\par\includegraphics[width=18cm,bb=48 173 570 653, clip=]{12119fg6.ps}\end{figure}](/articles/aa/full_html/2009/37/aa12119-09/img80.png) |
Figure 6: The same as in Fig. 2 for NGC 5408. The inclination and the position angle for the constrained fit are listed in Table 3. |
| Open with DEXTER | |
4.6 IC 5152
Except for one outlier in the inner 1 kpc, the inclination of IC 5152 is roughly constant with radius (see Fig. 7). The position angle increases at 2 kpc by about 20 ![\begin{figure}\par\includegraphics[width=18cm,bb=48 173 570 653, clip=]{12119fg7.ps}\end{figure}](/articles/aa/full_html/2009/37/aa12119-09/img81.png) |
Figure 7: The same as in Fig. 2 for IC 5152. The inclination and the position angle for the constrained fit are listed in Table 3. |
| Open with DEXTER | |
4.7 Discussion
In all sample galaxies, the non-circular motions contribute on average about 8% (constrained case) and about 4% (unconstrained case) to the maximum rotation velocity. However, in the inner few kpcs the rotation velocity has not yet reached its maximum value. Furthermore, for the cusp-core debate the inner few kpcs are most relevant, whereas non-circular motions in the outer parts of a galaxy, though interesting, are not relevant. Therefore, we perform a more detailed analysis of the quadratically-added amplitude of all non-circular motions within the inner 5 kpc. We concentrate on the results of the constrained case. Especially in the inner few kpcs, a strong change in inclination or position angle is not to be expected, so that it is a reasonable assumption to keep both parameters fixed. As Table 4 shows, the amplitudes of the constrained case are usually up to a factor of two higher than the amplitudes of the unconstrained case. Therefore, the constrained case gives an upper limit to the amount of non-circular motions.
Figure 8 shows the amplitudes of the constrained case
averaged within rings of 1 kpc width (left panels) and within
rings of increasing radius (right panels). Furthermore, we
differentiate between the absolute amplitudes (upper panels) and
the amplitudes that are normalised by the local rotation velocity
(lower panels). In all sample galaxies and for all radii, the
non-circular motions generally contribute less than 25% to the
local rotation velocity, sometimes even less than 10%. In the
inner 1 kpc,
![]() is often close to 1 or
2
is often close to 1 or
2
![]() (see Table 4), which corresponds to about 5% to 25% of the local rotation velocity. According to the
simulations by Hayashi et al. (2004) and Hayashi & Navarro (2006), the
non-circular motions add up to about 50% of the local rotation
velocity at a radius of 1 kpc and even more below 1 kpc.
(see Table 4), which corresponds to about 5% to 25% of the local rotation velocity. According to the
simulations by Hayashi et al. (2004) and Hayashi & Navarro (2006), the
non-circular motions add up to about 50% of the local rotation
velocity at a radius of 1 kpc and even more below 1 kpc.
![\begin{figure}\par\includegraphics[width=18cm,bb=63 429 565 663, clip=]{12119fg8.ps}\end{figure}](/articles/aa/full_html/2009/37/aa12119-09/img83.png) |
Figure 8: The mean of the quadratically-added amplitudes derived from the constrained case. Upper left panel: the amplitudes of the non-circular motions within rings of 1 kpc width (i.e., 0<r<1 kpc, 1<r<2 kpc, ..., 4<r<5 kpc) for each galaxy (indicated by different symbols). Upper right panel: the same as the upper left panel, but the amplitudes of the non-circular motions are averaged within rings of increasing radius (i.e., 0<r<1 kpc, 0<r<2 kpc, ..., 0<r<5 kpc). Lower left and right panel: like the upper left and right panel, but the amplitudes of the non-circular motions are normalised by the local rotation velocity. |
| Open with DEXTER | |
In order to check if our harmonic decomposition is able to
quantify most of the non-circular motions, we follow CT08 and make
use of the residual velocity fields. In Fig. 9 we compare
the median of the absolute residual velocity fields created with
reswri (constrained case) with the median of the absolute
residual velocity fields created with rotcur. The galaxies
from our sample are represented by open black triangles. For a
comparison we also show the data points from CT08 (filled light
grey triangles). In agreement with CT08, the rotcur
residuals are larger than the reswri ones as rotcur
does not take non-circular motions into account. In comparison to
most of the galaxies studied by CT08, our sample dwarf galaxies
lie at the lower end of the distribution. The median value of the
reswri residuals
![]() is below
2
is below
2
![]() (see Table 4), which implies that the harmonic
decomposition up to third order has captured most of the non-circular motions.
(see Table 4), which implies that the harmonic
decomposition up to third order has captured most of the non-circular motions.
Altogether, we could show that while large non-circular motions might be found in dwarf galaxies, they are the exception rather than the rule. The galaxies in our sample have non-circular motions that are that small that they do not significantly affect the rotation curves. This implies that non-circular motions cannot artificially flatten the slope of the density profile and turn a cusp into a core.
![\begin{figure}\par\includegraphics[width=8.8cm,bb=63 519 275 723, clip=]{12119fg9.ps}\end{figure}](/articles/aa/full_html/2009/37/aa12119-09/img84.png) |
Figure 9: Median of the absolute residual field from the harmonic decomposition (constrained case) vs. the one from the rotation curve analysis. The light grey triangles represent the values derived by CT08. They are complemented by the results of our analysis (black open triangles). The error bars indicate the lower and upper quartile. |
| Open with DEXTER | |
5 Mass models
The H I rotation curves of our sample galaxies are only marginally influenced by non-circular motions. Therefore, we use the curves derived with rotcur (see Sect. 3 and Fig. 1, middle panels) to perform a mass decomposition with the GIPSY task rotmas. This task allows us to interactively fit the different components (halo, gas, stars) to the observed rotation curve by minimising the
5.1 Dark matter halo models
We use two models to describe the dark matter halo, which are the cuspy NFW halo (e.g., Navarro et al. 1996) and the cored pseudo-isothermal (ISO) halo (e.g., Binney & Tremaine 1987).
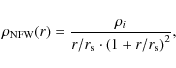
Numerical simulations show that the density of CDM haloes rises steeply
towards the halo centre (e.g., Navarro et al. 1996). The NFW mass-density
distribution is described as
 |
(5) |
where
![\begin{displaymath}\ensuremath{v_{\rm rot}} (r)=v_{200} \sqrt{\frac{\ln(1+cx)-(cx)/(1+cx)}{x[\ln(1+c)-c/(1+c)]}},
\end{displaymath}](/articles/aa/full_html/2009/37/aa12119-09/img88.png) |
(6) |
with x=r/r200. The concentration parameter
where r200 is the radius at which the density contrast exceeds 200, i.e., roughly the virial radius (Navarro et al. 1996). Note that we do not correct the NFW fits for adiabatic compression. As Sellwood & McGaugh (2005) show, the central halo concentration of dwarf galaxies increases only slightly from the primordial to the compressed halo, which means that it still fits the result from N-body simulations (
As a second model the empirically derived ISO halo is used
(Binney & Tremaine 1987). It describes a dark matter halo that has a core of roughly
constant density. The density profile is given by
 |
(8) |
with
 |
(9) |
5.2 Fitting process
As dwarf galaxies are believed to be dark matter dominated at all radii (de Blok & McGaugh 1997), the velocity contribution from the baryons is often neglected when decomposing the rotation curves of these galaxies. But although dark matter is the dominant component in dwarf galaxies, the baryons, i.e., gas and stars, are still important, especially close to the centre. Including all components, the observed rotation velocity is then given by |
(10) |
We model the rotation curves in various ways, partly including the baryons. The different approaches are described in the following.
Table 5: Parameters for the exponential disc fitting.
![\begin{figure}
\par\includegraphics[width=12cm,bb= 58 353 520 653,clip=]{12119f10.ps}\end{figure}](/articles/aa/full_html/2009/37/aa12119-09/img98.png) |
Figure 10: Mass decomposition of NGC 2366. The rotation curves for an NFW halo and a pseudo-isothermal halo are modelled for the full rotation curve, and for the inner 5 kpc only. From top to bottom the minimum-disc, the minimum-disc + gas, and the maximum-disc cases are fitted. Solid triangles represent the observed rotation curve, long-dashed lines the dark matter halo component,dotted lines the gas component, dashed-dotted lines the contribution of the stars, and solid lines the resulting model fit. |
| Open with DEXTER | |
5.2.1 Minimum-disc case
This is the simplest case ignoring all baryonic contributions. Thus, only the dark matter haloes are fitted to the observed rotation curve.
5.2.2 Minimum-disc + gas case
In this case, the contribution of the gas is taken into account as well. In addition to H I, which dominates the gas component, He and metals are included by scaling the H I column density by a factor of 1.4. As the ratio between the molecular gas and H I is much lower in dwarf galaxies than in luminous spirals (Leroy et al. 2005; Taylor et al. 1998), we do not correct for this gas component. In order to create a surface density profile for the H I, the GIPSY task ellint is taken, using the H I intensity maps (Figs. 2-7, lower right panels) and the parameters from the best tilted-ring model (see Table 3) as an input. The output of ellint is given in terms of mean flux and has therefore to be converted to physical units. We then use the GIPSY task rotmod in order to determine the rotation of the gas under the assumption of an infinitesimally thin disc.
5.2.3 Maximum-disc case
Here, the contribution of the gas, the stars, and the dark matter halo are simultaneously fitted to the observed rotation curve. For all galaxies, the surface density can be described by a Sérsic model (Sersic 1968) |
(11) |
with
![\begin{figure}
\par\includegraphics[width=9cm,bb= 58 343 320 653,clip=]{12119f11.ps}\end{figure}](/articles/aa/full_html/2009/37/aa12119-09/img102.png) |
Figure 11: Mass decomposition of ESO 059-G001. The same as in Fig. 10. No reduced rotation curve is fitted. |
| Open with DEXTER | |
6 Results and discussion
As described in, e.g., vE09a, the outer parts of the rotation curves show large uncertainties due to the sparsely filled tilted rings. Therefore, we decompose the rotation curves twice for each of the different cases (see Sect. 5.2) and for each dark matter density profile: first, using the entire rotation curve and secondly, using a truncated rotation curve restricted to the inner few kpcs only. The results for all sample galaxies are shown in Figs. 10-15. From top to bottom the minimum-disc, the minimum-disc + gas, and the maximum-disc cases are fitted. Solid triangles represent the observed rotation curve, long-dashed lines the dark matter halo component, dotted lines the gas component, and dashed-dotted lines the contribution of the stars. The resulting model fit is indicated by a solid line.
Tables 6 and 7 list the
results of the best fits for both halo profiles including the
reduced ![]() values. We assume v200 to be the rotation
speed, which we estimate from the flat parts of the observed
rotation curves. Following Eq. (7), we then derive the
concentration parameter c, which is between 9 and 10 for all
sample galaxies, i.e., consistent with CDM simulations. Both
values. We assume v200 to be the rotation
speed, which we estimate from the flat parts of the observed
rotation curves. Following Eq. (7), we then derive the
concentration parameter c, which is between 9 and 10 for all
sample galaxies, i.e., consistent with CDM simulations. Both
parameters are kept fixed so that r200 is the only free parameter. In the case of the ISO halo both parameters, the core
radius ![]() and the core density
and the core density
![]() ,
are
allowed to vary.
,
are
allowed to vary.
In the following subsections we present the results for each galaxy separately.
![\begin{figure}
\par\includegraphics[width=12cm,bb= 58 343 520 653,clip=]{12119f12.ps}\end{figure}](/articles/aa/full_html/2009/37/aa12119-09/img104.png) |
Figure 12: Mass decomposition of ESO 215-G?009. The same as in Fig. 10. A reduced rotation curve is fitted up to a radius of 8.1 kpc. |
| Open with DEXTER | |
![\begin{figure}
\par\includegraphics[width=12cm,bb= 58 383 520 693,clip=]{12119f13.ps}\end{figure}](/articles/aa/full_html/2009/37/aa12119-09/img105.png) |
Figure 13: Mass decomposition of NGC 4861. The same as in Fig. 10. A reduced rotation curve is fitted up to a radius of 5.5 kpc. |
| Open with DEXTER | |
![\begin{figure}
\par\includegraphics[width=12cm,bb= 58 436 520 653,clip=]{12119f14.ps}\end{figure}](/articles/aa/full_html/2009/37/aa12119-09/img106.png) |
Figure 14: Mass decomposition of NGC 5408. The stellar contribution cannot be fitted. A reduced rotation curve is fitted up to a radius of 6.3 kpc. Otherwise the same as in Fig. 10. |
| Open with DEXTER | |
Table 6: The basic parameters of the mass decomposition - the NFW model.
Table 7: The basic parameters of the mass decomposition - the pseudo-isothermal halo model.
6.1 NGC 2366
A mass decomposition of NGC 2366 has already been done by Oh08. They derived the rotation curve from a so-called ``bulk'' velocity field, which only contains the circularly rotating components (Oh08). Our analysis is done on the Hermite velocity field that still contains non-circular motions. However, as shown in Sect. 4.1, the non-circular motions in NGC 2366 (as well as in the other sample galaxies) do not significantly affect the rotation curves.
Figure 10 shows the resulting model fits. A comparison
of the reduced ![]() values (see Tables 6 and
7) reveals that the ISO halo gives much better
results than the NFW halo independent of the radius of the
rotation curve. In the outer parts, the observed rotation curve is
affected by uncertainties caused by the sparsely filled tilted
rings and by asymmetries in the H I velocity field (cf. vE09a).
Therefore, it strongly declines from a radius of 5 kpc on so that
we also model the curve within the inner 5 kpc only. This gives
improved fits for both haloes:
values (see Tables 6 and
7) reveals that the ISO halo gives much better
results than the NFW halo independent of the radius of the
rotation curve. In the outer parts, the observed rotation curve is
affected by uncertainties caused by the sparsely filled tilted
rings and by asymmetries in the H I velocity field (cf. vE09a).
Therefore, it strongly declines from a radius of 5 kpc on so that
we also model the curve within the inner 5 kpc only. This gives
improved fits for both haloes:
![]() is lower by a
factor of four when using the NFW halo and even by a factor of 20
when using the ISO halo. Additionally,
is lower by a
factor of four when using the NFW halo and even by a factor of 20
when using the ISO halo. Additionally,
![]() decreases by including gas and stars.
decreases by including gas and stars.
The reduced H I rotation curve fitted with an ISO halo gives the lowest
values for
![]() .
The resulting model fit agrees very well with
the observed curve. Moreover, the values of the core
densities and radii from the ISO models are comparable to the results of Oh08.
.
The resulting model fit agrees very well with
the observed curve. Moreover, the values of the core
densities and radii from the ISO models are comparable to the results of Oh08.
![\begin{figure}
\par\includegraphics[width=12cm,bb= 58 343 520 653,clip=]{12119f15.ps}\end{figure}](/articles/aa/full_html/2009/37/aa12119-09/img113.png) |
Figure 15: Mass decomposition of IC 5152. The same as in Fig. 10. A reduced rotation curve is fitted up to a radius of 2.1 kpc. |
| Open with DEXTER | |
6.2 ESO 059-G001
As the rotation velocities of this galaxy have small errors (also in the outer parts), we only perform a mass decomposition for the entire rotation curve. Figure 11 shows the resulting curves. Again, the ISO halo gives much better results than the NFW halo. Especially the models for the minimum-disc and minimum-disc + gas cases using the truncated rotation curve result in very low
6.3 ESO 215-G?009
ESO 215-G?009 is modelled over the entire radial range and over the inner 8.1 kpc only (see Fig. 12). In both cases, the NFW halo fits sometimes even give lower
6.4 NGC 4861
Figure 13 shows the results for NGC 4861. The reduced6.5 NGC 5408
The H I rotation curve of NGC 5408 rises very slowly in the inner 2 kpc. Using the photometric data from Noeske et al. (2003) (see Table 5), it is impossible to derive a stellar rotation curve that lies below the total rotation curve, even when assuming a stellar M/L ratio of 0.1, which is the lowest value before becoming unphysical (Spano et al. 2008). We either underestimate the rotation in the central part of the galaxy due to the low spatial resolution or the photometric data are not accurate enough. We therefore decide against modelling the stellar component.
Figure 14 shows the resulting fits. Again, the
![]() values are very high for the NFW halo and much
smaller for the ISO halo. For this galaxy, the reduced rotation
curve did not improve the quality of the models, which is probably
due to the fact that the repeated rise of the rotation curve
beyond a radius of 7 kpc matches the first rise of the curve.
values are very high for the NFW halo and much
smaller for the ISO halo. For this galaxy, the reduced rotation
curve did not improve the quality of the models, which is probably
due to the fact that the repeated rise of the rotation curve
beyond a radius of 7 kpc matches the first rise of the curve.
6.6 IC 5152
The results for IC 5152 are presented in Fig. 15. We fit NFW and ISO haloes to the entire radial range and to the inner 2.1 kpc only. Although both dark matter halo models provide adequate fits (the
6.7 Discussion
In contrast to recent work by dB08 and Oh08, we fitted the NFW profiles with fixed values of v200 and c (see the beginning of this section). With this approach we assumed reasonable values for v200 and c that follow cosmological predictions, and also obtained reasonable results for r200. Nevertheless, we could show that in general, the observed rotation curves can be better fitted by an ISO halo than by an NFW halo, although at least in the case of ESO 215-G?009 the NFW fits are equally good or even better than the ISO fits. The values of the core radius
As mentioned in the introduction, CDM simulations predict density profiles
with a steep inner slope of ![]() (Navarro et al. 1996) or even
(Navarro et al. 1996) or even
![]() (Moore et al. 1998). de Blok et al. (2001a) showed for their sample of
LSB galaxies that the observed distribution of
(Moore et al. 1998). de Blok et al. (2001a) showed for their sample of
LSB galaxies that the observed distribution of ![]() peaks at
peaks at
![]() .
In order to compare these results with ours, we first measure
the slopes in the inner kpc of our data by plotting the logarithm of the
density vs. the logarithm of the radius (see Fig. 16). For
all galaxies except for IC 5152,
.
In order to compare these results with ours, we first measure
the slopes in the inner kpc of our data by plotting the logarithm of the
density vs. the logarithm of the radius (see Fig. 16). For
all galaxies except for IC 5152, ![]() lies between -0.43 and 0.03 (see
also Table 8), which is within the errors of the
lies between -0.43 and 0.03 (see
also Table 8), which is within the errors of the ![]() determined by de Blok et al. (2001a). ESO 215-G?009, which partly showed higher
determined by de Blok et al. (2001a). ESO 215-G?009, which partly showed higher
![]() values for the ISO halo model than for the NFW halo model
(see Sect. 6.3), has an
values for the ISO halo model than for the NFW halo model
(see Sect. 6.3), has an ![]() of
-0.35. This means that its innermost slope can better be described by an
ISO halo.
of
-0.35. This means that its innermost slope can better be described by an
ISO halo.
![\begin{figure}
\par\includegraphics[width=12cm,bb= 58 213 470 723,clip=]{12119f16.ps}\end{figure}](/articles/aa/full_html/2009/37/aa12119-09/img118.png) |
Figure 16:
The density profiles of all sample galaxies derived from the observed
rotation curves (open grey triangles). Their inner slopes |
| Open with DEXTER | |
In Fig. 16 we also fitted the ISO and NFW profiles of
the minimum-disc case (dotted and long-dashed lines,
respectively). They do not always agree with the observed density
profiles, which is to be expected as
![]() is often
quite high, indicating a bad fit.
is often
quite high, indicating a bad fit.
Figure 17 shows ![]() vs. the logarithm of the innermost
radius (de Blok et al. 2001a, see also Oh08). Data from previous studies are plotted
with grey open circles (de Blok et al. 2001a), grey open squares
(de Blok & Bosma 2002), grey open triangles (Swaters et al. 2003), and black solid
triangles (Oh08). Our own results are plotted with black solid squares and are
in good agreement with all previous works. Only IC 5152, which has an inner
slope of
vs. the logarithm of the innermost
radius (de Blok et al. 2001a, see also Oh08). Data from previous studies are plotted
with grey open circles (de Blok et al. 2001a), grey open squares
(de Blok & Bosma 2002), grey open triangles (Swaters et al. 2003), and black solid
triangles (Oh08). Our own results are plotted with black solid squares and are
in good agreement with all previous works. Only IC 5152, which has an inner
slope of
![]() ,
is close to CDM predictions.
,
is close to CDM predictions.
We now discuss possible systematic errors in the data: Swaters et al. (2003) and Spekkens et al. (2005) used rotation
curves of dwarf and low surface brightness galaxies obtained from optical
long-slit spectra in order to measure the slopes of the mass
distribution. They compared their results to model spectra by taking into
account possible sources of uncertainties like slit misalignment, slit
width, and seeing. Both studies came to the result that the galaxies do not
require haloes with steep cusps, but that haloes with ![]() cannot be
ruled out. However, they clearly showed that a steeper slope (
cannot be
ruled out. However, they clearly showed that a steeper slope (![]() )
is
not consistent with the observed profiles. As we use 2D velocity fields, our
data are not affected by the abovementioned errors. We can also rule out
geometric effects caused by low velocity gas picked up along the line of
sight at higher inclinations, as our data have a very high spectral
resolution.
)
is
not consistent with the observed profiles. As we use 2D velocity fields, our
data are not affected by the abovementioned errors. We can also rule out
geometric effects caused by low velocity gas picked up along the line of
sight at higher inclinations, as our data have a very high spectral
resolution.
Table 8:
Slope ![]() in the inner kpc.
in the inner kpc.
![\begin{figure}
\par\includegraphics[width=8.8cm,bb= 63 523 270 713,clip=]{12119f17.ps}\end{figure}](/articles/aa/full_html/2009/37/aa12119-09/img123.png) |
Figure 17: The inner slope of the dark matter density profiles plotted against the radius of the innermost point. Presented in grey are the results from publications by de Blok et al. (2001a) (open circles), de Blok & Bosma (2002) (open squares), and by Swaters et al. (2003) (open triangles). Shown in black are the results from Oh08 (solid triangles). Our results are overplotted with black squares. We fit the isothermal and NFW profiles following de Blok et al. (2001a). |
| Open with DEXTER | |
As already mentioned in Sect. 4.1, CT08 could show that inaccurate centre positions do not change the inner slope of a rotation curve. Non-circular motions are detected, but low enough to not significantly change the rotation velocities. Nevertheless, there are problems that affect our results such as the low spatial resolution, especially of the ATCA data.
Thus, for the majority of galaxies studied here, the ISO halo reproduces the observed rotation curves much better than the NFW halo, which is in good agreement with previous studies (e.g., Spano et al. 2008; Kuzio de Naray et al. 2008). The slopes of the observed rotation curves are inconsistent with CDM predictions, but agree with the results from de Blok et al. (2001a). One explanation for the cusp-core discrepancy might be that most simulations neglect baryons. And indeed, first approaches to include baryons into CDM simulations show that their contribution changes the inner density profile from a cusp to a core (Romano-Díaz et al. 2008).
7 Summary
We used VLA and ATCA H I synthesis data of a sample of six nearby irregular dwarf galaxies in order to decompose the observed rotation curves into the contributions from stars, gas, and the dark matter halo. In order to rule out systematic effects, we first performed a harmonic decomposition of the Hermite velocity fields. The results show that the quadratically-added amplitude
With this knowledge, we decomposed the observed rotation curves into their
components. We fitted a cuspy NFW halo and a cored pseudo-isothermal halo to
the rotation curves and modelled the minimum-disc, the minimum-disc + gas, and
the maximum-disc cases. The resulting model fits show that in all sample
galaxies (except for ESO 215-G?009), the observed rotation curves are better
represented by the ISO halo than by the NFW halo. As the outer parts of the
rotation curves are affected by uncertainties caused by the sparsely filled
tilted rings, we also performed a mass decomposition by fitting the inner few
kpcs only. For most galaxies, this significantly improved the quality of both
the NFW and the ISO halo models. The reduced ![]() could in most cases be
decreased for both halo models by including the gas. In some cases, a further
improvement could be achieved when also including the stars. This implies that
baryons should not be neglected, at least not in the inner part of dwarf
galaxies (see also Swaters et al. 2009).
could in most cases be
decreased for both halo models by including the gas. In some cases, a further
improvement could be achieved when also including the stars. This implies that
baryons should not be neglected, at least not in the inner part of dwarf
galaxies (see also Swaters et al. 2009).
Acknowledgements
The authors would like to thank the anonymous referee for the useful comments that significantly improved this paper.
Furthermore, we thank Nic Bonne and Erwin de Blok for their help with the mass decomposition. We would also like to thank Fabian Walter for providing the THINGS data of NGC 2366 and Eric Wilcots for providing the VLA data cubes of NGC 4861.
This work was partly supported by the Deutsche Forschungsgesellschaft (DFG) under the SFB 591, by the Research School of the Ruhr-Universität Bochum, and by the Australia Telescope National Facility, CSIRO. It is partly based on observations with the Australia Telescope Compact Array. The ATCA is part of the Australia Telescope which is funded by the Commonwealth of Australia for operation as a National Facility managed by CSIRO. It is also partly based on archival VLA data of the National Radio Astronomy Observatory. The NRAO is a facility of the National Science Foundation operated under cooperative agreement by Associated Universities, Inc.
We made use of NASA's Astrophysics Data System (ADS) Bibliographic Services and the NASA/IPAC Extragalactic Database (NED) which is operated by the Jet Propulsion Laboratory, California Institute of Technology, under contract with the National Aeronautics and Space Administration.
References
- Binney, J., & Tremaine, S. 1987, Galactic Dynamics (Princeton, NJ: Princeton University Press), 747 (In the text)
- Bosma, A. 1978, Ph.D. Thesis, Groningen Univ.
- Côté, S., Carignan, C., & Freeman, K. C. 2000, AJ, 120, 3027 [NASA ADS] [CrossRef]
- de Blok, W. J. G. 2004, in Dark Matter in Galaxies, ed. S. Ryder, D. Pisano, M. Walker, & K. Freeman, IAU Symp., 220, 69 (In the text)
- de Blok, W. J. G., & Bosma, A. 2002, A&A, 385, 816 [NASA ADS] [CrossRef] [EDP Sciences] (In the text)
- de Blok, W. J. G., & McGaugh, S. S. 1997, MNRAS, 290, 533 [NASA ADS] (In the text)
- de Blok, W. J. G., McGaugh, S. S., Bosma, A., & Rubin, V. C. 2001a, ApJ, 552, L23 [NASA ADS] [CrossRef]
- de Blok, W. J. G., McGaugh, S. S., & Rubin, V. C. 2001b, AJ, 122, 2396 [NASA ADS] [CrossRef] (In the text)
- de Blok, W. J. G., Bosma, A., & McGaugh, S. 2003, MNRAS, 340, 657 [NASA ADS] [CrossRef] (In the text)
- de Blok, W. J. G., Walter, F., Brinks, E., et al. 2008, AJ, 136, 2648 [NASA ADS] [CrossRef]
- de Vaucouleurs, G., de Vaucouleurs, A., Corwin, H. G., et al. 1991, Third Reference Catalogue of Bright Galaxies (Vols. 1-3, XII, Berlin-Heidelberg-New York: Springer-Verlag)
- Donato, F., Gentile, G., Salucci, P., et al. 2009 [arXiv:e-prints] (In the text)
- Flores, R. A., & Primack, J. R. 1994, ApJ, 427, L1 [NASA ADS] [CrossRef]
- Gentile, G., Salucci, P., Klein, U., Vergani, D., & Kalberla, P. 2004, MNRAS, 351, 903 [NASA ADS] [CrossRef]
- Gentile, G., Burkert, A., Salucci, P., Klein, U., & Walter, F. 2005, ApJ, 634, L145 [NASA ADS] [CrossRef] (In the text)
- Gil de Paz, A., & Madore, B. F. 2005, ApJS, 156, 345 [NASA ADS] [CrossRef]
- Hayashi, E., & Navarro, J. F. 2006, MNRAS, 373, 1117 [NASA ADS] [CrossRef]
- Hayashi, E., Navarro, J. F., Jenkins, A., et al. 2004 [arXiv:Astrophysics e-prints]
- Hunter, D. A., Elmegreen, B. G., & van Woerden, H. 2001, ApJ, 556, 773 [NASA ADS] [CrossRef]
- Karachentsev, I. D., Sharina, M. E., Dolphin, A. E., et al. 2002a, A&A, 385, 21 [NASA ADS] [CrossRef] [EDP Sciences]
- Karachentsev, I. D., Sharina, M. E., Makarov, D. I., et al. 2002b, A&A, 389, 812 [NASA ADS] [CrossRef] [EDP Sciences]
- Karachentsev, I. D., Dolphin, A., Tully, R. B., et al. 2006, AJ, 131, 1361 [NASA ADS] [CrossRef]
- Karachentsev, I. D., Tully, R. B., Dolphin, A., et al. 2007, AJ, 133, 504 [NASA ADS] [CrossRef]
- Kirby, E. M., Jerjen, H., Ryder, S. D., & Driver, S. P. 2008, AJ, 136, 1866 [NASA ADS] [CrossRef]
- Kirby, E. M., et al. 2009, in preparation (In the text)
- Koribalski, B. S., & Jerjen, H. 2008, in Galaxies in the Local Volume, ed. B. S. Koribalski, & H. Jerjen (Berlin: Springer), ISBN 978-1-4020-6932-1
- Koribalski, B. S., et al. 2009, in preparation
- Kuzio de Naray, R., McGaugh, S. S., de Blok, W. J. G., & Bosma, A. 2006, ApJS, 165, 461 [NASA ADS] [CrossRef]
- Kuzio de Naray, R., McGaugh, S. S., & de Blok, W. J. G. 2008, ApJ, 676, 920 [NASA ADS] [CrossRef]
- Leroy, A., Bolatto, A. D., Simon, J. D., & Blitz, L. 2005, ApJ, 625, 763 [NASA ADS] [CrossRef]
- Marchesini, D., D'Onghia, E., Chincarini, G., et al. 2002, ApJ, 575, 801 [NASA ADS] [CrossRef]
- Moore, B., Governato, F., Quinn, T., Stadel, J., & Lake, G. 1998, ApJ, 499, L5 [NASA ADS] [CrossRef]
- Moore, B., Quinn, T., Governato, F., Stadel, J., & Lake, G. 1999, MNRAS, 310, 1147 [NASA ADS] [CrossRef] (In the text)
- Navarro, J. F., Frenk, C. S., & White, S. D. M. 1996, ApJ, 462, 563 [NASA ADS] [CrossRef] (In the text)
- Noeske, K. G., Papaderos, P., Cairós, L. M., & Fricke, K. J. 2003, A&A, 410, 481 [NASA ADS] [CrossRef] [EDP Sciences] (In the text)
- Oh, S.-H., de Blok, W. J. G., Walter, F., Brinks, E., & Kennicutt, R. C. 2008, AJ, 136, 2761 [NASA ADS] [CrossRef] (In the text)
- Parodi, B. R., Barazza, F. D., & Binggeli, B. 2002, A&A, 388, 29 [NASA ADS] [CrossRef] [EDP Sciences] (In the text)
- Portinari, L., Sommer-Larsen, J., & Tantalo, R. 2004, MNRAS, 347, 691 [NASA ADS] [CrossRef] (In the text)
- Rhee, G., Valenzuela, O., Klypin, A., Holtzman, J., & Moorthy, B. 2004, ApJ, 617, 1059 [NASA ADS] [CrossRef] (In the text)
- Romano-Díaz, E., Shlosman, I., Hoffman, Y., & Heller, C. 2008, ApJL, 685, L105 [NASA ADS] [CrossRef] (In the text)
- Rubin, V. C., Thonnard, N., & Ford, Jr., W. K. 1978, ApJ, 225, L107 [NASA ADS] [CrossRef]
- Salucci, P. 2001, MNRAS, 320, L1 [NASA ADS] [CrossRef] (In the text)
- Schoenmakers, R. H. M. 1999, Ph.D. Thesis, Rijksuniversiteit Groningen, The Netherlands (In the text)
- Schoenmakers, R. H. M., Franx, M., & de Zeeuw, P. T. 1997, MNRAS, 292, 349 [NASA ADS] (In the text)
- Sellwood, J. A., & McGaugh, S. S. 2005, ApJ, 634, 70 [NASA ADS] [CrossRef] (In the text)
- Sersic, J. L. 1968, Atlas de galaxias australes (Cordoba, Argentina: Observatorio Astronomico) (In the text)
- Simon, J. D., Bolatto, A. D., Leroy, A., Blitz, L., & Gates, E. L. 2005, ApJ, 621, 757 [NASA ADS] [CrossRef]
- Spano, M., Marcelin, M., Amram, P., et al. 2008, MNRAS, 383, 297 [NASA ADS]
- Spekkens, K., & Sellwood, J. A. 2007, ApJ, 664, 204 [NASA ADS] [CrossRef] (In the text)
- Spekkens, K., Giovanelli, R., & Haynes, M. P. 2005, AJ, 129, 2119 [NASA ADS] [CrossRef]
- Spergel, D. N., Verde, L., Peiris, H. V., et al. 2003, ApJS, 148, 175 [NASA ADS] [CrossRef]
- Spergel, D. N., Bean, R., Doré, O., et al. 2007, ApJS, 170, 377 [NASA ADS] [CrossRef]
- Springel, V., White, S. D. M., Jenkins, A., et al. 2005, Nature, 435, 629 [NASA ADS] [CrossRef] (In the text)
- Swaters, R. A., Madore, B. F., van den Bosch, F. C., & Balcells, M. 2003, ApJ, 583, 732 [NASA ADS] [CrossRef]
- Swaters, R. A., Sancisi, R., van Albada, T. S., & van der Hulst, J. M. 2009, A&A, 493, 871 [NASA ADS] [CrossRef] [EDP Sciences] (In the text)
- Taylor, C. L., Kobulnicky, H. A., & Skillman, E. D. 1998, AJ, 116, 2746 [NASA ADS] [CrossRef]
- Thuan, T. X., Hibbard, J. E., & Lévrier, F. 2004, AJ, 128, 617 [NASA ADS] [CrossRef] (In the text)
- Tikhonov, N. A., & Galazutdinova, O. A. 2008, Astron. Rep., 52, 19 [NASA ADS] (In the text)
- Tolstoy, E., Saha, A., Hoessel, J. G., & McQuade, K. 1995, AJ, 110, 1640 [NASA ADS] [CrossRef]
- Trachternach, C., de Blok, W. J. G., Walter, F., Brinks, E., & Kennicutt, Jr., R. C. 2008, AJ, 136, 2720 [NASA ADS] [CrossRef] (In the text)
- van den Bosch, F. C., Robertson, B. E., Dalcanton, J. J., & de Blok, W. J. G. 2000, AJ, 119, 1579 [NASA ADS] [CrossRef]
- van der Hulst, J. M., Terlouw, J. P., Begeman, K. G., Zwitser, W., & Roelfsema, P. R. 1992, in Astronomical Data Analysis Software and Systems I, ed. D. M. Worrall, C. Biemesderfer, & J. Barnes, ASP Conf. Ser., 25, 131 (In the text)
- van Eymeren, J. 2008, Ph.D. Thesis, Astronomisches Institut der Ruhr-Universitaet Bochum, Germany (In the text)
- van Eymeren, J., Marcelin, M., Koribalski, B., et al. 2009a, A&A, 493, 511 [NASA ADS] [CrossRef] [EDP Sciences]
- van Eymeren, J., Marcelin, M., Koribalski, B. S., et al. 2009b, A&A, 505, 105 [CrossRef] [EDP Sciences] (In the text)
- Walter, F., Brinks, E., de Blok, W. J. G., et al. 2008, AJ, 136, 2563 [NASA ADS] [CrossRef] (In the text)
- Warren, B. E., Jerjen, H., & Koribalski, B. S. 2004, AJ, 128, 1152 [NASA ADS] [CrossRef] (In the text)
- Warren, B. E., Jerjen, H., & Koribalski, B. S. 2006, AJ, 131, 2056 [NASA ADS] [CrossRef]
- Wilcots, E. M., Lehman, C., & Miller, B. 1996, AJ, 111, 1575 [NASA ADS] [CrossRef] (In the text)
Footnotes
- ...(LVHIS
![[*]](/icons/foot_motif.png)
- LVHIS project webpage: www.atnf.csiro.au/research/LVHIS/
- ... GIPSY
- URL: http://www.astro.rug.nl/~gipsy/
All Tables
Table 1: Some general properties of the sample galaxies.
Table 2: The main observational parameters.
Table 3: Kinematic parameters of the sample galaxies.
Table 4: Derived quantities from the harmonic decomposition.
Table 5: Parameters for the exponential disc fitting.
Table 6: The basic parameters of the mass decomposition - the NFW model.
Table 7: The basic parameters of the mass decomposition - the pseudo-isothermal halo model.
Table 8:
Slope ![]() in the inner kpc.
in the inner kpc.
All Figures
| |
Figure 1:
The H I kinematics of all sample galaxies. Left
panels:
Hermite h3 velocity fields. The systemic velocity is marked
by a bold line, the beam is placed in the lower left corner. Contour
levels are overlaid in steps of 10
|
| Open with DEXTER | |
| In the text | |
| |
Figure 2:
The results of the unconstrained (black triangles) and constrained
(light grey crosses) harmonic decomposition of NGC 2366. For the constrained
fit the inclination and the position angle were fixed to the values given in
Table 3. Upper left: following Eq. (1),
circular (c1) and non-circular (c2, c3, s1, s2, s3)
harmonic components corrected for inclination and plotted vs. radius
r. Upper right: systemic velocity c0, inclination
i, and position angle PA, again plotted vs. radius
r. The dashed horizontal lines represent the error weighted means of
the unconstrained fit. The inclination and position angle are from the
tilted-ring fit assuming circular rotation. For the unconstrained case the
error bars represent the formal errors. Lower left: the median
amplitudes of the individual harmonic components derived from
Eqs. (2) and (3) plotted vs. harmonic number
m. The error bars denote the upper and lower quartile of the
distribution of the unconstrained
|
| Open with DEXTER | |
| In the text | |
| |
Figure 3: The same as in Fig. 2 for ESO 059-G001. The inclination and the position angle for the constrained fit are listed in Table 3. |
| Open with DEXTER | |
| In the text | |
| |
Figure 4:
The same as in Fig. 2 for ESO 215-G?009. The
inclination and the position angle for the constrained fit are listed in
Table 3. The analysis of this galaxy is based on the constrained
case (see Sect. 4.3). Therefore, no
|
| Open with DEXTER | |
| In the text | |
| |
Figure 5: The same as in Fig. 2 for NGC 4861. The inclination and the position angle for the constrained fit are listed in Table 3. |
| Open with DEXTER | |
| In the text | |
| |
Figure 6: The same as in Fig. 2 for NGC 5408. The inclination and the position angle for the constrained fit are listed in Table 3. |
| Open with DEXTER | |
| In the text | |
| |
Figure 7: The same as in Fig. 2 for IC 5152. The inclination and the position angle for the constrained fit are listed in Table 3. |
| Open with DEXTER | |
| In the text | |
| |
Figure 8: The mean of the quadratically-added amplitudes derived from the constrained case. Upper left panel: the amplitudes of the non-circular motions within rings of 1 kpc width (i.e., 0<r<1 kpc, 1<r<2 kpc, ..., 4<r<5 kpc) for each galaxy (indicated by different symbols). Upper right panel: the same as the upper left panel, but the amplitudes of the non-circular motions are averaged within rings of increasing radius (i.e., 0<r<1 kpc, 0<r<2 kpc, ..., 0<r<5 kpc). Lower left and right panel: like the upper left and right panel, but the amplitudes of the non-circular motions are normalised by the local rotation velocity. |
| Open with DEXTER | |
| In the text | |
| |
Figure 9: Median of the absolute residual field from the harmonic decomposition (constrained case) vs. the one from the rotation curve analysis. The light grey triangles represent the values derived by CT08. They are complemented by the results of our analysis (black open triangles). The error bars indicate the lower and upper quartile. |
| Open with DEXTER | |
| In the text | |
| |
Figure 10: Mass decomposition of NGC 2366. The rotation curves for an NFW halo and a pseudo-isothermal halo are modelled for the full rotation curve, and for the inner 5 kpc only. From top to bottom the minimum-disc, the minimum-disc + gas, and the maximum-disc cases are fitted. Solid triangles represent the observed rotation curve, long-dashed lines the dark matter halo component,dotted lines the gas component, dashed-dotted lines the contribution of the stars, and solid lines the resulting model fit. |
| Open with DEXTER | |
| In the text | |
| |
Figure 11: Mass decomposition of ESO 059-G001. The same as in Fig. 10. No reduced rotation curve is fitted. |
| Open with DEXTER | |
| In the text | |
| |
Figure 12: Mass decomposition of ESO 215-G?009. The same as in Fig. 10. A reduced rotation curve is fitted up to a radius of 8.1 kpc. |
| Open with DEXTER | |
| In the text | |
| |
Figure 13: Mass decomposition of NGC 4861. The same as in Fig. 10. A reduced rotation curve is fitted up to a radius of 5.5 kpc. |
| Open with DEXTER | |
| In the text | |
| |
Figure 14: Mass decomposition of NGC 5408. The stellar contribution cannot be fitted. A reduced rotation curve is fitted up to a radius of 6.3 kpc. Otherwise the same as in Fig. 10. |
| Open with DEXTER | |
| In the text | |
| |
Figure 15: Mass decomposition of IC 5152. The same as in Fig. 10. A reduced rotation curve is fitted up to a radius of 2.1 kpc. |
| Open with DEXTER | |
| In the text | |
| |
Figure 16:
The density profiles of all sample galaxies derived from the observed
rotation curves (open grey triangles). Their inner slopes |
| Open with DEXTER | |
| In the text | |
| |
Figure 17: The inner slope of the dark matter density profiles plotted against the radius of the innermost point. Presented in grey are the results from publications by de Blok et al. (2001a) (open circles), de Blok & Bosma (2002) (open squares), and by Swaters et al. (2003) (open triangles). Shown in black are the results from Oh08 (solid triangles). Our results are overplotted with black squares. We fit the isothermal and NFW profiles following de Blok et al. (2001a). |
| Open with DEXTER | |
| In the text | |
Copyright ESO 2009
Current usage metrics show cumulative count of Article Views (full-text article views including HTML views, PDF and ePub downloads, according to the available data) and Abstracts Views on Vision4Press platform.
Data correspond to usage on the plateform after 2015. The current usage metrics is available 48-96 hours after online publication and is updated daily on week days.
Initial download of the metrics may take a while.