| Issue |
A&A
Volume 504, Number 2, September III 2009
|
|
|---|---|---|
| Page(s) | 531 - 542 | |
| Section | Stellar structure and evolution | |
| DOI | https://doi.org/10.1051/0004-6361/200912260 | |
| Published online | 16 July 2009 | |
Using population synthesis of massive stars to study the interstellar medium near OB associations
R. Voss1,2 - R. Diehl1 - D. H. Hartmann3 - M. Cerviño4 - J. S. Vink5 - G. Meynet6 - M. Limongi7 - A. Chieffi7
1 - Max-Planck-Institut für extraterrestrische Physik,
Giessenbachstrasse, 85748, Garching, Germany
2 - Excellence Cluster Universe, Technische Universität München,
Boltzmannstr 2, 85748, Garching, Germany
3 - Department of Physics and Astronomy, Clemson University,
Kinard Lab of Physics, Clemson, SC 29634-0978, USA
4 - Instituto de Astrofísica de Andalucía (CSIC), Camino bajo de Huétor 50, Apdo. 3004, Granada 18080, Spain
5 - Armagh Observatory, College Hill, Armagh, BT61 9DG, Northern Ireland, UK
6 - Geneva University, Geneva Observatory, 1290 Versoix, Switzerland
7 - INAF Osservatorio Astronomico di Roma, via Frascati 33, 00040 Monteporzio Catone Roma, Italy
Received 2 April 2009 / Accepted 7 July 2009
Abstract
Aims. We study the massive stars in OB associations and their surrounding interstellar medium environment, using a population synthesis code.
Methods. We developed a new population synthesis code for groups of massive stars, where we model the emission of different forms of energy and matter from the stars of the association. In particular, the ejection of the two radioactive isotopes 26Al and 60Fe is followed, as well as the emission of hydrogen ionizing photons, and the kinetic energy of the stellar winds and supernova explosions. We investigate various alternative astrophysical inputs and the resulting output sensitivities, especially effects due to the inclusion of rotation in stellar models. As the aim of the code is the application to relatively small populations of massive stars, special care is taken to address their statistical properties. Our code incorporates both analytical statistical methods applicable to small populations, as well as extensive Monte Carlo simulations.
Results. We find that the inclusion of rotation in the stellar models has a large impact on the interactions between OB associations and their surrounding interstellar medium. The emission of 26Al in the stellar winds is strongly enhanced, compared to non-rotating models with the same mass-loss prescription. This compensates the recent reductions in the estimates of mass-loss rates of massive stars due to the effects of clumping. Despite the lower mass-loss rates, the power of the winds is actually enhanced for rotating stellar models. The supernova power (kinetic energy of their ejecta) is decreased due to longer lifetimes of rotating stars, and therefore the wind power dominates over supernova power for the first 6 Myr after a burst of star-formation. For populations typical of nearby star-forming regions, the statistical uncertainties are large and clearly non-Gaussian.
Key words: stars: winds, outflows - stars: early-type - stars: abundances - ISM: abundances - gamma rays: observations
1 Introduction
Massive stars dynamically shape the interstellar medium around them on timescales of a few Myr (see e.g. Lozinskaya 2001). Due to their high mass loss rates (Barlow et al. 1981; Lamers & Morton 1976; Castor et al. 1975) and terminal velocities of their winds (Howarth & Prinja 1989; Lamers et al. 1995) and their supernova explosions (Jones 1998) they are important sources of mechanical power causing interstellar medium (ISM) turbulence and the formation of shells and cavities (e.g. van der Hucht 1987; Maeder & Conti 1994; Leitherer et al. 1992). Their large UV luminosities, they furthermore cause the surrounding medium to be photoionized to significant distances (Panagia 1973; Vacca et al. 1996).
The mixing of ejecta from young stars into the interstellar medium is
an important process in the interplay between star formation and galaxy
evolution. A unique window into these processes is provided by the radioactive
isotope 26Al, traced by its ![]() -ray decay line at
1808.63 keV. With a mean lifetime of
-ray decay line at
1808.63 keV. With a mean lifetime of ![]() 1 Myr it is a long-term tracer
of nucleosynthesis for populations of sources able to eject it
sufficiently fast after synthesis (Prantzos & Diehl 1996). The COMPTEL instrument
aboard the Compton Gamma Ray Observatory (CGRO) has mapped
the 26Al emission at 1809 keV in a 9-year full sky survey.
From a comparison between the image morphology and the known spiral
arm tangents and regions of star formation, one can deduce that
massive stars dominate the Galactic 26Al production, and that
the contribution from novae and AGB stars must be relatively minor
(Knödlseder et al. 1999; Plüschke 2001; Prantzos & Diehl 1996; Diehl et al. 2006,1995).
Localized groups of massive stars in star-forming regions such as
Cygnus and Orion emit clear 26Al signals, and these regions
provide an important contribution to the total amount of 26Al
present in the Milky Way, and it is therefore important to understand
these basic building blocks. Typically, massive stars eject a few
1 Myr it is a long-term tracer
of nucleosynthesis for populations of sources able to eject it
sufficiently fast after synthesis (Prantzos & Diehl 1996). The COMPTEL instrument
aboard the Compton Gamma Ray Observatory (CGRO) has mapped
the 26Al emission at 1809 keV in a 9-year full sky survey.
From a comparison between the image morphology and the known spiral
arm tangents and regions of star formation, one can deduce that
massive stars dominate the Galactic 26Al production, and that
the contribution from novae and AGB stars must be relatively minor
(Knödlseder et al. 1999; Plüschke 2001; Prantzos & Diehl 1996; Diehl et al. 2006,1995).
Localized groups of massive stars in star-forming regions such as
Cygnus and Orion emit clear 26Al signals, and these regions
provide an important contribution to the total amount of 26Al
present in the Milky Way, and it is therefore important to understand
these basic building blocks. Typically, massive stars eject a few
![]() of 26Al through their winds and supernova (SN)
explosions (see e.g. Limongi & Chieffi 2006), and
the total mass of 26Al in the Milky Way is estimated to be
of 26Al through their winds and supernova (SN)
explosions (see e.g. Limongi & Chieffi 2006), and
the total mass of 26Al in the Milky Way is estimated to be
![]() (Diehl et al. 2006).
A similar tracer is the isotope 60Fe, observed by its 1173 keV and
1333 keV decay lines (Harris et al. 2005; Smith 2004). This isotope is
also emitted in the supernova explosions (Limongi & Chieffi 2006).
The lifetime of 60Fe has recently been revised to
(Diehl et al. 2006).
A similar tracer is the isotope 60Fe, observed by its 1173 keV and
1333 keV decay lines (Harris et al. 2005; Smith 2004). This isotope is
also emitted in the supernova explosions (Limongi & Chieffi 2006).
The lifetime of 60Fe has recently been revised to ![]() 3.8 Myr,
from the previous estimate of
3.8 Myr,
from the previous estimate of ![]() 2 Myr (Rugel, private communication).
While the lines are significantly weaker than the 26Al
line, it is possible to detect them when integrating over large regions
of the Milky Way.
2 Myr (Rugel, private communication).
While the lines are significantly weaker than the 26Al
line, it is possible to detect them when integrating over large regions
of the Milky Way.
Table 1: Parameter names used throughout the paper.
We have developed a population synthesis code that follows the evolution of massive stars and computes the ejection of 26Al and 60Fe from a star-forming region. To facilitate studies of the dynamics of the surrounding environment, the code also computes the kinetic energy and the mass ejected from the winds and the SN explosions, as well as the ionizing flux. In contrast to Starburst99 (Vazquez & Leitherer 2005; Leitherer et al. 1999), we focus on the study of relatively small, nearby star-forming regions in the Milky Way. Due to the limited number of massive stars in thsee individual regions, stochastic processes can cause their behaviour to deviate strongly from the mean results obtained for large populations. Because of this, the code is designed to not only calculate the average behaviour from an analytical integration over the initial mass function (IMF), but also the expected distribution of output quantities for finite populations. This is both done using analytical approximations and Monte Carlo simulations. To do this we implemented the statistical methods of Cerviño & Luridiana (2006). These enable us to determine when Monte Carlo simulations are mandatory in order to properly describe the distributions, and how many simulations are needed to obtain statistically robust results.
Here we describe the population synthesis code, and discuss the dependence on the various physical input models. We compare our results to the predictions of Starburst99 for kinetic luminosity and UV flux, and to Cerviño et al. (2000a) for radioactive isotope production. We discuss the simulated stellar populations in the context of the inter-stellar medium (ISM), with emphasis on the changes induced by recent stellar evolution tracks for massive stars (Limongi & Chieffi 2006; Meynet & Maeder 2005).
2 Population synthesis of massive stars
The synthesis code calculates time profiles of the emission of radioactive elements 26Al and 60Fe from a population of massive stars, for an assumed star formation history. The code also traces the energy and mass ejected from the stars through stellar winds and supernova explosions, as well as the UV radiation they emit. These quantities are the primary tools necessary to study the dynamical effects of the interaction between massive stars and the surrounding ISM. We interpolate between the discrete inputs from the models, mainly using linear interpolation, except for temperatures, masses, luminosities, surface gravities and stellar ages, which we interpolate logarithmically, unless otherwise noted.
The code is divided into two separate parts: in the first one stellar tracks are used to calculate time profiles for individual stars, and we interpolate between these to create a fine grid of stellar tracks as a function of progenitor mass. For a given time we tabulate the stellar properties as a function of initial stellar mass, thereby creating isochrones. The second part of the code uses the isochrones as input, and for each isochrone calculates integrated quantities for a given population of stars, weighting the isochrone values by the IMF. This part of the program calculates analytically the mean value of the distribution of properties we are interested in, as well as some high order moments that allows an analytical estimation of the probability distribution of populations with a finite (and small) size (see Cerviño & Luridiana 2006, for details). It also estimates these distributions with Monte Carlo simulations for populations of any size, where intial stellar masses are chosen randomly, with relative probabilities according to the assumed IMF. These outputs are complementary in the sense that the average values are suitable for very large populations of stars, such as entire galaxies, whereas the Monte Carlo simulations are necessary for very small star-forming regions. The analytical probability distributions are useful in intermediate cases ranging from about one hundred to thousands of massive stars. As we aim to model star forming regions in the solar neighbourhood, we restricted our study to stellar models of solar metallicity.
The details of the physical ingredients of the code are described in the following. For a number of processes, switches are included to select between alternative models. We identify these through convenient parameter names that are used throughout the paper when discussing the outputs of the code. The paramer names are summarized in Table 1.
Table 2: Classification criteria for WR stars, and their wind velocities.
2.1 Stellar evolution
For the stellar evolution of massive stars several alternative sets of
stellar tracks are implemented. The default (geneva05)
consists of the solar metallicity, rotating stellar models described
in Meynet & Maeder (2005) and Palacios et al. (2005). These models all have ZAMS
rotation velocities of 300 km s-1, producing time averaged equatorial
velocities on the main sequence between 200 and 250 km s-1.
There are two versions of these models,
one including the calculation of 26Al (Palacios et al. 2005) for stars
with initial masses between 25 and 120 ![]() ,
and one
without (Meynet & Maeder 2005) for stars with initial masses between 9 and
120
,
and one
without (Meynet & Maeder 2005) for stars with initial masses between 9 and
120 ![]() .
We therefore use the stellar tracks of Palacios et al. (2005)
above 25
.
We therefore use the stellar tracks of Palacios et al. (2005)
above 25 ![]() ,
combined with the models of Meynet & Maeder (2005) below
this limit as our default. However, to enable the calculation of 26Al,
parts of the numerical calculation was changed between the two sets of
models (Meynet, private communication). We therefore test our results
on the stellar energy ejection against those obtained using stellar tracks
of Meynet & Maeder (2005) only (geneva05alt), see Sect. 3.3.
,
combined with the models of Meynet & Maeder (2005) below
this limit as our default. However, to enable the calculation of 26Al,
parts of the numerical calculation was changed between the two sets of
models (Meynet, private communication). We therefore test our results
on the stellar energy ejection against those obtained using stellar tracks
of Meynet & Maeder (2005) only (geneva05alt), see Sect. 3.3.
The main effects of rotation on the yields of 26Al,
and the energy and mass ejection are the following (Palacios et al. 2005; Meynet & Maeder 2005):
Rotational mixing allows surface enrichment in 26Al at
an earlier evolutionary stage than obtained in models without rotational
mixing. When rotation is not accounted for, surface 26Al enrichment
occurs only when the deep layers of the stars where 26Al is
synthesized are uncovered by the stellar winds. In rotating models
rotational diffusion enables surface enrichments well before the regions
processed by hydrogen burning are uncovered by the stellar winds. This
effect increases the quantity of ejected 26Al with respect to
non-rotating models. For the same reasons rotating stars present
surface abundance characteristics of the Wolf-Rayet stages before the
stellar winds have uncovered the core. This causes the stars to enter
the WR-phase earlier and to increase the WR lifetimes. For example a 40 (85) ![]() non-rotating star has a WR lifetime of merely
non-rotating star has a WR lifetime of merely
![]() 0.1 Myr, whereas the rotating counterpart has a WR lifetime
of almost 0.4 (1.4) Myr. Also rotational mixing enables stars with
masses as low as 22
0.1 Myr, whereas the rotating counterpart has a WR lifetime
of almost 0.4 (1.4) Myr. Also rotational mixing enables stars with
masses as low as 22 ![]() to become WR-stars. These effects
allow rotating models to eject more 26Al into the ISM than
non-rotating ones. This also increases the mass loss and therefore
the amount of kinetic energy ejected into the ISM. Furthermore
stellar lifetimes are increased by rotation, with a 15-25% increase in
the hydrogen burning lifetimes. This delays the onset of the
supernova explosions, and lowers the supernova rate for a population
of rotating stars, compared to a population of non-rotating stars.
to become WR-stars. These effects
allow rotating models to eject more 26Al into the ISM than
non-rotating ones. This also increases the mass loss and therefore
the amount of kinetic energy ejected into the ISM. Furthermore
stellar lifetimes are increased by rotation, with a 15-25% increase in
the hydrogen burning lifetimes. This delays the onset of the
supernova explosions, and lowers the supernova rate for a population
of rotating stars, compared to a population of non-rotating stars.
Rotational mixing can in many respects improve the correspondence between the outputs of stellar models and the observed features of massive stars. For instance, rotational mixing may be the cause for surface nitrogen enrichments in OB main sequence stars (see e.g. Hunter et al. 2007; Maeder et al. 2008). With the relatively low mass loss rates presently favoured (see below), non-rotating models underpredict the observed ratio of WR to O-type stars. Rotational mixing favors WR formation, and rotating models are thus in better agreement with observations. Provided that most of the nitrogen enriched stars and WR stars are produced by single star evolution, rotation appears as a key physical ingredient of the models. However, we note that the comparison of models with observations and the discussion about whether the rotating models reproduce the observed properties of massive stars better than non-rotating models is currently a subject of debate (e.g. Hamann et al. 2006; Vazquez & Leitherer 2007; Meynet & Maeder 2005; Eldridge & Vink 2006).
Two alternative sets of non-rotating models are implemented. One set (geneva97)
consists of the solar metallicity models of Meynet et al. (1997) combined
with the models of Maeder & Meynet (1994) for stars below 25 ![]() .
The other set (LC06) consists of the stellar tracks of Limongi & Chieffi (2006).
The main differences between the sets of stellar evolution models
relevant to our study are the inclusion of rotation
in the geneva05 stellar models, and the updated wind mass-loss
estimates included in the geneva05 and LC06 calculations.
These new estimates reduce the wind mass-loss rates of the geneva05
and the LC06 models significantly compared to the geneva97
models: in the Wolf-Rayet (WR) phases the inclusion of clumping in the
interpretation of the observational data leads to
reduced mass-loss rates by a factor of 2-3 compared to the earlier
models (Nugis & Lamers 2000). Also the theoretical mass-loss rates
for O and B stars of Vink et al. (2000,2001) are lower by similar factors in
comparison to earlier empirical values of e.g. de Jager et al. (1988).
See the recent review by Puls et al. (2008) for an extensive description of mass-loss
rates.
.
The other set (LC06) consists of the stellar tracks of Limongi & Chieffi (2006).
The main differences between the sets of stellar evolution models
relevant to our study are the inclusion of rotation
in the geneva05 stellar models, and the updated wind mass-loss
estimates included in the geneva05 and LC06 calculations.
These new estimates reduce the wind mass-loss rates of the geneva05
and the LC06 models significantly compared to the geneva97
models: in the Wolf-Rayet (WR) phases the inclusion of clumping in the
interpretation of the observational data leads to
reduced mass-loss rates by a factor of 2-3 compared to the earlier
models (Nugis & Lamers 2000). Also the theoretical mass-loss rates
for O and B stars of Vink et al. (2000,2001) are lower by similar factors in
comparison to earlier empirical values of e.g. de Jager et al. (1988).
See the recent review by Puls et al. (2008) for an extensive description of mass-loss
rates.
We follow each stellar track through the provided evolutionary points and calculate the quantities needed for the population synthesis.
2.1.1 Kinetic energy
The rate of kinetic energy emitted in the winds of the stars is calculated
from
![]() ,
where
,
where ![]() is the mass-loss
rate from the stellar atmosphere and
is the mass-loss
rate from the stellar atmosphere and
![]() is the velocity of the wind at infinity
(the terminal velocity). This represents the energy available once the
wind has escaped the gravitational potential of the star. The interaction of the winds
with the ISM can convert a large fraction of the energy into gas turbulence and radiation.
The mass loss rate is given by the stellar tracks. To calculate the wind
velocity we first coarsely classify the stars according to
the following criteria (Leitherer et al. 1999): stars with a mass loss
rate above
is the velocity of the wind at infinity
(the terminal velocity). This represents the energy available once the
wind has escaped the gravitational potential of the star. The interaction of the winds
with the ISM can convert a large fraction of the energy into gas turbulence and radiation.
The mass loss rate is given by the stellar tracks. To calculate the wind
velocity we first coarsely classify the stars according to
the following criteria (Leitherer et al. 1999): stars with a mass loss
rate above
![]() yr-1 and effective
temperatures in the range
yr-1 and effective
temperatures in the range
![]() are classified as
luminous blue variables
(LBVs). Stars with an effective temperature above
are classified as
luminous blue variables
(LBVs). Stars with an effective temperature above
![]() and
a fractional abundance of hydrogen at the surface below 0.4,
are considered WR-stars. They are furthermore divided
into subclasses according to the surface abundances (Smith & Maeder 1991; Leitherer et al. 1999),
see Table 2.
and
a fractional abundance of hydrogen at the surface below 0.4,
are considered WR-stars. They are furthermore divided
into subclasses according to the surface abundances (Smith & Maeder 1991; Leitherer et al. 1999),
see Table 2.
The terminal velocity of the wind depends on the type of star.
We utilize two different prescriptions for the calculation:
in the default mode (wind08) stars outside the categories
defined above are divided into hot stars with
![]() and cool stars with
and cool stars with
![]() at a
temperature of
at a
temperature of
![]() (Lamers et al. 1995), where
(Lamers et al. 1995), where
![]() is the
escape velocity at the surface of the star. Luminous blue variables are
assumed to have winds with low velocities (200 km s-1) and the
velocities of the WR-winds are estimated from Niedzielski & Skorzynski (2002) and
given in Table 2.
is the
escape velocity at the surface of the star. Luminous blue variables are
assumed to have winds with low velocities (200 km s-1) and the
velocities of the WR-winds are estimated from Niedzielski & Skorzynski (2002) and
given in Table 2.
The alternative mode wind00 corresponds to the assumptions
in Starburst99 (Leitherer et al. 1992). Here stars outside the
categories have wind velocities given by
![]() (Howarth & Prinja 1989), luminous blue variables again have
(Howarth & Prinja 1989), luminous blue variables again have
![]() km s-1,
and the velocities of the WR-winds are estimated from Prinja et al. (1990),
and given in Table 2.
km s-1,
and the velocities of the WR-winds are estimated from Prinja et al. (1990),
and given in Table 2.
2.1.2 Radioactive isotopes
The wind ejection of the radioactive isotope 26Al is followed along
the stellar tracks. The ejection rate is found from multiplying the
surface abundance fraction of 26Al with the mass loss rate,
and the amount of 26Al present in the interstellar medium around
the star is calculated by taking into account the decay timescale of
![]() 1 Myr. The other radioactive isotope considered in this study,
60Fe, is not ejected in the stellar winds, but only in the supernova
explosions. For this isotope we consider two decay timescales, with
1 Myr. The other radioactive isotope considered in this study,
60Fe, is not ejected in the stellar winds, but only in the supernova
explosions. For this isotope we consider two decay timescales, with ![]() 2 Myr as
the default and
2 Myr as
the default and ![]() 3.8 Myr suggested by recent measurements.
At the last point of the stellar tracks the radioactive yields from
the supernova explosions are added. We have two prescriptions for
calculating the yields: in the default mode (yieldsLC2006) we
use the yields calculated by Limongi & Chieffi (2006). The yields are found
based on the initial mass of the stars, interpolating linearly between
their data points. In the alternative method (yieldsWW95) the
yields below initial masses of
3.8 Myr suggested by recent measurements.
At the last point of the stellar tracks the radioactive yields from
the supernova explosions are added. We have two prescriptions for
calculating the yields: in the default mode (yieldsLC2006) we
use the yields calculated by Limongi & Chieffi (2006). The yields are found
based on the initial mass of the stars, interpolating linearly between
their data points. In the alternative method (yieldsWW95) the
yields below initial masses of
![]() are taken from
Woosley & Weaver (1995). Above this mass we set the output of each star
to
are taken from
Woosley & Weaver (1995). Above this mass we set the output of each star
to
![]() for both 26Al and 60Fe. This is
approximately the average yields found in Cerviño et al. (2000a) from linking
the core mass of the geneva97 stellar tracks with the supernova
yields of Woosley et al. (1995). We note that in Cerviño et al. (2000a),
the results depend strongly on the method used (see their Figs. 1 and 2).
Our crude approximation therefore reflects unknown physics.
The total yield is not affected dramatically
by these uncertainties, as there are few massive stars, and for
26Al, the emission from these stars is dominated by the wind
contribution.
for both 26Al and 60Fe. This is
approximately the average yields found in Cerviño et al. (2000a) from linking
the core mass of the geneva97 stellar tracks with the supernova
yields of Woosley et al. (1995). We note that in Cerviño et al. (2000a),
the results depend strongly on the method used (see their Figs. 1 and 2).
Our crude approximation therefore reflects unknown physics.
The total yield is not affected dramatically
by these uncertainties, as there are few massive stars, and for
26Al, the emission from these stars is dominated by the wind
contribution.
2.2 Creation of the stellar isochrones
We use the stellar tracks to create isochrones for a user-defined set of times after the onset of star formation. To facilitate the interpolation between the stellar tracks, for each of the tracks a subset of 51 equivalent evolutionary points are extracted according to the definitions given in Maeder (1990). The reduction of the stellar tracks to 51 points eliminates some of the finer details of stellar evolution, but the uncertainties due to this simplification are small compared to the uncertainties of defining equivalent evolutionary points and interpolating between stellar models with different initial mass. For each isochrone an array of initial stellar masses is defined, and stellar tracks are produced by interpolation between the equivalent points of the nearest input stellar tracks. We note that the ages at the equivalent points are interpolated using a cubic spline in logarithmic space, as lower degree interpolation methods create artificial results (e.g. in the supernova rate, see Cerviño et al. 2001, Fig. 1). The isochrone values are then found by interpolation along these stellar tracks. We note that the geneva05 tracks are only calculated to the end of central helium burning, while the geneva97 tracks are followed to the end of central carbon burning. We use the last available grid points and extrapolate it towards the end, thus neglecting the stages between the ends of the stellar tracks and the supernova explosions.
2.3 Calculation of population properties
The stellar isochrones are the basis of our population synthesis.
Each isochrone is used to calculate the population properties, both
by integrating the isochrone analytically and using Monte Carlo techniques.
Both methods sample the number of stars of a given mass according
to the initial mass function (IMF), for which
we use the Salpeter mass function (Salpeter 1955) as the default,
with 8 ![]() and 120
and 120 ![]() as lower and upper integration
limits. As only massive stars are
investigated here, we do not consider more complicated IMF models
(e.g. Kroupa 2001; Scalo 1986) that also address the shape of the mass
function at lower masses. We furthermore include
an implementation of the statistical methods described
in Cerviño & Luridiana (2006) to account for statistical variability of
stellar-mass weightings for smaller numbers of stars. This
allows us to calculate analytically the statistical distribution of
the output quantities, depending on the number of stars in the stellar
population, similar to what can be done with Monte Carlo simulations.
We do not include the effect of binaries (Eldridge et al. 2008; Vanbeveren et al. 2007).
The frequency of interacting binaries,
and the effects of the interactions are poorly known, and the effects
on the parameters studied in this paper are difficult to assess. Such
interactions might remove outer layers of primary stars, and rejuvenate
secondary stars. Both processes can potentially enhance the 26Al
ejection (Langer et al. 1998).
as lower and upper integration
limits. As only massive stars are
investigated here, we do not consider more complicated IMF models
(e.g. Kroupa 2001; Scalo 1986) that also address the shape of the mass
function at lower masses. We furthermore include
an implementation of the statistical methods described
in Cerviño & Luridiana (2006) to account for statistical variability of
stellar-mass weightings for smaller numbers of stars. This
allows us to calculate analytically the statistical distribution of
the output quantities, depending on the number of stars in the stellar
population, similar to what can be done with Monte Carlo simulations.
We do not include the effect of binaries (Eldridge et al. 2008; Vanbeveren et al. 2007).
The frequency of interacting binaries,
and the effects of the interactions are poorly known, and the effects
on the parameters studied in this paper are difficult to assess. Such
interactions might remove outer layers of primary stars, and rejuvenate
secondary stars. Both processes can potentially enhance the 26Al
ejection (Langer et al. 1998).
2.3.1 Supernova explosions
In this study, we assume that the kinetic energy ejected in a supernova explosion is 1051 erg s-1 (e.g. Woosley et al. 1995), irrespective of the progenitor mass. The supernova rate is derived as an average over a period of 0.1 Myr and from this the ``kinetic luminosity'' of the supernovae is calculated. The mass ejected in supernova explosions is found from the difference between the mass of the last point in the stellar evolution code, and the mass of the compact remnant. We assume that all neutron stars have a canonical mass of 1.4
2.3.2 Ionizing flux
The ionizing flux of each star is calculated by linking stellar
atmosphere models to the state of the star. The surface gravity
and the effective temperature are used to find the atmosphere model
with the closest resemblance. In the WR-phases, we use the method of
Smith et al. (2005) to find these values at an optical depth of ![]() .
In this method, the effective temperature is simply given by
.
In this method, the effective temperature is simply given by
![]() ,
where
,
where
![]() is the hydrostatic effective temperature of the stellar models, and T2/3 is the corrected surface temperature given in the
geneva97 and geneva05 stellar models. This parameter
is unavailable in the L&C05 stellar models, and the ionizing
flux is therefore not calculated for these.
is the hydrostatic effective temperature of the stellar models, and T2/3 is the corrected surface temperature given in the
geneva97 and geneva05 stellar models. This parameter
is unavailable in the L&C05 stellar models, and the ionizing
flux is therefore not calculated for these.
The default set of atmosphere models (atmosMS) applied for OB stars (Martins et al. 2005) and for WR stars (Smith et al. 2005) both take non-LTE, wind and line-blanketing effects into account. For stars with parameters beyond the range of these models we use Kurucz (1992) atmospheres. For comparison with Starburst99 we include an option of using the models of (Smith et al. 2005) for both WR and OB stars (atmosSmith), and for comparison with earlier studies an alternative set of models (atmosOLD) consisting of the WR models of Schmutz et al. (1992) and the OB models of Schaerer & de Koter (1997), again supplemented by the models of Kurucz (1992).
3 Population synthesis results
We combine the results obtained from integrating over the individual isochrones to create time profiles of the average ejection of 26Al, 60Fe, kinetic energy, hot gas and the ionizing flux. In this section we discuss these individual quantities, and their dependence on the assumptions made.
3.1 Comparison with previous studies
Synthesis of stellar populations is an important tool for understanding stellar clusters and galaxies. Since the first studies (Bruzual 1983; Tinsley 1978) the sophistication of the models have increased drastically (e.g. Bruzual & Charlot 2003). The majority of these models are designed to predict the spectra of large stellar populations over a wide range of ages and metallicities, for which the exact parameters of the few massive stars are not of major importance. This is quite different from the goal of our study, which is the calculation of parameters of interest for the interactions between massive stars and their environment. Most studies are therefore not suited for comparison with the present study. Thus we use Starburst99 for comparing our results on the ionizing flux and kinetic luminosity. For this purpose we produce a model with parameters similar to parameters of their studies. We choose a model with a Salpeter IMF (Salpeter 1955), between
![\begin{figure}
\par\resizebox{9cm}{!}{\includegraphics[angle=0]{12260f1.eps}}
\end{figure}](/articles/aa/full_html/2009/35/aa12260-09/img38.png) |
Figure 1: Comparison between Starburst99 (thin black lines) and our results (thick grey lines) for a co-eval population. top: time profiles of the kinetic power emitted through the stellar winds (solid) and supernova explosions (dotted). Bottom: the ionizing flux. |
| Open with DEXTER | |
![\begin{figure}
\par\resizebox{9cm}{!}{\includegraphics[angle=0]{12260f2.eps}}
\end{figure}](/articles/aa/full_html/2009/35/aa12260-09/img39.png) |
Figure 2:
Average time profiles of 26Al and 60Fe for a coeval
population of stars, for the three different sets of stellar models
available. The lines show the amount of the elements present in the
ISM per star in the
|
| Open with DEXTER | |
3.2 Radioactive isotopes
Compared to the previous population synthesis study of 26Al and 60Fe (Cerviño et al. 2000a), our study includes new stellar models, specifically geneva05 and LC06. Both take the reduced mass loss estimates into account, and the geneva05 model furthermore includes the effects of stellar rotation. The LC06 model consistently includes the supernova explosions of the very massive stars. While these improvements have been discussed for individual stars and for the overall ejection from a population of stars (Limongi & Chieffi 2006; Palacios et al. 2005), the effects on the time profile have not been evaluated in detail. The time profiles of 26Al and 60Fe in the interstellar medium for a coeval population of stars are shown in Fig. 2. The 26Al has been divided into the wind and supernova contributions. Only the supernova contribution to 60Fe is shown, as the wind contribution is negligible.
The wind contribution of 26Al is relatively similar for the geneva05 and the geneva97 models. This is quite surprising, given the relatively large differences between these models. The reason is that the lower wind mass-loss in the geneva05 models is compensated by two effects. One is the rotational mixing of elements, which leads to larger surface abundances. The other is the longer lifetime of the rotating models, which causes the amount of material lost to be similar to the amount lost in the geneva97 model, despite the lower rate of mass loss. This is also the reason that the 26Al time profile shows a more extended peak for the rotating models. The LC06 models, on the other hand, predict much less 26Al ejection by the pre-supernova wind, for two main reasons: with the reduced mass loss, the rate of ejection is low, and the 26Al is not effectively mixed to the surface.
For the supernova ejections the differences between the model predictions of 26Al and 60Fe are smaller, with the main effect coming from the longer lifetime of the rotating models causing a slightly less peaked profile. On the other hand, drastic differences between the predictions for the first 10 Myr are obvious when comparing yieldsWW95 and yieldsLC2006. This probably mainly reflects the uncertainties in the final structure of the very massive stars, at the time of the supernova explosions. The low mass-loss in the models of (Limongi & Chieffi 2006) gives very massive cores, that produce large amounts of the elements. The higher mass-loss rates assumed in the study of Cerviño et al. (2000a) gives lighter cores, and this results in the yieldsWW95 being lower than the yieldsLC2006. We note that with the very large theoretical uncertainties, observations of 26Al and 60Fe thus have the potential to place interesting constraints on the final evolutionary state of very heavy stars, although in an indirect way, since only the integrated effect of different sources can be observed.
In Fig. 3, the average time profiles of 26Al
(including both the wind and the supernova contributions) and
60Fe are shown for different models, together with the statistical
variance. Shown are the 1![]() and 2
and 2![]() statistical deviations (the intervals containing 68% and 95% of the Monte Carlo simulations) for a population of 100 stars
in the
statistical deviations (the intervals containing 68% and 95% of the Monte Carlo simulations) for a population of 100 stars
in the
![]() range
range![]() , corresponding to a typical nearby
star forming region (for example the number of massive stars
formed within the last 15 Myr in the Orion OB1 association is estimated
to be close to 100 Brown et al. 1994). We note that the 8-120
, corresponding to a typical nearby
star forming region (for example the number of massive stars
formed within the last 15 Myr in the Orion OB1 association is estimated
to be close to 100 Brown et al. 1994). We note that the 8-120 ![]() range includes more massive stars than are observed in many nearby
regions. However, when a probabilistic description
(such as our Monte Carlo simulations) is assumed,
the limit should be the most massive star theoretically possible in the cluster.
Observed clusters correspond to random realizations of the IMF and
the most massive stars in these can therefore have much lower masses
than the upper limit of 120
range includes more massive stars than are observed in many nearby
regions. However, when a probabilistic description
(such as our Monte Carlo simulations) is assumed,
the limit should be the most massive star theoretically possible in the cluster.
Observed clusters correspond to random realizations of the IMF and
the most massive stars in these can therefore have much lower masses
than the upper limit of 120 ![]() (see also Sect. 4
where the contributions of various initial mass ranges to the observables
are shown).
(see also Sect. 4
where the contributions of various initial mass ranges to the observables
are shown).
![\begin{figure}
\par\resizebox{9cm}{!}{\includegraphics[angle=0]{12260f3.eps}}
\end{figure}](/articles/aa/full_html/2009/35/aa12260-09/img41.png) |
Figure 3:
Time profiles of 26Al ( top) and 60Fe ( bottom) for a
coeval population of stars. The solid
lines indicate the average profiles for the geneva05 stellar
models with the yieldsLC2006 supernova yields. The
the dark and light grey regions show the 1 |
| Open with DEXTER | |
From Fig. 3 it is obvious that for relatively small
populations, it is essential that these statistical effects are
taken into account, when interpreting observations. Also very interesting
is the ratio between the observable strengths of the 60Fe
and 26Al ![]() -ray lines. This is shown in Fig. 4 for the same models as in Fig. 3.
For much of the time, this ratio places stronger
constraints on the stellar models than the individual observations of
26Al and 60Fe. This is due to the fact that the emissions of
these two elements are correlated. The strong increase in the
60Fe/26Al ratio seen around the lifetime of an 8
-ray lines. This is shown in Fig. 4 for the same models as in Fig. 3.
For much of the time, this ratio places stronger
constraints on the stellar models than the individual observations of
26Al and 60Fe. This is due to the fact that the emissions of
these two elements are correlated. The strong increase in the
60Fe/26Al ratio seen around the lifetime of an 8 ![]() star
(
star
(![]() 35-50 Myr, depending on the stellar model) is simply an effect
of the longer lifetime of 60Fe, when the elements are not being
replenished (non-steady state situation).
35-50 Myr, depending on the stellar model) is simply an effect
of the longer lifetime of 60Fe, when the elements are not being
replenished (non-steady state situation).
Recent results (Rugel, in preparation) indicate
that the lifetime of 60Fe is significantly (![]() 3.8 Myr)
longer than the commonly used lifetime of
3.8 Myr)
longer than the commonly used lifetime of ![]() 2 Myr. It is unclear if
a different lifetime would have any significant impact on the nucleosynthesis
of 60Fe, and a study of this is
beyond the scope of this paper. In Fig. 5 we show
the effect on the time profile of 60Fe for our default model,
assuming that the amount of 60Fe released in the supernova explosions is
unchanged. Due to the longer decay timescale, the build-up of the
isotope is larger, and in the period after the main peak (5-15 Myr
after the star formation), the amount of 60Fe present in the
ISM is approximately twice as large as for the shorter 60Fe lifetime.
Note that the effect on the observed flux
is different. While there is more 60Fe present in the ISM, the
2 Myr. It is unclear if
a different lifetime would have any significant impact on the nucleosynthesis
of 60Fe, and a study of this is
beyond the scope of this paper. In Fig. 5 we show
the effect on the time profile of 60Fe for our default model,
assuming that the amount of 60Fe released in the supernova explosions is
unchanged. Due to the longer decay timescale, the build-up of the
isotope is larger, and in the period after the main peak (5-15 Myr
after the star formation), the amount of 60Fe present in the
ISM is approximately twice as large as for the shorter 60Fe lifetime.
Note that the effect on the observed flux
is different. While there is more 60Fe present in the ISM, the
![]() -ray emission per unit mass is decreased due to the longer
decay timescale. This is illustrated by the grey dashed line in
Fig. 5: the integrated amount of
-ray emission per unit mass is decreased due to the longer
decay timescale. This is illustrated by the grey dashed line in
Fig. 5: the integrated amount of ![]() -ray emission
is unchanged (since the amount of 60Fe released
from the stars is unchanged), but the distribution is slightly
shifted to later times. The only significant effect is the lower peak
at
-ray emission
is unchanged (since the amount of 60Fe released
from the stars is unchanged), but the distribution is slightly
shifted to later times. The only significant effect is the lower peak
at ![]() 5 Myr. It should be noted that in a constant star-formation
scenario (steady-state),
the measured ratio of 60Fe/26Al emission is
independent of the decay times of the two isotopes (although
the ratio of 60Fe/26Al does depend on the decay times).
5 Myr. It should be noted that in a constant star-formation
scenario (steady-state),
the measured ratio of 60Fe/26Al emission is
independent of the decay times of the two isotopes (although
the ratio of 60Fe/26Al does depend on the decay times).
![\begin{figure}
\par\resizebox{9cm}{!}{\includegraphics[angle=0]{12260f4.eps}}
\end{figure}](/articles/aa/full_html/2009/35/aa12260-09/img42.png) |
Figure 4: Time profiles of 60Fe/26Al emission ratio for a coeval population of stars. Legends same as Fig. 3. |
| Open with DEXTER | |
| |
Figure 5:
Time profiles of 60Fe for a coeval population of stars
for the two different decay timescales. The solid line is the same as
in Fig. 3, with an average lifetime of |
| Open with DEXTER | |
![\begin{figure}
\par\resizebox{9cm}{!}{\includegraphics[angle=0]{12260f6.eps}}
\end{figure}](/articles/aa/full_html/2009/35/aa12260-09/img44.png) |
Figure 6:
Time profiles of the wind ( top) and supernova power per star
from a coeval population of stars in the
|
| Open with DEXTER | |
3.3 Energy and mass
The energy and mass ejection rates are the most important parameters
for the evolution of the interstellar medium in the vicinity of young
stars. Winds and SN ejecta compress the surrounding medium,
creating wind-driven bubbles, supernova remnants, and even super-bubbles
in the case of multiplets of massive stars. These stellar systems dissociate
the surrounding molecular clouds and may induce star-formation within these.
In Fig. 6, the ``kinetic luminosities'' of the
winds and the supernova explosions are shown for the three sets of
stellar tracks. In the first 3-4 Myr, no
stars explode, and the kinetic luminosity originates exclusively from
stellar winds. The mechanicial power of these sustained winds is roughly
equal to the average power of punctuated supernova explosions, once these
set in. It is important to note that integrated over the first 10 Myr,
the total energy emitted in winds is actually larger than the energy
associated with the supernova explosions. This is important for shaping
the medium around a star-forming region. There are large differences
between the various stellar models. In particular it is worth noting
that while decreased mass-loss rates in rotating stellar models obviously
decrease the wind power, this is compensated for by their longer lifetimes.
Furthermore the longer stellar lifetimes lower the
supernova rate (except at late times ![]() 35 Myr, where the supernova
rate for non-rotating stars becomes zero, whereas the rotating stars still
explode until
35 Myr, where the supernova
rate for non-rotating stars becomes zero, whereas the rotating stars still
explode until ![]() 45 Myr), and therefore the early dominance of wind
energy is even stronger.
45 Myr), and therefore the early dominance of wind
energy is even stronger.
A comparison between the two wind prescriptions wind00 and wind08
shows significant differences. Wind velocities of different types
of massive stars still have very large uncertainties, and this translates
into large uncertainties in the implicated wind power.
As the most massive stars explode after ![]() 5 Myr, the
wind power decreases rapidly, thereafter the supernova rate decreases steadily
until stars with masses
5 Myr, the
wind power decreases rapidly, thereafter the supernova rate decreases steadily
until stars with masses ![]()
![]() explode, and
the energy deposition in the ISM becomes negligible.
explode, and
the energy deposition in the ISM becomes negligible.
In Fig. 7 the average total kinetic luminosity and
the mass ejection rate are compared through Monte Carlo simulations of a
small population of stars. For the Monte Carlo simulations the power
was averaged over 1 Myr, and still the variations are very large,
especially in the later stages, where only few supernovae are likely
to explode within a time interval. When studying small regions it
is important to note these statistical effects, especially for processes
with shorter timescales, where the variability of a local supernova rate
increases drastically. For example the 1![]() range of the
supernova rate around 10 Myr covers more than a factor of 100 when
averaged over a timescale of 0.1 Myr, similar to the replenishment timescale
of the X-ray emitting gas in the region of Orion studied by Güdel et al. (2008).
We note that the variation in the time integrated energy
(studied by Cerviño et al. 2001,2002), important for studying
the X-ray bubble expansion at larger scales, is smaller, since it
only depends on the number of supernova explosions and not on the specific
explosion times.
The mass ejection rate shown in the lower panel of Fig. 7
is more strongly dominated by the ejection through stellar winds,
and as this is a continuous process, the variations are relatively smaller.
range of the
supernova rate around 10 Myr covers more than a factor of 100 when
averaged over a timescale of 0.1 Myr, similar to the replenishment timescale
of the X-ray emitting gas in the region of Orion studied by Güdel et al. (2008).
We note that the variation in the time integrated energy
(studied by Cerviño et al. 2001,2002), important for studying
the X-ray bubble expansion at larger scales, is smaller, since it
only depends on the number of supernova explosions and not on the specific
explosion times.
The mass ejection rate shown in the lower panel of Fig. 7
is more strongly dominated by the ejection through stellar winds,
and as this is a continuous process, the variations are relatively smaller.
![\begin{figure}
\par\resizebox{9cm}{!}{\includegraphics[angle=0]{12260f7.eps}}
\end{figure}](/articles/aa/full_html/2009/35/aa12260-09/img47.png) |
Figure 7:
Time profiles energy ( top) and mass ( bottom) ejection rates, with
1 |
| Open with DEXTER | |
3.4 UV radiation
The bulk of the ionizing flux is provided by hot stars that disappear after only a few Myr. This is clearly seen in Fig. 8, where the time profile of the ionizing flux is shown. The flux is high and roughly constant during the first 2 Myr, after which it declines. After less than 10 Myr it has declined by a factor of more than 100, and the rate of decline steepens further. There are still large uncertainties in the modelling of non-LTE expanding atmospheres. Comparing the results with a now superseded set of stellar atmospheres shows only minor differences, but the comparison with the non-rotating L&C stellar models shows dramatic differences. So while the correct atmosphere modelling is important for the study of single stars and for understanding the UV spectrum, the stellar evolution modelling is much more important for the understanding of the interactions between groups of massive stars and their surroundings. It is important to note that for small stellar associations, the statistical deviations from the mean are very large (see e.g. Fig. 4 in Cerviño et al. 2000b, for the deviation for associations of different masses).
![\begin{figure}
\par\resizebox{9cm}{!}{\includegraphics[angle=0]{12260f8.eps}}
\end{figure}](/articles/aa/full_html/2009/35/aa12260-09/img48.png) |
Figure 8:
Time profiles of the ionizing flux per star,
with 1 |
| Open with DEXTER | |
3.5 Statistical properties of the stellar populations
Above we described the average outputs of the 26Al, 60Fe, energy,
mass and UV radiation from young stellar populations, together with examples
of their variability, based on Monte Carlo simulations. For a better understanding
of the statistical properties of the stellar distributions, we also made
use of the statistical methods of Cerviño & Luridiana (2006). At a given time, these
methods allow the analytical approximation of the probability distribution
of a quantity. We calculate the raw moments of the distribution
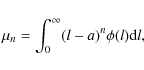 |
(1) |
where n is the integer order of the moment, l is the physical quantity for which we investigate the distribution, and
 |
(2) |
From these we find the skewness
 |
(3) |
and the kurtosis
 |
(4) |
of the distribution. For an ensemble of N stars, the distribution expressed in normal form (i.e., transformed to a distribution with zero mean and unit variance) has a skewness
For very small populations the discrepancy between the Edgeworth approximation and the real distribution becomes large. Cerviño & Luridiana (2006) therefore derived analytical estimates of the necessary population size to allow the use of their approximation, and also when it is possible to use a Gaussian approximation. In Fig. 9 an example of the probability distribution for 26Al is shown, and the Edgeworth approximation is compared to Monte Carlo simulations. It can be seen that while for very low numbers of stars, the distribution can only be investigated using Monte Carlo simulations, whereas for intermediate cases Edgeworth's approximation is useful. Figure 10 shows the skewness and the kurtosis of the distribution. In Fig. 11 the minimum number of stars needed for an adequate approximation (within 10%) in the
![\begin{figure}
\par\resizebox{9cm}{!}{\includegraphics[angle=0]{12260f9.eps}}
\end{figure}](/articles/aa/full_html/2009/35/aa12260-09/img62.png) |
Figure 9:
The statistical distribution of 26Al in the interstellar
medium around a cluster of 10, 50 and 200 massive stars ( |
| Open with DEXTER | |
Appling these concepts to our study, the large values in ![]() and
and
![]() at young ages (before the onset of the SN phase in
26Al production) shows the large impact of particular high
massive stars in the the integrated production of 26Al. It
implies that, for low mass clusters, the current 26Al produced by
an individual cluster is strongly dependent on the most massive star
the cluster has formed, so (provided the cluster age is known
from an independent method)
it would be possible to estimate the value of this most
massive star. Of course, since we are only able to obtain statistical
inferences in the low cluster mass regime, we need to take into
account the maximum possible
at young ages (before the onset of the SN phase in
26Al production) shows the large impact of particular high
massive stars in the the integrated production of 26Al. It
implies that, for low mass clusters, the current 26Al produced by
an individual cluster is strongly dependent on the most massive star
the cluster has formed, so (provided the cluster age is known
from an independent method)
it would be possible to estimate the value of this most
massive star. Of course, since we are only able to obtain statistical
inferences in the low cluster mass regime, we need to take into
account the maximum possible
![]() value, which naturally
include the case where such more massive stars are not present in the
cluster due to the particular realization of the IMF performed by
Nature in a given cluster. These effects are clearly visible even for
cluster with 10 massive stars in the top pannel of Fig. 9. In the pure SN
dominated phase (ages larger than 20 Myr),
value, which naturally
include the case where such more massive stars are not present in the
cluster due to the particular realization of the IMF performed by
Nature in a given cluster. These effects are clearly visible even for
cluster with 10 massive stars in the top pannel of Fig. 9. In the pure SN
dominated phase (ages larger than 20 Myr), ![]() and
and ![]() are almost constant, without significant structure and are both slowly
increasing with age (cf. Fig. 11). A simple consequence
of the slow decay of the SN rate at these ages is, (a) an
increase of sampling effects due to the declining number of possible
SNe within a given time window; and (b) a decrease in the sensitivity to
which star has exploded as a SN in the 26Al ejection, as there is not
much variation in the 26Al ejection from SNe at these late times.
The intermediate age
range between 7 an 20 Myr shows how the stars that explode in this age
range have different amounts of 26Al ejections.
are almost constant, without significant structure and are both slowly
increasing with age (cf. Fig. 11). A simple consequence
of the slow decay of the SN rate at these ages is, (a) an
increase of sampling effects due to the declining number of possible
SNe within a given time window; and (b) a decrease in the sensitivity to
which star has exploded as a SN in the 26Al ejection, as there is not
much variation in the 26Al ejection from SNe at these late times.
The intermediate age
range between 7 an 20 Myr shows how the stars that explode in this age
range have different amounts of 26Al ejections.
![\begin{figure}
\par\resizebox{9cm}{!}{\includegraphics[angle=0]{12260f10.eps}}
\end{figure}](/articles/aa/full_html/2009/35/aa12260-09/img64.png) |
Figure 10:
The skewness, |
| Open with DEXTER | |
![\begin{figure}
\par\resizebox{9cm}{!}{\includegraphics[angle=0]{12260f11.eps}}
\end{figure}](/articles/aa/full_html/2009/35/aa12260-09/img65.png) |
Figure 11:
Lower limits on the number of stars in the
|
| Open with DEXTER | |
Finally, in Fig. 12
the Pearson correlation coefficient between the ![]() -ray emission from nucleosynthesis products and the hydrogen
ionizing radiation is shown. The use of these correlation
coefficients allows us to establish the probability of obtaining
the value of one of the observables, given that the value of the other
observable is known. A correlation coefficient equal to zero implies
that the two associated quantities do not contain information about
each other. There is no strong correlation between the
-ray emission from nucleosynthesis products and the hydrogen
ionizing radiation is shown. The use of these correlation
coefficients allows us to establish the probability of obtaining
the value of one of the observables, given that the value of the other
observable is known. A correlation coefficient equal to zero implies
that the two associated quantities do not contain information about
each other. There is no strong correlation between the ![]() -rays from
60Fe and UV radiation, and therefore the overall UV
radiation does not know anything about the 60Fe production. The
strong correlation between the 26Al
-rays from
60Fe and UV radiation, and therefore the overall UV
radiation does not know anything about the 60Fe production. The
strong correlation between the 26Al ![]() -ray emission
(from the 26Al ejected in the stellar winds) and the UV radiation
at young ages refects that both components are produced by related
sources: note that there is a time delay between the UV and the
26Al emission, so the sources that produce both quantities are
not the same. The 26Al-UV correlation decreases with time,
since the stars that produce the UV emission are unrelated to the stars
that explode as SN and produce most of the 26Al at ages later
than 6 Myr. Finally, the
-ray emission
(from the 26Al ejected in the stellar winds) and the UV radiation
at young ages refects that both components are produced by related
sources: note that there is a time delay between the UV and the
26Al emission, so the sources that produce both quantities are
not the same. The 26Al-UV correlation decreases with time,
since the stars that produce the UV emission are unrelated to the stars
that explode as SN and produce most of the 26Al at ages later
than 6 Myr. Finally, the ![]() -rays from 60Fe and 26Al
are highly correlated but the correlation does not reach a value of
1, reflecting the fact that the overall production comes from
similar, but not the same, stellar sub-populations.
-rays from 60Fe and 26Al
are highly correlated but the correlation does not reach a value of
1, reflecting the fact that the overall production comes from
similar, but not the same, stellar sub-populations.
4 Discussion
![\begin{figure}
\par\resizebox{9cm}{!}{\includegraphics[angle=0]{12260f12.eps}}
\end{figure}](/articles/aa/full_html/2009/35/aa12260-09/img66.png) |
Figure 12:
The Pearson correlation coefficient between the 26Al and
60Fe |
| Open with DEXTER | |
The outflow (energy and matter) from young stars into the ISM determines the interplay between star formation and galaxy evolution. Our population synthesis code predicts important stellar outputs necessary to study these processes in more detail. The emission of radioactive isotopes is important for such studies, as they are a unique way of tracing the output from the massive stars directly, globally (Milky Way wide) as well as the spatial distribution of the ejecta around young stellar clusters. Many aspects of stellar evolution of massive stars are quite uncertain, and often the effects of these on the properties of a stellar cluster are not directly apparent. Population synthesis studies allow to test the impact of changes in specific ingredients and processes of stellar evolution models.
![\begin{figure}
\par\resizebox{9cm}{!}{\includegraphics[angle=0]{12260f13.eps}}
\end{figure}](/articles/aa/full_html/2009/35/aa12260-09/img67.png) |
Figure 13: The time profiles of the kinetic power, 26Al, 60Fe and UV, with the contributions from 4 mass ranges. The solid lines are for the full range of masses (same as the solid lines in Figs. 3 and 7. |
| Open with DEXTER | |
Our study of the ejection of the radioactive elements 26Al and 60Fe shows
considerable theoretical uncertainties on the ejection rates and time
profiles. Especially the
amount of 60Fe ejected from the most massive stars is sensitive to
the structure of the stars in the final evolutionary stages. The emission of 26Al
varies by less than a factor ![]() 2, and the ratio of these two elements is therefore
an important diagnostic for the late stages of stellar evolution of very massive stars.
An important ingredient is mass loss from the massive stars. Despite recently improved
understanding of this process, the rate of mass loss is still subject of debate,
with proposed downward changes of up to an order of magnitude. One effect of lower
mass loss rates is an increase of the stellar core sizes at late burning stages. The 60Fe production is correspondingly enhanced, and the wind ejection of
26Al is decreased. For non-rotating stellar models, with the currently preferred
mass-loss rates (Limongi & Chieffi 2006) the Galactic 60Fe/26Al ratio
is overpredicted with respect to measurements (Wang et al. 2007), leading Limongi & Chieffi (2006) to
suggest changes in the IMF or a relatively low upper integration limit. For lower mass-loss
rates this problem would be enhanced and this is a
strong argument against very low mass-loss rates for non-rotating stellar tracks
(although it is important to note that the uncertainties in the nucleosynthesis of
60Fe
and 26Al are too large for the argument to be definitive at this time). Stellar
rotation can strongly enhance the mass lost from stars, mainly from increasing the duration
of the WR-phases. However, rotation also tends to increase the size of the stellar core, and
without calculations of the later evolutionary stages of such stars, it is difficult to predict
the explosively ejected nucleosynthetic yields. The observed average Galactic 60Fe/26Al
ratio provides interesting constraints on the models, but observations of specific regions are
also important, as the time profile and the statistical variability can improve our
understanding of massive star evolution considerably. While the study of the ratio
in individual star-forming regions will not be possible for many years, it is expected
that it will at least be possible to divide the Milky Way into a few sections for this purpose
at the end of the INTEGRAL mission. The main problem is the detection limit of the
60Fe
2, and the ratio of these two elements is therefore
an important diagnostic for the late stages of stellar evolution of very massive stars.
An important ingredient is mass loss from the massive stars. Despite recently improved
understanding of this process, the rate of mass loss is still subject of debate,
with proposed downward changes of up to an order of magnitude. One effect of lower
mass loss rates is an increase of the stellar core sizes at late burning stages. The 60Fe production is correspondingly enhanced, and the wind ejection of
26Al is decreased. For non-rotating stellar models, with the currently preferred
mass-loss rates (Limongi & Chieffi 2006) the Galactic 60Fe/26Al ratio
is overpredicted with respect to measurements (Wang et al. 2007), leading Limongi & Chieffi (2006) to
suggest changes in the IMF or a relatively low upper integration limit. For lower mass-loss
rates this problem would be enhanced and this is a
strong argument against very low mass-loss rates for non-rotating stellar tracks
(although it is important to note that the uncertainties in the nucleosynthesis of
60Fe
and 26Al are too large for the argument to be definitive at this time). Stellar
rotation can strongly enhance the mass lost from stars, mainly from increasing the duration
of the WR-phases. However, rotation also tends to increase the size of the stellar core, and
without calculations of the later evolutionary stages of such stars, it is difficult to predict
the explosively ejected nucleosynthetic yields. The observed average Galactic 60Fe/26Al
ratio provides interesting constraints on the models, but observations of specific regions are
also important, as the time profile and the statistical variability can improve our
understanding of massive star evolution considerably. While the study of the ratio
in individual star-forming regions will not be possible for many years, it is expected
that it will at least be possible to divide the Milky Way into a few sections for this purpose
at the end of the INTEGRAL mission. The main problem is the detection limit of the
60Fe ![]() -rays. On the other hand, the prospects for studying the time profile
of 26Al are good, and in subsequent papers we will apply our population synthesis tool
to the Galactic 26Al distribution, and to individual
star forming regions, such as Orion. Figure 13 shows that
at different intervals, the output of energy and matter from the stars is
dominated by different ranges of initial stellar masses. Therefore the
analysis of different regions with non-steady star formation can be
used to explore the physics of stars in quite narrow mass ranges.
-rays. On the other hand, the prospects for studying the time profile
of 26Al are good, and in subsequent papers we will apply our population synthesis tool
to the Galactic 26Al distribution, and to individual
star forming regions, such as Orion. Figure 13 shows that
at different intervals, the output of energy and matter from the stars is
dominated by different ranges of initial stellar masses. Therefore the
analysis of different regions with non-steady star formation can be
used to explore the physics of stars in quite narrow mass ranges.
26Al and 60Fe, together with many additional isotopes, are
emitted into the ISM with very high velocities. These ejecta will move away from
the star clusters, which has been observed in the Orion region where
a part of the 26Al signal is off-set from the star clusters, and coincides
with the Eridanus bubble formed by the outflowing hot gas (Diehl 2002).
The spread of 26Al can therefore trace the mixing of young stellar ejecta
into the ISM, a process that is relatively poorly understood but important
for proper modelling of the evolution of galaxies. Our code predicts the mass, energy
and ionizing radiation output of the stellar clusters, which are the most important
parameters for the interaction with the ISM. Our results show that
stellar winds are important for the turbulent state of the ISM. In the first
![]() 6 Myr the power from the winds clearly dominates, being as strong as the subsequent power
injected by supernovae, even if the total energy of the supernova explosions is higher
than the total wind energy, as they explode over a much longer timescale. For the
winds the most massive stars are very important, even if there are relatively few
of them, as they lose most of their mass through winds with very high velocities in
the WR-phases. Estimating the wind power from a typical O-type star and
multiplying by the number of stars in a cluster will underestimate
the wind power by more than an order of magnitude. When comparing the
mechanically derived power from different stellar models, we find that,
while the mass-loss rates are smaller by a factor
6 Myr the power from the winds clearly dominates, being as strong as the subsequent power
injected by supernovae, even if the total energy of the supernova explosions is higher
than the total wind energy, as they explode over a much longer timescale. For the
winds the most massive stars are very important, even if there are relatively few
of them, as they lose most of their mass through winds with very high velocities in
the WR-phases. Estimating the wind power from a typical O-type star and
multiplying by the number of stars in a cluster will underestimate
the wind power by more than an order of magnitude. When comparing the
mechanically derived power from different stellar models, we find that,
while the mass-loss rates are smaller by a factor
![]() 2-3 in the geneva05 models compared to the geneva97 models, the
wind power is actually more dominates with the geneva05 models. On the other hand,
for the LC06 models that also have the lower mass-loss rates, the role
of the winds is somewhat diminished. The reason for the enhanced wind importance when using
the rotating geneva05 models is caused by several factors, the most important
ones being the greatly increased time spent in WR-phases where the mass-loss rate and wind
velocity is very high, and the longer stellar lifetimes causing a decrease in the supernova
rate. We note that in all models the wind power is more important than commonly recognized
(e.g. in the study of supernova driven bubbles).
This means that for stellar clusters, the supernova shells expand into a pre-existing
cavity, rather than in a dense star-forming ISM. For example Cho & Kang (2008) find that
the volume of a supernova bubble is
2-3 in the geneva05 models compared to the geneva97 models, the
wind power is actually more dominates with the geneva05 models. On the other hand,
for the LC06 models that also have the lower mass-loss rates, the role
of the winds is somewhat diminished. The reason for the enhanced wind importance when using
the rotating geneva05 models is caused by several factors, the most important
ones being the greatly increased time spent in WR-phases where the mass-loss rate and wind
velocity is very high, and the longer stellar lifetimes causing a decrease in the supernova
rate. We note that in all models the wind power is more important than commonly recognized
(e.g. in the study of supernova driven bubbles).
This means that for stellar clusters, the supernova shells expand into a pre-existing
cavity, rather than in a dense star-forming ISM. For example Cho & Kang (2008) find that
the volume of a supernova bubble is ![]() 2-3 times larger and also hotter when
the winds are taken into account, even though the wind power assumed in their study
is very low compared to our estimates.
The flow of wind and supernova ejecta inside cavities can be very complex (MacLow et al. 2005),
and the propagation is likely dominated by turbulent diffusion from magnetic field
irregularities caused by the stellar winds and supernovae (Balsara & Kim 2005; Parizot 2004).
Part of the gas will be thermalized near the stellar association due to wind-wind
collisions or by a termination shock against the turbulent medium inside the cavity,
and this can be observed as a hot X-ray emitting plasma (Townsley et al. 2003; Güdel et al. 2008).
However the majority of the mass will expand into the low density cavity.
The effective propagation velocity is very uncertain, and is expected to be in the range
100-1000 km s-1 (for example Balsara et al. 2008, finds velocities of
2-3 times larger and also hotter when
the winds are taken into account, even though the wind power assumed in their study
is very low compared to our estimates.
The flow of wind and supernova ejecta inside cavities can be very complex (MacLow et al. 2005),
and the propagation is likely dominated by turbulent diffusion from magnetic field
irregularities caused by the stellar winds and supernovae (Balsara & Kim 2005; Parizot 2004).
Part of the gas will be thermalized near the stellar association due to wind-wind
collisions or by a termination shock against the turbulent medium inside the cavity,
and this can be observed as a hot X-ray emitting plasma (Townsley et al. 2003; Güdel et al. 2008).
However the majority of the mass will expand into the low density cavity.
The effective propagation velocity is very uncertain, and is expected to be in the range
100-1000 km s-1 (for example Balsara et al. 2008, finds velocities of ![]() 200 km s-1). 26Al and 60Fe can be important for measuring this
velocity, as their lifetimes are similar to the time it takes for the ejecta to
cross a cavity blown by a young stellar cluster. If the velocity is high, these
elements will quickly reach the wall of the cavity, and the brightness distribution will
be given by the geometry of the walls. For slower propagation the fresh ejecta will
be distributed inside the cavity, and the measured line widths will reflect the
turbulence inside the cavity directly.
200 km s-1). 26Al and 60Fe can be important for measuring this
velocity, as their lifetimes are similar to the time it takes for the ejecta to
cross a cavity blown by a young stellar cluster. If the velocity is high, these
elements will quickly reach the wall of the cavity, and the brightness distribution will
be given by the geometry of the walls. For slower propagation the fresh ejecta will
be distributed inside the cavity, and the measured line widths will reflect the
turbulence inside the cavity directly.
5 Conclusions
We have developed a populations synthesis code for the study of Galactic OB associations.
The main aim of this work is the prediction of the output of energy, gas, 26Al,
60Fe and ionizing photons of a population of massive stars. We describe
the dependence on the input physics, especially rotating stellar models
(Palacios et al. 2005; Meynet & Maeder 2005).
We show that energy and matter output depend
on the choice of stellar evolutionary and supernova models,
whereas other parameters, such as the
speeds of the winds and the stellar atmospheres only play secondary roles.
This is a problem for the correct modelling of star-forming regions, and
also means that
comparison with observations (for example the ![]() -ray emission from
radioactive isotopes) can potentially
yield important constraints for stellar and supernova models.
Also the statistical variations for small numbers of stars in individual
regions are addressed, which is important when interpreting
observations of nearby, small star-forming regions.
-ray emission from
radioactive isotopes) can potentially
yield important constraints for stellar and supernova models.
Also the statistical variations for small numbers of stars in individual
regions are addressed, which is important when interpreting
observations of nearby, small star-forming regions.
Our study shows that the ejected 26Al and wind power from a population of massive stars is strongly enhanced by the effects of stellar rotation. Despite the recent downward revision of the mass-loss rates from massive stars by a factor of 2-3, the amount of 26Al and the importance of the wind power is actually increased by including stellar rotation.
Acknowledgements
This research was supported by the DFG cluster of excellence ``Origin and Structure of the Universe'' (http://www.universe-cluster.de). M.C. is supported by the Spanish PNAyA project through FEDER funding of project AYA207-64712.
References
- Balsara, D. S., & Kim, J. 2005, ApJ, 634, 390 [NASA ADS] [CrossRef]
- Balsara, D. S., Bendinelli, A. J., Tilley, D. A., Massari, A. R., & Howk, J. C. 2008, MNRAS, 386, 642 [NASA ADS] [CrossRef] (In the text)
- Barlow, M. J., Smith, L. J., & Willis, A. J. 1981, MNRAS, 196, 101 [NASA ADS]
- Blinnikov, S., & Moessner, R. 1998, A&AS, 130, 193 [NASA ADS] [CrossRef] [EDP Sciences]
- Brown, A. G. A., de Geus, E. J., & de Zeeuw, P. T. 1994, A&A, 289, 101 [NASA ADS] (In the text)
- Bruzual, A. G. 1983, ApJ, 273, 105 [NASA ADS] [CrossRef]
- Bruzual, G., & Charlot, S. 2003, MNRAS, 344, 1000 [NASA ADS] [CrossRef] (In the text)
- Castor, J. I., Abbott, D. C., & Klein, R. I. 1975, 195, 157
- Cerviño, M., & Luridiana, V. 2006, A&A, 451, 475 [NASA ADS] [CrossRef] [EDP Sciences] (In the text)
- Cerviño, M., Knödlseder, J., Schaerer, D., von Ballmoos, P., & Meynet, G. 2000a, A&A, 363, 970 [NASA ADS] (In the text)
- Cerviño, M., Luridiana, V., & Castander, F. J. 2000b, A&A, 360, 5 [NASA ADS] (In the text)
- Cerviño, M., Gómez-Flechoso, M. A., Castander, F. J., et al. 2001, A&A, 376, 422 [NASA ADS] [CrossRef] [EDP Sciences] (In the text)
- Cerviño, M., Mas-Hesse, J. M., & Kunth, D. 2002, A&A, 392, 19 [NASA ADS] [CrossRef] [EDP Sciences]
- Cho, H., & Kang, H. 2008, New Astron., 13, 163 [NASA ADS] [CrossRef] (In the text)
- Diehl, R. 2002, New Astron. Rev., 46, 547 [NASA ADS] [CrossRef] (In the text)
- Diehl, R., Dupraz, C., Bennet, K., et al. 1995, A&A, 298, 445 [NASA ADS]
- Diehl, R., Halloin, H., Kretschmer, K., et al. 2006, Nature, 439, 45 [NASA ADS] [CrossRef]
- Eldridge, J. J., & Vink, J. S. 2006, A&A, 452, 295 [NASA ADS] [CrossRef] [EDP Sciences]
- Eldridge, J. J., Izzard, R. G., & Tout, C. A. 2008, MNRAS, 384
- Güdel, M., Briggs, K. R., Montmerle, T., et al. 2008, Science, 319, 309 [NASA ADS] [CrossRef] (In the text)
- Hamann, W.-R., Gräfener, G., & Liermann, A. 2006, A&A, 457, 1015 [NASA ADS] [CrossRef] [EDP Sciences]
- Harris, M. J., Knödlseder, J., Jean, P., et al. 2005, A&A, 433, 49 [NASA ADS] [CrossRef]
- Howarth, I. D., & Prinja, R. K. 1989, ApJS, 69, 527 [NASA ADS] [CrossRef]
- van der Hucht, K. A., Williams, P. M., & The, P. S. 1987, QJRAS, 28, 254 [NASA ADS]
- Hunter, I., Dufton, P. L., Smartt, S. J., et al. 2007, A&A, 466, 277 [NASA ADS] [CrossRef] [EDP Sciences]
- de Jager, C., Nieuwenhuijzen, H., & van der Hucht, K. A. 1988, A&AS, 72, 259 [NASA ADS] (In the text)
- Jones, T. W., Rudnick, L., Jun, B.-I., et al. 1998, PASP, 110, 125 [NASA ADS] [CrossRef] (In the text)
- Knödlseder, J., Bennet, K., Bloemen, H., et al. 1999, A&A, 344, 68 [NASA ADS]
- Kroupa, P. 2001, MNRAS, 322, 231 [NASA ADS] [CrossRef]
- Kurucz, R. L. 1992, in The Stellar Populations of Galaxies, IAU Symp., 149, 225 (In the text)
- Lamers, H. J. G. L. M., & Morton, D. C. 1976, ApJS, 32, 715 [NASA ADS] [CrossRef]
- Lamers, H. J. G. L. M., Snow, T. P., & Lindholm, D. M. 1995, ApJ, 455, 269 [NASA ADS] [CrossRef]
- Langer, N., Braun, H., & Wellenstein, S. 1998, in Proceedings of the 9th Workshop on Nuclear Astrophysics, ed. W. Hillebrandt, & E. Müller, 18 (In the text)
- Leitherer, C., Robert, C., & Drissen, L. 1992, ApJ, 401, 596 [NASA ADS] [CrossRef]
- Leitherer, C., Schaerer, D., Goldader, J. D., et al. 1999, ApJS, 123, 3 [NASA ADS] [CrossRef]
- Limongi, M., & Chieffi, A. 2006, ApJ, 647, 483 [NASA ADS] [CrossRef] (In the text)
- Lozinskaya, T. A. 1992, Supernovae and stellar wind in the interstellar medium (New York, USA: AIP) (In the text)
- MacLow, M., Balsara, K., Kim, J., & de Avillez, M. A. 2005, ApJ, 626, 864 [NASA ADS] [CrossRef] (In the text)
- Maeder, A. 1990, A&AS, 84, 139 [NASA ADS] (In the text)
- Maeder, A., & Conti, P. S. 1994, ARA&A, 32, 227 [NASA ADS] [CrossRef]
- Maeder, A., & Meynet, G. 1994, A&A, 287, 803 [NASA ADS] (In the text)
- Maeder, A., Georgy, C., & Meynet, G. 2008, A&A, 479, L37 [NASA ADS] [CrossRef] [EDP Sciences]
- Martins, F., Schaerer, D., & Hillier, D. J. 2005, A&A, 436, 1049 [NASA ADS] [CrossRef] [EDP Sciences] (In the text)
- Meynet, G., & Maeder, A. 2005, A&A, 429, 581 [NASA ADS] [CrossRef] [EDP Sciences]
- Meynet, G., Gould, M., Prantzos, N., et al. 1997, A&A, 320, 460 [NASA ADS] (In the text)
- Niedzielski, A., Skorzynski, W. 2002, Acta Astron., 52, 81 [NASA ADS] (In the text)
- Nugis, T., & Lamers, H. J. G. L. M. 2000, A&A, 360, 227 [NASA ADS] (In the text)
- Palacios, A., Meynet, G., Vuissoz, C., et al. 2005, A&A, 429, 613 [NASA ADS] [CrossRef] [EDP Sciences] (In the text)
- Panagia, N. 1973, AJ, 78, 929 [NASA ADS] [CrossRef]
- Parizot, E., Marcowith, A., van der Swaluw, E., Bykov, A. M., & Tatischeff, V. 2004, A&A, 424, 747 [NASA ADS] [CrossRef] [EDP Sciences]
- Plüschke, S. 2001, 26Al Ursprung und OB Associationen, Ph.D. Thesis, Technische Universität München, Germany
- Prantzos, N., & Diehl, R. 1996, Phys. Rep., 267, 1 [NASA ADS] [CrossRef] (In the text)
- Prinja, R. K., Barlow, M. J., & Howarth, I. D. 1990, ApJ, 361, 607 [NASA ADS] [CrossRef] (In the text)
- Puls, J., Vink, J. S., & Najarro, F. 2008, A&A Rev., 16, 209 [NASA ADS] (In the text)
- Salpeter, E. E. 1955, ApJ, 121, 161 [NASA ADS] [CrossRef] (In the text)
- Scalo, J. 1986, in Luminous stars and associations in galaxies, Proc. Symp., Porto-Kheli, Greece, May 26-31, 1985 (Dordrecht: D. Reidel Publishing Co.), 451
- Schaerer, D., & de Koter, A. 1997, A&A, 322, 598 [NASA ADS] (In the text)
- Schmutz, W., Leitherer, C., & Gruenwald, R. 1992, PASP, 104, 1164 [NASA ADS] [CrossRef] (In the text)
- Smith, D. M. 2004, in The INTEGRAL Universe (ESA Special Publication 552), ed. V. Schönfelder, G. G. Lichti, & C. Winkler (Noordwijk: ESA), 45
- Smith, L. F., & Maeder, A. 1991, A&A, 241, 77 [NASA ADS]
- Smith, L., Norris, R. P. F., & Crowther, P. A. 2005, MNRAS, 337, 1309 [NASA ADS] [CrossRef] (In the text)
- Tinsley, B. M. 1978, ApJ, 222, 14 [NASA ADS] [CrossRef]
- Townsley, L. K., Feigelson, E. D., Montmerle, T., et al. 2003, ApJ, 593, 874 [NASA ADS] [CrossRef]
- Vacca, W. D., Garmany, C. D., & Shull, J. M. 1996, ApJ, 460, 914 [NASA ADS] [CrossRef]
- Vanbeveren, D., Van Bever, J., & Belkus, H., ApJ, 662, 107
- Vazquez, G. A., & Leitherer, C. 2005, ApJ, 621, 695 [NASA ADS] [CrossRef]
- Vazquez, G. A., Leitherer, C., Schaerer, D., & Maeder, A. 2007, ApJ, 663, 995 [NASA ADS] [CrossRef]
- Vink, J. S., de Koter, A., & Lamers, H. J. G. L. M. 2000, A&A, 362, 295 [NASA ADS]
- Vink, J. S., de Koter, A., & Lamers, H. J. G. L. M. 2001, A&A, 369, 574 [NASA ADS] [CrossRef] [EDP Sciences]
- Wang, W., Harris, M. J., Diehl, R., et al. 2007, A&A, 469, 1005 [NASA ADS] [CrossRef] [EDP Sciences] (In the text)
- Woosley, S. E., & Weaver, T. A. 1995, ApJS, 101, 181 [NASA ADS] [CrossRef] (In the text)
- Woosley, S. E., Langer, N., & Weaver, T. A. 1995, ApJ, 448, 315 [NASA ADS] [CrossRef] (In the text)
Footnotes
- ... geneva97
![[*]](/icons/foot_motif.png)
- While the geneva05alt stellar models are included in Starburst99 (Vazquez & Leitherer 2007), this part of the code is not publicly available yet.
- ... range
- 1 star in this range corresponds
to 381, 140 and 188 stars in the
 range for the
Salpeter (Salpeter 1955), Kroupa (Kroupa 2001) and the
Scalo (Scalo 1986) mass functions, respectively, and to 13%, 18%
and 5% of the stellar mass.
range for the
Salpeter (Salpeter 1955), Kroupa (Kroupa 2001) and the
Scalo (Scalo 1986) mass functions, respectively, and to 13%, 18%
and 5% of the stellar mass.
All Tables
Table 1: Parameter names used throughout the paper.
Table 2: Classification criteria for WR stars, and their wind velocities.
All Figures
| |
Figure 1: Comparison between Starburst99 (thin black lines) and our results (thick grey lines) for a co-eval population. top: time profiles of the kinetic power emitted through the stellar winds (solid) and supernova explosions (dotted). Bottom: the ionizing flux. |
| Open with DEXTER | |
| In the text | |
| |
Figure 2:
Average time profiles of 26Al and 60Fe for a coeval
population of stars, for the three different sets of stellar models
available. The lines show the amount of the elements present in the
ISM per star in the
|
| Open with DEXTER | |
| In the text | |
| |
Figure 3:
Time profiles of 26Al ( top) and 60Fe ( bottom) for a
coeval population of stars. The solid
lines indicate the average profiles for the geneva05 stellar
models with the yieldsLC2006 supernova yields. The
the dark and light grey regions show the 1 |
| Open with DEXTER | |
| In the text | |
| |
Figure 4: Time profiles of 60Fe/26Al emission ratio for a coeval population of stars. Legends same as Fig. 3. |
| Open with DEXTER | |
| In the text | |
| |
Figure 5:
Time profiles of 60Fe for a coeval population of stars
for the two different decay timescales. The solid line is the same as
in Fig. 3, with an average lifetime of |
| Open with DEXTER | |
| In the text | |
| |
Figure 6:
Time profiles of the wind ( top) and supernova power per star
from a coeval population of stars in the
|
| Open with DEXTER | |
| In the text | |
| |
Figure 7:
Time profiles energy ( top) and mass ( bottom) ejection rates, with
1 |
| Open with DEXTER | |
| In the text | |
| |
Figure 8:
Time profiles of the ionizing flux per star,
with 1 |
| Open with DEXTER | |
| In the text | |
| |
Figure 9:
The statistical distribution of 26Al in the interstellar
medium around a cluster of 10, 50 and 200 massive stars ( |
| Open with DEXTER | |
| In the text | |
| |
Figure 10:
The skewness, |
| Open with DEXTER | |
| In the text | |
| |
Figure 11:
Lower limits on the number of stars in the
|
| Open with DEXTER | |
| In the text | |
| |
Figure 12:
The Pearson correlation coefficient between the 26Al and
60Fe |
| Open with DEXTER | |
| In the text | |
| |
Figure 13: The time profiles of the kinetic power, 26Al, 60Fe and UV, with the contributions from 4 mass ranges. The solid lines are for the full range of masses (same as the solid lines in Figs. 3 and 7. |
| Open with DEXTER | |
| In the text | |
Copyright ESO 2009
Current usage metrics show cumulative count of Article Views (full-text article views including HTML views, PDF and ePub downloads, according to the available data) and Abstracts Views on Vision4Press platform.
Data correspond to usage on the plateform after 2015. The current usage metrics is available 48-96 hours after online publication and is updated daily on week days.
Initial download of the metrics may take a while.