| Issue |
A&A
Volume 503, Number 3, September I 2009
|
|
|---|---|---|
| Page(s) | 899 - 907 | |
| Section | Stellar structure and evolution | |
| DOI | https://doi.org/10.1051/0004-6361/200912312 | |
| Published online | 09 July 2009 | |
An analysis of a spectrum of V838 Monocerotis in October 2005
R. Tylenda - T. Kaminski - M. Schmidt
Department for Astrophysics, N. Copernicus Astronomical Center, Rabianska 8, 87-100 Torun, Poland
Received 9 April 2009 / Accepted 30 May 2009
Abstract
Context. V838 Mon erupted at the beginning of 2002 becoming an extremely luminous star with
![]() .
Among various scenarios proposed to explain the nature of the outburst, the most promising is a stellar merger event.
.
Among various scenarios proposed to explain the nature of the outburst, the most promising is a stellar merger event.
Aims. We attempt to obtain information about the structure and evolution of the object in the decline from the 2002 eruption.
Methods. The results of spectroscopic observations of the object obtained in October 2005 with the Keck/HIRES instrument, presented in detail in Paper I, are analysed and discussed. Modelling of the observed line profiles has been used to constrain the physical parameters of the system.
Results. The kinematics of the atmosphere of V838 Mon is very complex. Our analysis of the molecular bands and the P-Cyg profiles of atomic lines shows that the object loses matter with a velocity of up to 215 km s-1 and a rate of
10-6,-10-5
![]() yr-1. In the profiles of some atomic lines, we have, however, found evidence of matter infall. Moreover, a narrow absorption component, which is particularly strong in some P-Cyg profiles, may indicate that a jet-like outflow has also been formed.
yr-1. In the profiles of some atomic lines, we have, however, found evidence of matter infall. Moreover, a narrow absorption component, which is particularly strong in some P-Cyg profiles, may indicate that a jet-like outflow has also been formed.
We show that the observed emission in the [Fe II] lines and an eclipse-like event observed in November/December 2006 was probably caused by interactions of the expanding matter, ejected by V838 Mon in 2002, with radiation from the B3V companion. In particular, the observed profiles of the [Fe II] lines can be easily modelled in this scenario and allow us to estimate parameters of the system, such as the position of the B3V companion relative to V838 Mon and the line of sight, density in the outflowing matter, and mass lost in the 2002 eruption. The observed appearance of strong H![]() emission, just before and during the eclipse-like event, can be interpreted as a result of the accretion of the outflowing matter onto the B3V companion: the accreted matter, shocked above the stellar surface, can be a source of extreme-UV and soft X-ray radiation capable of ionizing and exciting H in the outflow.
emission, just before and during the eclipse-like event, can be interpreted as a result of the accretion of the outflowing matter onto the B3V companion: the accreted matter, shocked above the stellar surface, can be a source of extreme-UV and soft X-ray radiation capable of ionizing and exciting H in the outflow.
Key words: stars: individual: V838 Monocerotis - stars: late-type - stars: early-type - stars: peculiar - stars: winds, outflows - line: profiles
1 Introduction
The eruption of V838 Monocerotis was discovered at the beginning of January 2002.
As observed in the optical, the eruption lasted about three
months (Munari et al. 2002a; Crause et al. 2003; Kimeswenger et al. 2002). During the event, the object reached
a luminosity of ![]()
![]() .
After developing an A-F supergiant spectrum
at the maximum in the beginning of February 2002, the object evolved to
lower effective temperatures and in April 2002 was practically unable to be
detected in the optical, remaining very bright however in the infrared. Optical
spectroscopy acquired at that time discovered a B3V companion of the erupted
object (Munari et al. 2002b). Tylenda (2005) analysed
the evolution of V838 Mon during outburst and early decline.
.
After developing an A-F supergiant spectrum
at the maximum in the beginning of February 2002, the object evolved to
lower effective temperatures and in April 2002 was practically unable to be
detected in the optical, remaining very bright however in the infrared. Optical
spectroscopy acquired at that time discovered a B3V companion of the erupted
object (Munari et al. 2002b). Tylenda (2005) analysed
the evolution of V838 Mon during outburst and early decline.
Different outburst mechanisms, including an unusual nova, a He-shell flash,
and a stellar merger, were
proposed to explain the eruption of V838 Mon.
These mechanisms were critically discussed by Tylenda & Soker (2006),
the authors conclude that the only mechanism that
could satisfactorily account for the observational data was a collision and
merger of a low-mass pre-main-sequence star with an ![]()
![]() main-sequence star.
main-sequence star.
In Kaminski et al. (2009, hereinafter referred to as Paper I), a high resolution spectrum of V838 Mon acquired with the Keck I telescope in October 2005 was presented. In the present paper, we analyse and discuss the results obtained from this spectrum.
2 Evolution of V838 Mon during the decline after the 2002 eruption
A few months after the eruption, discovered at the beginning of January 2002, V838 Mon entered a relatively calm decline phase. V838 Mon then resembled a very cool oxygen-rich (C/O <1) supergiant slowly declining in luminosity (Evans et al. 2003; Tylenda 2005; Munari et al. 2007b). It dominated the observed spectrum at green, red and infrared wavelengths. The blue part of the spectrum was dominated by the light of the B3V companion.
Late in 2004, narrow emission lines, belonging mostly to [Fe II], appeared mainly in the blue part of the spectrum (Barsukova et al. 2006), and strengthened in time (Munari et al. 2007a). During November-December 2006, an eclipse-like event of the B3V companion was observed (Bond 2006; Munari et al. 2007a). At the epoch of the event, the [Fe II] emission lines reached their maximum strength and strong emission in Balmer lines appeared (Munari et al. 2007a).
In October 2005, we obtained an optical spectrum of V838 Mon using the
Keck/HIRES instrument. Results of these observations were presented in
Paper I.
The star V838 Mon itself is seen as a very cool supergiant that
dominates the green and red parts of the spectrum. Numerous, often
very deep and complex,
molecular absorption bands are the main spectral characteristics of this component.
All the bands are from oxides and include TiO, VO, AlO, ScO, and YO. The
excitation temperature derived from the bands ranges from ![]() 2500 K,
identified also as the photospheric temperature of V838 Mon, down to
2500 K,
identified also as the photospheric temperature of V838 Mon, down to ![]() 500 K,
which presumably corresponds to outflowing matter at a few stellar radii.
The most positive (heliocentric) radial velocity derived from the bands is
500 K,
which presumably corresponds to outflowing matter at a few stellar radii.
The most positive (heliocentric) radial velocity derived from the bands is
![]() 58 km s-1, which we propose to be the radial velocity of
V838 Mon itself. Several atomic lines, mostly resonance, display P-Cyg
profiles. They provide evidence of an intense mass outflow with a typical velocity of
58 km s-1, which we propose to be the radial velocity of
V838 Mon itself. Several atomic lines, mostly resonance, display P-Cyg
profiles. They provide evidence of an intense mass outflow with a typical velocity of
![]() 150 km s-1. The blue part of the spectrum is dominated by the
spectrum of the B3V companion. The values of
150 km s-1. The blue part of the spectrum is dominated by the
spectrum of the B3V companion. The values of
![]() and log gderived from the spectrum agree well with those implied by the spectral type.
The star is a rapid rotator (V sin
and log gderived from the spectrum agree well with those implied by the spectral type.
The star is a rapid rotator (V sin
![]() km s-1) and its (heliocentric)
radial velocity is
km s-1) and its (heliocentric)
radial velocity is ![]() 40 km s-1. Numerous emission lines were identified,
mainly in the blue part of the spectrum. They correspond predominantly to [Fe II] and exhibit the same profile, which can be fitted well with a Lorentzian profile. The lines are centred on a heliocentric radial velocity of
40 km s-1. Numerous emission lines were identified,
mainly in the blue part of the spectrum. They correspond predominantly to [Fe II] and exhibit the same profile, which can be fitted well with a Lorentzian profile. The lines are centred on a heliocentric radial velocity of ![]() 13 km s-1 and have a FWHM of
13 km s-1 and have a FWHM of ![]() 80 km s-1.
80 km s-1.
Munari et al. (2007a) propose that the appearance of the [Fe II] emission lines and the eclipse-like event observed in November/December 2006 were unrelated, and that the eclipse-like event was caused by an eclipse in a binary system. We argue that both events were strongly related and produced by matter ejected from V838 Mon during the 2002 outburst and reaching the vicinity of the B3V companion (see also Bond 2006; Barsukova et al. 2006).
In principle, one can consider that because of a certain mechanism (e.g.,
dissipation of mechanical energy), the outer parts of the present V838 Mon wind
become excited, producing the observed [Fe II] emission lines.
In this case, however, the radial
velocity of the lines would be close to that of V838 Mon. This is
certainlly not the case. The [Fe II] lines have a radial velocity of
![]() km s-1 (Sect. 4.1.1 in Paper I), while the radial
velocity of V838 Mon is at least 53 km s-1 (see
Sect. 3). In this case, it
would also be difficult to explain the observed [Fe II] profiles.
km s-1 (Sect. 4.1.1 in Paper I), while the radial
velocity of V838 Mon is at least 53 km s-1 (see
Sect. 3). In this case, it
would also be difficult to explain the observed [Fe II] profiles.
All the observed characteristics of the [Fe II] emission lines
can, however, be easily explained, if they are assumed to be produced by
the matter ejected
during the 2002 eruption that approaches the B3V companion. As shown in
Sect. 4, the observed line profiles as well as their radial
velocities can then be well accounted for. The continuous strengthening
of the lines in 2005-2006 is also easy to understand:
larger and larger amounts of matter become excited as it approaches the
source of excitation. Excitation by radiation from the B3V
companion then explains why the emission line spectrum is dominated by
Fe II. In the spectrum of a B3V star, there are enough photons capable
of ionizing species with an ionization potential of ![]() 7 eV, e.g., Fe, Ni,
while there are very few photons capable of ionizing the most abundant
elements such as H, He or CNO. Finally, the idea easy explains the
7 eV, e.g., Fe, Ni,
while there are very few photons capable of ionizing the most abundant
elements such as H, He or CNO. Finally, the idea easy explains the
![]() 70 day eclipse-like event observed in November/December 2006
as an occultation
by a dense cloud of the matter ejected in 2002 and now
crossing the line of sight of the B3V companion.
If this is the case, one can
expect that the 2006 eclipse should be followed by similar events when other
fragments of the 2002 ejecta cross the line of sight.
Indeed, a few months later V838 Mon entered
another eclipse-like event.
70 day eclipse-like event observed in November/December 2006
as an occultation
by a dense cloud of the matter ejected in 2002 and now
crossing the line of sight of the B3V companion.
If this is the case, one can
expect that the 2006 eclipse should be followed by similar events when other
fragments of the 2002 ejecta cross the line of sight.
Indeed, a few months later V838 Mon entered
another eclipse-like event.![]() We note that the latter would be,
at least, difficult to explain as a phenomenon typical of an eclipsing binary system.
We note that the latter would be,
at least, difficult to explain as a phenomenon typical of an eclipsing binary system.
3 The radial velocity of V838 Mon
Several molecules observed in the spectrum of V838 Mon reveal
bands formed from high excitation-energy levels (see Sect. 5 in Paper I).
They are usually indicative of a radial heliocentric velocity
of ![]() km s-1 (see also Sect. 5.1).
It is reasonable to assume that they arise very close to the
photosphere and have a velocity close to the stellar one. Earlier
determinations of the stellar velocity in Kolev et al. (2002) and
Kipper et al. (2004) implied a value of 59-62 km s-1, i.e., close to our result.
km s-1 (see also Sect. 5.1).
It is reasonable to assume that they arise very close to the
photosphere and have a velocity close to the stellar one. Earlier
determinations of the stellar velocity in Kolev et al. (2002) and
Kipper et al. (2004) implied a value of 59-62 km s-1, i.e., close to our result.
However, the SiO maser emission observed in V838 Mon (Deguchi et al. 2005; Claussen et al. 2007; Deguchi et al. 2009) is at a heliocentric velocity of 71 km s-1. In the case of late-type stars, the SiO masers usually have a reliable measure of their stellar radial velocity.
There are two possible explanations of this discrepancy. If the SiO maser emission really originates at the stellar velocity then the estimate made in Paper I may indicate that we do not measure molecular bands deep enough that are to reach hydrostatic levels of the V838 Mon atmosphere, i.e., even the highest excitation bands are formed in already expanding layers. The other possibility is that the optical spectroscopic studies provide a correct estimate of the stellar velocity but that the SiO maser is not at the stellar velocity. We note that the radial velocity and width of the main component of the SiO maser are very close to those of the CO rotational lines observed in diffuse matter in the close vicinity of V838 Mon (Kaminski 2008). This point certainly deserves further investigation.
In the present paper, we usually adopt the radial velocity derived from the SiO maser, i.e., 71 km s-1, as the radial velocity of V838 Mon. One has, however, to keep in mind that the results from optical spectroscopy infer a value 10-15 km s-1 lower.
4 An analysis of the [Fe II] line profile
As discussed in Sect. 2, we assume that the [Fe II] emission lines are formed in the matter ejected by V838 Mon during its 2002 outburst, which is now approaching the B3V companion and ionized by the UV radiation of the companion. In this section, using simplified modelling, we show that the observed profiles of the [Fe II] lines can be easily explained by this scenario.
4.1 The model
![\begin{figure}
\par\includegraphics[angle=-90,scale=0.4]{sketch.eps}
\end{figure}](/articles/aa/full_html/2009/33/aa12312-09/img15.png) |
Figure 1: A sketch of the scenario considered in modelling the [Fe II] line profile in Sect. 4. |
| Open with DEXTER | |
We consider a system of two stars, S1 and S2, with a separation A (see
Fig. 1).
We assume that the star S1 is a source of a
steady, spherically symmetric wind,
that forms an expanding envelope with a r-2 density
distribution. We allow for the possibility that matter in the form of clumps or
filaments fills a ![]() part of the envelope volume, i.e.,
part of the envelope volume, i.e., ![]() .
The wind started a certain time ago, so the envelope has an
outer boundary, r0. The wind has not yet reached star S2, so r0 < A.
Star S2 is a source of ionizing radiation and emits
.
The wind started a certain time ago, so the envelope has an
outer boundary, r0. The wind has not yet reached star S2, so r0 < A.
Star S2 is a source of ionizing radiation and emits
![]() ionizing photons isotropically per unit time and unit solid angle. The
radiation produces an ionized region in the wind whose boundaries
can be determined assuming ionization equillibrium.
ionizing photons isotropically per unit time and unit solid angle. The
radiation produces an ionized region in the wind whose boundaries
can be determined assuming ionization equillibrium.
We consider ionization along a given direction from star S2 forming
an angle ![]() with the axis between the stars. A distance x2 from
star S2, to which the wind matter is ionized, can be found from
with the axis between the stars. A distance x2 from
star S2, to which the wind matter is ionized, can be found from
where
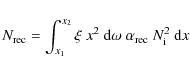
is a number of recombinations in a cone of solid angle d
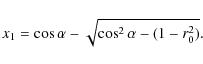
In Eq. (2), x1 is a distance from star S2 to the wind outer boundary along the considered direction, given by
Equation (1) can be rewritten as
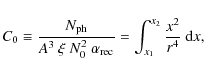
which, using Eq. (3), can be evaluated to give
where
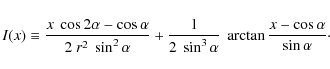
Equation (6) can be solved numerically to obtain x2. Along the separation axis, i.e., when
Solving Eq. (6) for a grid of
We assume that the ionized region is isothermal, so that the emission line coefficient
varies as Ni2, and that the intrinsic line profile is Gaussian
characterized by a thermal and/or turbulent velocity, ![]() .
Integrating
the intrinsic line profile over the ionized region and taking into account
the kinematic properties of the ionized wind, a final emission-line profile can be
obtained. Apart from the above-mentioned parameters determining the
ionization front, the resultant line profile depends on kinematic parameters
of the wind and the stellar system, which are: the wind expansion velocity,
.
Integrating
the intrinsic line profile over the ionized region and taking into account
the kinematic properties of the ionized wind, a final emission-line profile can be
obtained. Apart from the above-mentioned parameters determining the
ionization front, the resultant line profile depends on kinematic parameters
of the wind and the stellar system, which are: the wind expansion velocity,
![]() ;
the velocity of star S1 (source of the wind) relative
to the observer,
;
the velocity of star S1 (source of the wind) relative
to the observer, ![]() ;
and
the angle between the stars separation axis and the line of sight,
;
and
the angle between the stars separation axis and the line of sight,
![]() .
.
4.2 Fitting the model to the observations
Some of the parameters in the above problem can be estimated from
observations. As discussed in Sect. 2,
we assume that close to the time of the November/December 2006 eclipse,
matter ejected during the 2002
eruption of V838 Mon reached the vicinity of the B3V companion.
Our observations were completed
in October 2005, so we can estimate that
![]() .
During the 2002 outburst
of V838 Mon, expansion velocities observed
reached
.
During the 2002 outburst
of V838 Mon, expansion velocities observed
reached ![]() 600 km s-1,
although most of mass loss occurred at 150-400 km s-1(Munari et al. 2002a; Tylenda 2005; Crause et al. 2003; Kipper et al. 2004). As discussed in Tylenda (2005), the most
intense mass loss occurred in March 2002, which was observed as an expanding
photosphere of velocity
600 km s-1,
although most of mass loss occurred at 150-400 km s-1(Munari et al. 2002a; Tylenda 2005; Crause et al. 2003; Kipper et al. 2004). As discussed in Tylenda (2005), the most
intense mass loss occurred in March 2002, which was observed as an expanding
photosphere of velocity ![]() 270 km s-1.
We therefore assume
270 km s-1.
We therefore assume
![]() in the present calculations.
We also assume that the heliocentric radial
velocity of V838 Mon is
in the present calculations.
We also assume that the heliocentric radial
velocity of V838 Mon is
![]() (see
Sect. 3). Thus, there
remain 3 free parameters, i.e., C0,
(see
Sect. 3). Thus, there
remain 3 free parameters, i.e., C0,
![]() ,
and
,
and ![]() ,
which can be obtained by fitting the model profile to the observed profile
of the [Fe II] emission lines.
,
which can be obtained by fitting the model profile to the observed profile
of the [Fe II] emission lines.
![\begin{figure}
\par\includegraphics[scale=0.45]{profil.eps}
\end{figure}](/articles/aa/full_html/2009/33/aa12312-09/img38.png) |
Figure 2: A model profile (full curve) compared to the observed profile of [Fe II] 4287 Å (points). The model parameters are discussed in the text. |
| Open with DEXTER | |
A fit of this kind is presented in Fig. 2.
Points show the observed profile of the [Fe II] 4287 Å line.
This is one of the
strongest emission lines of [Fe II] in our spectrum. Its profile is free
of blending with other lines and affected little by noise.
The local continuum was
subtracted and the flux was normalized to the peak value. (Note
that the profile of [Fe II] 4287 Å shown in Fig. 2
is practically the same as the mean profile derived from 7 [Fe II]
lines displayed in Fig. 4 of Paper I.)
The model profile was obtained with the following values of the free
parameters:
C0 = 0.35,
![]() ,
and
,
and
![]() .
If
.
If
![]() is
assumed (as discussed in Sect. 3),
the results of the profile fitting remain unchanged, except
is
assumed (as discussed in Sect. 3),
the results of the profile fitting remain unchanged, except
![]() ,
which increases to
,
which increases to
![]() .
.
We note that there is little ambiguity in determining the values of
the above free parameters, because each of them affects different characteristics of
the model line profile. The value of
C0 determines the size of the ionized region, so, for a
fixed
![]() ,
it affects the wings of the line profile (the
higher the value of C0, the more extended and stronger the wings).
If
,
it affects the wings of the line profile (the
higher the value of C0, the more extended and stronger the wings).
If
![]() and
and ![]() are fixed,
are fixed,
![]() defines the position of the
line peak.
Finally,
defines the position of the
line peak.
Finally, ![]() determines the width of the line core.
determines the width of the line core.
4.3 Discussion
The results of the above modelling of the [Fe II] profile
allows us to estimate the parameters of the matter
approaching the B3V companion. From the profile fitting, we have
C0 = 0.35. Assuming that the matter, expanding with velocity
![]() ,
reached the B3V companion in November or December of 2006, we derive a distance
between V838 Mon and the B3V companion of
,
reached the B3V companion in November or December of 2006, we derive a distance
between V838 Mon and the B3V companion of
![]() cm
(
cm
(![]() 250 AU).
Integrating the spectrum of a standard B3V star above the ionization
potential of iron, one obtains
250 AU).
Integrating the spectrum of a standard B3V star above the ionization
potential of iron, one obtains
![]() .
The recombination coefficient of
Fe I is
.
The recombination coefficient of
Fe I is
![]() (at an electron temperature of
103-104 K; see Nahar et al. 1997).
From Eq. (5), one then finds that
(at an electron temperature of
103-104 K; see Nahar et al. 1997).
From Eq. (5), one then finds that
![]() ,
or
,
or
![]() at the outer edge of the wind envelope,
i.e., at r0. We note that at an electron density
at the outer edge of the wind envelope,
i.e., at r0. We note that at an electron density
![]()
![]() ,
the [Fe II] lines become collisionally
de-excited.
Assuming spherical symmetry, a mass-loss rate during the
2002 outburst can be estimated to be
,
the [Fe II] lines become collisionally
de-excited.
Assuming spherical symmetry, a mass-loss rate during the
2002 outburst can be estimated to be
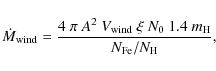 |
(9) |
where
5 Mass outflow in V838 Mon
Munari et al. (2007b) noted presence of continuous mass loss since the outburst. They reported that the outflow observed in K I 7698 Å has not much changed since 2002. The nature of its mass loss is however unclear. In this section, we analyse and discuss results from the profiles of molecular bands and atomic lines observed in October 2005 and presented in Paper I.
5.1 Outflow as seen in molecular bands
As discussed in Paper I, the spectrum of V838 Mon is dominated by numerous,
complex, and often very deep absorption lines related to molecular bands. A simple
model of a stellar photosphere plus an outflowing homogeneous layer was
used to identify and fit the observed structures of individual bands. In
this procedure, it was necessary to adopt various velocities for the
outflowing layer to reproduce different band structures. In general, we
found that bands originating in more excited levels correspond to
higher (more positive) radial velocities than low excitation bands. This
effect is shown, in a more quantitative way, in Fig. 3, which
plots the heliocentric radial velocity of a particular band versus
the excitation energy, ![]() ,
of the level from which the band arises. Only results
for the TiO molecule, for which we identified the
largest number of bands, are shown. As the excitation potential plotted in
Fig. 3, we have taken the energy of the lower level of the
most blueshifted line in the bandhead. Vertical error bars illustrate
uncertainties in the velocity. Uncertainties in the energy have been taken
as a range of energies of lower levels of lines lying within
,
of the level from which the band arises. Only results
for the TiO molecule, for which we identified the
largest number of bands, are shown. As the excitation potential plotted in
Fig. 3, we have taken the energy of the lower level of the
most blueshifted line in the bandhead. Vertical error bars illustrate
uncertainties in the velocity. Uncertainties in the energy have been taken
as a range of energies of lower levels of lines lying within
![]() km s-1 of the bandhead (this is the typical velocity broadening
adopted in modelling the bands in Paper I).
km s-1 of the bandhead (this is the typical velocity broadening
adopted in modelling the bands in Paper I).
![\begin{figure}
\par\includegraphics[scale=0.45]{figtio.eps}
\end{figure}](/articles/aa/full_html/2009/33/aa12312-09/img59.png) |
Figure 3: The heliocentric radial velocity of individual TiO bands plotted against the excitation potential of the lower level of the band. See text for more details. |
| Open with DEXTER | |
As can be seen from Fig. 3, there is a clear correlation
between the radial velocity of a particular band and the excitation
potential of the lower level of the band. This we interpret as evidence of
an outward accelerated mass outflow, in which the observed bands are
formed. The highest excitation bands can be formed in hotter regions, i.e.,
close to the photosphere, where the outflow velocity is low. Hence, we
postulated in Paper I that the highest radial velocity observed in the
high excitation bands, i.e., ![]() +58 km s-1, corresponds to the radial
velocity of V838 Mon. The bands originating in levels close to the ground state
can be easily formed in cold outermost layers outflowing with a large velocity.
+58 km s-1, corresponds to the radial
velocity of V838 Mon. The bands originating in levels close to the ground state
can be easily formed in cold outermost layers outflowing with a large velocity.
Figure 4 shows the same data as in Fig. 3 but in
a different, more astrophysical, way. Here, instead of the excitation
potential, we plot a parameter, log
![]() ,
where gf and
,
where gf and ![]() are the oscillator strength and wavelength of the band,
respectively. Within a constant factor, this parameter
is equivalent to the logarithm of
the absorption coefficient in a given band. As an
excitation temperature,
are the oscillator strength and wavelength of the band,
respectively. Within a constant factor, this parameter
is equivalent to the logarithm of
the absorption coefficient in a given band. As an
excitation temperature,
![]() ,
we adopted 500 K, which is a
typical value in the outflow, as inferred in Paper I (Sect. 5). The
horizontal error bars show uncertainties related to the spread in the excitation
energy and oscillator strength for the lines present within 35 km s-1 of
the bandhead.
,
we adopted 500 K, which is a
typical value in the outflow, as inferred in Paper I (Sect. 5). The
horizontal error bars show uncertainties related to the spread in the excitation
energy and oscillator strength for the lines present within 35 km s-1 of
the bandhead.
![\begin{figure}
\par\includegraphics[scale=0.45]{figtio5.eps}
\end{figure}](/articles/aa/full_html/2009/33/aa12312-09/img61.png) |
Figure 4:
The heliocentric radial velocity of individual TiO bands plotted
against log
|
| Open with DEXTER | |
As Fig. 3, Fig. 4 can be interpreted as evidence of an increasing outflow velocity with the distance from the photosphere. Bands with a small absorption coefficient require large column densities to be visible in the observed spectrum. Thus, they must be formed deep in the outflow. More opaque bands are effectively formed in more distant layers and their profiles provide information about the kinematics well above the photosphere.
From the span of the radial velocities observed in the TiO bands, shown
in Figs. 3 and 4, we can conclude
that the wind in V838 Mon is accelerated at least
to a velocity of ![]() 180 km s-1.
180 km s-1.
5.2 An analysis of the P-Cyg profiles
The presence of lines showing P-Cyg profiles in the spectrum of an observed object is usually considered as strong evidence of an ongoing mass outflow from the object. In our spectrum of V838 Mon, we found about ten atomic lines exhibiting these characteristics (see Sect. 4.2 in Paper I). All of them but one originate from resonant transitions. Below we analyse the profiles of these lines in an attempt to investigate the physics and nature of the outflow.
The terminal velocity of the outflow from V838 Mon can be obtained
from the observed K I ![]() 7698 absorption profile (see Fig. 6 in Paper I).
If we take
7698 absorption profile (see Fig. 6 in Paper I).
If we take
![]() km s-1 to be the stellar
radial velocity (see discussion in Sect. 3), then the terminal
velocity of the outflow is
km s-1 to be the stellar
radial velocity (see discussion in Sect. 3), then the terminal
velocity of the outflow is
![]() km s-1. The observed
absorption components in other P-Cyg profiles do not reach this velocity,
most probably because of the
low column density of the atoms in the outer parts of the
outflow. Because of the high oscillator strength and the high
atomic abundance, the opacity in the K I
km s-1. The observed
absorption components in other P-Cyg profiles do not reach this velocity,
most probably because of the
low column density of the atoms in the outer parts of the
outflow. Because of the high oscillator strength and the high
atomic abundance, the opacity in the K I ![]() 7698 line is at least two
orders of magnitude higher than for any other resonant line observed.
Consequently, this line can be observed even with relatively
low column densities expected at high velocities.
The value of terminal velocity derived from the
K I absorption is consistent with, although slightly higher than,
the outflow velocity estimated form the molecular bands of TiO analysed in
Sect. 5.1. It also agrees with the maximum expansion velocity derived by
Geballe et al. (2007) from the CO bands observed half a year after our
observations.
7698 line is at least two
orders of magnitude higher than for any other resonant line observed.
Consequently, this line can be observed even with relatively
low column densities expected at high velocities.
The value of terminal velocity derived from the
K I absorption is consistent with, although slightly higher than,
the outflow velocity estimated form the molecular bands of TiO analysed in
Sect. 5.1. It also agrees with the maximum expansion velocity derived by
Geballe et al. (2007) from the CO bands observed half a year after our
observations.
To obtain a deeper insight into the nature of the outflow in
V838 Mon, we performed a radiative transfer modelling of the P-Cyg
profiles. We assume that the profiles are formed in a spherically
symmetric expanding envelope. Our modelling procedure is based on
the SEI method developed by Lamers et al. (1987), and all details concerning the solution of
radiative transfer can be found therein![]() . As the velocity field of the
outflow, we adopt the standard
. As the velocity field of the
outflow, we adopt the standard ![]() -law, i.e.,
-law, i.e.,
where
As already pointed out in Paper I (Sect. 4.2), the observed P-Cyg absorption
components have velocity structure. A majority of the absorption profiles
have narrow absorption components (NACs) that appear at different
velocities. The most striking example of NAC is seen in the Rb I
line at Vh=-82 km s-1(see Fig. 6 in Paper I).
Some lines, e.g., those of Cr I and
Ba I, seem to exhibit many NACs at once, which dominate the
appearance of the profiles. On the other hand,
there are also absorption profiles, e.g., those of Ca I ![]() 6572 and
K I
6572 and
K I ![]() 7698, which are very smooth and do not seem to be affected by
discrete components. The question is whether the narrow components
seen in our profiles are superimposed on a broad P-Cyg
absorption profile formed in a bulk flow, or whether the entire
absorption profile consists of several discrete and strong absorption
components that are blended and together form a more or less continuous profile.
7698, which are very smooth and do not seem to be affected by
discrete components. The question is whether the narrow components
seen in our profiles are superimposed on a broad P-Cyg
absorption profile formed in a bulk flow, or whether the entire
absorption profile consists of several discrete and strong absorption
components that are blended and together form a more or less continuous profile.
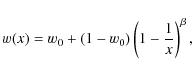
As a first attempt, we assumed a distribution of
optical thickness in the form
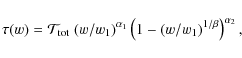
where
We, therefore, modified the optical depth distribution by adding multiple
Gaussian components, ![]() ,
to
Eq. (11) parameterized by
central velocities, widths, and weights according to which they are
added. We note that, for the sake of convenience,
the Gaussian components are parameterized in
the velocity domain, so the corresponding distributions as
functions of radial distance,
,
to
Eq. (11) parameterized by
central velocities, widths, and weights according to which they are
added. We note that, for the sake of convenience,
the Gaussian components are parameterized in
the velocity domain, so the corresponding distributions as
functions of radial distance, ![]() ,
are in general not
Gaussian (the profile is modified by the adopted velocity field).
,
are in general not
Gaussian (the profile is modified by the adopted velocity field).
In this multi-component approach, we were able to successfully reproduce
the observed profiles.
Results for the Rb I ![]() 7800 line are shown in Fig. 5.
At least
three discrete components (``shells'') of different widths are needed
to obtain a profile that reproduces the observations well. These
components, which are clearly present in all the profiles, are located at
outflow velocities of about 50, 110, and 150 km s-1 (with respect to
7800 line are shown in Fig. 5.
At least
three discrete components (``shells'') of different widths are needed
to obtain a profile that reproduces the observations well. These
components, which are clearly present in all the profiles, are located at
outflow velocities of about 50, 110, and 150 km s-1 (with respect to
![]() km s-1).
km s-1).
We attempted to model all the prominent P-Cyg lines independently and, while the central velocities and widths of different components were found to be consistently determined for different lines, the relative contributions of the components differ considerably from line to line. This implies that the relative ion opacities differ considerably between consecutive ``shells''. This can be understand either as changes in excitation conditions or different atomic abundances (chemical composition) in the discrete outflow components. Although the latter seems to be less likely, the changing atomic fractions due to interchanges of atoms with molecules and/or dust grains may play an important role. An extreme case of this effect is observed in the resonant absorption lines of Ti I. Apart from the main component seen close to the stellar velocity (but see Sect. 5.3), these lines appear only in one of the outflowing ``shells'' (see Fig. 6 in Paper I).
![\begin{figure}
\par\includegraphics[angle=-90,scale=0.7]{figRb.ps} \end{figure}](/articles/aa/full_html/2009/33/aa12312-09/img76.png) |
Figure 5:
Top: the P-Cygni profile of Rb I |
| Open with DEXTER | |
Our modelling allows us to place general constraints on
the velocity field in the outflow. The adopted value of
![]() has a strong influence on the relative
strengths of absorption and emission components in a P-Cyg
profile (for a given radial distribution of optical thickness).
We found that the outflow in V838 Mon can be characterized well by
has a strong influence on the relative
strengths of absorption and emission components in a P-Cyg
profile (for a given radial distribution of optical thickness).
We found that the outflow in V838 Mon can be characterized well by
![]() .
This result was obtained assuming
that collisional deexcitation and photospheric contamination to the
P-Cyg profile can be neglected. An influence of collisional de-excitation
on the emission component cannot be properly recognized because of unknown
electron densities in the outflow. We believe that it is
small, at least for lines with high
transition probabilities (e.g., the lines of Rb I,
K I, and Ba I with an Einstein coefficient
.
This result was obtained assuming
that collisional deexcitation and photospheric contamination to the
P-Cyg profile can be neglected. An influence of collisional de-excitation
on the emission component cannot be properly recognized because of unknown
electron densities in the outflow. We believe that it is
small, at least for lines with high
transition probabilities (e.g., the lines of Rb I,
K I, and Ba I with an Einstein coefficient
![]() of the
order of 107-108 s-1).
We did not find any signs of
photospheric contamination in the observed spectrum and we therefore
neglected this effect in our modelling.
of the
order of 107-108 s-1).
We did not find any signs of
photospheric contamination in the observed spectrum and we therefore
neglected this effect in our modelling.
The value of ![]() derived above implies that
the acceleration of material is very
rapid and at the distance of 4
derived above implies that
the acceleration of material is very
rapid and at the distance of 4![]() ,
the wind has a velocity of
0.99
,
the wind has a velocity of
0.99
![]() .
This steep velocity gradient requires very high
densities of material to be able to reproduce strong absorption features at low
velocities. Therefore,
to reproduce the absorption component
at the outflow velocity of 50 km s-1 (which
corresponds to
.
This steep velocity gradient requires very high
densities of material to be able to reproduce strong absorption features at low
velocities. Therefore,
to reproduce the absorption component
at the outflow velocity of 50 km s-1 (which
corresponds to
![]() for
for ![]() ), it was
necessary to include an inner narrow shell with
a very high optical thickness. For several lines, e.g., the
K I line, it was even impossible to reproduce the central parts
of the P-Cyg profile without
incorporating unreasonably high values of optical thickness. This made
us conclude that in the velocity field, generally well
described by the
), it was
necessary to include an inner narrow shell with
a very high optical thickness. For several lines, e.g., the
K I line, it was even impossible to reproduce the central parts
of the P-Cyg profile without
incorporating unreasonably high values of optical thickness. This made
us conclude that in the velocity field, generally well
described by the ![]() -law, a sort of a plateau (or plateaus) may
exist, i.e., a region of nearly constant velocity extended in the
radial direction.
These velocity plateaus, or non-monotonicities,
were proposed to explain the winds of hot stars (Puls et al. 1993; Prinja & Howarth 1986).
The possible existence of
similar features in the outflow of V838 Mon is a tentative conclusion,
which should be examined by time-dependent observations of the P-Cyg
profiles in the spectrum of V838 Mon.
The derived radial distributions of optical thickness for different ions
can be used to provide a rough estimate of the mass-loss rate in
V838 Mon. For a given stellar radius,
-law, a sort of a plateau (or plateaus) may
exist, i.e., a region of nearly constant velocity extended in the
radial direction.
These velocity plateaus, or non-monotonicities,
were proposed to explain the winds of hot stars (Puls et al. 1993; Prinja & Howarth 1986).
The possible existence of
similar features in the outflow of V838 Mon is a tentative conclusion,
which should be examined by time-dependent observations of the P-Cyg
profiles in the spectrum of V838 Mon.
The derived radial distributions of optical thickness for different ions
can be used to provide a rough estimate of the mass-loss rate in
V838 Mon. For a given stellar radius, ![]() ,
the mass-loss rate can be estimated from (Groenewegen & Lamers 1989)
,
the mass-loss rate can be estimated from (Groenewegen & Lamers 1989)
where
5.3 Signatures of an infall
The redward broad absorption components seen in the Ti I lines (see Sect. 4.3 in Paper I) can be interpreted as a signature of an infall in V838 Mon. Similar absorption components also contaminate the profiles of the 5060 and 5110 Å lines of Fe I.
These absorption features in the Ti I lines have wings
extending out to about
![]() km s-1.
Thus, regardless of the velocity of the star in the
range 58-71 km s-1 (see Sect. 3),
the red wings of these features are evidently
redshifted with respect to the photosphere. The maximum infall velocity
inferred from these wings is 50-60 km s-1, which agrees very well with the
free fall velocity of an
km s-1.
Thus, regardless of the velocity of the star in the
range 58-71 km s-1 (see Sect. 3),
the red wings of these features are evidently
redshifted with respect to the photosphere. The maximum infall velocity
inferred from these wings is 50-60 km s-1, which agrees very well with the
free fall velocity of an ![]() star (Tylenda et al. 2005)
at a photospheric radius of
star (Tylenda et al. 2005)
at a photospheric radius of ![]()
![]() (Sect. 5 in Paper I).
(Sect. 5 in Paper I).
Signatures of an infall were previously observed in V838 Mon.
Rushton et al. (2005) observed inverse P-Cyg profiles of Ti I lines in
their spectra obtained in the near infrared in December 2003. From the separation
of the absorption and emission components, an infall velocity of
![]() 20 km s-1 can be deduced. These authors also argue that the infalling
matter, compressed, and heated when colliding with the atmospheric material,
provide conditions necessary to excite the SiO lines that they observe.
Observations of the ro-vibrational bands of CO by Geballe et al. (2007) in April 2006
revealed a photospheric component redshifted by 15 km s-1 with respect to the velocity of
the SiO maser. This suggests, according to the authors, the presence of gas
infalling onto the star or contraction of the stellar photosphere.
20 km s-1 can be deduced. These authors also argue that the infalling
matter, compressed, and heated when colliding with the atmospheric material,
provide conditions necessary to excite the SiO lines that they observe.
Observations of the ro-vibrational bands of CO by Geballe et al. (2007) in April 2006
revealed a photospheric component redshifted by 15 km s-1 with respect to the velocity of
the SiO maser. This suggests, according to the authors, the presence of gas
infalling onto the star or contraction of the stellar photosphere.
5.4 Discussion
As mentioned above, the mass outflow in V838 Mon has been observed
continously
since the 2002 eruption. Our analysis confirms this statement and
provides new results. The question that
arises is what drives this outflow. It consists of cold neutral matter that
is rich in molecules, and possibly also dust, which is
similar to the composition of the winds of cool stars, e.g., objects in the asymptotic giant
branch. Velocity fields of these cool winds are usually well described by the
![]() -law with
-law with
![]() ,
which is close to the value
derived above for V838 Mon. These cool winds are believed to be
dust-driven. They usually do not reach the high terminal velocities found for V838 Mon. A possible reason is that dust is destroyed in collisions, when the outflow is faster than about
30 km s-1 (Olofsson 2004). From this reason, it seems that the outflow in V838 Mon cannot be driven by dust only, since we observe material being accelerated at much higher velocities than 30 km s-1. This driving mechanism can, however, play a role at the base of the outflow, where velocities are low enough.
,
which is close to the value
derived above for V838 Mon. These cool winds are believed to be
dust-driven. They usually do not reach the high terminal velocities found for V838 Mon. A possible reason is that dust is destroyed in collisions, when the outflow is faster than about
30 km s-1 (Olofsson 2004). From this reason, it seems that the outflow in V838 Mon cannot be driven by dust only, since we observe material being accelerated at much higher velocities than 30 km s-1. This driving mechanism can, however, play a role at the base of the outflow, where velocities are low enough.
One can consider a mechanism similar to that driving winds in hot stars, i.e., by radiation pressure absorbed in atomic resonant lines. However, the small number and relative weakness of lines of this type in our spectrum (they are typically 10 times narrower than those in the OB stars) does not support the idea that these lines could be effective in driving mass loss from V838 Mon. More promising is the possibility that the outflow is driven by radiation pressure absorbed in molecular bands in the optical and infrared. The object is very bright in these wavelength ranges and the observed number and strength of molecular bands, as seen in our spectrum (some of them absorb practically all the radiation available in their wavelength ranges - see Paper I), clearly shows that a significant part of the momentum carried out in radiation is indeed absorbed in the outflowing matter. A process of driving winds by radiation pressure absorbed in molecular bands was proposed as a mechanism accelerating cold circumstellar envelopes (see Jørgensen & Johnson 1992, and references therein).
The analysis of the P-Cyg profiles reported in Sect. 5.2 was
completed assuming spherical symmetry and a monotonicly increasing outflow
velocity described by Eq. (10). Within this approach, the general
shape of the observed profiles can be satisfactorily reproduced. This
shows that the general pattern of the outflow is more or less spherically
symmetric. The profiles however show, at least some of them, narrow structures,
which we called NACs. The structure at
![]() km s-1 is
particularly striking. In the spherically symmetric, approach the only way to
explain the NACs is to assume that the mass-loss rate
varies with time and produces dense shells expanding with a thinner wind. As
can be seen in Fig. 5, to explain the strong NAC at
km s-1 is
particularly striking. In the spherically symmetric, approach the only way to
explain the NACs is to assume that the mass-loss rate
varies with time and produces dense shells expanding with a thinner wind. As
can be seen in Fig. 5, to explain the strong NAC at
![]() km s-1 it is necessary to postulate a short lived
enhancement in the mass loss rate by two orders of magnitude. However, if
the above assumptions are relaxed, the NACs can be explained in
other ways. One possibility is that the NACs are produced by mass loss being more intense in
certain, more or less discrete, directions. For instance, the NAC at
km s-1 it is necessary to postulate a short lived
enhancement in the mass loss rate by two orders of magnitude. However, if
the above assumptions are relaxed, the NACs can be explained in
other ways. One possibility is that the NACs are produced by mass loss being more intense in
certain, more or less discrete, directions. For instance, the NAC at
![]() km s-1 would then be understood as a stream-like or jet-like outflow
with a projected velocity of
km s-1 would then be understood as a stream-like or jet-like outflow
with a projected velocity of ![]() 153 km s-1
(adopting the radial velocity of V838 Mon of 71 km s-1; see Sect. 3).
Jets usually have counter-jets. The observed lack of any counter-jet in our
spectrum as well as the position of the NAC close to the terminal velocity
of the P-Cyg profiles suggests that the jet, if responsible for producing the NAC at
-82 km s-1, is not far from the line of sight.
153 km s-1
(adopting the radial velocity of V838 Mon of 71 km s-1; see Sect. 3).
Jets usually have counter-jets. The observed lack of any counter-jet in our
spectrum as well as the position of the NAC close to the terminal velocity
of the P-Cyg profiles suggests that the jet, if responsible for producing the NAC at
-82 km s-1, is not far from the line of sight.
Another possibility is that the NAC at
![]() km s-1 has nothing
to do with the presently ongoing mass outflow, but is produced in the matter
lost during the 2002 eruption that is now in front of the object.
This interpretation would imply the existence of
a dense shell at a distance of
km s-1 has nothing
to do with the presently ongoing mass outflow, but is produced in the matter
lost during the 2002 eruption that is now in front of the object.
This interpretation would imply the existence of
a dense shell at a distance of ![]()
![]() cm
(
cm
(![]()
![]() )
from the object expanding with a
velocity of
)
from the object expanding with a
velocity of ![]() 153 km s-1. However, during the 2002
eruption the matter was ejected with velocities ranging
from
153 km s-1. However, during the 2002
eruption the matter was ejected with velocities ranging
from ![]() 100 to
100 to ![]() 600 km s-1 (Munari et al. 2002a; Kipper et al. 2004; Crause et al. 2003). Thus, the
matter, or at least part of it, would have to have been condensed into a shell
at later epochs. This can occur if matter ejected later catches up with slower
matter ejected earlier. In the case of V838 Mon, this mechanism does not seem
to have worked, since the outflow velocity observed during the
2002 eruption tended to decrease with time (Munari et al. 2002a; Crause et al. 2003).
A NAC at
600 km s-1 (Munari et al. 2002a; Kipper et al. 2004; Crause et al. 2003). Thus, the
matter, or at least part of it, would have to have been condensed into a shell
at later epochs. This can occur if matter ejected later catches up with slower
matter ejected earlier. In the case of V838 Mon, this mechanism does not seem
to have worked, since the outflow velocity observed during the
2002 eruption tended to decrease with time (Munari et al. 2002a; Crause et al. 2003).
A NAC at
![]() km s-1 is seen in our spectrum in the Ti I 5147
and 5152 Å lines, which do not display P-Cyg profiles
(see panel c in Fig. 6 in Paper I). The close radial velocity and
line width suggest that this component is produced in the
same enviroment as the NAC in the P-Cyg profiles.
If this is the case, our interpretation presented above
would have to be excluded. The Ti I lines arise from the levels lying
2.3-2.4 eV above the ground state. Thus, they must arise in a rather warm
matter (of temperature comparable to that in the photosphere), while the matter lost in 2002
and now at a distance of
km s-1 is seen in our spectrum in the Ti I 5147
and 5152 Å lines, which do not display P-Cyg profiles
(see panel c in Fig. 6 in Paper I). The close radial velocity and
line width suggest that this component is produced in the
same enviroment as the NAC in the P-Cyg profiles.
If this is the case, our interpretation presented above
would have to be excluded. The Ti I lines arise from the levels lying
2.3-2.4 eV above the ground state. Thus, they must arise in a rather warm
matter (of temperature comparable to that in the photosphere), while the matter lost in 2002
and now at a distance of ![]() 30 photospheric radii is expected to be cold
(
30 photospheric radii is expected to be cold
(![]() 500 K, if estimated from pure geometric dilution of the radiative energy
density). In conclusion, we
consider that the interpretation that the NAC at
500 K, if estimated from pure geometric dilution of the radiative energy
density). In conclusion, we
consider that the interpretation that the NAC at
![]() km s-1 is
related to matter lost in 2002 is less
probable than the other two, i.e., varying mass-loss
rate in the present wind or jet-like ouflow.
km s-1 is
related to matter lost in 2002 is less
probable than the other two, i.e., varying mass-loss
rate in the present wind or jet-like ouflow.
Spectroscopic data allowing analyses of the time-dependent behaviour of the P-Cyg
profiles would help to discriminate between interpretations involving
varying mass-loss rate, jet-like outflow, or distant matter lost in 2002. In
the first case, the NACs are expected to migrate in the profile with time,
while in the two other cases the NACs should be rather stable features.
It is worth noting that Geballe et al. (2007) in their high-resolution spectra
obtained in the K band in April 2006, i.e., half a year after our
spectroscopy, indentified several velocity
components in the CO absorption line profiles. Apart from the photospheric component
(mentioned in Sect. 5.3) the authors found components at expansion
velocities of 15, 85, and 150 km s-1. The last feature is practically at the
same velocity as our NAC at
![]() km s-1 suggesting that this is
a persistent component. However, the feature in the CO lines is much wider
than the NAC, so the conclusion is unclear. The two other components in
the CO lines do not match other NACs in our P-Cyg profiles, which are seen at
the expansion velocities of 50 and 110 km s-1 (see Sect. 5.2). This
suggests that these NACs are transient and produced by varying mass-loss
rates.
km s-1 suggesting that this is
a persistent component. However, the feature in the CO lines is much wider
than the NAC, so the conclusion is unclear. The two other components in
the CO lines do not match other NACs in our P-Cyg profiles, which are seen at
the expansion velocities of 50 and 110 km s-1 (see Sect. 5.2). This
suggests that these NACs are transient and produced by varying mass-loss
rates.
6 Summary and discussion
Our analysis of both the positions of the molecular bands (Sect. 5.1)
and the P-Cyg profiles (Sect. 5.2) have shown that V838 Mon loses
matter with a terminal velocity of ![]() 215 km s-1 at a rate of
215 km s-1 at a rate of
![]() yr-1. Thus, the object loses of the
order of 10
yr-1. Thus, the object loses of the
order of 10 ![]() in the form of the kinetic energy of the wind. This is
small compared to the radiation luminosity of the object,
which is
in the form of the kinetic energy of the wind. This is
small compared to the radiation luminosity of the object,
which is ![]()
![]() (see Sect. 5 in Paper I).
However, the momentum carried out in
the wind is comparable to that in the radiation. Thus, the wind in V838 Mon
is likely to be radiation driven, probably due to absorption in the
molecular bands, as discussed in Sect. 5.4.
(see Sect. 5 in Paper I).
However, the momentum carried out in
the wind is comparable to that in the radiation. Thus, the wind in V838 Mon
is likely to be radiation driven, probably due to absorption in the
molecular bands, as discussed in Sect. 5.4.
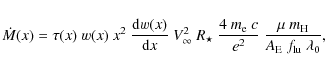
The kinematic pattern of the matter in the atmosphere of V838 Mon is very complex. Both expansion and wind outflow dominate. Most of the outflow is more or less spherically symmetric as suggested by our modelling of the observed P-Cyg profiles (Sect. 5.2). However, as discussed in Sect. 5.4, it is quite possible that we also observe a jet-like outflow. As shown in Sect. 5.3, certain regions, perhaps initially accelerated but not sufficiently to allow them to leave the object, also fall back to the photosphere. We note that simultaneous signatures of infall and outflow have been observed in the winds of hot stars (e.g., Howk et al. 2000) and often in protostars. A possible scenario for creating coexisting mass outflow and infall in asymptotic giant branch stars was discussed in Soker (2008) and may also work in the remnant of the V838 Mon outburst.
As discussed in Tylenda (2005), the evolution of V838 Mon in the post-outburst state is probably dominated by gravitational contraction, i.e., is closely related to that of protostars. If, as argued in Tylenda & Soker (2006), the 2002 outburst of V838 Mon was produced by a stellar merger, then a significant amount of angular momentum should have been stored in the remnant of the event (see also Soker & Tylenda 2007). Gravitational contraction may then result in the flattening of the envelope, eventually leading to the formation of an accretion disc (as in protostellar objects). The possibility discussed in Sect. 5.4, namely that we observe a jet in the spectrum, if confirmed, may imply that a disc has already formed in V838 Mon.
As shown in Sect. 4, the observed profile of the
[Fe II] lines can be easily understood as having been produced by matter
lost by V838 Mon in the 2002 eruption and now excited by the radiation of
the B3V companion. As the matter approaches the companion, a larger and larger
proportion of the flux from the star can interact with the matter causing an
increase in the [Fe II] emission, as observed.
Indeed, the flux in the 20 strongest [Fe II] lines in our spectrum
obtained in October 2005
increased by a factor of ![]() 3.5 in the measurements completed by Munari et al. (2007a)
in December 2006. At the moment of our observations,
the outer boundary of the expanding envelope was presumably at a distance of
3.5 in the measurements completed by Munari et al. (2007a)
in December 2006. At the moment of our observations,
the outer boundary of the expanding envelope was presumably at a distance of
![]() 0.75 times the separation between V838 Mon and its B3V companion.
Thus, only
0.75 times the separation between V838 Mon and its B3V companion.
Thus, only ![]() 17% of the radiation flux of the
B3V companion should then interact with the matter. At the moment of the
eclipse-like event in November/December 2006, the matter presumably reached
the closest vicinity of the companion and the portion of the stellar
radiation capable of exciting the matter increased to 50-100%.
17% of the radiation flux of the
B3V companion should then interact with the matter. At the moment of the
eclipse-like event in November/December 2006, the matter presumably reached
the closest vicinity of the companion and the portion of the stellar
radiation capable of exciting the matter increased to 50-100%.
Apart from the [Fe II] emission lines, Munari et al. (2007a) also
observed strong Balmer lines in emission. In particular, they discussed in detail
the profile of H![]() observed in December 2006 - April 2007. No H
observed in December 2006 - April 2007. No H![]() was seen in our spectrum in October 2005. However, in the absorption cores of
higher members of the Balmer series (in the spectrum of the B3V
companion), we have detected weak emission components (see Sect. 4.1.2 in
Paper I). In particular, the emission component in the H
was seen in our spectrum in October 2005. However, in the absorption cores of
higher members of the Balmer series (in the spectrum of the B3V
companion), we have detected weak emission components (see Sect. 4.1.2 in
Paper I). In particular, the emission component in the H![]() line
was estimated to have an observed flux of
line
was estimated to have an observed flux of ![]()
![]() erg cm-2 s-1. We note that the profile of the H
erg cm-2 s-1. We note that the profile of the H![]() emission component
(see Fig. 5 in Paper I) was remarkably similar to that of the
H
emission component
(see Fig. 5 in Paper I) was remarkably similar to that of the
H![]() line observed by Munari et al. (2007a) in December 2006. Moreover, the
parameters of the emission component in H
line observed by Munari et al. (2007a) in December 2006. Moreover, the
parameters of the emission component in H![]() in our spectrum and of the
H
in our spectrum and of the
H![]() emission component in Munari et al. (2007a) (radial velocity and FWHM) are
close to those of the [Fe II] lines derived in Paper I. This
implies that all these lines probably originate in the same region, i.e.,
in the part
of the V838 Mon envelope (ejected in 2002) approaching the B3V companion.
The point is, however, that while in the spectrum of a B3V star there are
enough photons capable of ionizing iron and exciting the [Fe II] lines,
there are very few photons, capable of ionizing hydrogen.
Between October 2005 and December 2006, the
flux in the H
emission component in Munari et al. (2007a) (radial velocity and FWHM) are
close to those of the [Fe II] lines derived in Paper I. This
implies that all these lines probably originate in the same region, i.e.,
in the part
of the V838 Mon envelope (ejected in 2002) approaching the B3V companion.
The point is, however, that while in the spectrum of a B3V star there are
enough photons capable of ionizing iron and exciting the [Fe II] lines,
there are very few photons, capable of ionizing hydrogen.
Between October 2005 and December 2006, the
flux in the H![]() emission also increased by a factor of
emission also increased by a factor of ![]() 7, while that in
H
7, while that in
H![]() increased by at least two orders of magnitude. This large increase
cannot be explained by a purely geometric effect, as discussed above in the case
of the [Fe II] lines. Therefore, an additional source of excitation of
the Balmer lines is necessary, a source, whose intensity significantly increased
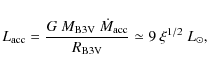
between October 2006 and December 2007. We suggest that this is provided by
matter accretion from the outflowing V838 Mon envelope on the B3V companion.
We now complete simplified estimates for this scenario.
increased by at least two orders of magnitude. This large increase
cannot be explained by a purely geometric effect, as discussed above in the case
of the [Fe II] lines. Therefore, an additional source of excitation of
the Balmer lines is necessary, a source, whose intensity significantly increased
between October 2006 and December 2007. We suggest that this is provided by
matter accretion from the outflowing V838 Mon envelope on the B3V companion.
We now complete simplified estimates for this scenario.
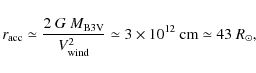
We assume that matter flows with a velocity,
![]() ,
in
the vicinity of a star of mass,
,
in
the vicinity of a star of mass,
![]() .
An accretion radius,
.
An accretion radius,
![]() ,
can be estimated from the standard formula
(see e.g., Frank et al. 2002)
,
can be estimated from the standard formula
(see e.g., Frank et al. 2002)
where we adopted
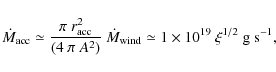
where we used the values of
 |
(15) |
where
Acknowledgements
The research reported on in this paper has been supported by the Polish Ministry of Science and Higher Education under grant No. N203 004 32/0448, for which the authors are grateful.
References
- Barsukova, E., Goranskij, V., Abolmasov, P., & Fabrika, S. 2006, ATel, 803 (In the text)
- Bond, H. E. 2006, ATel, 966
- Castor, J. I., & Lamers, H. J. G. L. M. 1979, ApJS, 39, 481 [NASA ADS] [CrossRef] (In the text)
- Claussen, M. J., Bond, H. E., Starrfield, S., & Healy, K. 2007, in The Nature of V838 Mon and its Light Echo, ed. R.L.M., Corradi, & U., Munari, ASP Conf. Ser., 363, 87
- Crause, L. A., Lawson, W. A., Kilkenny, D., et al. 2003, MNRAS, 341, 785 [NASA ADS] [CrossRef]
- Deguchi, S., Matsunaga, N., & Fukushi, H. 2005, PASJ, 57, L25 [NASA ADS]
- Deguchi, S., Matsunaga, N., Fukushi, H., & Kaminski,T. 2009, ATel, 1996
- Evans, A., Geballe, T. R., Rushton, M. T., et al. 2003, MNRAS, 343, 1056 [NASA ADS] [CrossRef]
- Frank, J., King, A., & Raine, D. 2002, Accretion Power in Astrophysics (Cambridge University Press), 3rd edn. (In the text)
- Geballe, T. R., Rushton, M. T., Eyres, S. P. S., et al. 2007, A&A, 467, 269 [NASA ADS] [CrossRef] [EDP Sciences] (In the text)
- Groenewegen, M. A. T., & Lamers, H. J. G. L. M. 1989, A&AS, 79, 359 [NASA ADS] (In the text)
- Goranskij, V. 2006, ATel, 964
- Goranskij, V., Zharova, A., Barsukova, E., Fabrika, S., & Valeev, A. 2008, in Interacting Binaries: Accretion and Synchronization, Conference held in the Crimean Astrophysical Observatory, [arXiv:0810.1887]
- Jørgensen, U. G., & Johnson, H. R. 1992, A&A, 265, 168 [NASA ADS] (In the text)
- Howk, J. C., Cassinelli, J. P., Bjorkman, J. E., & Lamers, H. J. G. L. M. 2000, ApJ, 534, 348 [NASA ADS] [CrossRef] (In the text)
- Kaminski, T. 2008, A&A, 482, 803 [NASA ADS] [CrossRef] [EDP Sciences] (In the text)
- Kaminski, T., Schmidt. M., Tylenda, R., Konacki, M., & Gromadzki, M. 2009, ApJS, 182, 33 [NASA ADS] [CrossRef] (Paper I) (In the text)
- Kimeswenger, S., Lederle, C., Schmeja, S., & Armsdorfer, B. 2002, MNRAS, 336, L43 [NASA ADS] [CrossRef]
- Kipper, T., Klochkova, V. G., Annuk, K., et al. 2004, A&A, 416, 1107 [NASA ADS] [CrossRef] [EDP Sciences] (In the text)
- Kolev, D., Mikolajewski, M., Tomov, T., et al. 2002, [arXiv:astro-ph/0211380] (In the text)
- Lamers, H. J. G. L. M., Cerruti-Sola, M., & Perinotto, M. 1987, ApJ, 314, 726 [NASA ADS] [CrossRef] (In the text)
- Mihalas, D., Kunasz, P. B., & Hummer, D. G. 1975, ApJ, 202, 465 [NASA ADS] [CrossRef]
- Munari, U., Henden, A., Kiyota, S., et al. 2002a, A&A, 389, L51 [NASA ADS] [CrossRef] [EDP Sciences]
- Munari, U., Desidera, S., & Henden, A. 2002b, IAUCirc., 8005 (In the text)
- Munari, U., Corradi, R. L. M., Henden, A., et al. 2007a, A&A, 474, 585 [NASA ADS] [CrossRef] [EDP Sciences] (In the text)
- Munari, U., Navasardyan, H., & Villanova, S. 2007b, in The Nature of V838 Mon and its Light Echo, ed. R.L.M., Corradi, & U., Munari, ASP Conf. Ser., 363, 13
- Nahar, S. N., Bautista, M. A., & Pradhan, A. K. 1997, ApJ, 479, 497 [NASA ADS] [CrossRef] (In the text)
- Olofsson, H. 2004, in Asymptotic Giant Branch Stars, ed. H. J. Habing & H. Olofsson (Hidelberg: Springer), 325 (In the text)
- Prinja, R. K., & Howarth, I. D. 1986, ApJS, 61, 357 [NASA ADS] [CrossRef]
- Puls, J., Owocki, S. P., & Fullerton, A. W. 1993, A&A, 279, 457 [NASA ADS]
- Rushton, M. T., Geballe, T. R., Evans, A., et al. 2005, MNRAS, 359, 624 [NASA ADS] [CrossRef] (In the text)
- Schmidt-Kaler, Th. 1982, Landolt-Börnstein: Numerical Data and Functional Relationships in Science and Technology, ed. K. Schaifers & H. H. Voigt (Berlin: Springer-Verlag), VI/2b (In the text)
- Soker, N. 2008, New Astron., 13, 491 [NASA ADS] [CrossRef] (In the text)
- Soker, N., & Tylenda, R. 2007, MNRAS, 375, 909 [NASA ADS] [CrossRef] (In the text)
- Tylenda, R. 2005, A&A, 436, 1009 [NASA ADS] [CrossRef] [EDP Sciences] (In the text)
- Tylenda, R., & Soker, N. 2006, A&A, 451, 223 [NASA ADS] [CrossRef] [EDP Sciences] (In the text)
- Tylenda, R., Soker, N., & Szczerba, R. 2005, A&A, 441, 1099 [NASA ADS] [CrossRef] [EDP Sciences] (In the text)
Footnotes
- ... event.
![[*]](/icons/foot_motif.png)
- See e.g., the website of V. Goranskij (http://jet.sao.ru/goray/v838mon.htm).
- ... therein
- Aware of limitations of the SEI method we have also performed modelling in the more accurate comoving frame formalism (Mihalas et al. 1975). It confirms the results obtained with the former method.
- ... shock
- The specific angular momentum accreted with the matter is negligible in this case and there is no chance to create an accretion disc arround the B3V companion, contrary to the suggestion of Goranskij et al. (2008).
All Figures
| |
Figure 1: A sketch of the scenario considered in modelling the [Fe II] line profile in Sect. 4. |
| Open with DEXTER | |
| In the text | |
| |
Figure 2: A model profile (full curve) compared to the observed profile of [Fe II] 4287 Å (points). The model parameters are discussed in the text. |
| Open with DEXTER | |
| In the text | |
| |
Figure 3: The heliocentric radial velocity of individual TiO bands plotted against the excitation potential of the lower level of the band. See text for more details. |
| Open with DEXTER | |
| In the text | |
| |
Figure 4:
The heliocentric radial velocity of individual TiO bands plotted
against log
|
| Open with DEXTER | |
| In the text | |
| |
Figure 5:
Top: the P-Cygni profile of Rb I |
| Open with DEXTER | |
| In the text | |
Copyright ESO 2009
Current usage metrics show cumulative count of Article Views (full-text article views including HTML views, PDF and ePub downloads, according to the available data) and Abstracts Views on Vision4Press platform.
Data correspond to usage on the plateform after 2015. The current usage metrics is available 48-96 hours after online publication and is updated daily on week days.
Initial download of the metrics may take a while.