| Issue |
A&A
Volume 503, Number 2, August IV 2009
|
|
|---|---|---|
| Page(s) | L13 - L16 | |
| Section | Letters | |
| DOI | https://doi.org/10.1051/0004-6361/200912620 | |
| Published online | 28 July 2009 | |
LETTER TO THE EDITOR
Evidence of warm and dense material along the outflow of a high-mass YSO![[*]](/icons/foot_motif.png)
S. Bruderer1 - A. O. Benz1 - T. L. Bourke2 - S. D. Doty3
1 - Institute of Astronomy, ETH Zurich, 8093 Zurich, Switzerland
2 -
Harvard-Smithsonian Center for Astrophysics, 60 Garden Street, Cambridge, MA 02138, USA
3 -
Department of Physics and Astronomy, Denison University, Granville, OH 43023, USA
Received 2 June 2009 / Accepted 18 July 2009
Abstract
Context. Outflow cavities in envelopes of young stellar objects (YSOs) have been predicted to allow far-UV (FUV) photons to escape far from the central source, with significant observable effects, especially if the protostar is a forming high-mass star suspected of emitting a copious amount of FUV radiation. Indirect evidence of this picture has been provided by models and unresolved single-dish observations, but direct high-resolution data are necessary for confirmation. Previous chemical modeling has suggested that CS and HCN are good probes of the local FUV field, so make good target species.
Aims. We directly probe the physical conditions of the material in the outflow walls to test this prediction.
Methods. Interferometric observations of the CS(7-6) and HCN(4-3) rotational lines in the high-mass star-forming region AFGL 2591 are carried out in the compact and extended configuration of the SubMillimeter Array (SMA). The velocity structure was analyzed, and integrated maps compared to K-band near-IR observations. A chemical model predicts abundances of CS and HCN for a gas under protostellar X-ray and FUV irradiation, and was used in conjunction with the data to distinguish between physical scenarios.
Results. CS and HCN emission was found in spatial coincidence in extended sources displaced up to
![]() from the position of the young star. Their line widths are small, excluding major shocks. Chemical model calculations predict an enhanced abundance of the two molecules in warm, dense, and FUV irradiated gas. Hot dust observed between the molecular emission and the outflow accounts for the necessary attenuation to prevent photodissociation of the molecules.
from the position of the young star. Their line widths are small, excluding major shocks. Chemical model calculations predict an enhanced abundance of the two molecules in warm, dense, and FUV irradiated gas. Hot dust observed between the molecular emission and the outflow accounts for the necessary attenuation to prevent photodissociation of the molecules.
Conclusions. The SMA data suggest that the outflow walls are heated and chemically altered by the FUV emission of the central high-mass object, providing the best direct evidence yet of large-scale direct irradiation of outflow walls.
Key words: stars: formation - ISM: molecules - stars: individual: AFGL 2591
1 Introduction
Powerful outflows and jets driven by young embedded stars can etch large cavities in their natal cloud (e.g. Velusamy & Langer 1998). In addition, the forming star releases energy as radiation. Young O or B stars emit much of their radiation in far-UV (FUV, 6-13.6 eV) wavelengths. These high-energy photons can heat and photoionize molecular gas and induce a peculiar chemistry, observed in photon-dominated regions (PDRs, e.g. Hollenbach & Tielens 1997). Due to the large extinction by dust, only the innermost few hundred AU of the envelope are influenced by FUV radiation. Cavities evacuated by the outflow thus allow the FUV radiation to reach longer distances. They may irradiate an increased volume and mass of the envelope along the border of the cavity in this way. Indirect evidence for such a dense and warm outflow wall is found by Bruderer et al. (2009b) who explain single-dish observations of the FUV enhanced molecule CO+ using a detailed 2D chemical model including an outflow cavity. Low-mass YSO interferometric observations by Hogerheijde et al. (1998) reveal warm material along the outflow.
Using HIFI/Herschel, previously inaccessible frequency bands can be observed with good angular and spectral resolution. This allows the first study of the chemistry of hydrides (e.g. CH+ or SH+), predicted to be excellent tracers of warm and FUV irradiated gas (Stäuber et al. 2004). The WISH Herschel guaranteed time key-program![]() will observe hydrides, providing indirect insight on the proposed FUV irradiated outflow walls. A direct confirmation of this physical picture, however, requires spatially resolved, high-resolution observations of FUV tracing molecules.
will observe hydrides, providing indirect insight on the proposed FUV irradiated outflow walls. A direct confirmation of this physical picture, however, requires spatially resolved, high-resolution observations of FUV tracing molecules.
In this letter, we present new submillimeter interferometric observations of molecules tracing FUV radiation. In combination with near-IR observations and chemical models, we provide the first direct evidence of dense, warm, and FUV irradiated material along the outflow of a high-mass star forming region.
2 Observations and data reduction
The SubMillimeter Array (SMA)![]() has observed AFGL 2591 in the extended configuration with projected baselines between 32.2-181.2 m (Benz et al. 2007). New observations were carried out in the compact configuration with projected baselines between 9-69.4 m. At the observed frequency and a distance of 1 kpc to the source (van der Tak et al. 1999), the combined array is thus sensitive to spatial structures in a wide range of length scales between about 600 and 12 000 AU.
has observed AFGL 2591 in the extended configuration with projected baselines between 32.2-181.2 m (Benz et al. 2007). New observations were carried out in the compact configuration with projected baselines between 9-69.4 m. At the observed frequency and a distance of 1 kpc to the source (van der Tak et al. 1999), the combined array is thus sensitive to spatial structures in a wide range of length scales between about 600 and 12 000 AU.
The frequency setting was the same for both observations (342.6-344.6 GHz in the LSB and 352.6-354.6 GHz in the USB). It covers the
![]() transition of HCN at 354.506 GHz and the
transition of HCN at 354.506 GHz and the
![]() transition of CS at 342.884 GHz. We focus here on secondary sources besides the continuum peak and thus concentrate on the two molecules that show such features.
transition of CS at 342.884 GHz. We focus here on secondary sources besides the continuum peak and thus concentrate on the two molecules that show such features.
Data was calibrated in the same way as in Benz et al. (2007). The primary frequency resolution corresponds to a velocity resolution of 0.35 km s-1. For the weighting of the visibility amplitudes, Brigg's robustness parameter was chosen to be 0. The FWHM size of the reconstructed beam is
![]() at a position angle of 43.4 degrees.
at a position angle of 43.4 degrees.
3 Results
Velocity-integrated and cleaned maps of the SMA observations are presented in Fig. 1. The molecular emissions are overlayed on K-band (2.2 ![]() m) observations. A high-resolution bispectrum speckle interferometry image by Preibisch et al. (2003) covers the inner part of the SMA maps at a resolution of
m) observations. A high-resolution bispectrum speckle interferometry image by Preibisch et al. (2003) covers the inner part of the SMA maps at a resolution of
![]() ,
while an observation obtained in the commissioning phase of NIRI at Gemini North shows the whole SMA field of view at a resolution of
,
while an observation obtained in the commissioning phase of NIRI at Gemini North shows the whole SMA field of view at a resolution of ![]()
![]() .
The fitted outflow direction and opening angle (Preibisch et al. 2003) are indicated by green lines. Line spectra at selected positions (A, A1, A2, and B) are given in Fig. 2. The spectra show the mean brightness temperature averaged in an area equivalent to the synthesized beam. The K-band image is saturated at the peak position (A). Results of a Gaussian fit, line fluxes, and coordinates of the spectra are given in Table 1.
.
The fitted outflow direction and opening angle (Preibisch et al. 2003) are indicated by green lines. Line spectra at selected positions (A, A1, A2, and B) are given in Fig. 2. The spectra show the mean brightness temperature averaged in an area equivalent to the synthesized beam. The K-band image is saturated at the peak position (A). Results of a Gaussian fit, line fluxes, and coordinates of the spectra are given in Table 1.
The maps from the combined compact and extended configuration of the SMA show the emission peak at the same position (A) as those from the extended configuration (Benz et al. 2007). The increased sensitivity of the combined array by a factor of ![]() 3 together with a better (u,v)-coverage allows weak emission to be detected on larger scales. A striking feature of this extended emission is the good spatial correlation of the CS(7-6) and HCN(4-3) emission. Also, most secondary sources are concentrated along the border of the western outflow. This outflow is known to point towards us at an inclination angle similar to the opening angle (van der Tak et al. 1999). The line of sight from the observer to the protostar is thus approximately following the border of the outflow. The alignment of the other outflow (in the eastern direction pointing away from us) is unclear since it has not been detected here in molecular emission and in the K-band. Assuming the same axis for both outflows, a slight extension along the northeastern wall of the outflow is found in the HCN(4-3) map. About perpendicular to the outflow axis, position A1 shows molecular emission at projected distances of up to 3400 AU in HCN and 4100 AU in CS.
3 together with a better (u,v)-coverage allows weak emission to be detected on larger scales. A striking feature of this extended emission is the good spatial correlation of the CS(7-6) and HCN(4-3) emission. Also, most secondary sources are concentrated along the border of the western outflow. This outflow is known to point towards us at an inclination angle similar to the opening angle (van der Tak et al. 1999). The line of sight from the observer to the protostar is thus approximately following the border of the outflow. The alignment of the other outflow (in the eastern direction pointing away from us) is unclear since it has not been detected here in molecular emission and in the K-band. Assuming the same axis for both outflows, a slight extension along the northeastern wall of the outflow is found in the HCN(4-3) map. About perpendicular to the outflow axis, position A1 shows molecular emission at projected distances of up to 3400 AU in HCN and 4100 AU in CS.
Along the border of the western outflow, the HCN and CS emission at position A2 is about at the same angle relative to the RA-axis as the secondary source found by Benz et al. (2007), but detected here out to a distance four times farther (![]() 4200 AU). A detailed map of position B is given as an inset in Fig. 1. It shows a spatial displacement of the molecular emission compared to the K-band image by Preibisch et al. (2003) towards the exterior of the projected outflow.
4200 AU). A detailed map of position B is given as an inset in Fig. 1. It shows a spatial displacement of the molecular emission compared to the K-band image by Preibisch et al. (2003) towards the exterior of the projected outflow.
![\begin{figure}
\par\includegraphics[width=6.2cm,clip]{12620fg1.eps}
\end{figure}](/articles/aa/full_html/2009/32/aa12620-09/img12.png) |
Figure 1:
Velocity-integrated emission of HCN(4-3) (blue contours) and CS(7-6) (red contours) observed by the SMA in AFGL 2591. Contours show isophotes at 5 |
| Open with DEXTER | |
Are the emitting regions associated with the outflow or with the envelope? The velocity
![]() at positions A, A1, A2, and B is obtained from a Gaussian fit and the first moment of the spectra (Table 1). Both values are consistent, due to the Gaussian shape of the spectra, except for HCN at positions A and A1. At the continuum peak (A), HCN is skewed to red velocities as found by Benz et al. (2007). Our observations do however not show a self-absorption feature at the systemic velocity of the envelope (
at positions A, A1, A2, and B is obtained from a Gaussian fit and the first moment of the spectra (Table 1). Both values are consistent, due to the Gaussian shape of the spectra, except for HCN at positions A and A1. At the continuum peak (A), HCN is skewed to red velocities as found by Benz et al. (2007). Our observations do however not show a self-absorption feature at the systemic velocity of the envelope (
![]() km s-1). The missing self-absorption may stem from to the relative contribution of the innermost optically thick region to the beam being greater for the smaller beam of the extended array. The HCN lines are generally broader than the CS lines, as observed by the JCMT, namely
km s-1). The missing self-absorption may stem from to the relative contribution of the innermost optically thick region to the beam being greater for the smaller beam of the extended array. The HCN lines are generally broader than the CS lines, as observed by the JCMT, namely
![]() km s-1 (CS) and
km s-1 (CS) and
![]() km s-1 (HCN) (van der Tak et al. 1999). The ratio between the linewidth of CS and HCN is similar to the JCMT value, except for position A2, but the HCN spectra at that position tentatively shows a self-absorption signature at
km s-1 (HCN) (van der Tak et al. 1999). The ratio between the linewidth of CS and HCN is similar to the JCMT value, except for position A2, but the HCN spectra at that position tentatively shows a self-absorption signature at
![]() .
The linewidths are comparable to the JCMT observations at positions A1 and A2 but are broader at positions A and B. The broader line at the continuum peak (A) is possibly a result of the larger infall velocity on scales of the SMA beam (free-fall velocity
.
The linewidths are comparable to the JCMT observations at positions A1 and A2 but are broader at positions A and B. The broader line at the continuum peak (A) is possibly a result of the larger infall velocity on scales of the SMA beam (free-fall velocity
![]() km s-1 at 500 AU, Benz et al. 2007) compared to the JCMT beam (
km s-1 at 500 AU, Benz et al. 2007) compared to the JCMT beam (
![]() km s-1 at 7000 AU). The near-IR observations show a clumpy border of the outflow cavity (Preibisch et al. 2003), and the velocity disperion between several clumps contributing to the emission may cause the broader line at position B. The velocities at A2 and B are consistent with the systemic velocity, while the center position and A1 are slightly red-shifted with
km s-1 at 7000 AU). The near-IR observations show a clumpy border of the outflow cavity (Preibisch et al. 2003), and the velocity disperion between several clumps contributing to the emission may cause the broader line at position B. The velocities at A2 and B are consistent with the systemic velocity, while the center position and A1 are slightly red-shifted with
![]() km s-1. As
km s-1. As
![]() was obtained from JCMT observations, it may possibly not be applicable for the innermost 1000 AU. Typical shock indicators as line asymmetry, shifted velocity compared to
was obtained from JCMT observations, it may possibly not be applicable for the innermost 1000 AU. Typical shock indicators as line asymmetry, shifted velocity compared to
![]() ,
large linewidths, and location near the apex of the bow-shock are missing in positions A, A1, and B. Our observations can, however, not exclude shocks because the observed linewidth may be smaller than the shock velocity if the shock propagates at an angle to the line of sight. We conclude that the extended emission is associated with the accreting envelope.
,
large linewidths, and location near the apex of the bow-shock are missing in positions A, A1, and B. Our observations can, however, not exclude shocks because the observed linewidth may be smaller than the shock velocity if the shock propagates at an angle to the line of sight. We conclude that the extended emission is associated with the accreting envelope.
![\begin{figure}
\par\includegraphics[width=7.8cm,clip]{12620fg2.eps}
\end{figure}](/articles/aa/full_html/2009/32/aa12620-09/img21.png) |
Figure 2: Spectra of HCN(4-3) and CS(7-6) in AFGL 2591 at different positions (Fig. 1). A Gaussian fitted to the spectra is given with dashed line. Bars at the bottom of each spectrum indicate the first moment and the velocity of the fitted Gaussian with the range of the error. A vertical line at -5.5 km s-1 indicates the systemic velocity of the envelope obtained from JCMT observations. |
| Open with DEXTER | |
Table 1: Observed properties of the CS(7-6) and HCN(4-3) lines for different positions (Fig. 2).
The spectrally integrated line fluxes F of the two lines are correlated, with flux ratios (
![]() )
between 1.57 and 1.77. The total flux of the SMA observations compared to the JCMT is 177 to 435 Jy km s-1 (41%) for CS and 285 to 873 Jy km s-1 (33%) for HCN. Is the missing flux of the interferometer consistent with the single-dish observation despite the good (u,v)-coverage of the combined array? A flux density of 1.8 Jy beam-1 km s-1 (2.6
)
between 1.57 and 1.77. The total flux of the SMA observations compared to the JCMT is 177 to 435 Jy km s-1 (41%) for CS and 285 to 873 Jy km s-1 (33%) for HCN. Is the missing flux of the interferometer consistent with the single-dish observation despite the good (u,v)-coverage of the combined array? A flux density of 1.8 Jy beam-1 km s-1 (2.6![]() -detection) for CS and 4.1 Jy beam-1 km s-1 (3.7
-detection) for CS and 4.1 Jy beam-1 km s-1 (3.7![]() -detection) for HCN would amount by distributing the missing flux equally over the area of the JCMT beam, where no line at a
-detection) for HCN would amount by distributing the missing flux equally over the area of the JCMT beam, where no line at a ![]() level was detected by the SMA. The missing flux is below the SMA threshold of 0.7 (CS) and 1.1 (HCN) Jy beam-1 km s-1 (for
level was detected by the SMA. The missing flux is below the SMA threshold of 0.7 (CS) and 1.1 (HCN) Jy beam-1 km s-1 (for ![]() )
even if no flux was resolved out by the interferometer.
)
even if no flux was resolved out by the interferometer.
The SMA flux within the hot-core region of 1000 AU (Doty et al. 2002, about
![]() )
from the continuum peak is 78 (CS) and 143 (HCN) Jy km s-1. The contribution of the extended emission detected by the SMA compared to the JCMT flux is thus about 23% for CS and 16% for HCN.
)
from the continuum peak is 78 (CS) and 143 (HCN) Jy km s-1. The contribution of the extended emission detected by the SMA compared to the JCMT flux is thus about 23% for CS and 16% for HCN.
4 Interpretation
The spatial coincidence of the CS and HCN emission in all secondary sources is not trivial. For interpretation, we use the chemical model by Doty et al. (2002) and Stäuber et al. (2005,2004) (see Bruderer et al. 2009a, for details). The models calculate the temporal evolution of chemical abundances in a parcel of gas irradiated by protostellar FUV radiation. Figure 3 presents the modeled abundances of CS and HCN relative to the H2 density as a function of temperature for different densities and FUV irradiation. The abundances are given for a chemical age of
![]() yrs as suggested by Stäuber et al. (2005). We note however that the main conclusions from this section are not sensitive to the chemical age due to very short chemical time scales for strong FUV irradiation.
yrs as suggested by Stäuber et al. (2005). We note however that the main conclusions from this section are not sensitive to the chemical age due to very short chemical time scales for strong FUV irradiation.
The FUV luminosity of AFGL 2591 is estimated![]() to be
to be
![]() erg s-1 assuming
erg s-1 assuming
![]()
![]() and
and
![]() K (van der Tak et al. 1999). At a distance of 1000 AU, this yields
K (van der Tak et al. 1999). At a distance of 1000 AU, this yields
![]() ISRF (interstellar radiation fields,
ISRF (interstellar radiation fields,
![]() erg s-1 cm-2) in the absence of any attenuation. The equivalent hydrogen column density for an optical depth of 1 is only about
erg s-1 cm-2) in the absence of any attenuation. The equivalent hydrogen column density for an optical depth of 1 is only about
![]() cm-2, so that FUV heating and photodissociation is a ``surface''-effect acting only on the edge of a high-density region.
cm-2, so that FUV heating and photodissociation is a ``surface''-effect acting only on the edge of a high-density region.
![\begin{figure}
\par\includegraphics[width=7.8cm,clip]{12620fg3.eps}
\end{figure}](/articles/aa/full_html/2009/32/aa12620-09/img49.png) |
Figure 3: Modeled abundance of HCN (bottom panels) and CS (top panels) relative to H2 as a function of temperature. The models assume a far-UV (FUV) radiation of 0 (black), 102 (red), 103 (green), and 105 ISRF (blue line). Gas densities of 104 and 107 cm-3 are shown. The density gives the initial number of hydrogen molecules per cm3 in the chemical model. |
| Open with DEXTER | |
The model abundance of CS (Fig. 3) shows a distinct step at 100 K due to the evaporation of sulfur from dust grains assumed at this temperature. The initial relative abundance of sulfur in the models is
![]() for
for ![]() K (in H2S) and
K (in H2S) and
![]() for T < 100 K (in S). FUV irradiation destroys CS, except for T > 250 K at high density, when the reaction C + S2
for T < 100 K (in S). FUV irradiation destroys CS, except for T > 250 K at high density, when the reaction C + S2
![]() CS + S competes with photodissociation. Below 250 K, H2 + OH
CS + S competes with photodissociation. Below 250 K, H2 + OH
![]() H2O + H does not proceed and the photodissociation of water and OH liberates much atomic oxygen (Charnley 1997). Subsequently, O reacts with S2 to SO and sulfur is not available for the formation of CS. The formation of HCN by the reaction H2 + CN
H2O + H does not proceed and the photodissociation of water and OH liberates much atomic oxygen (Charnley 1997). Subsequently, O reacts with S2 to SO and sulfur is not available for the formation of CS. The formation of HCN by the reaction H2 + CN
![]() HCN + H is very temperature dependent because of an activation energy of 820 K. Under FUV irradiation, CN is enhanced for temperatures above 250 K by the reaction C + NS
HCN + H is very temperature dependent because of an activation energy of 820 K. Under FUV irradiation, CN is enhanced for temperatures above 250 K by the reaction C + NS
![]() S + CN. At lower temperature, atomic oxygen destroys NS resulting in a lower HCN abundance.
S + CN. At lower temperature, atomic oxygen destroys NS resulting in a lower HCN abundance.
Most important for interpreting the SMA data indicating simultaneous enhancements of HCN and CS, the chemical models require a dense, warm gas with temperatures above 250 K and FUV irradiation. Under these conditions, the abundance of SO is reduced to a level consistent with the nondetection (0.8 Jy beam-1 km s-1 for ![]() )
of extended emission of the SO(87-77) line in our observations.
)
of extended emission of the SO(87-77) line in our observations.
In photon-dominated regions (PDRs), FUV photons efficiently heat the gas through the photoelectric effect on dust grains. The minimal distance of position B to the central source is 7000 AU. In the absence of any attenuation, the FUV field would have decreased to
![]() ISRF or lower. An FUV flux of
ISRF or lower. An FUV flux of ![]()
![]() ISRF is required at a gas density of
ISRF is required at a gas density of
![]() cm-3 to produce a PDR surface temperature of
cm-3 to produce a PDR surface temperature of ![]() 1000 K (Kaufman et al. 1999). For example, at a density of 107 cm-3, above the critical density of the observed CS transition, an FUV flux of about
1000 K (Kaufman et al. 1999). For example, at a density of 107 cm-3, above the critical density of the observed CS transition, an FUV flux of about
![]() ISRF would heat the gas to 1000 K, while CS and HCN are not photodissociated. The attenuation from
ISRF would heat the gas to 1000 K, while CS and HCN are not photodissociated. The attenuation from
![]() to
to
![]() ISRF requires an optical depth of
ISRF requires an optical depth of ![]() .
.
Another mechanism for simultaneously increasing the abundance of HCN and CS would be ionization by protostellar X-ray radiation (Stäuber et al. 2005). The cross-section of X-rays is much lower than for FUV radiation, and they can thus influence the chemistry within a few 1000 AU of the source. A temperature >250 K, required to enhance CS and HCN by X-rays, can however not be reached by X-ray heating at distances of a few 1000 AU (even assuming an unusually high X-ray luminosity of ![]() 1032 erg s-1, Stäuber et al. 2005). FUV-heated gas with additional X-ray irradiation cannot be ruled out, as X-rays would further enhance the abundance of HCN and CS. However, X-rays are not necessary in this context, as the FUV present in heating the gas also explains the CS and HCN observations. As discussed before, minor shocks cannot be excluded by the observations and could also contribute to the FUV field (van Kempen et al. 2009).
1032 erg s-1, Stäuber et al. 2005). FUV-heated gas with additional X-ray irradiation cannot be ruled out, as X-rays would further enhance the abundance of HCN and CS. However, X-rays are not necessary in this context, as the FUV present in heating the gas also explains the CS and HCN observations. As discussed before, minor shocks cannot be excluded by the observations and could also contribute to the FUV field (van Kempen et al. 2009).
5 A scenario
The observed morphology and chemical models suggest the following scenario. Protostellar FUV radiation escapes trough a low-density region of the outflow, observed in the near-IR. The radiation penetrates the high-density material at the border of the outflow, where it heats the gas and induces a PDR-like chemistry in the accreting envelope.
For observed distances to the protostar, the FUV field has to be attenuated at the surface of the outflow wall to prevent molecules from being photodissociated. Indeed, position B in Fig. 1 shows molecular emission outside the projected outflow. A thin layer of dense dust situated between the molecular emission and the outflow is seen in the K-band and may act as an ``FUV shield'' for the molecular emission.
For positions A1 and A2, the geometry is less evident. The emission at A1 within the projected outflow region can stem either from the front or back side of the outflow wall. For the small angle between the line of sight and the outflow as proposed by van der Tak et al. (1999), region A2 can either be associated to the western or eastern outflow walls.
6 Conclusions
Submillimeter interferometric observations of the high-mass star-forming region AFGL 2591 in CS(7-6) and HCN(4-3) were carried out. The high angular resolution reveals a spatial coincidence of extended CS and HCN emission, which is interpreted by the help of a chemical model as warm, dense, and FUV-irradiated gas. In combination with K-band near-IR images, these results provide the first direct evidence of FUV irradiated outflow walls. We conclude:
- Protostellar FUV radiation alters the chemical composition in envelopes of a high-mass YSO on large scales up to several 1000 AU, if a low-density outflow cavity allows radiation to escape.
- The contribution of the FUV-enhanced HCN and CS emission on distances >1000 AU to the observed single-dish flux is about 25%.
Acknowledgements
We thank Cecilia Ceccarelli, Michael Meyer, Michael Rissi, and Pascal Stäuber for useful discussions. The work was supported by the Swiss National Science Foundation grant 200020-113556 (SB), a grant from The Research Corporation (SDD) and the NASA grant NNX08AH28G (SDD). This work makes use of observations obtained at the Gemini Observatory (acquired through the Gemini Science Archive), which is operated by the Association of Universities for Research in Astronomy, Inc., under a cooperative agreement with the NSF on behalf of the Gemini partnership.
References
- Benz, A. O., Stäuber, P., Bourke, T. L., et al. 2007, A&A, 475, 549 [NASA ADS] [CrossRef] [EDP Sciences] (In the text)
- Bruderer, S., Doty, S., & Benz, A. 2009a, ApJS, accepted (In the text)
- Bruderer, S., Benz, A., Doty, S., van Dishoeck, E., & Bourke, T. 2009b, ApJ, accepted (In the text)
- Charnley, S. B. 1997, ApJ, 481, 396 [NASA ADS] [CrossRef] (In the text)
- Doty, S. D., van Dishoeck, E. F., van der Tak, F. F. S., & Boonman, A. M. S. 2002, A&A, 389, 446 [NASA ADS] [CrossRef] [EDP Sciences] (In the text)
- Hogerheijde, M. R., van Dishoeck, E. F., Blake, G. A., & van Langevelde, H. J. 1998, ApJ, 502, 315 [NASA ADS] [CrossRef] (In the text)
- Hollenbach, D. J., & Tielens, A. G. G. M. 1997, ARA&A, 35, 179 [NASA ADS] [CrossRef] (In the text)
- Kaufman, M. J., Wolfire, M. G., Hollenbach, D. J., & Luhman, M. L. 1999, ApJ, 527, 795 [NASA ADS] [CrossRef] (In the text)
- Preibisch, T., Balega, Y. Y., Schertl, D., & Weigelt, G. 2003, A&A, 412, 735 [NASA ADS] [CrossRef] [EDP Sciences] (In the text)
- Stäuber, P., Doty, S. D., van Dishoeck, E. F., Jørgensen, J. K., & Benz, A. O. 2004, A&A, 425, 577 [NASA ADS] [CrossRef] [EDP Sciences] (In the text)
- Stäuber, P., Doty, S. D., van Dishoeck, E. F., & Benz, A. O. 2005, A&A, 440, 949 [NASA ADS] [CrossRef] [EDP Sciences]
- van der Tak, F. F. S., van Dishoeck, E. F., Evans, II, N. J., Bakker, E. J., & Blake, G. A. 1999, ApJ, 522, 991 [NASA ADS] [CrossRef] (In the text)
- van Kempen, T. A., van Dishoeck, E. F., Güsten, R., et al. 2009, A&A, 501, 633 [NASA ADS] [CrossRef] [EDP Sciences] (In the text)
- Velusamy, T., & Langer, W. D. 1998, Nature, 392, 685 [NASA ADS] [CrossRef] (In the text)
Online Material
Appendix A: The FUV luminosity
For the modeling in Sect. 4, the FUV luminosity
![]() is required. Assuming the protostar to emit a blackbody spectrum, this quantity depends on the bolometric luminosity
is required. Assuming the protostar to emit a blackbody spectrum, this quantity depends on the bolometric luminosity
![]() and the effective temperature
and the effective temperature
![]() .
While
.
While
![]() of the embedded protostar can be determined relatively well from photometry in the IR and is assumed to be given in the following, only rough estimations of
of the embedded protostar can be determined relatively well from photometry in the IR and is assumed to be given in the following, only rough estimations of
![]() are available, since photons are absorbed or redistributed to longer wavelengths by the high dust and gas column density toward the source.
are available, since photons are absorbed or redistributed to longer wavelengths by the high dust and gas column density toward the source.
![\begin{figure}
\par\includegraphics[width=7.3cm,clip]{12620fg4.eps}
\end{figure}](/articles/aa/full_html/2009/32/aa12620-09/img61.png) |
Figure A.1:
Luminosity in the FUV band depending on
|
| Open with DEXTER | |
The Stefan-Boltzmann law requires
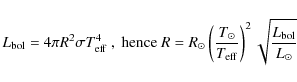
with the source radius R, the Stefan-Boltzmann constant
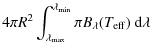
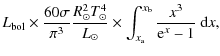
with
How does this temperature dependence affect the results of the models in Sect. 4? In the absence of any attenuation,
![]() erg s-1 is required to provide the necessary FUV field of
erg s-1 is required to provide the necessary FUV field of
![]() ISRF at position B for heating. Assuming the bolometric luminosity to be correct, the temperature needs to be higher than 6800 K. For a temperature of
ISRF at position B for heating. Assuming the bolometric luminosity to be correct, the temperature needs to be higher than 6800 K. For a temperature of
![]() K instead of
K instead of
![]() K, the FUV luminosity decreases by a factor of 2 and the required column density for attenuation (Sect. 4) reduces to
K, the FUV luminosity decreases by a factor of 2 and the required column density for attenuation (Sect. 4) reduces to ![]() .
We conclude that the modeling results are not affected by
.
We conclude that the modeling results are not affected by
![]() as long as the temperature exceeds about 104 K.
as long as the temperature exceeds about 104 K.
Footnotes
- ... YSO
- Appendix is only available in electronic form at http://www.aanda.org
- ... key-program
- http://www.strw.leidenuniv.nl/WISH/
- ... (SMA)
- The Submillimeter Array is a joint project between the Smithsonian Astrophysical Observatory and the Academia Sinica Institute of Astronomy and Astrophysics and is funded by the Smithsonian Institution and the Academia Sinica.
- ... estimated
- Appendix A gives a discussion of the sensitivity of
 on
on
 .
.
All Tables
Table 1: Observed properties of the CS(7-6) and HCN(4-3) lines for different positions (Fig. 2).
All Figures
| |
Figure 1:
Velocity-integrated emission of HCN(4-3) (blue contours) and CS(7-6) (red contours) observed by the SMA in AFGL 2591. Contours show isophotes at 5 |
| Open with DEXTER | |
| In the text | |
| |
Figure 2: Spectra of HCN(4-3) and CS(7-6) in AFGL 2591 at different positions (Fig. 1). A Gaussian fitted to the spectra is given with dashed line. Bars at the bottom of each spectrum indicate the first moment and the velocity of the fitted Gaussian with the range of the error. A vertical line at -5.5 km s-1 indicates the systemic velocity of the envelope obtained from JCMT observations. |
| Open with DEXTER | |
| In the text | |
| |
Figure 3: Modeled abundance of HCN (bottom panels) and CS (top panels) relative to H2 as a function of temperature. The models assume a far-UV (FUV) radiation of 0 (black), 102 (red), 103 (green), and 105 ISRF (blue line). Gas densities of 104 and 107 cm-3 are shown. The density gives the initial number of hydrogen molecules per cm3 in the chemical model. |
| Open with DEXTER | |
| In the text | |
| |
Figure A.1:
Luminosity in the FUV band depending on
|
| Open with DEXTER | |
| In the text | |
Copyright ESO 2009
Current usage metrics show cumulative count of Article Views (full-text article views including HTML views, PDF and ePub downloads, according to the available data) and Abstracts Views on Vision4Press platform.
Data correspond to usage on the plateform after 2015. The current usage metrics is available 48-96 hours after online publication and is updated daily on week days.
Initial download of the metrics may take a while.