| Issue |
A&A
Volume 503, Number 2, August IV 2009
|
|
|---|---|---|
| Page(s) | 399 - 408 | |
| Section | Cosmology (including clusters of galaxies) | |
| DOI | https://doi.org/10.1051/0004-6361/200811021 | |
| Published online | 09 July 2009 | |
Cluster and cluster galaxy evolution history from IR to X-ray observations of the young cluster RX J1257.2+4738 at z = 0.866![[*]](/icons/foot_motif.png)
M. P. Ulmer1,2 - C. Adami1 - G. B. Lima Neto3 - F. Durret4 - G. Covone5 - O. Ilbert1,6 - E. S. Cypriano3,7 - S. S. Allam8 - R. G. Kron9 - W. A. Mahoney10 - R. Gavazzi4
1 - LAM, Pôle de l'Etoile Site Château-Gombert, 38 rue Frédéric Juliot-Curie, 13388 Marseille Cedex 13, France
2 -
Department of Physics and Astronomy, Northwestern University, 2131 Sheridan Road, Evanston IL 60208-2900, USA
3 -
Instituto de Astronomia, Geofísica e C. Atmosf./USP, R. do Matão 1226, 05508-090 São Paulo/SP, Brazil
4 -
Institut d'Astrophysique de Paris, CNRS, UMR 7095, Université Pierre et Marie Curie, 98bis Bd Arago, 75014 Paris, France
5 -
Università di Napolia ``Federico II'', Dipartimento di Sciennze Fisiche and INAF - Observatorio Astronomico di Capodimonte, v. Moiariello 16, 80131 Napoli, Italy
6 -
Institute for Astronomy, 2680 Woodlawn Dr., University of Hawaii, Honolulu, Hawaii 96822, USA
7 -
Department of Physics and Astronomy, University College London, Gower Street, London WC1E 6BT, UK
8 -
Fermi National Accelerator Laboratory, MS 127, PO Box 500, Batavia, IL 60510, USA
9 -
University of Chicago, Department of Astronomy and Astrophysics, 5640 South Ellis Avenue, Chicago, IL 60637, USA
10 -
California Institute of Technology, Spitzer Science Center, MS 314-6, 1200 East California Blvd,
Pasadena, CA 91125, USA
Received 23 September 2008 / Accepted 30 June 2009
Abstract
Context. The cosmic time around the ![]() redshift range appears crucial in the cluster and galaxy evolution, since it is probably the epoch of the first mature galaxy clusters. Our knowledge of the properties of the galaxy populations in these clusters is limited because only a handful of
redshift range appears crucial in the cluster and galaxy evolution, since it is probably the epoch of the first mature galaxy clusters. Our knowledge of the properties of the galaxy populations in these clusters is limited because only a handful of ![]() clusters are presently known.
clusters are presently known.
Aims. In this framework, we report the discovery of a ![]() cluster and study its properties at various wavelengths.
cluster and study its properties at various wavelengths.
Methods. We gathered X-ray and optical data (imaging and spectroscopy), and near and far infrared data (imaging) in order to confirm the cluster nature of our candidate, to determine its dynamical state, and to give insight on its galaxy population evolution.
Results. Our candidate structure appears to be a massive ![]() dynamically young cluster with an atypically high X-ray temperature as compared to its X-ray luminosity. It exhibits a significant percentage (
dynamically young cluster with an atypically high X-ray temperature as compared to its X-ray luminosity. It exhibits a significant percentage (![]() 90%) of galaxies that are also detected in the 24
90%) of galaxies that are also detected in the 24 ![]() m band.
m band.
Conclusions. The cluster RXJ1257.2+4738 appears to be still in the process of collapsing. Its relatively high temperature is probably the consequence of significant energy input into the intracluster medium besides the regular gravitational infall contribution. A significant part of its galaxies are red objects that are probably dusty with on-going star formation.
Key words: galaxies: clusters: individual: RX J1257.2+4738 - galaxies: clusters: general - Galaxy: evolution
1 Introduction
It is becoming increasingly clear that the redshift range between
![]() 0.8 and 1.0 is particularly interesting for comparing star
formation histories of galaxies in clusters and in the field, as well as
studying the relationship of galaxy infall and heating of the intracluster
medium (ICM, e.g. Marcillac et al. 2007; Gilbank et al. 2008; Kocevski et al. 2009).
0.8 and 1.0 is particularly interesting for comparing star
formation histories of galaxies in clusters and in the field, as well as
studying the relationship of galaxy infall and heating of the intracluster
medium (ICM, e.g. Marcillac et al. 2007; Gilbank et al. 2008; Kocevski et al. 2009).
On the observational side, we might expect selection effects to favor
finding the most X-ray luminous
clusters when searching for clusters at high redshift. This is not the
case, however. For example, the compilation by Ota et al. (2006) shows
that 50% of the cluster sample between z = 0.3 and 0.56 have a
bolometric X-ray luminosity (
![]() )
greater than 1045 erg s-1 compared to only 20% of the sample above z = 1 (Fassbender 2008; Kocevski et al. 2009). These X-ray luminosities suggest that beyond z=1, clusters are growing, but have not reached their peak X-ray luminosity.
)
greater than 1045 erg s-1 compared to only 20% of the sample above z = 1 (Fassbender 2008; Kocevski et al. 2009). These X-ray luminosities suggest that beyond z=1, clusters are growing, but have not reached their peak X-ray luminosity.
In comparison, we estimate the free fall times for clusters (with a typical radius of 1 Mpc and masses between
![]() )
of the order of 1-2 Gyr (Sarazin 1986).
The elapsed time between z = 2
and z = 1 is about 2.6 Gyrs. Thus, at redshift range near
)
of the order of 1-2 Gyr (Sarazin 1986).
The elapsed time between z = 2
and z = 1 is about 2.6 Gyrs. Thus, at redshift range near ![]() 1 we can expect mainly to find clusters of
1 we can expect mainly to find clusters of
![]() that have just completed their initial infall (see Sadeh & Rephaeli 2008, and references therein).
that have just completed their initial infall (see Sadeh & Rephaeli 2008, and references therein).
Since X-ray detectable clusters near z = 1 are probably just forming large enough systems to become detectable, a study of the relationship between the galaxy population and the X-ray emission is particularly instructive for refining models of both large scale structure evolution and galaxy evolution. See Ettori et al. (2004b), Andreon (2006), Ota et al. (2006), for comprehensive studies of X-ray detected clusters and cluster evolution, and Cooper et al. (2008), Yan et al. (2008) for recent studies on galaxy formation and evolution related to clusters of galaxies at
![]() .
.
In the process of our search for moderately distant (i.e., ![]() )
clusters of galaxies that are detectable via their X-ray emission (Adami et al. 2000; Romer et al. 2000; Ulmer et al. 2005; Adami et al. 2007), we report here the discovery of a cluster with z = 0.866, RX J1257.2+4738 (hereafter for brevity referred to as RX J1257). The
cluster was first detected in X-rays in the ROSAT data archive, and the i'-band and Ks-band follow-up found a concentration of red galaxies that could be explained by the existence of a cluster with
)
clusters of galaxies that are detectable via their X-ray emission (Adami et al. 2000; Romer et al. 2000; Ulmer et al. 2005; Adami et al. 2007), we report here the discovery of a cluster with z = 0.866, RX J1257.2+4738 (hereafter for brevity referred to as RX J1257). The
cluster was first detected in X-rays in the ROSAT data archive, and the i'-band and Ks-band follow-up found a concentration of red galaxies that could be explained by the existence of a cluster with ![]() .
.
This cluster is particularly interesting because it contains several red
galaxies with [OII] 3727 emission as well as several others that are
detected both in the Spitzer MIPS 24 ![]() m and Spitzer IRAC bands. Without
the detected emission lines or the MIPS emission, these red galaxies
might have been characterized as early type galaxies, or red-dead
galaxies (Elbaz et al. 2007). The emission lines imply young galaxies
undergoing star formation and the high MIPS flux implies dusty late type
galaxies with ongoing star formation. We report here a detailed study
based on extensive
observations including Chandra, XMM-Newton, Spitzer, Gemini, Subaru, and
ARC. Also, as a by-product, we found candidates for lensed (and hence
magnified) background galaxies or AGNs that are at least at z > 3, and
could be at redshifts as high as 10. These will be presented in a
separate later paper. A preliminary version of the results reported here
were given by Ulmer et al. (2008).
m and Spitzer IRAC bands. Without
the detected emission lines or the MIPS emission, these red galaxies
might have been characterized as early type galaxies, or red-dead
galaxies (Elbaz et al. 2007). The emission lines imply young galaxies
undergoing star formation and the high MIPS flux implies dusty late type
galaxies with ongoing star formation. We report here a detailed study
based on extensive
observations including Chandra, XMM-Newton, Spitzer, Gemini, Subaru, and
ARC. Also, as a by-product, we found candidates for lensed (and hence
magnified) background galaxies or AGNs that are at least at z > 3, and
could be at redshifts as high as 10. These will be presented in a
separate later paper. A preliminary version of the results reported here
were given by Ulmer et al. (2008).
Throughout, we assume a concordant ![]() CDM cosmology with H0=71 km s-1 Mpc-1,
CDM cosmology with H0=71 km s-1 Mpc-1,
![]() ,
,
![]() ,
from which we compute the angular scale as 7.72 kpc/arcsec, a luminosity distance (
,
from which we compute the angular scale as 7.72 kpc/arcsec, a luminosity distance (
![]() Mpc and an angular distance (
Mpc and an angular distance (
![]() Mpc (Wright 2006).
Mpc (Wright 2006).
2 Observations, analysis and results
2.1 X-rays
The net Chandra exposure time was 37 ksec in very faint mode with ACIS-S3 (back illuminated chip) on July 24, 2007.
The XMM-Newton net exposure time, after high background filtering was 16 ks (11 and 5 ks for each usable exposure). The nominal exposure time (83 ks allocated) was heavily polluted by flares. The observations were made with the Thin 1 filter in Prime full window on May 24th through 26th, 2007.
2.1.1 Chandra data processing
The data were reduced with the CIAO version
3.0.1![]() following the Standard
Data Processing, producing new level 1 and 2 event files.
following the Standard
Data Processing, producing new level 1 and 2 event files.
We further filtered the level 2 event file, keeping only ASCA grades 0, 2, 3, 4 and 6, and restricted our data reduction and analysis to the back-illuminated chip, ACIS-S3. We checked that no afterglow was present and applied the good time intervals (GTI) supplied by the pipeline. We then checked for flares in the light-curve in the [10-12 keV] band. No flares were detected.
2.1.2 XMM-Newton data processing
The XMM-Newton data were so badly contaminated with flare events, that in addition to the standard processing tools, visual inspection of the overall count rate was needed as well in order to select only good data.
RX J1257 was observed in standard full frame mode with the ``thin'' filter with the two EPIC MOS1 and MOS2 and the PN detectors. The basic data processing (the ``pipeline'' removal of bad pixels, electronic noise and correction for charge transfer losses) was done with package SAS V5.3, thus creating calibrated event files for each detector.
For the MOS1 and MOS2 cameras, following the standard procedure, we have
discarded the events with FLAG ![]() and PATTERN > 12; for the PN, we have
restricted the analysis to the events with PATTERN
and PATTERN > 12; for the PN, we have
restricted the analysis to the events with PATTERN ![]() 4 and Flag = 0.
4 and Flag = 0.
With the cleaned event files, we have created the redistribution matrix file (RMF) and ancillary response file (ARF) with the SAS tasks rmfgen and arfgen for each camera and for each region that we have analyzed.
2.1.3 Imaging
We detect the diffuse emission of the cluster both in Chandra and XMM-Newton observations. If we model the XMM-Newton emission with an ellipse it has a semi
major axis of 1.2 arcmin and a semi-minor axis of 1.0 arcmin (556 kpc and 463 kpc at z = 0.866). The major axis runs along the E-W direction and the
cluster is centered at 12h 57m 12.2s, +47![]() 38' 06.5'' (J2000).
A point source we detected with Chandra appears embedded inside the
diffuse emission. We will discuss this source in Sects. 2.1.4 and 3.2.1 below.
38' 06.5'' (J2000).
A point source we detected with Chandra appears embedded inside the
diffuse emission. We will discuss this source in Sects. 2.1.4 and 3.2.1 below.
The X-ray emission is statically significant. The count rate of the Chandra observation, inside the ellipse where the cluster spectrum is extracted (see below), is
![]() cnt/s/arcmin2 (where the point sources are already masked out). On the same CCD, we estimate the background count rate as
cnt/s/arcmin2 (where the point sources are already masked out). On the same CCD, we estimate the background count rate as
![]() cnt/s/arcmin2. Therefore, the net count rate of the cluster in the central
cnt/s/arcmin2. Therefore, the net count rate of the cluster in the central
![]() region is
region is
![]() cnt/s/arcmin2, or
cnt/s/arcmin2, or ![]() above zero. Combining all XMM observations (all detectors and exposures), we obtain for the same region (masking the point sources taking into account the larger XMM PSF) a net count rate of
above zero. Combining all XMM observations (all detectors and exposures), we obtain for the same region (masking the point sources taking into account the larger XMM PSF) a net count rate of
![]() cnt/s/arcmin2, well above
a null count rate.
cnt/s/arcmin2, well above
a null count rate.
We are dealing here with a densely populated field of active objects, which dominates the X-ray emission of the area. We therefore masked these point source contributions to determine the diffuse emission of the cluster. The ability to detect and verify the point-like nature of these objects was impossible to do using only XMM-Newton data due to a lack of angular resolution. We therefore used the Chandra data. The point source masks removed over 99% of the encircled point source flux and thus the remaining flux was point source contaminated at level well below statistical uncertainty in our derived best fit spectral shapes and overall luminosity.
For all the relevant masked X-ray point sources, we found optical counter parts
that were bright enough to apply LePhare![]() .
For those objects classified as galaxies, we estimated the probability
that they
belong to belong to the cluster based on
the probability distribution function of the photometric redshifts
(hereafter the PDF). We determined the PDFs with the LePhare
software. The PDF gives the
probability for an object to be at a given redshift. The probability for
an object to be in a redshift interval is therefore obtained by
integration over this interval and normalization to the total
probability. We give below the list of the prominent X-ray point
sources, the probability that they are in the cluster redshift interval,
and the LePhare spectral classification.
.
For those objects classified as galaxies, we estimated the probability
that they
belong to belong to the cluster based on
the probability distribution function of the photometric redshifts
(hereafter the PDF). We determined the PDFs with the LePhare
software. The PDF gives the
probability for an object to be at a given redshift. The probability for
an object to be in a redshift interval is therefore obtained by
integration over this interval and normalization to the total
probability. We give below the list of the prominent X-ray point
sources, the probability that they are in the cluster redshift interval,
and the LePhare spectral classification.
The main point sources showing up both in Chandra and XMM-Newton data are:
- -
- (
 ,
,
 )
associated
with a bright galaxy. The probability of
this bright X-ray object to be in the [0.82, 0.90] redshift interval (potentially
a cluster member) is lower than 0.2%. This is
probably a late type active galaxy (type 19 from the
LePhare spectral data base) equivalent to a starburst;
)
associated
with a bright galaxy. The probability of
this bright X-ray object to be in the [0.82, 0.90] redshift interval (potentially
a cluster member) is lower than 0.2%. This is
probably a late type active galaxy (type 19 from the
LePhare spectral data base) equivalent to a starburst;
- -
- (
 ,
,
 )
associated
with a galaxy. The probability of
this object to be in the [0.82,0.90] redshift interval is lower than 0.4%.
This is probably a very active object, LePhare gives a better
)
associated
with a galaxy. The probability of
this object to be in the [0.82,0.90] redshift interval is lower than 0.4%.
This is probably a very active object, LePhare gives a better  with a QSO template than with a galaxy template;
- -
- (
,
 )
associated
with a blend of 3 objects within a 2
)
associated
with a blend of 3 objects within a 2
 long region.
This object is discussed in detail in Sect. 3.3;
long region.
This object is discussed in detail in Sect. 3.3;
- -
- (
 ,
,
 )
associated
with an active galaxy at z=0.662 from our Gemini spectroscopic
catalog. This galaxy exhibits [OII] and strong [OIII] lines, as well as
broad H
)
associated
with an active galaxy at z=0.662 from our Gemini spectroscopic
catalog. This galaxy exhibits [OII] and strong [OIII] lines, as well as
broad H and H
and H emission, characteristic of an active object;
- -
- (
 ,
,
 )
which is probably a
local star (not in the Simbad data base), since LePhare gives the best
with a star template. Using the probability
distribution function given by a galaxy template, the probability that
the object's redshift is in the [0.82, 0.90] redshift interval is lower
than 9%;
)
which is probably a
local star (not in the Simbad data base), since LePhare gives the best
with a star template. Using the probability
distribution function given by a galaxy template, the probability that
the object's redshift is in the [0.82, 0.90] redshift interval is lower
than 9%;
- -
- (
 ,
,
 )
associated with the
GMOS guiding object (i' SDSS
)
associated with the
GMOS guiding object (i' SDSS
 ). We observed its spectrum at
the Observatoire de Haute Provence 1.93 m telescope with the CARELEC
spectrograph. The spectrum is typical of a local old star;
). We observed its spectrum at
the Observatoire de Haute Provence 1.93 m telescope with the CARELEC
spectrograph. The spectrum is typical of a local old star;
- -
- (
 ,
,
 )
associated with a faint
probably high redshift object (from its PDF)
which only has a probability of less than 1.5% to be part of the
cluster;
)
associated with a faint
probably high redshift object (from its PDF)
which only has a probability of less than 1.5% to be part of the
cluster;
- -
- (
 ,
,
 )
associated with a faint
probably high redshift object (from its PDF)
which only has a probability of less than 0.1% of being a cluster
member;
)
associated with a faint
probably high redshift object (from its PDF)
which only has a probability of less than 0.1% of being a cluster
member;
- -
- (
 ,
,
 )
associated with a
relatively bright optical object. This object has a non-negligible
probability of being at the cluster redshift (12%) but since it is
located at a projected distance of over 1 Mpc from the cluster center,
it is probably not directly related with the structure itself. We cannot exclude,
however, that the galaxy is undergoing cluster infall.
)
associated with a
relatively bright optical object. This object has a non-negligible
probability of being at the cluster redshift (12%) but since it is
located at a projected distance of over 1 Mpc from the cluster center,
it is probably not directly related with the structure itself. We cannot exclude,
however, that the galaxy is undergoing cluster infall.
2.1.4 X-ray spectroscopy of the diffuse source
The background spectra were extracted from the same observations, on the same CCD chip, from a region close to the cluster, free of point sources. In this way, we took into account any count rate anomaly in the background. The center of the background region is only about 3.5 arcmin from the source, making the vignetting effect (for the cosmic X-ray background term) negligible. The redistribution and ancillary files (RMF and ARF) were created with the SAS tasks rmfgen and arfgen for each exposure, taking into account the extended nature of the source.
We have fit simultaneously spectra from the two PN exposures with the
MEKAL spectrum model of a thermal plasma. The galactic neutral hydrogen
along the line of sight was taken into account with the ``phabs''
photoelectric absorption model of Balucinska-Church & McCammon
(1992). The hydrogen column density, ![]() ,
was fixed to the
galactic value given by the Leiden/Argentine/Bonn (LAB) Survey of
Galactic HI (Kalberla et al. 2005);
,
was fixed to the
galactic value given by the Leiden/Argentine/Bonn (LAB) Survey of
Galactic HI (Kalberla et al. 2005);
![]() cm-2. We have also fixed the metal abundance to
cm-2. We have also fixed the metal abundance to
![]() and the redshift to z = 0.866 (see the
optical spectroscopy section). In order to minimize any discrepancy between Chandra and XMM-Newton at low and high energies, we limited the spectral fit to the 0.7-7.0 keV band.
and the redshift to z = 0.866 (see the
optical spectroscopy section). In order to minimize any discrepancy between Chandra and XMM-Newton at low and high energies, we limited the spectral fit to the 0.7-7.0 keV band.
Since the X-ray field in the direction of the cluster is heavily contaminated by X-ray point sources, it is useful to archive the masking out of these sources as shown in Fig. 1. We show the resulting best fit ![]() model in Fig. 2 based on the assumption that the cluster has an intrinsically smooth elliptical surface brightness distribution. We also show in Fig. 2 the 50% and 90% encircled energy radii to demonstrate that the X-ray emission is clearly diffuse. The assumption of a symmetric
model in Fig. 2 based on the assumption that the cluster has an intrinsically smooth elliptical surface brightness distribution. We also show in Fig. 2 the 50% and 90% encircled energy radii to demonstrate that the X-ray emission is clearly diffuse. The assumption of a symmetric ![]() model is only necessary for extracting the spectrum and was not used to determine the true shape
of the X-ray emission. A detailed discussion of the nature of the inferences based on the shape of the emission is given below. We conclude, though, that we have have indeed detected diffuse emission. The results of the spectral fitting are given in Table 1.
model is only necessary for extracting the spectrum and was not used to determine the true shape
of the X-ray emission. A detailed discussion of the nature of the inferences based on the shape of the emission is given below. We conclude, though, that we have have indeed detected diffuse emission. The results of the spectral fitting are given in Table 1.
 |
Figure 1:
X-ray imaging of Cl 1257 in the
0.5-5.0 keV band. a) Adaptively smoothed ACIS-S image with a minimum
signal-to-noise ratio of 3 per smooth beam done with the COAI 3.4
csmooth task; b) ACIS-S image smoothed with a fixed width Gaussian
(kernel radius of 10 arcsec); c) best-fit 2D |
| Open with DEXTER | |
 |
Figure 2:
Radial surface brightness profile best fit |
| Open with DEXTER | |
Table 1: Summary of XMM-Newton Spectral Analysis.
For future reference in the text, we use the spectral fit and
the formula from Hilton et al. (2007) that is based on
the temperature of the ICM, to derive
![]() Mpc or 2.3 arcmin,
where
Mpc or 2.3 arcmin,
where ![]() is the virial radius of the cluster.
is the virial radius of the cluster.
Given the relatively low number of photons included in
the spectrum (![]() 1250 counts including background), the spectrum
alone does not allow us to discriminate at a statistically significant
level between a thermal and power law spectrum that might be expected
from an AGN.
1250 counts including background), the spectrum
alone does not allow us to discriminate at a statistically significant
level between a thermal and power law spectrum that might be expected
from an AGN.
2.2 Visible, NIR and IR data
In order to determine the nature of the galaxies in the cluster as well as to measure the redshift of the cluster, we obtained visible, near IR and IR observations. We summarize the observations and the results of those observations below.
2.2.1 Spitzer data reduction
Spitzer (Werner et al. 2004) images obtained with the Infrared Array
Camera (IRAC Fazio et al. 2004) were obtained on 2006 Dec
29. The observation consisted of 100-s integrations and 20
dithers giving a net exposure of 2000 s in each of the four
channels centered at 3.6, 4.5, 5.8, and 8 ![]() m and covering a
m and covering a
![]()
![]() field. A deep image at 24
field. A deep image at 24 ![]() m was made
on 2007 Jun. 02 with the Multiband Imaging Photometer for
Spitzer (MIPS Rieke et al. 2004) using 30-s integrations
with a total exposure time of 9050 s. The calibrated mosaic images from the standard
Spitzer pipeline showed satisfactory removal of instrumental
artifacts and were sufficiently clean for the IRAC data analysis.
However, the MIPS 24
m was made
on 2007 Jun. 02 with the Multiband Imaging Photometer for
Spitzer (MIPS Rieke et al. 2004) using 30-s integrations
with a total exposure time of 9050 s. The calibrated mosaic images from the standard
Spitzer pipeline showed satisfactory removal of instrumental
artifacts and were sufficiently clean for the IRAC data analysis.
However, the MIPS 24 ![]() m pipeline mosaic exhibited artifacts and
gradients, which were significantly reduced through a zodiacal
light subtraction, a self-calibrating flat, and an improved overlap
correction algorithm.
Source fluxes were obtained from these mosaic images
with SExtractor (Bertin & Arnouts 1996) aperture photometry.
m pipeline mosaic exhibited artifacts and
gradients, which were significantly reduced through a zodiacal
light subtraction, a self-calibrating flat, and an improved overlap
correction algorithm.
Source fluxes were obtained from these mosaic images
with SExtractor (Bertin & Arnouts 1996) aperture photometry.
The original units of the Spitzer images (MJy/sr) were translated to Jy
for detected objects taking into account the pixel size to which these
images were rebinned (
![]() arcsec2)
and the general directions given in
http://ssc.spitzer.caltech.edu/
arcsec2)
and the general directions given in
http://ssc.spitzer.caltech.edu/![]() .
.
2.2.2 Gemini spectroscopy and imaging
The measurement of redshifts in a ![]() galaxy structure required
spectroscopic observations of galaxies as faint as
galaxy structure required
spectroscopic observations of galaxies as faint as ![]() .
In order
to achieve this goal, we acquired 3 Gemini north GMOS observations
(GN-2005A-Q-9, GN-2006A-Q-4, and GN-2006B-Q-38). We measured 45
redshifts of galaxies with magnitudes
between i'=20 and 22.6 and
exposure times varying between 3 and 4 h. At the same time, we took
advantage of the pre-image observing to acquire 2 deep optical
images of this cluster in the i' and z' bands. The completeness
limit of these images was close to
.
In order
to achieve this goal, we acquired 3 Gemini north GMOS observations
(GN-2005A-Q-9, GN-2006A-Q-4, and GN-2006B-Q-38). We measured 45
redshifts of galaxies with magnitudes
between i'=20 and 22.6 and
exposure times varying between 3 and 4 h. At the same time, we took
advantage of the pre-image observing to acquire 2 deep optical
images of this cluster in the i' and z' bands. The completeness
limit of these images was close to ![]() and
and
![]() as shown
in Fig. 4 (together with the completeness histograms in the Jand Ks bands for comparison).
as shown
in Fig. 4 (together with the completeness histograms in the Jand Ks bands for comparison).
We obtained images in the i' band under photometric
conditions. In order to assess the quality of these magnitudes, we
compared our values with the SDSS estimates. SDSS images cover the
same area with the same filters and are much less deep
than our data. However, the brightest objects of our field are also
detected in SDSS images. Based on 51 objects in common, we computed the mean
value of the difference between SDSS i' band magnitudes and our
estimates, and found a good agreement:
![]() Images in the z' band were observed under non-photometric
conditions. We therefore used the SDSS magnitudes in order to
rescale our own measurements with 45 objects in common. The resulting
dispersion between SDSS and our estimates is
Images in the z' band were observed under non-photometric
conditions. We therefore used the SDSS magnitudes in order to
rescale our own measurements with 45 objects in common. The resulting
dispersion between SDSS and our estimates is ![]() 0.21 mag.
0.21 mag.
We show in Fig. 3 the color magnitude relation based on the i' and z' data. Note that most if not all the scatter in the i'-z' direction is attributable to the dispersion in the derived values of z'. The cluster being at ![]() ,
the 4000 Å break is included
in the i' filter and located just before the z' filter. We also
superpose in Fig. 3 the galaxies inside and outside the
z=[0.850, 0.874] range. Figure 3 shows a possible (given the
dispersion in z') concentration close to
,
the 4000 Å break is included
in the i' filter and located just before the z' filter. We also
superpose in Fig. 3 the galaxies inside and outside the
z=[0.850, 0.874] range. Figure 3 shows a possible (given the
dispersion in z') concentration close to
![]() (the red
diamonds in Fig. 3).
(the red
diamonds in Fig. 3).
We will argue in the following that our cluster is a dynamically young
structure, and thus that many of the galaxies have probably not turned
into ellipticals or S0s. The average color of i'-z'=0.6 that we found is
consistent with those of early spirals at z= 0.8 based on Fukugita et al. (1995) who predicted a color of ![]() 0.6 for these objects.
0.6 for these objects.
Figure 3 also exhibits a prominent concentration of bright and
probably nearby galaxies with
![]() .
We retrieved from the NED
database all the redshifts in a 1 deg2 region centered on the cluster
position.
The histogram of these redshifts shows two concentrations around
.
We retrieved from the NED
database all the redshifts in a 1 deg2 region centered on the cluster
position.
The histogram of these redshifts shows two concentrations around
![]() and
and ![]() .
Since these concentrations are present over
the 1 deg2 field of view, we suggest that there are two foreground
galaxy filaments or sheets. In this regard, Fukugita et al. (1995)
predict
.
Since these concentrations are present over
the 1 deg2 field of view, we suggest that there are two foreground
galaxy filaments or sheets. In this regard, Fukugita et al. (1995)
predict
![]() for early galaxy types at these (both
for early galaxy types at these (both ![]() 0.03 and
0.03 and ![]() 0.15) redshifts, which implies these filaments or
sheets are populated by relatively evolved systems.
0.15) redshifts, which implies these filaments or
sheets are populated by relatively evolved systems.
 |
Figure 3:
The color magnitude relation computed from i' and z'. The galaxies with spectroscopically determined redshifts that place them in the cluster (
|
| Open with DEXTER | |
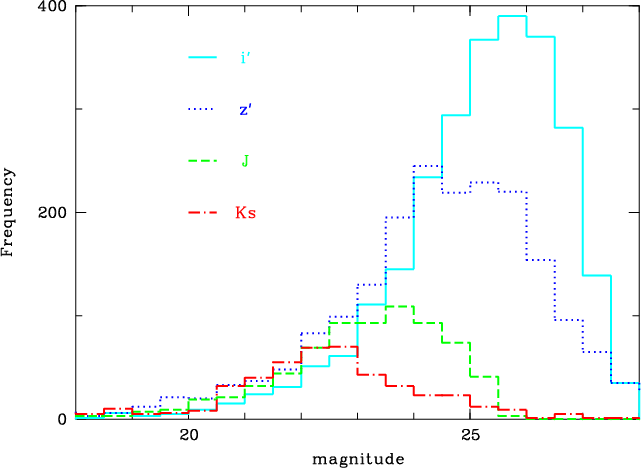 |
Figure 4: Histograms showing the completeness levels for the i', z', J, and Ks bands. |
| Open with DEXTER | |
2.2.3 Near IR observations
We also obtained near infrared data (J and Ks bands) in order to fill the gap between the i' and z' Gemini bands and the Spitzer infrared data.
A J band Subaru MOIRCS image was taken with a 40 min exposure in 2007. Data were reduced with the standard MOIRCS pipeline and provided a catalog complete down to ![]() (see Fig. 4).
(see Fig. 4).
We also observed during 2 h in the Ks band a subfield of the RX J1257 area at the 3.5 m APO telescope with the GRIM camera in 2000. This provided a catalog complete up to
![]() (see Fig. 4) in a smaller area (see Fig. 5).
(see Fig. 4) in a smaller area (see Fig. 5).
2.2.4 Catalog extraction
The angular resolution of our images ranged from a few tenths of an arcsec (for the i' GMOS ![]()
![]() image) to a few arcsec (for the IRAC and MIPS images). It is therefore impossible simply to extract object catalogs independently from all these images and to correlate these positions because of source confusion. We therefore chose to align and rebin to the same pixel size (0.15 arcsec) all our images using the Terapix tools (http://terapix.iap.fr/) and the standard procedure developed for the CFHTLS fields (McCracken et al. 2008). We used the weight maps for each band to produce two areas: one being the common area of all images and the other being the common area of all images except
the Ks image (which is significantly smaller than all the other
images). This is illustrated in Fig. 5.
image) to a few arcsec (for the IRAC and MIPS images). It is therefore impossible simply to extract object catalogs independently from all these images and to correlate these positions because of source confusion. We therefore chose to align and rebin to the same pixel size (0.15 arcsec) all our images using the Terapix tools (http://terapix.iap.fr/) and the standard procedure developed for the CFHTLS fields (McCracken et al. 2008). We used the weight maps for each band to produce two areas: one being the common area of all images and the other being the common area of all images except
the Ks image (which is significantly smaller than all the other
images). This is illustrated in Fig. 5.
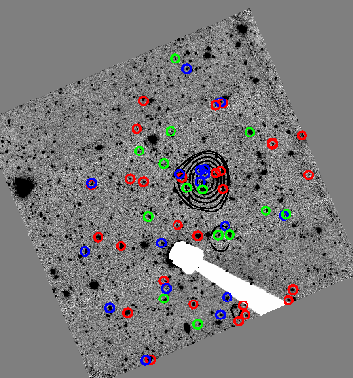 |
Figure 5:
GMOS |
| Open with DEXTER | |
We then extracted an object catalog from these images with the SExtractor package, in double-image mode, with a detection threshold of 1.1 and a minimum number of pixels (above this threshold) of 3.
This provided an i', z', J, Ks, 3.6 ![]() m, 4.5
m, 4.5 ![]() m, 5.8
m, 5.8 ![]() m, 8.0
m, 8.0 ![]() m, and
24
m, and
24 ![]() m catalog.
m catalog.
2.2.5 Photometric redshift computations
We have computed photometric redshifts with the LePhare package. A full description of this tool is given in Ilbert et al. (2006) and in the LePhare web page, but here are the salient points. LePhare is based on a template-fitting procedure. We used templates from Polletta et al. (2007) and star-forming templates from Bruzual & Charlot (2003). The zero-point calibration has been done on the basis of the spectroscopic catalog with an iterative procedure described in Sect. 4.1 of Ilbert et al. (2006), by comparing the predicted magnitudes from the best fit template and the observed magnitudes.
LePhare required shifts of 0.07 in i', -0.24 in z' (data observed
under non-photometric conditions), 0.22 in J, -0.44 in Ks (data observed
under non photometric conditions), 0.135 at 3.6 ![]() m, 0.08 at
4.5
m, 0.08 at
4.5 ![]() m, 0.28 at 5.8
m, 0.28 at 5.8 ![]() m, 0.22 at 8.0
m, 0.22 at 8.0 ![]() m, and 0.0 at 24
m, and 0.0 at 24 ![]() m.
m.
The relatively high values of these shifts can be explained in part by the correlation between the shift amplitude and the photometric quality of the night.
The shift to the photometery can also be explained in part by the nature of the spectral catalog we used which is dominated by galaxies in the cluster RX J1257. However, the spectral shapes of cluster galaxies are not well characterized in the only available LePhare template library which contains only field galaxies templates. Experience has shown that comparing field templates to cluster galaxies usually leads to high shift values. Thus, for example, similar shifts of 0.15 were applied to the Coma cluster photometric data by Adami et al. (2008).
A set of fit parameters was then produced and we are mainly interested in multicolor type (based on a classification in a 9 magnitude-color space), redshift, and PDF estimates. We first assess the quality of the photometrically determined z (![]() ;
photo-z) by comparison with the spectroscopically determined z (
;
photo-z) by comparison with the spectroscopically determined z (![]() ), assuming that the uncertainties in
), assuming that the uncertainties in ![]() are negligible. If
are negligible. If
![]() ,
we can estimate the redshift accuracy from
,
we can estimate the redshift accuracy from
![]() using the normalized median absolute deviation (NMAD Hoaglin et al. 1983) defined as 1.48
using the normalized median absolute deviation (NMAD Hoaglin et al. 1983) defined as 1.48 ![]() median
median
![]() .
This dispersion estimate is robust with respect to catastrophic errors (i.e. objects with
.
This dispersion estimate is robust with respect to catastrophic errors (i.e. objects with
![]() ). The percentage of catastrophic errors is denoted by
). The percentage of catastrophic errors is denoted by ![]() .
.
We show in Fig. 6 the relation between the estimated
photometric redshift and the spectroscopic value of the redshift.
Beyond the general agreement, we see that the photometric
redshift of several galaxies is not very well determined. Most of these
galaxies have several peaks in their PDFs (open symbols in
Fig. 6) and this shows the need to consider the PDF instead of
the best fit value of the photometric redshift.
![]() is
the median magnitude of the spectroscopic sample taken as reference. We
used 1/(1+z) weighting of the residuals to be consistent with previous
work such as Ilbert et al. (2006).
is
the median magnitude of the spectroscopic sample taken as reference. We
used 1/(1+z) weighting of the residuals to be consistent with previous
work such as Ilbert et al. (2006).
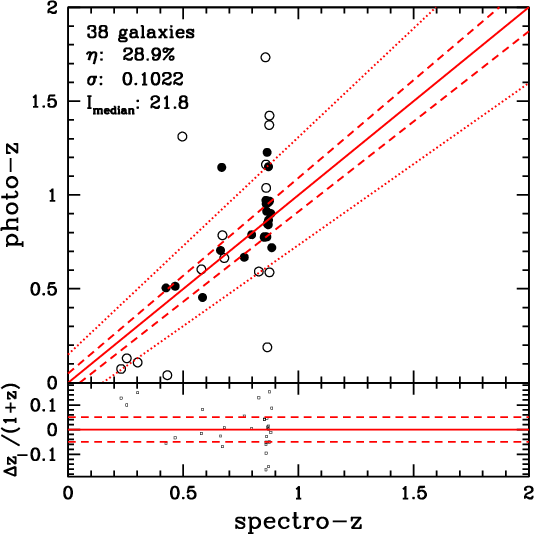 |
Figure 6: Spectroscopic versus photometric redshifts. Open symbols: multi-peak PDFs, where the redshift chosen is the one with highest probability; filled symbols: single-peak PDFs. See text. |
| Open with DEXTER | |
Based on the PDF, we computed the integrated probability for each galaxy to have a redshift inside a given interval. From the spectroscopic catalog, we determined that the optimal interval is z=[0.82, 0.90]. When predicting that a galaxy is within this interval on the basis of the PDF, our success rate is close to 80%. When predicting that a galaxy is outside this interval, our success rate is close to 65%.
We therefore extracted a candidate list of galaxies with a high probability of being part of the cluster by being included in the interval z = [0.82, 0.90]. We plot in Fig. 5 the position of these galaxies along with their template color type based on the fits of the SEDs with LePhare. We note that the X-ray centroid is within the contours (see also Fig. 12 discussed later in the text) of this concentration of galaxies.
red
3 Discussion
3.1 Identification as a cluster
The first evidence that RX J1257 is a massive cluster, is the strong
peak at
![]() seen in Fig. 7.
seen in Fig. 7.
Second, although there is a relatively uniform spatial distribution of
galaxies at the cluster redshift, there is also a significant concentration at
the putative cluster location as defined by the galaxy concentration contours
(see Fig. 5) and the X-ray emission (see Figs. 8 and 9).
Thus, this system is likely a cluster embedded in a larger filament or sheet
of galaxies, similar to the sheet of galaxies detected at ![]() 0.735 in the
CDFS (e.g. Adami et al. 2005).
0.735 in the
CDFS (e.g. Adami et al. 2005).
Third, we applied the SG (Serna & Gerbal 1996) method to our
redshift catalog. This hierarchical method allows substructures to be
extracted from a catalog containing positions, magnitudes, and
redshifts, based on the calculation of their binding energies. It
provides a robust velocity dispersion and a virial mass. The SG method
reveals the existence of
a group of 18 galaxies located at the candidate cluster center,
coincident with the X-ray emission, with a mass of
![]() ,
based on a velocity dispersion of 600 km s-1.
Within this group, we found two subgroups of 5 and 3 galaxies with
respective masses of
,
based on a velocity dispersion of 600 km s-1.
Within this group, we found two subgroups of 5 and 3 galaxies with
respective masses of ![]()
![]() (velocity dispersion of
289 km s-1) and
(velocity dispersion of
289 km s-1) and ![]()
![]() (velocity
dispersion of 255 km s-1). These masses from galaxy velocity
dispersion measurements are consistent with the inferred X-ray mass of
(velocity
dispersion of 255 km s-1). These masses from galaxy velocity
dispersion measurements are consistent with the inferred X-ray mass of
![]()
![]() ,
and are in the range to call RX J1257 a
massive cluster (e.g. Sarazin 1986).
,
and are in the range to call RX J1257 a
massive cluster (e.g. Sarazin 1986).
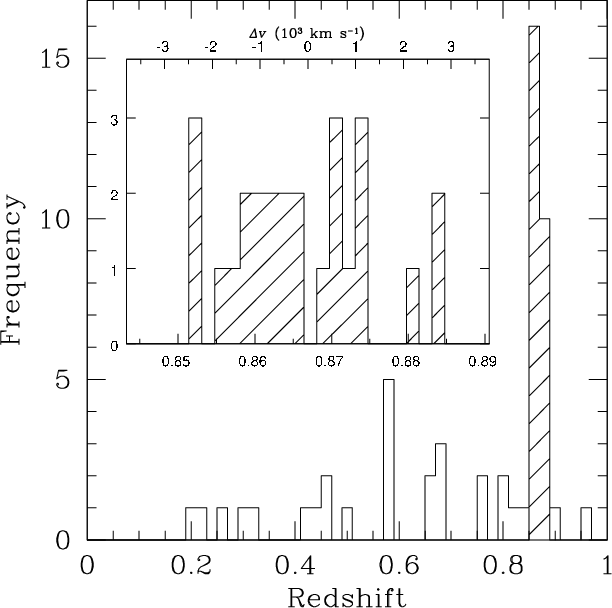 |
Figure 7: Histogram of the GMOS redshifts, with the region about 0.87 expanded in the insert. |
| Open with DEXTER | |
Fourth, the X-ray emission is clearly extended, as seen in Figs. 1 and 2 and is similar in size to the galaxy concentration shown in Fig. 5.
Fifth, assuming a redshift of 0.866, the projected size of the X-ray emission is about 0.5 Mpc, and its kT (3.6 keV) and inferred
![]() (
(
![]() erg s-1) are all consistent with being a massive cluster at 0.866 (see, e.g., Ettori et al. 2004a, and
Fig. 13).
erg s-1) are all consistent with being a massive cluster at 0.866 (see, e.g., Ettori et al. 2004a, and
Fig. 13).
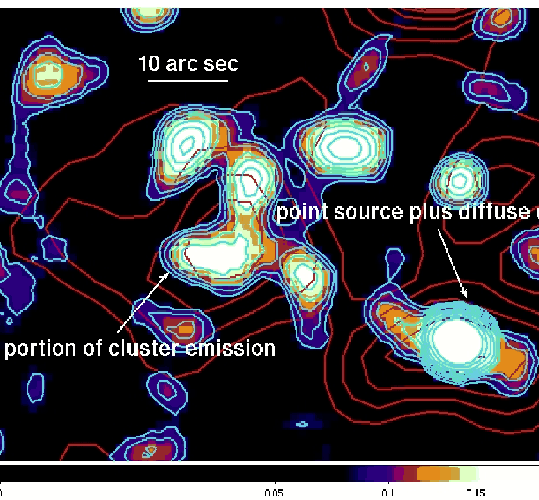 |
Figure 8: A 11 arcsec Gaussian smoothed Chandra image in the 0.3-2.0 keV range. The cyan contours are based on this Chandra image and are drawn to highlight the Chandra data. The red contours are based on the XMM-Newton 0.3-6 keV image (see Sect. 3.2.) and they coincide with those in green or yellow in Fig. 9. The text in the figure points to the two brightest regions in the Chandra image that are centered in XMM-Newton contours. |
| Open with DEXTER | |
3.2 Is RX J1257 bimodal?
The XMM-Newton data suggest the X-ray emission is bimodal, but the Chandra data show there is a point source located in the western portion of the X-ray emission. We show in Figs. 8 a smoothed (by a 11 arcsec radius Gaussian kernel) low energy (0.3-2.0 keV) Chandra image with XMM contours (red) superposed. There are clearly two centroids enclosed by the XMM-Newton contours (red in Fig. 8) and the west-most centroid has a round (point) source near the center. This point source is probably the major contribution to the western peak in the XMM-Newton contours associated with the cluster. Nevertheless, as can be seen in Fig. 8 it appears that diffuse emission surrounds this point source. If the point source were absent, the surrounding diffuse emission could be the origin of the second peak in the XMM-Newton contours. We conclude therefore, that there is still a centroid in the western X-ray contours that is possibly not due to the point source (the nature of which is discussed below), and that the X-ray emission associated with RX J1257 has bimodal characteristics.
This hypothesis of bi-modality fits well with our finding that the distribution of galaxy cluster members is also bimodal (based on the SG method) with the two subgroups also aligned in the E-W direction. That the western subgroup of galaxies lies outside the XMM-Newton contours may indicate the relatively low dynamical age of the cluster (see Fig. 9). This is confirmed by Fig. 5 where we see that late type galaxies are relatively numerous in RX J1257, being about half of the cluster population in the central area.
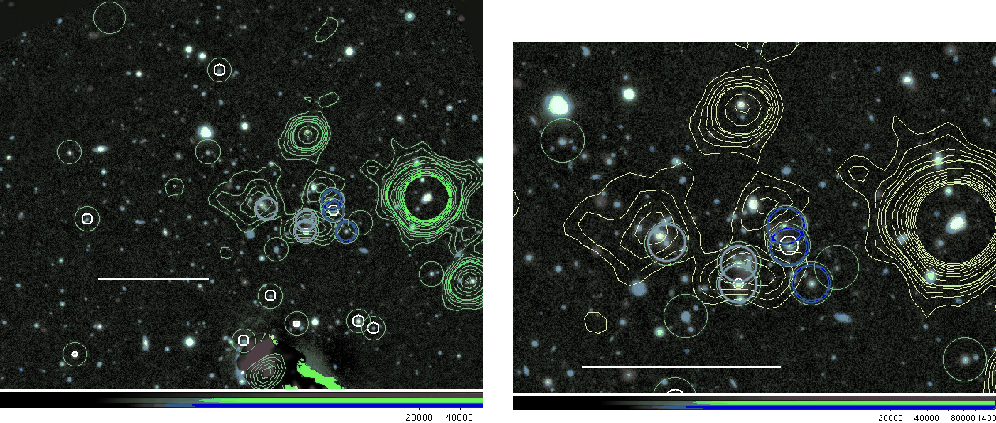 |
Figure 9: A color image based on Spitzer IRAC 3.6 m (R), Gemini z' (G) and Gemini i' (B) image. The XMM-Newton contours in the 0.3-6 keV interval are shown in green, left, and yellow/white, right (adjusted to separate the northern AGN from the cluster emission). The green circles show galaxies at the cluster redshift. The magenta and blue circles indicate galaxies in the two sub-groups detected by the SG (Serna & Gerbal 1996) method; only 3 of the 5 objects in the western sub-group are shown here. Big and small white circles indicate the presence or absence of [OII] emission: no white circles = no detectable [OII], small white circle (only two, one in the southeast corner of the image, the other just north of the guide star mask) = [OII] smaller than 2 times the noise, large white circles = [OII] stronger than 2 times the noise. The rightmost image is a blow up of the left one. North is up and East to the left; a concordant cosmology is assumed, thus 463 kpc = 1 arcmin (as depicted by the horizontal white bars in both images) at the redshift of RX J125712+4738.17 (z=0.866). |
| Open with DEXTER | |
3.2.1 Nature of the embedded point source
The point source shown in Fig. 10 and located at
![]() ,
,
![]() (from the Chandra data) could be associated
with an optical object located at the approximate coordinates
(from the Chandra data) could be associated
with an optical object located at the approximate coordinates
![]() ,
,
![]() .
However, due to the proximity in
projection of three objects, SExtractor provided only one detection. With this
caveat in mind, we estimate that the probability of this object to be a
cluster member is 8%
.
However, due to the proximity in
projection of three objects, SExtractor provided only one detection. With this
caveat in mind, we estimate that the probability of this object to be a
cluster member is 8%![]() . The
nature of this object (normal galaxy or active object) remains unclear,
however, because a galaxy template provides a better fit to the composite spectrum than a QSO template, but the X-ray flux is
. The
nature of this object (normal galaxy or active object) remains unclear,
however, because a galaxy template provides a better fit to the composite spectrum than a QSO template, but the X-ray flux is
![]() erg cm-2 s-1 which at the cluster distance means its
erg cm-2 s-1 which at the cluster distance means its
![]() erg s-1, typical of QSOs. The most conservative explanation, then, is that
this X-ray source is a chance alignment with the cluster and the derived
photo-z (and spectral classification) for the merged (by SExtractor) source
does not apply to the X-ray source.
erg s-1, typical of QSOs. The most conservative explanation, then, is that
this X-ray source is a chance alignment with the cluster and the derived
photo-z (and spectral classification) for the merged (by SExtractor) source
does not apply to the X-ray source.
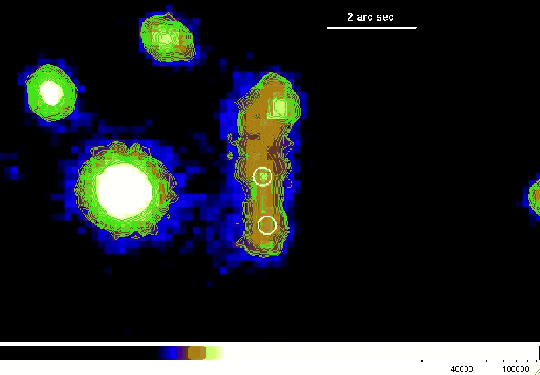 |
Figure 10: i'-band image of three blended galaxies that run from North to South in the image. The two lower most probable positions are marked by white circles. The lowest declination object was detected in the Chandra image with probably diffuse emission around it (see text). The next object to the North is most likely a MIPS source which is the 7th brightest MIPS object in the field. This region can be found in the northernmost of the two magenta circles that overlap in Fig. 9. North is up and East is to the left. |
| Open with DEXTER | |
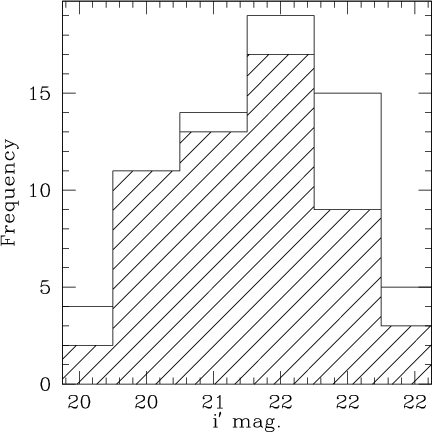 |
Figure 11: Histogram of the distribution of the magnitudes of the galaxies for which spectra were taken. The cross hatched area is for those galaxies for which redshifts were successfully derived. |
| Open with DEXTER | |
3.3 Characteristics of the cluster galaxies
3.3.1 Selection effects
In Fig. 11 we show the brightness distribution of the galaxies for which we attempted to determine redshifts. From this, it can be seem that we were successful a very large fraction of the time and that there was no initial choice that would have favored emission line galaxies. Also, it was possible to determine redshifts even when emission lines were not present (over 50% or the time). Thus, we conclude that the relatively large faction of emission line galaxies we found at the cluster redshift was not due to a selection effect, and we proceed in the following discussion based on this assumption.
3.3.2 Spectra
First, consider those galaxies with spectroscopically determined
redshifts within the putative cluster redshift range (0.850-0.874).
We find that about 45% (10/21) of the cluster galaxies are emission
line objects (cf. Fig. 9). These results, although based
on small number statistics, are consistent with the hypothesis that RX J1257
is relatively young and there has not been time for the cluster environment
to cause the galaxies to change from late type (star forming) to early type (passively evolving). In comparison,
in low z more mature clusters, ![]() 75% of galaxies can be classified as early type objects (e.g. Adami et al. 1998).
75% of galaxies can be classified as early type objects (e.g. Adami et al. 1998).
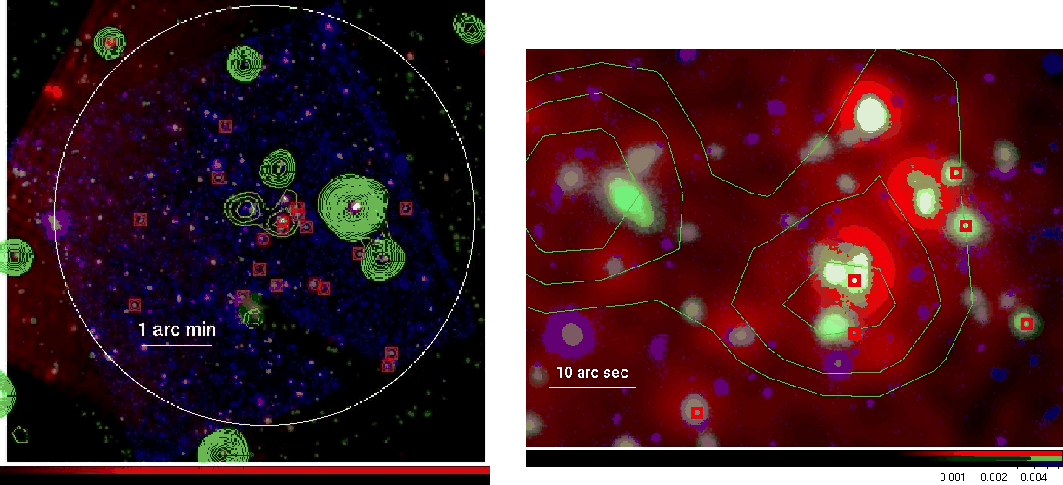 |
Figure 12:
Left: a MIPS 24 |
| Open with DEXTER | |
3.4 Cluster collapse
We suggest this cluster is just in the process of formation based on:
(a) the bimodal distribution of both the X-ray emission and the galaxy
population; (b) the fact that the majority of the spectroscopically
confirmed cluster members were detectable in the MIPS 24 ![]() m channel;
(c) the existence of cluster galaxy substructures based on the
Serna-Gerbal method; (d) the kT on the high side relative to the
predicted
m channel;
(c) the existence of cluster galaxy substructures based on the
Serna-Gerbal method; (d) the kT on the high side relative to the
predicted
![]() -kT relation line (the thin dotted line
in Fig. 13).
-kT relation line (the thin dotted line
in Fig. 13).
If there is some energy input prior to infall, this would produce a
higher kT versus
![]() than we would expect from
energy input from the infall alone. For example, the initial energy
injection in addition to gravitational infall comes from some other
process such as galaxy outflows or SN (see Babul et al. 2002; Jones et al. 2003; Bode et al. 2007).
Since we have found several late-type cluster member galaxies, this
suggests that galactic outflows have not dominated the heating of the RX
J1257 ICM, otherwise gas and dust loss should have made these galaxies
faint rather than bright 24
than we would expect from
energy input from the infall alone. For example, the initial energy
injection in addition to gravitational infall comes from some other
process such as galaxy outflows or SN (see Babul et al. 2002; Jones et al. 2003; Bode et al. 2007).
Since we have found several late-type cluster member galaxies, this
suggests that galactic outflows have not dominated the heating of the RX
J1257 ICM, otherwise gas and dust loss should have made these galaxies
faint rather than bright 24 ![]() m objects.
m objects.
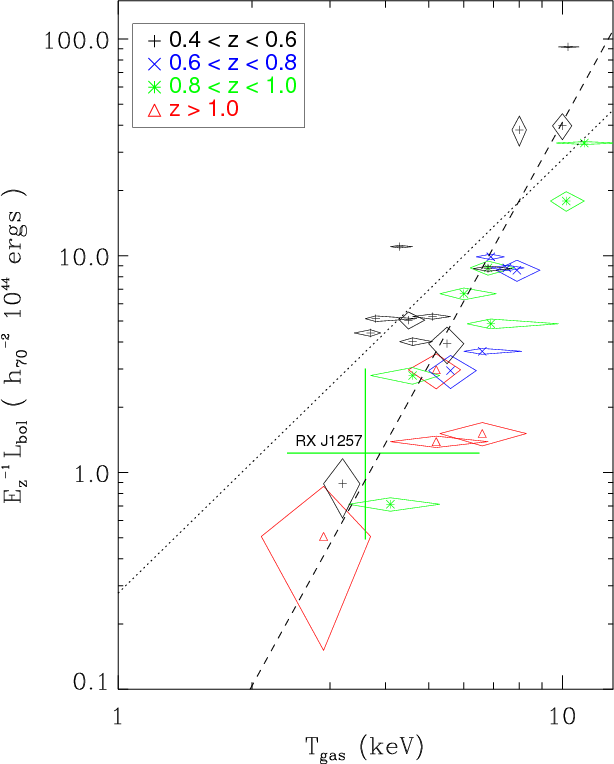 |
Figure 13: Based on Ettori et al. (2004a) Fig. 4, right upper panel, with the data point added for RX J1257. This is the L-T relation with correction by E(z). Dotted line: slope fixed to the predicted value of 2. Dashed line: slope free. See Ettori et al. (2004a) for further details. |
| Open with DEXTER | |
Another way to consider
Fig. 13 is to assume a lower than normal
![]() for a
given kT. Such a low
for a
given kT. Such a low
![]() is expected by
Ventimiglia et al. (2008), who carried out calculations that showed that clumpy,
not fully merged clusters will tend to have luminosities that fall below
the
is expected by
Ventimiglia et al. (2008), who carried out calculations that showed that clumpy,
not fully merged clusters will tend to have luminosities that fall below
the
![]() -kT relation for a given kT. Thus, the X-ray data
are consistent with our expectations that the cluster is in the process
of merging or collapsing and is not fully relaxed.
-kT relation for a given kT. Thus, the X-ray data
are consistent with our expectations that the cluster is in the process
of merging or collapsing and is not fully relaxed.
3.5 A comprehensive picture
The results presented here combined with previous work (references above) on clusters of galaxies lead to a scenario in which part of the red galaxies in high z clusters are red due to dust rather than being red and dead. The less massive the cluster, the younger it will be in terms of having not yet completed infall, compared to more massive clusters. A system such as RX J1257 should then, as we found here, have a high fraction of red dusty galaxies. These galaxies will become blue after dust ejection and then red again after having consumed all their gas.
4 Summary and conclusions
We have discovered a young massive cluster of galaxies RX J1257.2+4738, at z = 0.866. The cluster has a luminosity of about
![]() erg s-1, a kT of about 3.6 keV, and an estimated mass of
erg s-1, a kT of about 3.6 keV, and an estimated mass of
![]()
![]() .
.
The cluster RX J1257 is in the process of collapsing. At birth, there was possibly significant energy input to the intracluster medium besides infall which produced a cluster whose intracluster medium temperature is not the one expected for its luminosity. The MIPS 24 ![]() m detections plus [OII] 3727 emission line galaxies imply a high star formation rate in several of the cluster member galaxies.
m detections plus [OII] 3727 emission line galaxies imply a high star formation rate in several of the cluster member galaxies.
In agreement with Elbaz et al. (2007), we suggest that there should be an evolutionary sequence from red dusty galaxies in a cluster to blue galaxies and finally to red-dead galaxies.
Acknowledgements
The authors thank the referee for useful remarks. We are grateful to the CFHT and Terapix teams. We acknowledge financial support from CNES and PNG, CNRS/INSU, and from the CAPES/COFECUB French-Brazilian cooperation. G.B.L.N. acknowledges support from the CNPq and FAPESP. M.P.U. acknowledges the support of NASA grants GO7-8144X//NAS8-03060, GO7-8144X//NAS8-03060, and Agmt.# 1306461 NASA NMO710076.
We thank the groups and many individuals responsible for the successful launch and operation of Chandra, XMM-Newton, and Spitzer and for helping us set up our observations. We wish to thank Alberto Noriega-Crespo for assistance with the MIPS post pipeline data reduction. Last but not least, we thank Emeric Le Floc'h for useful discussions.
References
- Adami, C., Biviano, A., & Mazure, A. 1998, A&A, 331, 439 [NASA ADS] (In the text)
- Adami, C., Ulmer, M. P., Romer, A. K., et al. 2000, ApJS, 131, 391 [NASA ADS] [CrossRef] (In the text)
- Adami, C., Mazure, A., Ilbert, O., et al. 2005, A&A, 443, 805 [NASA ADS] [CrossRef] [EDP Sciences] (In the text)
- Adami, C., Ulmer, M. P., Durret, F., et al. 2007, A&A, 472, 373 [NASA ADS] [CrossRef] [EDP Sciences] (In the text)
- Adami, C., Ilbert, O., Pello, R., et al. 2008, A&A, 491, 681 [NASA ADS] [CrossRef] [EDP Sciences] (In the text)
- Andreon, S. 2006, MNRAS, 369, 969 [NASA ADS] [CrossRef] (In the text)
- Babul, A., Balogh, M. L., Lewis, G. F., & Poole, G. B. 2002, MNRAS, 330, 329 [NASA ADS] [CrossRef] (In the text)
- Balucinska-Church, M., & McCammon, D. 1992, ApJ, 400, 699 [NASA ADS] [CrossRef] (In the text)
- Bertin, E., & Arnouts, S. 1996, A&AS, 117, 393 [NASA ADS] [CrossRef] [EDP Sciences]
- Bode, P., Ostriker, J. P., Weller, J., & Shaw, L. 2007, ApJ, 663, 139 [NASA ADS] [CrossRef] (In the text)
- Bruzual, G., & Charlot, S. 2003, MNRAS, 344, 1000 [NASA ADS] [CrossRef] (In the text)
- Cooper, M. C., Newman, J. A., Weiner B. J., et al. 2008, MNRAS, 383, 1058 [NASA ADS] [CrossRef] (In the text)
- Davé, R., Oppenheimer B. D., & Sivanandam, S. 2008, MNRAS, 391, 110 [NASA ADS] [CrossRef]
- Elbaz, D., Daddi, E., Le Borgne, D., et al. 2007, A&A, 468, 33 [NASA ADS] [CrossRef] [EDP Sciences] (In the text)
- Ettori, S., Tozzi, P., Borgani, S., & Rosati, P. 2004a, A&A, 417, 13 [NASA ADS] [CrossRef] [EDP Sciences] (In the text)
- Ettori, S., Borgani, S., Moscardini, L., et al. 2004b, MNRAS, 354, 111 [NASA ADS] [CrossRef] (In the text)
- Fassbender, R. 2008, Ph.D. Thesis Ludwig-Maximilians-Universitaet Muenchen, [arXiv:astro-ph:0806.0861] (In the text)
- Fazio, G. G., Hora, J. L., Allen, L. E., et al. 2004, ApJS, 154, 10 [NASA ADS] [CrossRef]
- Fukugita, M., Shimasaku, K., & Ichikawa, T. 1995, PASP, 107, 945 [NASA ADS] [CrossRef] (In the text)
- Gilbank, D. G., Yee, H. K. C., Ellingson, E., et al. 2008, ApJ, 677, L89 [NASA ADS] [CrossRef] (In the text)
- Hilton, M., Collins, C. A., Stanford, S. A., et al. 2007, ApJ, 670, 1000 [NASA ADS] [CrossRef] (In the text)
- Hoaglin, D. C., Mosteller, F., & Tukey, J. W. 1983, Wiley Series in Probability and Mathematical Statistics, ed. D. C., Hoaglin, F. Mostellerj, & J. W. Tukey (New York: Wiley) (In the text)
- Ilbert, O., Arnouts, S., McCracken, H. J., et al. 2006, A&A, 457, 841 [NASA ADS] [CrossRef] [EDP Sciences] (In the text)
- Jones, L. R., Ponman, T. J., Horton, A., et al. 2003, MNRAS, 343, 627 [NASA ADS] [CrossRef] (In the text)
- Kalberla, P. M. W., Burton, W. B., Hartmann, D., et al. 2005, A&A, 440, 775 [NASA ADS] [CrossRef] [EDP Sciences] (In the text)
- Kocevski, D. D., Lubin L. M., Gal, R., et al. 2009, ApJ, 690, 295 [NASA ADS] [CrossRef] (In the text)
- Lumb, D. H., Warwick, R. S., Page, M., & De Luca, A. 2002, A&A, 389, 93 [NASA ADS] [CrossRef] [EDP Sciences]
- Loh, Y., Ellingson, E., Yee, H. K. C., et al. 2008, ApJ, 680, 214 [NASA ADS] [CrossRef]
- Marcillac, D., Rigby, J. R., Rieke, G. H., & Kelly D. M. 2007, ApJ, 654, 825 [NASA ADS] [CrossRef] (In the text)
- McCracken, H. J., Ilbert, O., Mellier, Y., et al. 2008, A&A, 479, 321 [NASA ADS] [CrossRef] [EDP Sciences] (In the text)
- Ota, N., Kitayama, T., Masai, K., & Mitsuda, K. 2006, ApJ, 640, 673 [NASA ADS] [CrossRef] (In the text)
- Polletta, M., Tajer, M., Maraschi, L., et al. 2007, ApJ, 663, 81 [NASA ADS] [CrossRef] (In the text)
- Rieke, G. H., Young, E. T., Engelbracht, C. W., et al. 2004, ApJS, 154, 25 [NASA ADS] [CrossRef] (In the text)
- Romer, A. K., Nichol, R. C., Holden, B. P., et al. 2000, ApJS, 126, 209 [NASA ADS] [CrossRef] (In the text)
- Sadeh, S., & Rephaeli, Y. 2008, MNRAS, 388, 1759 [NASA ADS] (In the text)
- Sarazin, C. L. 1986, Rev. Mod. Phys., 58, 1 [NASA ADS] [CrossRef] (In the text)
- Serna, A., & Gerbal, D. 1996, A&A, 309, 65 [NASA ADS] (In the text)
- Ulmer, M. P., Adami, C., Covone, G., et al. 2005, ApJ, 624, 124 [NASA ADS] [CrossRef] (In the text)
- Ulmer, M. P., Adami, C., Durret, F., et al. 2008, SF2A-2008, ed. C., Charbonnel, F., Combes, & R., Samadi, 385 (In the text)
- Ventimiglia, D. A., Voit, G. M., Donahue, M., & Ameglio, S. 2008, ApJ, 685, 118 [NASA ADS] [CrossRef] (In the text)
- Werner, M. W., Roellig, T. L., Low, F. J., et al. 2004, ApJS, 154, 1 [NASA ADS] [CrossRef]
- Wright, E. L. 2006, PASP, 118, 1711 [NASA ADS] [CrossRef] (In the text)
- Yan, R., Newman, J. A., Faber, S. M., et al. 2008, MNRAS, [arXiv:astro-ph:0805.0004] (In the text)
Footnotes
- ... 0.866
- Partly based on observations with Chandra which is operated by the Harvard-Smithsonian Center for Astrophysics under contract with NASA. Partly based on observations obtained at the Gemini Observatory which is operated by the Association of Universities for Research in Astronomy, Inc., under a cooperative agreement with the NSF on behalf of the Gemini partnership: the National Science Foundation (United States), the Science and Technology Facilities Council (United Kingdom), the National Research Council (Canada), CONICYT (Chile), the Australian Research Council (Australia), Ministerio da Ciencia e Tecnologia (Brazil) and SECYT (Argentina). Partly based on data collected at the Subaru Telescope, which is operated by the National Astronomical Observatory of Japan. Partly based on observations obtained with the Apache Point Observatory 3.5-m telescope, which is owned and operated by the Astrophysical Research Consortium (ARC). Partly based on observations made with the Spitzer Space Telescope, which is operated by the Jet Propulsion Laboratory, California Institute of Technology under a contract with NASA. Partly based on observations obtained with XMM-Newton, an ESA science mission with instruments and contributions directly funded by ESA Member States and the USA (NASA). Partly based on observations obtained at the Observatoire de Haute Provence (CNRS) with the 1.93-m telescope and the CARELEC instrument.
- ...
3.0.1
- http://asc.harvard.edu/ciao/
- ... LePhare
- Arnouts & Ilbert; www.oamp.fr/people/arnouts/LE_PHARE.html
- ...http://ssc.spitzer.caltech.edu/
- Magnitudes were then computed following the same directions and translated from the Vega system to the AB system for the IRAC bands with the numbers listed in ttp://spider.ipac.caltech.edu/staff/gillian/cal.html.
- ...%
- This was done by integrating the redshift probability distribution given by LePhare over the total redshift range. We then integrated over an estimated redshift range for the cluster of 0.8-0.9, and calculated the ratio of these two values. See Adami et al. (2008).
All Tables
Table 1: Summary of XMM-Newton Spectral Analysis.
All Figures
| |
Figure 1:
X-ray imaging of Cl 1257 in the
0.5-5.0 keV band. a) Adaptively smoothed ACIS-S image with a minimum
signal-to-noise ratio of 3 per smooth beam done with the COAI 3.4
csmooth task; b) ACIS-S image smoothed with a fixed width Gaussian
(kernel radius of 10 arcsec); c) best-fit 2D |
| Open with DEXTER | |
| In the text | |
| |
Figure 2:
Radial surface brightness profile best fit |
| Open with DEXTER | |
| In the text | |
| |
Figure 3:
The color magnitude relation computed from i' and z'. The galaxies with spectroscopically determined redshifts that place them in the cluster (
|
| Open with DEXTER | |
| In the text | |
| |
Figure 4: Histograms showing the completeness levels for the i', z', J, and Ks bands. |
| Open with DEXTER | |
| In the text | |
| |
Figure 5:
GMOS |
| Open with DEXTER | |
| In the text | |
| |
Figure 6: Spectroscopic versus photometric redshifts. Open symbols: multi-peak PDFs, where the redshift chosen is the one with highest probability; filled symbols: single-peak PDFs. See text. |
| Open with DEXTER | |
| In the text | |
| |
Figure 7: Histogram of the GMOS redshifts, with the region about 0.87 expanded in the insert. |
| Open with DEXTER | |
| In the text | |
| |
Figure 8: A 11 arcsec Gaussian smoothed Chandra image in the 0.3-2.0 keV range. The cyan contours are based on this Chandra image and are drawn to highlight the Chandra data. The red contours are based on the XMM-Newton 0.3-6 keV image (see Sect. 3.2.) and they coincide with those in green or yellow in Fig. 9. The text in the figure points to the two brightest regions in the Chandra image that are centered in XMM-Newton contours. |
| Open with DEXTER | |
| In the text | |
| |
Figure 9: A color image based on Spitzer IRAC 3.6 m (R), Gemini z' (G) and Gemini i' (B) image. The XMM-Newton contours in the 0.3-6 keV interval are shown in green, left, and yellow/white, right (adjusted to separate the northern AGN from the cluster emission). The green circles show galaxies at the cluster redshift. The magenta and blue circles indicate galaxies in the two sub-groups detected by the SG (Serna & Gerbal 1996) method; only 3 of the 5 objects in the western sub-group are shown here. Big and small white circles indicate the presence or absence of [OII] emission: no white circles = no detectable [OII], small white circle (only two, one in the southeast corner of the image, the other just north of the guide star mask) = [OII] smaller than 2 times the noise, large white circles = [OII] stronger than 2 times the noise. The rightmost image is a blow up of the left one. North is up and East to the left; a concordant cosmology is assumed, thus 463 kpc = 1 arcmin (as depicted by the horizontal white bars in both images) at the redshift of RX J125712+4738.17 (z=0.866). |
| Open with DEXTER | |
| In the text | |
| |
Figure 10: i'-band image of three blended galaxies that run from North to South in the image. The two lower most probable positions are marked by white circles. The lowest declination object was detected in the Chandra image with probably diffuse emission around it (see text). The next object to the North is most likely a MIPS source which is the 7th brightest MIPS object in the field. This region can be found in the northernmost of the two magenta circles that overlap in Fig. 9. North is up and East is to the left. |
| Open with DEXTER | |
| In the text | |
| |
Figure 11: Histogram of the distribution of the magnitudes of the galaxies for which spectra were taken. The cross hatched area is for those galaxies for which redshifts were successfully derived. |
| Open with DEXTER | |
| In the text | |
| |
Figure 12:
Left: a MIPS 24 |
| Open with DEXTER | |
| In the text | |
| |
Figure 13: Based on Ettori et al. (2004a) Fig. 4, right upper panel, with the data point added for RX J1257. This is the L-T relation with correction by E(z). Dotted line: slope fixed to the predicted value of 2. Dashed line: slope free. See Ettori et al. (2004a) for further details. |
| Open with DEXTER | |
| In the text | |
Copyright ESO 2009
Current usage metrics show cumulative count of Article Views (full-text article views including HTML views, PDF and ePub downloads, according to the available data) and Abstracts Views on Vision4Press platform.
Data correspond to usage on the plateform after 2015. The current usage metrics is available 48-96 hours after online publication and is updated daily on week days.
Initial download of the metrics may take a while.