| Issue |
A&A
Volume 503, Number 1, August III 2009
|
|
|---|---|---|
| Page(s) | 103 - 106 | |
| Section | Extragalactic astronomy | |
| DOI | https://doi.org/10.1051/0004-6361/200912677 | |
| Published online | 02 July 2009 | |
Stochastic model of optical variability of BL Lacertae
D. A. Blinov1,2 - V. A. Hagen-Thorn1,2
1 - St.-Petersburg State Univ., Universitetsky pr. 28, 198504 St.-Petersburg, Russia
2 -
Isaac Newton Institute of Chile, St.-Petersburg Branch, Russia
Received 10 June 2009 / Accepted 20 June 2009
Abstract
Context. We use optical photometric and polarimetric data of BL Lacertae that cover a period of 22 years to study the variability of the source.
Aims. The long-term observations are employed for establishing parameters of a stochastic model consisting of the radiation from a steady polarized source and a number of variable components with different polarization parameters, proposed by the authors early.
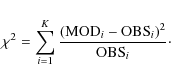
Methods. We infer parameters of the model from the observations using numerical simulations based on a Monte Carlo method, with values of each model parameter selected from a Gaussian distribution. We determine the best set of model parameters by comparing model distributions to the observational ones using the ![]() criterion.
criterion.
Results. We show that the observed photometric and polarimetric variability can be explained within a model with a steady source of high polarization, ![]() 40%, and with direction of polarization parallel to the parsec scale jet, along with
40%, and with direction of polarization parallel to the parsec scale jet, along with ![]() sources of variable polarization.
sources of variable polarization.
Key words: galaxies: active - methods: statistical - galaxies: BL Lacertae objects: individual: BL Lac
1 Introduction
BL Lacertae is an active galactic nucleus (z=0.069) that is the prototype of a class of AGN, BL Lac's objects, which are characterized by strong dominance of non-thermal continuum, extreme optical variability, and high optical polarization (Angel & Stockman 1980). BL Lac objects belong also to the class of blazars with highly variable emission from radio wavelengths to
![\begin{figure}
\par\includegraphics[width=16.5cm,clip]{126677a.eps}
\end{figure}](/articles/aa/full_html/2009/31/aa12677-09/img5.png) |
Figure 1-7: Observed dependences ( left column) and modeling results ( right column) between polarization parameters and intensity. |
![\begin{figure}
\par\includegraphics[width=18cm,clip]{12677F8.eps}
\end{figure}](/articles/aa/full_html/2009/31/aa12677-09/img6.png) |
Figure 8: Relative Stokes parameters: observed ( left) and modeled ( right). Mean values are indicated by open squares. |
| Open with DEXTER | |
On long-term timescales, many BL Lac objects show a preferential direction of optical polarization (Hagen-Thorn 1980,Hagen-Thorn et al. 2002 - Paper I) closely aligned with the direction of the parsec scale jet (Jorstad et al. 2007), as well as some correlations between total intensity and polarization parameters (Paper I). The data on OJ 287 (Hagen-Thorn 1980) and BL Lac (Paper I) permit to suggest a phenomenological model of variability for BL Lac object: there is a constantly acting source of polarized radiation responsible for the preferential direction of observed polarization and a number of sources with randomly distributed polarization parameters and intensities that are superimposed on the steady source.
In this paper we use simultaneous photometric and polarimetric measurements of BL Lac obtained over 22 years (for details see Paper I) and develop a method to derive the optimal number of the superimposed sources as well as the properties of the steady and superimposed sources that give the best fit to the data. We apply the results to describe the magnetic field structure in the optical emission region.
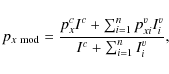
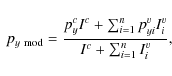
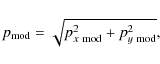
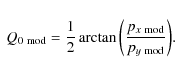
We recall that the relative Stokes parameters px and py are directly measured from polarimetric observations, and they are used to derive the degree of polarization
P=(px2+py2)1/2 and
position angle of polarization
![]() .
Photometric measurements
were performed independently and were corrected for contribution of the host galaxy.
The transformation from magnitudes m to intensities I was performed with the absolute calibration
of Mead et al. (1990). Polarimetric and photometric measurements obtained on the same
night were used to compute the absolute Stokes parameters
I, Q=px I, and U=py I.
.
Photometric measurements
were performed independently and were corrected for contribution of the host galaxy.
The transformation from magnitudes m to intensities I was performed with the absolute calibration
of Mead et al. (1990). Polarimetric and photometric measurements obtained on the same
night were used to compute the absolute Stokes parameters
I, Q=px I, and U=py I.
2 Stochastic model
Figures 1-6 (left column) show the observed dependences of polarization parameters on Stokes parameter I. Figure 7a presents the plot between the degree of polarization and position angle of polarization, while Fig. 8a gives the dependence between the relative Stokes parameters.
The aim of this work is to reproduce all dependences obtained from the observations
with a model consisting of a steady source of polarized radiation with parameters
Ic, pxc, pyc and n variable sources with parameters
Ivi, pvxi, pvyi, where
![]() .
At a given date the observed optical emission is represented
by Stokes parameters
.
At a given date the observed optical emission is represented
by Stokes parameters
![]() ,
and
,
and
![]() that are computed as the superposition
of the constantly acting and variable sources (see Appendix for the basic equations).
The total number of dates is 451.
that are computed as the superposition
of the constantly acting and variable sources (see Appendix for the basic equations).
The total number of dates is 451.
All parameters are assumed to be normally distributed around their mean value (mathematical
expectation M) with standard deviation ![]() .
There are three constraints on the parameters of
the steady source: 1) its flux must be less than the minimum observed flux;
2) its polarization direction must yield the preferred direction of polarization, which is
.
There are three constraints on the parameters of
the steady source: 1) its flux must be less than the minimum observed flux;
2) its polarization direction must yield the preferred direction of polarization, which is
![]() ;
and 3) its degree of polarization must be sufficiently high
to ensure a high observed polarization al low flux levels.
;
and 3) its degree of polarization must be sufficiently high
to ensure a high observed polarization al low flux levels.
Determination of optimal model parameters was accomplished by a Monte Carlo method. After multiple realizations of the model with different sets of parameters, we accept a set of parameters that produces the best agreement with the observed dependences as the most probable model. The initial criterion for rejecting obviously inadequate models and outlining possible sets of parameters was the visual similarity between the modeled and observed correlations.
The details of modelling were as follows: 1) the space of Stokes parameters
![]() was separated into K non-intersecting regions, each containing about 10 points from the observed set of 451 points; 2) from possible sets of parameters
a realization of values
was separated into K non-intersecting regions, each containing about 10 points from the observed set of 451 points; 2) from possible sets of parameters
a realization of values
![]() was selected by chance (the value of pyc was calculated from the
condition
was selected by chance (the value of pyc was calculated from the
condition
![]() ,
and it was assumed that
,
and it was assumed that
![]() );
3) using this realization we found by random chance the values
n, Iv, pxv, pyv, Ic,
pxc, pyc for 451 cases; 4) using Eqs. (A.1)-(A.7) for each of the
451 cases, we determined
);
3) using this realization we found by random chance the values
n, Iv, pxv, pyv, Ic,
pxc, pyc for 451 cases; 4) using Eqs. (A.1)-(A.7) for each of the
451 cases, we determined
![]() ;
and 5) we compared the number of points
in each of K regions derived in the model, MODi (
;
and 5) we compared the number of points
in each of K regions derived in the model, MODi (
![]() ), with the number of observed
points, OBSi (
), with the number of observed
points, OBSi (
![]() ), by calculating the value of
), by calculating the value of ![]() :
:
 |
(1) |
After repeating the third step 1000 times, we have found
3 Results and conclusions
We have constructed the dependences between the polarization parameters and intensity similar to the
observed dependences using such set of parameters:
![]() .
Figures 1b-8b give the modeled dependences obtained
for one realization of parameters taken at random from this set.
There is an excellent agreement between the observed and modelled
dependences. The similarity is excellent for other realizations of this set of parameters as well.
Figures 9 and 10,
as examples, give two dependences obtained for two more different realizations.
In addition, since the value of
.
Figures 1b-8b give the modeled dependences obtained
for one realization of parameters taken at random from this set.
There is an excellent agreement between the observed and modelled
dependences. The similarity is excellent for other realizations of this set of parameters as well.
Figures 9 and 10,
as examples, give two dependences obtained for two more different realizations.
In addition, since the value of
![]() is higher than M(Iv) in some cases
we formally may obtain by chance a negative value of the intensity Iv; we exclude such cases.
is higher than M(Iv) in some cases
we formally may obtain by chance a negative value of the intensity Iv; we exclude such cases.
![\begin{figure}
\includegraphics[width=9cm,clip]{126677c.eps}
\end{figure}](/articles/aa/full_html/2009/31/aa12677-09/img24.png) |
Figure 9: The dependence of the degree of polarization on flux for two different realizations. |
| Open with DEXTER | |
![\begin{figure}
\par\includegraphics[width=9cm,clip]{126677d.eps}
\end{figure}](/articles/aa/full_html/2009/31/aa12677-09/img25.png) |
Figure 10: The dependence of the degree of polarization on its direction for two different realizations. |
| Open with DEXTER | |
The proposed stochastic model agrees very well with the phenomenological model suggested in Paper I.
The model gives a high degree of polarization for the steady source, ![]() %,
with direction of polarization along the jet. This can be produced by a toroidal
component of a helical magnetic field in the magnetically dominated part of the jet. Such a scenario implies
that the optical emission most likely comes from the acceleration zone of the jet, as suggested by
Marscher et al. (2008), who recently have observed in BL Lac steady rotation of the position angle of optical
polarization by about 240
%,
with direction of polarization along the jet. This can be produced by a toroidal
component of a helical magnetic field in the magnetically dominated part of the jet. Such a scenario implies
that the optical emission most likely comes from the acceleration zone of the jet, as suggested by
Marscher et al. (2008), who recently have observed in BL Lac steady rotation of the position angle of optical
polarization by about 240![]() over a five-day interval. The rotation can be explained within
a helical field structure located in the acceleration zone
over a five-day interval. The rotation can be explained within
a helical field structure located in the acceleration zone ![]() 0.4 pc upstream
of the mm-wave VLBI core. However, the intensity of the steady source is only
0.4 pc upstream
of the mm-wave VLBI core. However, the intensity of the steady source is only ![]() 50%
higher than the most probable intensity of a random variable source, while at a given moment we expect
50%
higher than the most probable intensity of a random variable source, while at a given moment we expect ![]() 10 such sources to operate simultaneously.
The most probable polarization of variable sources
10 such sources to operate simultaneously.
The most probable polarization of variable sources ![]() 3%, which
implies that each variable source is an emission region with a significant number of cells with randomly
oriented magnetic field. This means that, in general, the magnetic field is dominated
by a turbulent componentthat masks the toroidal component. However,
3%, which
implies that each variable source is an emission region with a significant number of cells with randomly
oriented magnetic field. This means that, in general, the magnetic field is dominated
by a turbulent componentthat masks the toroidal component. However,
![]() and
and
![]() are fairly high, which requires ordering of the magnetic field in the emission regions
of the variable sources at some times. The latter can be connected with propagation of disturbances
along the jet and formation of shocks in the optical emission region.
are fairly high, which requires ordering of the magnetic field in the emission regions
of the variable sources at some times. The latter can be connected with propagation of disturbances
along the jet and formation of shocks in the optical emission region.
Acknowledgements
The work was supported by RFBR grant 09-02-00092.
Appendix
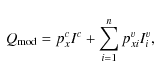
Because of additive nature of absolute Stokes parameters, the main equations for obtaining the model values are as follows: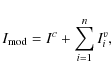
 |
(A.2) |
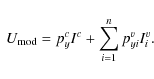
From (A.1)-(A.3) for relative Stokes parameters we have
 |
(A.4) |
 |
(A.5) |
and obviously,
 |
(A.6) |
References
- Angel, J. R. P., & Stockman, H. S. 1980, ARA&A, 18, 321 [NASA ADS] [CrossRef] (In the text)
- Gabuzda, D. C., et al. 2006, MNRAS, 369, 1569 [NASA ADS] [CrossRef] (In the text)
- Goldberg, D. E. 1989, Genetic Algorithms in Search, Optimization, and Machine Learning (Addison-Wesley, Massachusetts) (In the text)
- Hagen-Thorn, V. A. 1980, Ap&SS, 73, 263 [NASA ADS] [CrossRef] (In the text)
- Hagen-Thorn, V. A., Larionova, E. G., Jorstad, S. G., et al. 2002, A&A, 385, 55 [NASA ADS] [CrossRef] [EDP Sciences] (Paper I) (In the text)
- Jorstad, S. G., Marscher, A. P., Stevens, J. A., et al. 2007, AJ, 134, 799 [NASA ADS] [CrossRef] (In the text)
- Lister, M. L., & Smith, P. S. 2000, ApJ, 541, 66 [NASA ADS] [CrossRef] (In the text)
- Marscher, A. P., Jorstad, S. G., D'Arcangelo, F. D., et al. 2008, Nature, 452, 966 [NASA ADS] [CrossRef] (In the text)
- McKinney, J. C. 2006, MNRAS, 368, 1561 [NASA ADS] [CrossRef] (In the text)
- Mead, A. R. G., Ballard, K. R., Brand, P. W. J. L., et al. 1990, A&AS, 83, 183 [NASA ADS] (In the text)
- Vlahakis, N., & Königl, A. 2004, ApJ, 605, 656 [NASA ADS] [CrossRef] (In the text)
All Figures
| |
Figure 1-7: Observed dependences ( left column) and modeling results ( right column) between polarization parameters and intensity. |
| In the text | |
| |
Figure 8: Relative Stokes parameters: observed ( left) and modeled ( right). Mean values are indicated by open squares. |
| Open with DEXTER | |
| In the text | |
| |
Figure 9: The dependence of the degree of polarization on flux for two different realizations. |
| Open with DEXTER | |
| In the text | |
| |
Figure 10: The dependence of the degree of polarization on its direction for two different realizations. |
| Open with DEXTER | |
| In the text | |
Copyright ESO 2009
Current usage metrics show cumulative count of Article Views (full-text article views including HTML views, PDF and ePub downloads, according to the available data) and Abstracts Views on Vision4Press platform.
Data correspond to usage on the plateform after 2015. The current usage metrics is available 48-96 hours after online publication and is updated daily on week days.
Initial download of the metrics may take a while.