| Issue |
A&A
Volume 502, Number 2, August I 2009
|
|
|---|---|---|
| Page(s) | 679 - 693 | |
| Section | Planets and planetary systems | |
| DOI | https://doi.org/10.1051/0004-6361/200811608 | |
| Published online | 15 June 2009 | |
The dynamical role of the circumplanetary disc in planetary migration
A. Crida1,![]() -
C. Baruteau2,
-
C. Baruteau2,![]() -
W. Kley1 -
F. Masset2,3
-
W. Kley1 -
F. Masset2,3
1 - Institut für Astronomie & Astrophysik, Abt. Computational Physics,
Universität Tübingen, Auf der Morgenstelle 10, 72076 Tübingen, Germany
2 -
Laboratoire AIM-UMR 7158, CEA/CNRS/Université Paris Diderot, IRFU/Service d'Astrophysique,
CEA/Saclay, 91191 Gif-sur-Yvette Cedex, France
3 -
ICF-UNAM, Av. Universidad s/n, Cuernavaca, Morelos, CP 62210, Mexico
Received 31 December 2008 / Accepted 21 April 2009
Abstract
Context. Numerical simulations of planets embedded in protoplanetary gaseous discs are a precious tool for studying the planetary migration; however, some approximations have to be made. Most often, the selfgravity of the gas is neglected. In that case, it is not clear in the literature how the material inside the Roche lobe of the planet should be taken into account.
Aims. Here, we want to address this issue by studying the influence of various methods so far used by different authors on the migration rate.
Methods. We performed high-resolution numerical simulations of giant planets embedded in discs. We compared the migration rates with and without gas selfgravity, testing various ways of taking the circum-planetary disc (CPD) into account.
Results. Different methods lead to significantly different migration rates. Adding the mass of the CPD to the perturbing mass of the planet accelerates the migration. Excluding a part of the Hill sphere is a very touchy parameter that may lead to an artificial suppression of the type III, runaway migration. In fact, the CPD is smaller than the Hill sphere. We recommend excluding no more than a 0.6 Hill radius and using a smooth filter. Alternatively, the CPD can be given the acceleration felt by the planet from the rest of the protoplanetary disc.
Conclusions. The gas inside the Roche lobe of the planet should be very carefully taken into account in numerical simulations without any selfgravity of the gas. The entire Hill sphere should not be excluded. The method used should be explicitly given. However, no method is equivalent to computing the full selfgravity of the gas.
Key words: methods: numerical - stars: planetary systems: formation - accretion, accretion disks
1 Introduction
Planetary migration has been widely studied in the past decade, after the discovery of the first exoplanets. Indeed, the first known exoplanets were mostly hot Jupiters that could not have formed where they presently orbit, according to the standard theory of planet formation. Consequently, they are supposed to have migrated in the protoplanetary gaseous disc before its dissipation. More recently, pairs of exoplanets in mean motion resonance have been detected. This particular configuration requires some dissipative process for the planets to approach each other and lock in resonance. This is a strong evidence for planetary migration.
The theory of planetary migration was in fact proposed before the observational evidence (Meyer-Vernet & Sicardy 1987; Lin & Papaloizou 1986b; Ward 1986; Goldreich & Tremaine 1979; Lin & Papaloizou 1979). Numerical simulations allow study of more complex cases (several planets for instance) and refinement of our understanding of this phenomenon. Therefore, numerical studies of planetary migration are numerous in the literature. De Val-Borro et al. (2006) have compared the results of various codes on two typical test problems and find an overall consistency between the codes; however, a few numerical and physical issues are still open. In particular, a circum-planetary disc (CPD) generally appears around giant planets. Without mesh refinement, this structure is generally poorly resolved, but still present. As it lies close to the planet, it could potentially exert a strong force on it. So far, a very limited number of studies have considered the probably important role of the CPD in the migration rate. As this material is considered to belong to the planet and in order to avoid numerical artifacts due to the small distance, some authors exclude the Hill sphere of the planet from the calculation of the force of the gas on the planet. Most authors identify the CPD with the Hill sphere, which in fact does not hold as we shall see below (see also D'Angelo et al. 2005). Some authors add the mass of the gas in the Hill sphere to the planet mass when computing the planet gravity field. Others add the acceleration caused by the entire gas disc on the planet to the gas in the Hill sphere. In fact, the situation is confused, and there is no consensus on this issue.
Recently, Crida et al. (2008) have shown how planetary migration can explain the orbital parameters of exoplanets in mean motion resonance, and remarked that the outcome of their simulations had a dependence on the way they deal with the gas in the Hill sphere of the planets, as already pointed out by Bate et al. (2003), D'Angelo et al. (2003) and Peplinski et al. (2008) have also enlightened that the role of the CPD is not a minor one, and that a careful study of this problem is needed to answer this question.
In this paper, we study the influence of the CPD on the planetary migration in numerical simulations. The theory is discussed, to get a better understanding of the problem. This leads to possible solutions to treat the CPD. We perform 2D simulations with modest to high resolution, and we test and compare various recipes. Our goal is to provide a survey of the parameter ``CPD'' in numerical simulations. In particular, the fraction of the Hill sphere that is excluded is a very touchy parameter, and the way the exclusion is performed has a great influence on the outcome of the simulation. Many authors are not aware of this. Our survey shows that some popular methods are inappropriate. We present better ways of dealing with the material present in the Hill sphere, in particular the CPD.
This requires an analysis of the Hill sphere structure, but in the framework of global disc simulations, which are not dedicated to resolve the Hill sphere with a high level of precision. We do not aim at understanding the detailed physics and the fine structure of the CPD itself, but more how the gas in the Hill sphere of the planet should be taken into account. Convergence properties and the impact of varied prescriptions on the equation of state (EOS) or the softening length are fundamental issues, but we do not address them in this work. Instead, our aim is to find an adequate prescription for the torque calculation in non selfgravitating simulations, based on general considerations such as the conservation of angular momentum and the main features of the flow topology in the vicinity of the planet. The conservation of angular momentum is enforced in our scheme independently of the resolution, while the flow topology depends very weakly on the resolution (even if the mass of the CPD does, in an EOS-dependent way).
This paper is organised as follows. In Sect. 2, the problem is explained and analysed. Some definitions are provided, in order to clarify the strategy and the questions that arise from the presence of a CPD. We show that the problem can be divided into the questions of the perturbing mass, of the gravitational mass, and of the inertial mass of the planet. In Sect. 3, the numerical setup is presented. Then, in the following sections, numerical experiments are performed. In Sect. 4, a Jupiter mass planet, in type II migration in considered. In Sect. 5, the influence of the CPD on a Saturn mass planet, in type III migration is studied. In Sect. 6, the structure of the Hill sphere is analysed in detail, and the size of the CPD is estimated. Last, our results are summarised, and we conclude in Sect. 7.
2 Problem presentation
2.1 Disc structure
Let us consider a planet on a circular orbit around a central star. In steady state, in the frame corotating and drifting along with the planet, the gaseous disc is split into 4 closed regions:
- 1.
- The Roche lobe of the planet, which is where the
streamlines are closed around the planet. In the restricted three-body
problem, it can be approximated by the Hill sphere, centred on
the planet, of radius the Hill radius:
 ,
which is where
,
which is where  is the semi-major axis of the planet and
 is the ratio of the planet and stellar masses.
- 2.
- The horseshoe region around the orbit of the planet, where the streamlines have a horseshoe shape. This region is delimited by the horseshoe separatrices.
- 3.
- The inner disc between the star and the horseshoe inner separatrix.
- 4.
- The outer disc beyond the horseshoe outer separatrix.
The gas in the inner disc and in the outer disc exert a torque on the planet, the differential Lindblad torque. The gas present in the horseshoe region exerts the so-called horseshoe drag (Ward 1991; Masset 2001). For low-mass planets in locally isothermal discs, the sum of these two effects is generally a negative torque and responsible for type I planetary migration (Ward 1997). If the energy equation is taken into account, the torque due to the horseshoe drag is modified in radiatively inefficient discs as well as in more realistic radiative discs. This may slow down or reverse the type I migration (Paardekooper & Mellema 2006; Baruteau & Masset 2008a; Kley & Crida 2008). For intermediate mass planets, under some circumstances, the horseshoe drag can also be responsible for type III migration (Masset & Papaloizou 2003).
The effect of the gas present in the Roche lobe of the planet has so far never been explicitly analysed. However, as this material is located very close to the planet, it could exert on it a strong force and torque. Consequently, it has to be carefully taken into account. We show further that it can influence the migration rate by almost a factor 2. This concerns planets of sufficient mass, which are able to create a Roche lobe in the disc and to accrete gas.
Please note that the CPD does not necessarily fill the entire Hill
sphere. There may be material inside the Hill sphere that is not
orbiting around the planet, but that is simply passing
by (D'Angelo et al. 2005; Peplinski et al. 2008) have shown that
the gas dynamics around a migrating planet is more complicated than
described in Sect. 2.1, and that the Roche lobe may be
modified. This may be a source of confusion. Hereafter, the CPD always
refers to the material bound to the planet - that is: on a
streamline that describes an orbit around the planet - while the
Hill sphere refers to the material located within a distance ![]() to
the planet.
to
the planet.
2.2 Gravitational interactions
In Fig. 1 are displayed all the gravitational interactions physically present in the problem. The gaseous disc has been split into the CPD, which is the gas orbiting the planet, bound to the planet, and the rest of the ProtoPlanetary Disc (PPD). Four systems are interacting with each other, which makes a total of 12 interactions. In addition, the PPD and the CPD, as extended systems, exert on themselves a gravity force.
![\begin{figure}
\par\includegraphics[width=7cm,clip]{11608f01.eps}
\end{figure}](/articles/aa/full_html/2009/29/aa11608-08/img23.png) |
Figure 1: Summary of the gravitational interactions in the problem of a planet, surrounded by a CPD, orbiting in a PPD, about a star. |
These 14 gravitational actions can be classified in 4 categories:
- 5 direct terms (red solid arrows): The Planet
 PPD,
Planet
CPD, Star
PPD, Star
CPD, Star
Planet are the
most essential interactions of the system. They are responsible for
the disc and planet orbiting the star and for the perturbations of the
disc, including the mere existence of the CPD.
PPD,
Planet
CPD, Star
PPD, Star
CPD, Star
Planet are the
most essential interactions of the system. They are responsible for
the disc and planet orbiting the star and for the perturbations of the
disc, including the mere existence of the CPD.
- 3 indirect terms (red dashed arrows): The (re)actions of
the PPD, the CPD, and the planet on the star are generally considered
as indirect terms in the expression of the potential, if the frame is
centred on the star.
- 4 selfgravity terms (blue dotted arrows): All the
interactions between parts of the gaseous disc belong to what is
called the selfgravity of the disc (PPD
PPD, PPD
CPD,
CPD
PPD, CPD
CPD).
- 2 migration terms (green double arrows): The action of the disc (PPD and CPD) on the planet are responsible for the planetary migration.
The PPD
![]() PPD effects, which is the influence of the
gas selfgravity on the differential Lindblad torque, has been studied
for low-mass planets by Nelson & Benz (2003),
Pierens & Huré (2005), and more recently by
Baruteau & Masset (2008c,b). They confirmed
that the type I migration is slightly accelerated by the disc
selfgravity. This effect is not discussed here. On the contrary, we
only focus on the effect of the CPD.
PPD effects, which is the influence of the
gas selfgravity on the differential Lindblad torque, has been studied
for low-mass planets by Nelson & Benz (2003),
Pierens & Huré (2005), and more recently by
Baruteau & Masset (2008c,b). They confirmed
that the type I migration is slightly accelerated by the disc
selfgravity. This effect is not discussed here. On the contrary, we
only focus on the effect of the CPD.
In this paper, we plan to analyse the role and the behaviour of the
CPD in the migration, which is represented by the arrows
CPD ![]() Planet, CPD
Planet, CPD ![]() PPD, and PPD
PPD, and PPD ![]() CPD. As already said, the
action Planet
CPD. As already said, the
action Planet ![]() CPD should always be present and is not in
question. In simulations with full gas selfgravity computed, all the
blue dotted arrows of Fig. 1 are taken into account,
including the CPD
CPD should always be present and is not in
question. In simulations with full gas selfgravity computed, all the
blue dotted arrows of Fig. 1 are taken into account,
including the CPD
![]() CPD arrow. However, the selfgravity
of the CPD should only give a minor change of the CPD structure. It
should therefore be negligible for what concerns the planetary
migration. In what follows, we do not discuss the role of the
CPD
CPD arrow. However, the selfgravity
of the CPD should only give a minor change of the CPD structure. It
should therefore be negligible for what concerns the planetary
migration. In what follows, we do not discuss the role of the
CPD
![]() CPD gravitational interaction.
CPD gravitational interaction.
2.3 Effect of the circumplanetary disc on the planet
The presence of a CPD, gravitationally bound to the planet, can affect the migration by three means:
- 1.
- CPD
Planet: External perturbations (Star
CPD,
PPD
CPD) make the CPD not axisymmetric around the planet. Thus,
the CPD could exert a torque on the planet; we call this torque due
to the CPD structure a direct torque.
- 2.
- CPD
PPD
Planet: By perturbing the PPD, the CPD
influences the action of the latter on the planet. Basically, the CPD
acts like the planet does, enhancing the amplitude of the
perturbation. We define this as the perturbing mass problem.
- 3.
- CPD
Planet in migration: The planet and all the material
that is bound to it migrate together. During the migration, the CPD is
still linked to the planet. Consequently, the CPD is like a ball and
chain for the planet. If the full gas selfgravity is computed, the
CPD feels almost the same specific torque from the PPD than the
planet; then, the ball is pulled by the PPD, together with the
planet, and the chain is not taut. If the full gas selfgravity is not
computed (no blue arrow in Fig. 1), the CPD feels no torque
from the PPD and tends to stay on a constant orbit. Then, the
migrating planet has to pull the CPD. The chain is taut, which slows
down the planetary migration. We define this as the inertial mass
problem.
The second case is an indirect interaction, represented in
Fig. 1 by the two-arrow path: CPD ![]() PPD
PPD ![]() Planet. The
action of the CPD on the PPD (blue dotted arrow CPD
Planet. The
action of the CPD on the PPD (blue dotted arrow CPD ![]() PPD) may change
the value of the green double arrow PPD
PPD) may change
the value of the green double arrow PPD ![]() Planet.
Planet.
2.4 Problem analysis and possible solutions
In this paper, we evaluate either the specific torque felt by the
planet ![]() or the migration rate
or the migration rate
![]() (the dot denotes the
derivative with respect to time). Both quantities are equivalent, as
for a planet on a circular orbit,
(the dot denotes the
derivative with respect to time). Both quantities are equivalent, as
for a planet on a circular orbit,
![]() ,
with B the
second Oort constant.
,
with B the
second Oort constant.
It is well-known that a planet orbiting in a gaseous PPD perturbs the
latter gravitationally. In the linear regime, this perturbation leads
to the appearance of a one-armed spiral wave, called the wake,
in the inner and the outer discs. The amplitude of the perturbation is
proportional to the planet mass ![]() .
The perturbed density
distribution leads to a gravitational force on the planet. This force
is proportional to the mass of the wake times the mass of the planet
i.e. proportional to
.
The perturbed density
distribution leads to a gravitational force on the planet. This force
is proportional to the mass of the wake times the mass of the planet
i.e. proportional to
![]() .
Thus, the planet feels from the
disc a torque proportional to its mass squared. As a result, the
specific torque applied to the planet is proportional to the planet
mass
.
Thus, the planet feels from the
disc a torque proportional to its mass squared. As a result, the
specific torque applied to the planet is proportional to the planet
mass ![]() .
This corresponds to the PPD
.
This corresponds to the PPD
![]() Planet arrows
in Fig. 1.
Planet arrows
in Fig. 1.
If the planet is surrounded by a CPD, things are
slightly different. Indeed, the CPD is gravitationally bound to the
planet, and it moves with the planet. Thus, the planet of the above
paragraph should be replaced by the planet and its CPD. The specific
torque felt by this system is proportional to
![]() ,
where
,
where
![]() is the mass of the CPD. The presence of the CPD
should increase the migration speed.
is the mass of the CPD. The presence of the CPD
should increase the migration speed.
More generally, the specific torque felt by the migrating body is
proportional to the amplitude of the perturbation of the disc
(proportional to the perturbing mass of the planet), times the
mass of the body gravitationally interacting with it (gravitational mass of the planet), divided by the mass of the
migrating body (inertial mass of the planet). If selfgravity is
computed, these three masses are equal to
![]() .
However, as we see below, the perturbing, gravitational,
and inertial masses of the planet differ if the gas selfgravity is
not computed. This is the problem.
.
However, as we see below, the perturbing, gravitational,
and inertial masses of the planet differ if the gas selfgravity is
not computed. This is the problem.
In numerical simulations without gas selfgravity, the CPD does not
perturb the PPD, neither does it feel a torque from
it: in Fig. 1, the blue dotted arrows are suppressed. The
perturbing mass is ![]() ,
and the force felt by the planet is
proportional to
,
and the force felt by the planet is
proportional to
![]() .
But the CPD is linked to the planet. To
follow the planet in its migration, the CPD has to exchange angular
momentum with it. Thus, the relevant inertial mass of the planet is
not
.
But the CPD is linked to the planet. To
follow the planet in its migration, the CPD has to exchange angular
momentum with it. Thus, the relevant inertial mass of the planet is
not ![]() but
but
![]() .
The specific torque felt by the
migrating system (the planet and its CPD) is proportional to
.
The specific torque felt by the
migrating system (the planet and its CPD) is proportional to
![]() .
Here, the presence of the CPD decreases
the migration speed, which should not occur.
.
Here, the presence of the CPD decreases
the migration speed, which should not occur.
Based on this analysis, several authors
(e.g. Pierens & Nelson 2008) have tried to cancel the force from
the CPD on the planet by excluding the Hill sphere of the computation
of the force of the disc on the planet. This aims at suppressing the
green double arrow CPD ![]() Planet in Fig. 1. Thus, the
inertial mass of the planet is
Planet in Fig. 1. Thus, the
inertial mass of the planet is ![]() again, and one is back to the
first case; the specific torque is proportional to
again, and one is back to the
first case; the specific torque is proportional to ![]() ,
but not to
,
but not to
![]() .
.
Others (e.g. Masset 2006; Peplinski et al. 2008) have
suggested adding
![]() to the perturbing mass of the planet
(denoted
to the perturbing mass of the planet
(denoted
![]() by Peplinski et al.), to make the
amplitude of the wake proportional to
by Peplinski et al.), to make the
amplitude of the wake proportional to
![]() .
In
Fig. 1, this is equivalent to adding the blue, dotted
CPD
.
In
Fig. 1, this is equivalent to adding the blue, dotted
CPD ![]() PPD arrow. This gives a torque proportional to
PPD arrow. This gives a torque proportional to
![]() and a specific torque proportional to
and a specific torque proportional to
![]() as well. Peplinski et al. (2008)
find very little change in the migration rate by using
as well. Peplinski et al. (2008)
find very little change in the migration rate by using ![]() or
or
![]() as the perturbing mass of the planet, which is
quite surprising, as they have
as the perturbing mass of the planet, which is
quite surprising, as they have
![]() .
.
By adding
![]() to the planet mass felt by the disc (the
perturbing mass) and excluding the CPD from the disc felt by the
planet, one should recover a specific torque proportional to
to the planet mass felt by the disc (the
perturbing mass) and excluding the CPD from the disc felt by the
planet, one should recover a specific torque proportional to
![]() .
One could also think of
adding
.
One could also think of
adding
![]() to the perturbing mass of the planet and to the
gravitational mass of the planet. In that case, the torque is
proportional to
to the perturbing mass of the planet and to the
gravitational mass of the planet. In that case, the torque is
proportional to
![]() .
As the inertial mass is
.
As the inertial mass is
![]() ,
we find a specific torque in
,
we find a specific torque in
![]() ,
as required.
,
as required.
Peplinski et al. (2008) have already addressed this issue and
quite clearly described the problem. In the frame of type III
migration, they argue against any exclusion of a part of the disc in
the torque calculation, but they propose another solution by applying
the acceleration felt by the planet from the disc to the CPD (see
their Eqs. (13) and (17) ). This should mimic the blue, dotted arrow
PPD ![]() CPD. In their paper, this acceleration is given by all the
disc, CPD included. Then, if the CPD exerts, say, a positive torque on
the planet for whatever reason, this positive contribution will be
applied to the CPD as well. This should not be, because it opens the
possibility for the CPD to pull the planet indefinitely, without
losing any angular momentum. For consistency, the acceleration applied
to the CPD should be the one felt by the planet from the PPD, CPD
excluded: the green, double arrow PPD
CPD. In their paper, this acceleration is given by all the
disc, CPD included. Then, if the CPD exerts, say, a positive torque on
the planet for whatever reason, this positive contribution will be
applied to the CPD as well. This should not be, because it opens the
possibility for the CPD to pull the planet indefinitely, without
losing any angular momentum. For consistency, the acceleration applied
to the CPD should be the one felt by the planet from the PPD, CPD
excluded: the green, double arrow PPD ![]() Planet in our
Fig. 1.
Planet in our
Fig. 1.
The giant planets studied in this paper are not in the linear regime,
so that the torque is not exactly proportional to
![]() .
However,
this approximation allows the above reasoning. It enlightens the role
of the CPD in the migration process and suggests solutions. In
Sects. 4 and 5, we numerically test these
recipes and compare them with the results obtained with full
selfgravity.
.
However,
this approximation allows the above reasoning. It enlightens the role
of the CPD in the migration process and suggests solutions. In
Sects. 4 and 5, we numerically test these
recipes and compare them with the results obtained with full
selfgravity.
3 Code and setting description
To compare the migration rates obtained with different
prescriptions to take the CPD into account, we performed numerical
simulations, using the code FARGO (Masset 2000b,a). This is a
publicly available![]() 2D code,
using polar coordinates
2D code,
using polar coordinates
![]() .
We used the ADSG version, in
which the energy equation and the gas selfgravity are
implemented.
.
We used the ADSG version, in
which the energy equation and the gas selfgravity are
implemented.
The uniform kinematic viscosity is
![]() (
(
![]() being the angular velocity of the planet and
being the angular velocity of the planet and ![]() its semi major axis). The initial aspect ratio is
h0 = (H/r)0 =
0.03. To take the disc thickness into account, a smoothing length
its semi major axis). The initial aspect ratio is
h0 = (H/r)0 =
0.03. To take the disc thickness into account, a smoothing length
![]() (
(![]() of the initial disc height) is used in
the expression of the planet potential
of the initial disc height) is used in
the expression of the planet potential
![]() :
:

where
The vector force
![]() exerted by the disc on the planet
is computed using the following expression:
exerted by the disc on the planet
is computed using the following expression:
where
![\begin{displaymath}f_b(s)=\left[\exp\left(-10\left(\frac{s}{br_{\rm H}}-1\right)\right)+1\right]^{-1}\cdot
\end{displaymath}](/articles/aa/full_html/2009/29/aa11608-08/img54.png)
For
| |
Figure 2: The function fb(s) given by Eq. (3) for various values of b. |
The planet is not accreting.
In the energy equation, the heat source is the viscous dissipation,
and the cooling follows the following law, different from the public
version of FARGO-ADSG:
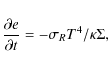
where e is the thermal energy of the gas per unit area,
 |
(5) |
This arbitrary constant opacity
The computation of the energy equation provides more realistic discs. In addition, it reduces the problem of the accretion of the CPD. Indeed, with a locally isothermal EOS, no pressure effect stops the collapse of the CPD. Then, at high resolution, gas in the neighbourhood of the planet reaches extremely high densities, and convergence is hard to obtain. Since we plan to increase gradually the resolution of our simulations (see next paragraph), we need a viscous and a compressional heating and a radiative cooling, for the CPD structure to remain within reasonable limits of density and temperature. In addition, preliminary tests show that with the gas's full selfgravity and locally isothermal EOS, we could not reach convergence of the mass inside the Hill sphere. This motivated us to treat the gas thermodynamics. Our opacity is admittedly not realistic, and another prescriptions for
The radial grid extent is
![]() .
The regions
.
The regions
![]() and
and
![]() are wave-damping regions, in
which the density, the temperature, and the velocities are damped
toward the initial values. The rings are geometrically spaced and the
cells squared:
are wave-damping regions, in
which the density, the temperature, and the velocities are damped
toward the initial values. The rings are geometrically spaced and the
cells squared:
![]() is constant. To
save computing time, the resolution is initially low, and regularly
doubled (see Table 1). In the end, a resolution of
is constant. To
save computing time, the resolution is initially low, and regularly
doubled (see Table 1). In the end, a resolution of
![]() and
and
![]() is reached. To our knowledge, this is the
first time that the FARGO code is run at such a resolution. Most of
the very-high-resolution simulations were run on a parallel cluster
with 64 CPUs. The FARGO code uses a staggered mesh, with the density
and temperature evaluated at the centre of the cells, and the
velocities at the boundaries. When the resolution is doubled, each
cell is divided into four. The new values of the fields were computed
with a 2D linear interpolation on the old grid.
is reached. To our knowledge, this is the
first time that the FARGO code is run at such a resolution. Most of
the very-high-resolution simulations were run on a parallel cluster
with 64 CPUs. The FARGO code uses a staggered mesh, with the density
and temperature evaluated at the centre of the cells, and the
velocities at the boundaries. When the resolution is doubled, each
cell is divided into four. The new values of the fields were computed
with a 2D linear interpolation on the old grid.
Table 1: Resolution of the simulations.
Some remarks concerning the gas selfgravity are in order. The ADSG version of the FARGO hydro-code enables switching on or off the gas selfgravity, the computation of which is described in Baruteau & Masset (2008c). In addition, it is possible to compute only the axisymmetric component of the gas gravity. This is the gravity field caused by the azimuthally averaged density field of the gas, or by an axisymmetric disc with the same density profile as the actual gas disc. This component of the gas gravity field is responsible for increasing the angular velocity of the planet and of the gas itself (at least far enough from the disc inner edge). If one abruptly switches on the gas selfgravity when restarting a simulation computed without selfgravity, a discontinuity in the velocities is introduced. To avoid this, all our simulations are computed with the axisymmetric component of the gas gravity taken into account. This has a negligible computational cost, while the full selfgravity is quite expensive. As discussed in Baruteau & Masset (2008c), accounting for the axisymmetric component of the disc gravity has only a marginal effect on the Lindblad torque with respect to the situation where the planet is held on a fixed circular orbit in a non selfgravitating disc. In the cases that we study here, the planet is massive enough to shape a (deep or shallow) gap in the disc and to have a CPD. Consequently, the effect of selfgravity is different from in the above-mentioned studies. The shift of Lindblad resonances - which is essentially the only effect in type I migration - is taken over by the question of the gap shape, which gives the gas density at the position of each resonance, hence the torque. In addition, there are other issues, such as a modification of the perturbing, gravitational, and inertial mass of the planet, which we will address here.
4 Type II migration case
Following the procedure described in Sect. 3, we performed
simulations of a Jupiter mass planet, with gas initial surface
density:
![]() .
In this
case, the planet opens a deep gap (Lin & Papaloizou 1986a; Crida et al. 2006), and the disc mass is low enough for type III
migration not to happen (Fig. 12
of Masset & Papaloizou 2003). Thus, the planet should migrate in
type II migration (Lin & Papaloizou 1986b). This choice could look
inappropriate, because in standard type II migration, the migration
speed is independent of the planet mass. However, this stands only if
the disc is massive enough to push the planet at the viscous accretion
speed. This occurs when
.
In this
case, the planet opens a deep gap (Lin & Papaloizou 1986a; Crida et al. 2006), and the disc mass is low enough for type III
migration not to happen (Fig. 12
of Masset & Papaloizou 2003). Thus, the planet should migrate in
type II migration (Lin & Papaloizou 1986b). This choice could look
inappropriate, because in standard type II migration, the migration
speed is independent of the planet mass. However, this stands only if
the disc is massive enough to push the planet at the viscous accretion
speed. This occurs when ![]() ,
where
,
where
![]() and
and
![]() (Crida 2006; Crida & Morbidelli 2007). Here,
(Crida 2006; Crida & Morbidelli 2007). Here,
![]() ,
the disc is not massive enough for the migration to occur at
a viscous rate. Consequently the migration rate should decrease with
the inertial mass of the planet. This case is timely for studying our
problem.
,
the disc is not massive enough for the migration to occur at
a viscous rate. Consequently the migration rate should decrease with
the inertial mass of the planet. This case is timely for studying our
problem.
4.1 Inertial mass problem
As explained in Sect. 2.3, this problem only concerns migrating planets. To study this effect, we let the planet evolve freely in the disc. To test and quantify the influence of the CPD on the migration speed, a region around the planet is excluded from the computation of the force of the disc on the planet. To perform this, the parameter b in Eq. (2) is taken strictly positive, and several values are tested.
4.1.1 Middle resolution
First, the planet is released after 300 orbits on a fixed circular orbit; the resolution of the grid is
The bold solid red curve in Fig. 3 is obtained with a simulation where the full selfgravity of the gas has been taken into account, while only the axisymmetric component is used in the others. Of course, in that case, no exclusion of any part of the disc is done, b=0. This bold curve should be seen as the reference.
![\begin{figure}
\par\includegraphics[angle=270,width=9cm,clip]{11608f04.ps}
\end{figure}](/articles/aa/full_html/2009/29/aa11608-08/img96.png) |
Figure 4:
Mass distribution inside the Hill sphere of the Jupiter mass
planet given by Eq. (7), in planet mass units. The measure is
made after 300 orbits on a fixed circular orbit, with a resolution of
|
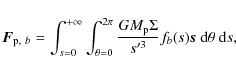
To better understand what happens in the Hill sphere,
Fig. 4 displays the mass distribution in the Hill
sphere of the planet, at the moment where the planet is released,
computed using the following expression:
If, instead of the smooth fb function, a Heaviside function was used,

If
The total mass in the Hill sphere is ![]() of the planet mass, so
that the inertial effect should be very small. In addition, the
variation of
of the planet mass, so
that the inertial effect should be very small. In addition, the
variation of
![]() for b>0.5 is only a few percent, so
the
for b>0.5 is only a few percent, so
the ![]() difference in the migration rates between the cases
b=0.5, 0.6, 0.8, and 1.0 cannot be explained by a variation in
the mass of the excluded region.
difference in the migration rates between the cases
b=0.5, 0.6, 0.8, and 1.0 cannot be explained by a variation in
the mass of the excluded region.
4.1.2 High resolution
In a second experiment, the planet is not released at t=300, but
kept on a fixed circular orbit until 375 orbits, the resolution
being doubled at time 325 (see Table 1). The planet is
then released at 375 orbits, with a resolution of 0.002 (35
cells in a Hill radius, 1000 cells in the surface of a circle of
radius
![]() ). The results are displayed in
Fig. 5. The curves with symbols were performed using
fb as filter, for various values of b.
). The results are displayed in
Fig. 5. The curves with symbols were performed using
fb as filter, for various values of b.
The average migration rate is a bit slower than in the previous
case. The green dashed curves with ![]() symbols (case b=1) in
Figs. 3 and 5 are rather linear,
providing a constant migration rate, only given by the torque from the
PPD outside of the Hill sphere. This torque should be converged for
resolutions of the order of
symbols (case b=1) in
Figs. 3 and 5 are rather linear,
providing a constant migration rate, only given by the torque from the
PPD outside of the Hill sphere. This torque should be converged for
resolutions of the order of
![]() (here: 0.0046), as widely
assumed in the literature (e.g. D'Angelo et al. 2005). However,
the gap profile is slowly evolving with time, so that the torque
exerted on the planet at t=300 or 375 orbits differs,
independently on the resolution. This time delay is the reason why the
green dashed curves with
(here: 0.0046), as widely
assumed in the literature (e.g. D'Angelo et al. 2005). However,
the gap profile is slowly evolving with time, so that the torque
exerted on the planet at t=300 or 375 orbits differs,
independently on the resolution. This time delay is the reason why the
green dashed curves with ![]() symbols slightly differ in
Figs. 3 and 5.
symbols slightly differ in
Figs. 3 and 5.
![\begin{figure}
\par\includegraphics[angle=270,width=9cm,clip]{11608f05.ps}
\end{figure}](/articles/aa/full_html/2009/29/aa11608-08/img107.png) |
Figure 5:
Migration path of the Jupiter-mass planet after its release
at t=375 orbits, with
|
For the other curves, with narrower filters fb or full gas selfgravity, their various evolutions between the medium-resolution and high-resolution cases suggest that convergence in the Hill sphere had not been reached at medium resolution. In particular, the different variations of the cases b=0.4 and b=0.6 between Figs. 3 and 5 can hardly be explained by a simple smooth time variation of the disc structure. However, we recall that a convergence study of the CPD structure is certainly interesting but is not within the scope of this paper, focused as it is on the role of the CPD in migration in standard numerical simulations.
With
![]() ,
all the curves are almost linear, denoting
that the CPD structure is better resolved. Then, the role of the
filter function can be analysed better. Here, the trend is clear. The
larger b, the lower the inertial mass of the planet, and the
faster the migration, as expected if excluding a part of the Hill
sphere only had an effect on the inertial mass of the planet.
,
all the curves are almost linear, denoting
that the CPD structure is better resolved. Then, the role of the
filter function can be analysed better. Here, the trend is clear. The
larger b, the lower the inertial mass of the planet, and the
faster the migration, as expected if excluding a part of the Hill
sphere only had an effect on the inertial mass of the planet.
In addition, other shapes of filter are tested. The black dots
correspond to a case where fb(s) has been replaced in Eq. (2)
by a Gaussian filter:
It gives almost the same result than f0.8 (light blue dot-dashed curve with full squares). The green dashed line without
For small b, the difference between b=0.6, b=0.4, b=0, and the full selfgravity case is rather small, although no match is observed. The effect of gas selfgravity on type II migration is little and has nothing to do with its effect on type I migration, which could be expected as the torque felt by the planet in this case is equal to the viscous torque from the disc and not the differential Lindblad torque (which is affected by the gas full selfgravity). Higher values of b, or the use of g(s) or h(s) show a significant acceleration of the migration with respect to the full selfgravity case.
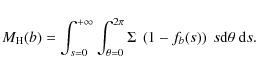
Figure 6 shows the mass distribution inside the
Hill sphere of the planet at the moment it is released, after 375
orbits. The distribution is a bit more compact than in previous case:
![]() of the mass is now included in
of the mass is now included in
![]() .
The total mass is
higher (
.
The total mass is
higher (
![]() ). This is due to the doubling of the resolution.
). This is due to the doubling of the resolution.
![\begin{figure}
\par\includegraphics[angle=270,width=9cm,clip]{11608f06.ps}
\end{figure}](/articles/aa/full_html/2009/29/aa11608-08/img113.png) |
Figure 6:
Mass distribution inside the Hill sphere of the Jupiter mass
planet given by Eq. (7), after 375 orbits, with a resolution of
|
The value of
![]() does not vary significantly for
b>0.5. Consequently, the inertial mass of the planet should not
change much whether one half of the Hill sphere is excluded or the
full Hill sphere. The acceleration of the migration for b>0.6 is
probably not due to the decrease in the inertial mass of the
planet. As in the middle resolution case, we find that by excluding
all the Hill sphere, one misses a part of the torque that this is not
an artifact from the absence of selfgravity.
does not vary significantly for
b>0.5. Consequently, the inertial mass of the planet should not
change much whether one half of the Hill sphere is excluded or the
full Hill sphere. The acceleration of the migration for b>0.6 is
probably not due to the decrease in the inertial mass of the
planet. As in the middle resolution case, we find that by excluding
all the Hill sphere, one misses a part of the torque that this is not
an artifact from the absence of selfgravity.
4.2 Perturbing and gravitational mass problem
The addition of the CPD mass to the perturbing mass of the planet can
be easily implemented in the code. One should simply add the mass of
the CPD to the planet perturbing mass in computating the
gravity potential of the planet through Eq. (1). However,
it is not easy to measure the mass of the CPD
![]() ,
because
this requires analysing the disc structure. We assume that the
CPD is a disc centred on the planet of radius
,
because
this requires analysing the disc structure. We assume that the
CPD is a disc centred on the planet of radius
![]() .
Therefore, we take
.
Therefore, we take
![]() .
Figures 4 and 6
have shown that the obtained value of
.
Figures 4 and 6
have shown that the obtained value of
![]() does not vary by
more than
does not vary by
more than ![]() for 0.5<b<1. The CPD itself should not
feel its own mass as added to the planet. This would be
inconsistent. Therefore, the expression of the gravitational potential
field of the planet is now given by Eq. (1), with
for 0.5<b<1. The CPD itself should not
feel its own mass as added to the planet. This would be
inconsistent. Therefore, the expression of the gravitational potential
field of the planet is now given by Eq. (1), with
so that inside
Ideally, for
![]() ,
one should use
,
one should use
![]() as defined by
Eq. (7) instead of
as defined by
Eq. (7) instead of
![]() .
But this is
computationally more expensive as it requires calculating
.
But this is
computationally more expensive as it requires calculating
![]() for every cell of the grid within a distance
for every cell of the grid within a distance
![]() to the
planet. Alternatively, one could also use a function other than fb,
which would fit the curves displayed in Figs. 4 and
6 better. For consistency, we have kept
fb. This should have only a minor influence on the CPD, and even
less on the global simulation. However, it is important that a smooth
enough function is used: with a Heaviside-like function,
to the
planet. Alternatively, one could also use a function other than fb,
which would fit the curves displayed in Figs. 4 and
6 better. For consistency, we have kept
fb. This should have only a minor influence on the CPD, and even
less on the global simulation. However, it is important that a smooth
enough function is used: with a Heaviside-like function,
![]() could not be monotonic. In the present case,
f0.6'(s)<4.2, while
could not be monotonic. In the present case,
f0.6'(s)<4.2, while
![]() ,
so that the change in
,
so that the change in
![]() at
at
![]() does not exceed
does not exceed ![]() .
.
![\begin{figure}
\par\includegraphics[angle=0,width=9cm,clip]{11608f07.eps}
\end{figure}](/articles/aa/full_html/2009/29/aa11608-08/img125.png) |
Figure 7:
Migration path of the Jupiter mass planet after its release
at t=375 orbits. The label ``large
|
With this prescription, we restarted our simulation from t=350orbits, with the planet on a fixed circular orbit, and a high
resolution of
![]() .
The mass
of the CPD is added smoothly over 3 orbits to the planet mass to avoid
a discontinuity: in Eq. (9),
.
The mass
of the CPD is added smoothly over 3 orbits to the planet mass to avoid
a discontinuity: in Eq. (9),
![]() is replaced by
is replaced by
![]() with
with
![]() for
t<353 and g=1 for
for
t<353 and g=1 for ![]() .
.
At 375 orbits, the planet is released and free to migrate, like in
Sect. 4.1.2. At this time, the CPD mass is
![]() ,
like in Sect. 4.1.2. The result in terms of migration
is displayed in Fig. 7 as the curve labelled
``large
,
like in Sect. 4.1.2. The result in terms of migration
is displayed in Fig. 7 as the curve labelled
``large
![]() ; b=0''. The thin red solid curve labelled
``
; b=0''. The thin red solid curve labelled
``
![]() '' is the most standard simulation, where nothing
is done (no full selfgravity, no exclusion, no modification of the
masses), also present in Fig. 5. Surprisingly, the
migration is slowed down in the first three orbits when the perturbing
mass of the planet is increased. The green curve with
'' is the most standard simulation, where nothing
is done (no full selfgravity, no exclusion, no modification of the
masses), also present in Fig. 5. Surprisingly, the
migration is slowed down in the first three orbits when the perturbing
mass of the planet is increased. The green curve with ![]() symbols
corresponds to a case where
symbols
corresponds to a case where
![]() is given by Eq. (9), and in
addition b=0.6 in Eq. (2). The black curve with big dots
corresponds to a simulation where the perturbing mass is given by
Eq. (9) and the gravitational mass of the planet is
is given by Eq. (9), and in
addition b=0.6 in Eq. (2). The black curve with big dots
corresponds to a simulation where the perturbing mass is given by
Eq. (9) and the gravitational mass of the planet is
![]() .
In the first five orbits, adding
.
In the first five orbits, adding
![]() to the
gravitational mass of the planet or excluding
to the
gravitational mass of the planet or excluding ![]() of the Hill
sphere both lead to a similar acceleration of the migration: the
green and black curves overlap at t=380, below the blue
curve. However, in the longer term (20 orbits), these two recipes lead
to different migration paths.
of the Hill
sphere both lead to a similar acceleration of the migration: the
green and black curves overlap at t=380, below the blue
curve. However, in the longer term (20 orbits), these two recipes lead
to different migration paths.
4.3 Acceleration of the CPD
Last, we tested the recipe proposed by
Peplinski et al. (2008). The perturbing mass of the planet is
given by Eq. (9). The force felt by the planet is
![]() ,
given by Eq. (2). The acceleration (or the
specific force) felt by the planet from the disc is then
,
given by Eq. (2). The acceleration (or the
specific force) felt by the planet from the disc is then
![]() .
This acceleration is then applied to the
material inside the Hill sphere, after multiplication by
1-f0.5(s), so the additional acceleration is smoothly vanishing
toward zero when
.
This acceleration is then applied to the
material inside the Hill sphere, after multiplication by
1-f0.5(s), so the additional acceleration is smoothly vanishing
toward zero when
![]() .
The material inside
.
The material inside
![]() feels
the same acceleration exactly as the planet and should naturally
follow the same orbit and the same migration path. This should set the
planet free of the ``ball and chain'' effect of the CPD.
feels
the same acceleration exactly as the planet and should naturally
follow the same orbit and the same migration path. This should set the
planet free of the ``ball and chain'' effect of the CPD.
![\begin{figure}
\par\includegraphics[angle=0,width=9cm,clip]{11608f08.eps}
\end{figure}](/articles/aa/full_html/2009/29/aa11608-08/img136.png) |
Figure 8: Migration path of the Jupiter mass planet after its release at t=375 orbits. The perturbing mass of the planet is given by Eq. (9) in every case, except the full selfgravity case (bold solid red line). The acceleration applied to the CPD varies. |
The resulting migration path is shown in Fig. 8 as the red
curve with + symbols. The orange curve with open triangles is computed
with the same algorithm, except that the acceleration felt by the CPD
is the one exerted on the planet by the PPD only, as discussed in
Sect. 2.4: instead of
![]() ,
,
![]() is applied to the CPD, but the planet still
feels
is applied to the CPD, but the planet still
feels
![]() .
During the first 15 orbits,
this has only a marginal influence on the migration and the two curves
overlap. But after t=390, the paths differ strongly. This proofs that our
reasoning in Sect. 2.4 was not vain: it is important to
decide whether the acceleration applied to the CPD should include the
acceleration of the CPD on the planet or not. The path in the second
case is closer to the bold red reference full selfgravity case. We
recommend that the acceleration of the CPD on the planet should not be
applied to the CPD itself.
.
During the first 15 orbits,
this has only a marginal influence on the migration and the two curves
overlap. But after t=390, the paths differ strongly. This proofs that our
reasoning in Sect. 2.4 was not vain: it is important to
decide whether the acceleration applied to the CPD should include the
acceleration of the CPD on the planet or not. The path in the second
case is closer to the bold red reference full selfgravity case. We
recommend that the acceleration of the CPD on the planet should not be
applied to the CPD itself.
The green dashed curve with ![]() symbols is taken from
Fig. 7:
symbols is taken from
Fig. 7:
![]() is given by Eq. (9) in
Eq. (1), and b=0.6 in Eq. (2). The green and orange
curves are very close but not identical. The acceleration of the CPD
or its exclusion of the force exerted by the disc on the planet both
give the planet an inertial mass of
is given by Eq. (9) in
Eq. (1), and b=0.6 in Eq. (2). The green and orange
curves are very close but not identical. The acceleration of the CPD
or its exclusion of the force exerted by the disc on the planet both
give the planet an inertial mass of ![]() ,
but in a different way.
,
but in a different way.
Accelerating the CPD is appealing, because this method gives the
planet an inertial mass of ![]() ,
without having to exclude a part of
the disc. Moreover, it can be used with the addition of
,
without having to exclude a part of
the disc. Moreover, it can be used with the addition of
![]() to the perturbing mass of the planet. However, it does
not give the same migration path as the gas full selfgravity either.
to the perturbing mass of the planet. However, it does
not give the same migration path as the gas full selfgravity either.
4.4 Summary of the type II migration case
We observed the migration rate of a Jupiter mass planet, using various
numerical recipes to take the CPD into account. The mass of the CPD is
only ![]() of the planet mass here, but we find that the way the CPD
is considered can change the migration significantly. In particular at
lower resolution, excluding a part of the Hill sphere can lead to
variations of almost a factor two.
of the planet mass here, but we find that the way the CPD
is considered can change the migration significantly. In particular at
lower resolution, excluding a part of the Hill sphere can lead to
variations of almost a factor two.
On the other hand, changing the perturbing or gravitational masses of the planet or accelerating the inner half of the Hill sphere leads to a moderate change in the migration speed. The resulting migration path is compatible with the full selfgravity case. Unfortunately, none of the methods leads to the same migration path as when the full selfgravity of the gas is computed.
This suggests that the mass of the CPD was in this case too low to strongly influence the migration, but that the outer layers of the Hill sphere are able to exert a strong torque on the planet. Even if the Hill sphere contains a small amount of gas, it should therefore be considered with care. This is discussed in more detail in Sect. 6.
5 Type III migration case
The second case that we studied is a Saturn mass planet with
![]() .
This density is one order
of magnitude higher than in previous case, so that type III migration
is expected for this planet. Indeed, except for what concerns the
slope of the density profile, this corresponds to the case studied by
Masset & Papaloizou (2003), who found type III migration, and
D'Angelo et al. (2005), who claim that type III migration does not
happen at high resolution. Another difference with these previous
works is that our equation of state is not locally isothermal, which
could significantly change the corotation torque
(Baruteau & Masset 2008a; Kley & Crida 2008).
.
This density is one order
of magnitude higher than in previous case, so that type III migration
is expected for this planet. Indeed, except for what concerns the
slope of the density profile, this corresponds to the case studied by
Masset & Papaloizou (2003), who found type III migration, and
D'Angelo et al. (2005), who claim that type III migration does not
happen at high resolution. Another difference with these previous
works is that our equation of state is not locally isothermal, which
could significantly change the corotation torque
(Baruteau & Masset 2008a; Kley & Crida 2008).
5.1 Inertial mass problem
The same experiment as in the Jupiter mass planet case was
performed. The setup was identical, with only the ![]() and
and ![]() changed.
changed.
5.1.1 Middle resolution
For a restart at 300 orbits and resolution of
![]() ,
the results are displayed in Fig. 9. The
bold, red curve corresponds to the case where the full selfgravity of
the gas has been computed. In the other cases, only the axisymmetric
component of the selfgravity is computed. The curves with symbols
come from simulations with exclusion of a part of the Hill Sphere,
using the filter fb, for various values of b (b=0 means no
exclusion). For
,
the results are displayed in Fig. 9. The
bold, red curve corresponds to the case where the full selfgravity of
the gas has been computed. In the other cases, only the axisymmetric
component of the selfgravity is computed. The curves with symbols
come from simulations with exclusion of a part of the Hill Sphere,
using the filter fb, for various values of b (b=0 means no
exclusion). For
![]() ,
the curves overlap and only the case
b=0 is drawn. Then, for increasing b, the migration speed
decreases.
,
the curves overlap and only the case
b=0 is drawn. Then, for increasing b, the migration speed
decreases.
The black dots correspond to a case where fb(s) has been replaced in Eq. (2) by the Gaussian filter g(s) given by Eq. (8). It gives almost the same result than f0.9 (grey blue short dashed curve with full triangles).
The green dashed line without symbols corresponds to exclusion of the
Hill sphere with a Heaviside filter h(s)=0 if
![]() ,
h(s)=1 if
,
h(s)=1 if
![]() .
It gives the most divergent result with the full selfgravity
case. The pink dotted line without symbols corresponds to exclusion of
the inner
.
It gives the most divergent result with the full selfgravity
case. The pink dotted line without symbols corresponds to exclusion of
the inner ![]() of the Hill sphere with a Heaviside filter
h0.6(s)=0 if
of the Hill sphere with a Heaviside filter
h0.6(s)=0 if
![]() ,
h0.6(s)=1 if
,
h0.6(s)=1 if
![]() .
It
gives a result similar to f0.7 (orange triple dashed line with
open triangles). Not only does the size of the excluded region matters
but also the shape of the filter.
.
It
gives a result similar to f0.7 (orange triple dashed line with
open triangles). Not only does the size of the excluded region matters
but also the shape of the filter.
First of all, we find that type III runaway migration happens in that case, in agreement with Masset & Papaloizou (2003), even with full selfgravity (bold red line). Admittedly however, we have not reached the resolution of D'Angelo et al. (2005) here (see next section).
Second, when varying b, the migration rate changes dramatically, and
for ![]() ,
the runaway migration process seems to be broken. This
again shows that excluding a part of the Hill sphere or not can have
strong consequences on the migration. At t=325 orbits, the
semi-major axis of the planet is a=0.77 in the case b=0 and 0.93in the case b=1. The ratio of the semi major axis variations is
3.33.
,
the runaway migration process seems to be broken. This
again shows that excluding a part of the Hill sphere or not can have
strong consequences on the migration. At t=325 orbits, the
semi-major axis of the planet is a=0.77 in the case b=0 and 0.93in the case b=1. The ratio of the semi major axis variations is
3.33.
Third, the observed behaviour is opposite the expected one if one
considers only the inertial mass effect: here the migration speed
decreases with b. The total mass of gas included in the Hill Sphere
at t=300 orbits is
![]() .
The impact on
the migration speed should thus not be more than
.
The impact on
the migration speed should thus not be more than ![]() .
This supports
the idea that the observed difference in the migration rate when
varying b is not due to a change in the inertial mass of the
planet, but to the direct torque repartition inside the Hill
sphere. The mass and torque distribution inside the Hill sphere will
be discussed in Sect. 6.
.
This supports
the idea that the observed difference in the migration rate when
varying b is not due to a change in the inertial mass of the
planet, but to the direct torque repartition inside the Hill
sphere. The mass and torque distribution inside the Hill sphere will
be discussed in Sect. 6.
5.1.2 Very high resolution
This simulation is run until t=475 orbits, with the planet on a fixed circular orbit, and increasing resolution following Table 1. The axisymmetric component of the gas gravity is always taken into account. In the end, a resolution of 10-3 is reached, so that the length of a Hill radius is covered by 48.2cells. This is almost exactly the settings of the run 2D5Gb of D'Angelo et al. (2005), for which convergence in resolution was reached. The planet is then released and let free to migrate, excluding a bigger or smaller part of the Hill sphere. The resulting migration paths are displayed in Fig. 10 for various filters.
The migration speed is much slower than at middle resolution
(Fig. 9), as already claimed by
D'Angelo et al. (2005) (note the different y-axis scale), but the
migration rate exponentially increases, in a runaway typical of
type III migration. In fact, the difference can arise from two
independent effects: (i) as already pointed out for the type II
migration case, the disc density profile has evolved with time between
t=300 and 475 orbits, independently of the resolution (see
Fig. 11). Therefore, the torque felt by the planet at
the release date differs. If it is smaller initially (as it appears to
be from Fig. 11), the torque remains smaller during the
runaway. (ii) The e-folding time of type III migration scales as
![]() ,
where
,
where ![]() is the coorbital mass
deficit, and
is the coorbital mass
deficit, and ![]() should be understood as the inertial mass of the
planet (see Masset & Papaloizou 2003). Here, the total mass of
gas in the coorbital region in the unperturbed disc is about
should be understood as the inertial mass of the
planet (see Masset & Papaloizou 2003). Here, the total mass of
gas in the coorbital region in the unperturbed disc is about
![]() ,
and the value of
,
and the value of ![]() is of the order of
is of the order of
![]() .
Therefore, a little increase in the inertial mass of the planet
(due to the increase in
.
Therefore, a little increase in the inertial mass of the planet
(due to the increase in
![]() )
results in a significant
increase in the e-folding time of the runaway migration. We think
that this explains most of the difference between
Figs. 9 and 10. The latter
effect may also be responsible for the vanishing of type III migration
at high resolution in D'Angelo et al. (2005, Fig. 8) because the
mass inside the Hill sphere increases with resolution up to a few
)
results in a significant
increase in the e-folding time of the runaway migration. We think
that this explains most of the difference between
Figs. 9 and 10. The latter
effect may also be responsible for the vanishing of type III migration
at high resolution in D'Angelo et al. (2005, Fig. 8) because the
mass inside the Hill sphere increases with resolution up to a few
![]() ,
according to their Fig. 9. This shows once again that the Hill
sphere should be considered with care. In the type III migration
regime, convergence in the Hill sphere structure had better be
reached. Here, however, we are not looking for the real migration
rate, but for the influence of the gas in the Hill sphere on the
migration rate. This experiment is suitable for this purpose.
,
according to their Fig. 9. This shows once again that the Hill
sphere should be considered with care. In the type III migration
regime, convergence in the Hill sphere structure had better be
reached. Here, however, we are not looking for the real migration
rate, but for the influence of the gas in the Hill sphere on the
migration rate. This experiment is suitable for this purpose.
![\begin{figure}
\par\includegraphics[angle=270,width=9cm,clip]{11608f11.ps}
\end{figure}](/articles/aa/full_html/2009/29/aa11608-08/img153.png) |
Figure 11:
Density profiles at t=300 orbits (
|
The major change observed does not stem for a strong modification of the
disc structure: the density profile is drawn in
Fig. 11 at the two times where the planet is
released. The gap width and depth are similar. The CPD is almost twice
as massive at very high resolution than at moderate resolution,
though, reaching ![]() of the planet mass. This promotes the idea that
the material in the Hill sphere or the CPD plays a major role in the
type III migration rate.
of the planet mass. This promotes the idea that
the material in the Hill sphere or the CPD plays a major role in the
type III migration rate.
In the previous section, the results showed that a large part of the torque responsible for the runaway migration originated in the Hill sphere. Therefore, the lower migration rate observed in a very-high-resolution case leads to the conclusion that the torque exerted on the planet by the material inside the Hill sphere decreases with resolution.
However, for the topic of this paper, we see that even at very high
resolution, excluding more than ![]() of the Hill sphere has a
significant influence on the migration speed. The larger the excluded
area, the more the migration diverges with respect to the full
selfgravity case. The Heaviside filter to exclude all what is beyond
of the Hill sphere has a
significant influence on the migration speed. The larger the excluded
area, the more the migration diverges with respect to the full
selfgravity case. The Heaviside filter to exclude all what is beyond
![]() of the planet appears to be the least appropriate.
of the planet appears to be the least appropriate.
5.2 Perturbing and gravitational mass problem, acceleration of the CPD
5.2.1 Middle resolution
With the same prescription as in Sect. 4.2, we
restarted our simulation from t=250 orbits, with the planet on a
fixed circular orbit and a resolution of 0.004. At this time,
![]() has reached
has reached
![]() .
It
is added smoothly over 40 orbits to
.
It
is added smoothly over 40 orbits to
![]() ,
to avoid a discontinuity.
,
to avoid a discontinuity.
Then, we let the planet evolve freely under the influence of the disc
at time t=300 orbits. The migration path is shown in
Fig. 12 as the red thin solid curve with triangles (labelled
``large
![]() ;
b=0''), compared to the migration rate without
taking the CPD mass into account (thin red solid curve, labelled
``b=0''), and to the selfgravity case (bold solid curve). By excluding
in addition the inner
;
b=0''), compared to the migration rate without
taking the CPD mass into account (thin red solid curve, labelled
``b=0''), and to the selfgravity case (bold solid curve). By excluding
in addition the inner ![]() of the Hill sphere (i.e. taking
b=0.6 in Eq. (2)), one gets the light blue, dot-dashed line
with full squares (labelled ``large
of the Hill sphere (i.e. taking
b=0.6 in Eq. (2)), one gets the light blue, dot-dashed line
with full squares (labelled ``large
![]() ;
b=0.6''). It can be
compared to the similar case, with
;
b=0.6''). It can be
compared to the similar case, with
![]() ,
which is the pink,
dotted line with open squares (labelled ``b=0.6''). The green dashed
curve with
,
which is the pink,
dotted line with open squares (labelled ``b=0.6''). The green dashed
curve with ![]() symbols (labelled ``large
symbols (labelled ``large
![]() and
and
![]() '') corresponds to the last case described in
Sect. 2.4: the perturbing mass is given by
Eq. (9), and gravitational mass of the planet is
'') corresponds to the last case described in
Sect. 2.4: the perturbing mass is given by
Eq. (9), and gravitational mass of the planet is
![]() .
.
![\begin{figure}
\par\includegraphics[width=9cm,clip]{11608f12.eps}
\end{figure}](/articles/aa/full_html/2009/29/aa11608-08/img156.png) |
Figure 12:
Migration path of the Saturn mass planet after its release at
t=300 orbits, for different perturbing masses. The label ``large
|
As expected, the migration is accelerated by the augmentation of the
perturbing mass of the planet. Adding
![]() to the perturbing
mass of the planet leads to a rise in the migration rate of
to the perturbing
mass of the planet leads to a rise in the migration rate of ![]() in
both cases b=0 and b=0.6. For the 15 first orbits, the curves
in
both cases b=0 and b=0.6. For the 15 first orbits, the curves
![]() remarkably overlap if one replaces t by
300+(t-300)/1.04in the cases with
remarkably overlap if one replaces t by
300+(t-300)/1.04in the cases with
![]() .
Another
.
Another ![]() increase in the migration
speed is observed when
increase in the migration
speed is observed when
![]() is also added to the
gravitational mass of the planet. This is consistent with the mass of
the CPD.
is also added to the
gravitational mass of the planet. This is consistent with the mass of
the CPD.
The ``Self Gravity'' simulation was launched at 300 orbits
from the same disc as the other simulations here: before t=300only the axisymmetric component of the selfgravity is computed, and
the disc is perturbed by a planetary potential given by Eq. (1)
with
![]() given by Eq. (9). The migration path is almost
indistinguishable from the one in the previous section, restarting from
the classical potential perturbed disc.
given by Eq. (9). The migration path is almost
indistinguishable from the one in the previous section, restarting from
the classical potential perturbed disc.
Unfortunately, as the full selfgravity case gives a slower migration than the standard simulation, adding the mass of the CPD to the perturbing and gravitational masses of the planet gives an even more divergent result. This means that in this case, the selfgravity plays another role as simply modifying the perturbing, gravitational, and inertial masses of the planet.
As in Sect. 4.3, the algorithm of
Peplinski et al. (2008) is also tested and compared to the other
ones. The migration obtained with it, with also
![]() given by
Eq. (9), is shown in Fig. 12, as a blue curve with
stars, labelled ``large
given by
Eq. (9), is shown in Fig. 12, as a blue curve with
stars, labelled ``large
![]() ;
;
![]() ''. It
follows the path of the case with simply
''. It
follows the path of the case with simply
![]() given by
Eq. (9).
given by
Eq. (9).
5.2.2 Very high resolution
The same experiments are computed at very high resolution from t=475orbits. At this time, the mass distribution in the Hill sphere of the
planet is shown in Fig. 16, and
![]() .
For the cases with
.
For the cases with
![]() ,
the simulation is restarted with this
perturbing mass at t=450 orbits, with the planet on a circular orbit
until 475 orbits, where the planet is released. As expected, the
addition of
,
the simulation is restarted with this
perturbing mass at t=450 orbits, with the planet on a circular orbit
until 475 orbits, where the planet is released. As expected, the
addition of
![]() to
to
![]() accelerates the migration. This
can be seen by comparing the thin solid red line to the thin solid red
line with open triangles in Fig. 13. These two cases have b=0but a different perturbing mass. During the 5 first orbits, the
migration paths overlap exactly if one replaces t with
475+(t-475)/1.068 in the
accelerates the migration. This
can be seen by comparing the thin solid red line to the thin solid red
line with open triangles in Fig. 13. These two cases have b=0but a different perturbing mass. During the 5 first orbits, the
migration paths overlap exactly if one replaces t with
475+(t-475)/1.068 in the
![]() case. In the longer term,
however, the acceleration of the migration is closer to
case. In the longer term,
however, the acceleration of the migration is closer to ![]() than
than
![]() .
.
With b=0.6, the influence of the perturbing mass can be seen by
comparing in Fig. 13 the pink dotted line with open squares with
the light blue dot-dashed line with full squares. The migration rates
compare exactly like in the b=0 case: ![]() difference during
the 5 first orbits,
difference during
the 5 first orbits, ![]() in the longer term.
in the longer term.
![\begin{figure}
\par\includegraphics[width=9cm,clip]{11608f13.eps}
\end{figure}](/articles/aa/full_html/2009/29/aa11608-08/img162.png) |
Figure 13:
Migration path of the Saturn mass planet after its release at
t=475 orbits. The label ``large
|
An acceleration of
![]() is then applied to the CPD
(green dashed curve with
is then applied to the CPD
(green dashed curve with ![]() symbols, labelled ``
symbols, labelled ``
![]() ''). This leads to an overall acceleration
of the migration of about
''). This leads to an overall acceleration
of the migration of about ![]() with respect to the standard, b=0case. This could be expected, but is very different than excluding the
CPD from the computation of the force of the disc on the planet (pink
dotted curve with open squares). However, both methods aim at
delivering the planet from the inertia of the CPD. This shows that they
are not equivalent.
with respect to the standard, b=0case. This could be expected, but is very different than excluding the
CPD from the computation of the force of the disc on the planet (pink
dotted curve with open squares). However, both methods aim at
delivering the planet from the inertia of the CPD. This shows that they
are not equivalent.
If in addition to the CPD acceleration, the perturbing mass is
![]() (blue dashed curve with stars), the migration
is accelerated again. The speed-up is exactly
(blue dashed curve with stars), the migration
is accelerated again. The speed-up is exactly ![]() with respect
to the previous case (acceleration of the CPD with
with respect
to the previous case (acceleration of the CPD with
![]() )
during
the first 5 orbits and about
)
during
the first 5 orbits and about ![]() in the longer term. Last, in the case
where
in the longer term. Last, in the case
where
![]() and b=0, the acceleration of the CPD
leads to a speed-up in the migration of about
and b=0, the acceleration of the CPD
leads to a speed-up in the migration of about ![]() .
.
5.3 Summary of the type III migration case
The outer layers of the Hill sphere (
![]() )
play a big role in
the type III migration regime. Excluding more than
)
play a big role in
the type III migration regime. Excluding more than ![]() of the Hill
sphere leads to a decrease in the migration rate and even to a
suppression of the runaway phenomenon. In the full selfgravity
simulations, the runaway is present, even at very high resolution,
although the migration rate is decreased. Adding
of the Hill
sphere leads to a decrease in the migration rate and even to a
suppression of the runaway phenomenon. In the full selfgravity
simulations, the runaway is present, even at very high resolution,
although the migration rate is decreased. Adding
![]() to the
perturbing and/or gravitational masses of the planet clearly leads to
an acceleration of the migration at the expected rate. Accelerating
the CPD appears to have less of an effect at middle resolution, while
it plays a significant role at very high resolution.
to the
perturbing and/or gravitational masses of the planet clearly leads to
an acceleration of the migration at the expected rate. Accelerating
the CPD appears to have less of an effect at middle resolution, while
it plays a significant role at very high resolution.
At middle resolution, no recipe gives a perfect match with the case where the full selfgravity of the gas is computed. We should also conclude that the gas selfgravity plays a more complex role in the type III migration than simply accelerating the CPD or letting the CPD perturb the PPD.
At very high resolution, excluding a part of the Hill sphere also has a strong influence on the migration path. With b=0.6, the agreement with the full selfgravity case is very good. However, this cannot be explained by the analysis of Sect. 2.4, according to which taking b=0.6 should accelerate the migration while it is slowed down here. This agreement is therefore most likely a coincidence. In any case, the type III migration rate is strongly reduced with increased resolution.
6 Direct torque and Hill sphere structure
6.1 Direct torque from the CPD
A short analysis of the direct torque from the CPD, defined as the material bound to the planet, shows that it should be negligible. It has been observed in numerical simulations with grid refinement that two spiral arms form in the CPD, because of tidal effects from the star. Thus, the CPD should not be considered as an axisymmetric structure, but it looks centro-symmetric anyway. At lower resolution, the spiral arms disappear; however, the axisymmetry of the structure is not perfect. Only the perturbation from the axisymmerty can be responsible from a torque on the planet.
It would be absurd that the CPD alone directly exerts a torque on the
planet and makes it migrate on the long term, because the CPD is
linked to the planet; this torque is an internal interaction in the
closed {CPD+Planet} system. This system cannot change its orbit by
itself. The only possible angular momentum transfer is between the
spin angular momentum of the CPD about the planet and the orbital
angular momentum of the {CPD+Planet} system about the star, similar
to the slow down of the Earth rotation together with increase of the
Moon-Earth distance. If one assumes for simplicity that the CPD is a
constant density disc of radius
![]() in Keplerian rotation
about the planet, its spin angular momentum is
in Keplerian rotation
about the planet, its spin angular momentum is
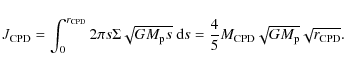
The orbital angular momentum of the planet is
6.2 Mass and torque distribution inside the Hill sphere
We consider the situation after 300 orbits in the case of a Saturn
mass planet in a massive disc for the middle
resolution. Figure 14 displays the mass inside the
Hill sphere
![]() .
It increases significantly
with b even for b>0.4, because the gap opened by the planet is not
empty (see Fig. 11); the background density is
responsible for the increase in
.
It increases significantly
with b even for b>0.4, because the gap opened by the planet is not
empty (see Fig. 11); the background density is
responsible for the increase in ![]() with b. However, the
azimuthally averaged profiles shown in Fig. 11 show
that a CPD is present.
with b. However, the
azimuthally averaged profiles shown in Fig. 11 show
that a CPD is present.
The torque exerted on the planet by the region within
![]() ,
is
also plotted in Fig. 14 as a function of b. More
precisely, it is the torque of the force computed with Eq. (2),
with
(1-fb(s)) instead of fb(s); or equivalently the torque of
the force:
,
is
also plotted in Fig. 14 as a function of b. More
precisely, it is the torque of the force computed with Eq. (2),
with
(1-fb(s)) instead of fb(s); or equivalently the torque of
the force:
![]() .
It appears that for
a planet on a fixed circular orbit, the region inside
.
It appears that for
a planet on a fixed circular orbit, the region inside
![]() exerts a
negligible torque, while the region between
exerts a
negligible torque, while the region between
![]() and
and ![]() has a
non negligible effect on the planet: the direct torque is not small.
has a
non negligible effect on the planet: the direct torque is not small.
![\begin{figure}
\par\includegraphics[width=9cm,clip]{11608f14.eps}
\end{figure}](/articles/aa/full_html/2009/29/aa11608-08/img177.png) |
Figure 14:
Mass
|
Figure 15 shows the torque exerted on the planet by
various regions of the disc, as a function of time, during the
type III migration between 300 and 325 orbits. The measures are done
in the simulation with full gas selfgravity computed. The total
torque, exerted by all the disc, is increasingly negative, which is
characteristic of runaway inward migration (solid line). The other
curves are the torques due to spheres centred on the planet inside the
Hill sphere, like in Fig. 14. In the bottom panel, the
torques due to fractions of the Hill sphere are plotted in terms of
percentage of the total torque. The torque exerted by the material
inside the Hill sphere is positive before the planet is released, but
then turns negative. The inner ![]() of the Hill sphere plays a
negligible role for a migrating planet too. But the entire Hill sphere
is responsible for about
of the Hill sphere plays a
negligible role for a migrating planet too. But the entire Hill sphere
is responsible for about ![]() of the total torque. This confirms
that the region between
of the total torque. This confirms
that the region between
![]() and
and
![]() plays a major role in
the process of type III migration, as Fig. 9 suggests.
plays a major role in
the process of type III migration, as Fig. 9 suggests.
![\begin{figure}
\par\includegraphics[width=9cm,clip]{11608f16.eps}
\end{figure}](/articles/aa/full_html/2009/29/aa11608-08/img181.png) |
Figure 16:
Mass
|
Figures 16 and 17 are the same as Figs. 14 and 15, but from time 475 orbits on, with the very high resolution. The torques as a function of time in Fig. 17 come from the simulation with only the axisymmetric component of the selfgravity taken into account, and no exclusion of any part of the Hill sphere. The two figures look very similar to the previous ones, in particular the total torque is smaller but is also increasingly negative. The other previous remarks also apply at very high resolution.
6.3 Size of the circum-planetary disc
The calculation results and the analysis of the mass and torque
distributions inside the Hill sphere suggest that the region within
![]() of the planet contains most of the mass and yet it exerts a
negligible torque on the planet, whereas the region between
of the planet contains most of the mass and yet it exerts a
negligible torque on the planet, whereas the region between
![]() and
and ![]() has a negligible mass but it exerts a large torque on the
planet. Such a large torque cannot be permanently exerted by material
bound to the planet, otherwise this material would not migrate at the
same rate as the planet's, and it would ultimately escape from the
planet's potential well. This suggests that the CPD is located inside
has a negligible mass but it exerts a large torque on the
planet. Such a large torque cannot be permanently exerted by material
bound to the planet, otherwise this material would not migrate at the
same rate as the planet's, and it would ultimately escape from the
planet's potential well. This suggests that the CPD is located inside
![]() ,
which can be checked with a streamline analysis, as shown
below. Alternatively, one can determine the shape and the size of the
CPD with the following energetic approach. We denote by
,
which can be checked with a streamline analysis, as shown
below. Alternatively, one can determine the shape and the size of the
CPD with the following energetic approach. We denote by
![]() the total specific energy of the fluid elements perturbed by the
planet. It is the sum of the potential, kinetic, and thermal perturbed
energies by unit mass of the fluid elements:
the total specific energy of the fluid elements perturbed by the
planet. It is the sum of the potential, kinetic, and thermal perturbed
energies by unit mass of the fluid elements:
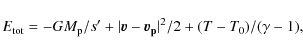
where
with
We first compare both approaches to determine the CPD shape with the
middle-resolution run for the Saturn mass planet. In the top panel of
Fig. 18, we depict the gas surface density at 300orbits, just before the planet release. The latter is located at
![]() and
and
![]() ,
and its position is highlighted
with a + symbol. The background vertical and horizontal lines show
the grid mesh. The dashed circle represents the planet's Hill
sphere. Streamlines (solid curves) are also superimposed to appreciate
the shape and the size of the CPD. The streamline analysis confirms
that most of the mass inside the planet's Hill sphere is confined to
the CPD, and it shows that the latter has an elliptical shape, with a
semi-major axis approximately twice as large as the semi-minor
axis. The semi-major axis is
,
and its position is highlighted
with a + symbol. The background vertical and horizontal lines show
the grid mesh. The dashed circle represents the planet's Hill
sphere. Streamlines (solid curves) are also superimposed to appreciate
the shape and the size of the CPD. The streamline analysis confirms
that most of the mass inside the planet's Hill sphere is confined to
the CPD, and it shows that the latter has an elliptical shape, with a
semi-major axis approximately twice as large as the semi-minor
axis. The semi-major axis is ![]()
![]() .
This justifies that the
material inside
.
This justifies that the
material inside ![]()
![]() exerts a small torque on the planet
compared to the material located between
exerts a small torque on the planet
compared to the material located between
![]() and
and ![]() .
.
In the bottom panel of Fig. 18, we display the quantity
![]() at the same time. The same
streamlines as in the top panel are depicted. The red solid line shows
the contour
at the same time. The same
streamlines as in the top panel are depicted. The red solid line shows
the contour
![]() ,
the quantity
,
the quantity
![]() being calculated with Eq. (12). The location of the
stagnation point, depicted with a
being calculated with Eq. (12). The location of the
stagnation point, depicted with a ![]() symbol in this panel (at
symbol in this panel (at
![]() ,
,
![]() ), is inferred from the
streamline analysis. The contour
), is inferred from the
streamline analysis. The contour
![]() can be
approximated as a circle of radius
can be
approximated as a circle of radius
![]() .
Its location agrees
with that of the CPD determined with the streamline analysis.
.
Its location agrees
with that of the CPD determined with the streamline analysis.
Figure 19 is the same as Fig. 18, but for the
very high-resolution run just before the release of the Saturn mass
planet at 475 orbits. A close comparison between both figures
reveals significant differences in the flow topology near the
planet. In particular, the CPD is now very close to a circle of radius
![]() ,
and its shape and its size are in very good agreement with
those of the contour
,
and its shape and its size are in very good agreement with
those of the contour
![]() .
The flow also tends to
show more complexity at higher resolution, judging from the presence
of a single vortex slightly inside the planet's orbit.
.
The flow also tends to
show more complexity at higher resolution, judging from the presence
of a single vortex slightly inside the planet's orbit.
![\begin{figure}
\par\includegraphics[width=9cm,clip]{11608f20cmyk.eps} \includegraphics[width=9cm,clip]{11608f21cmyk.eps}
\end{figure}](/articles/aa/full_html/2009/29/aa11608-08/img197.png) |
Figure 19: Same as Fig. 18, but for the very-high-resolution run, just before the release of the planet at 475 orbits. To improve legibility, the grid mesh is not displayed. |
The CPD is slightly larger than in previous locally isothermal
studies by D'Angelo et al. (2005). This probably comes from the
structure inside the Hill sphere changeing when one
changes the equation of state, as the pressure support is
modified. With the energy equation, the collapse of the CPD is limited by
the heating due to adiabatic compression, which may give a wider but
less massive CPD than in the locally isothermal case. Also, the smoothing
length ![]() influences the mass and size of the CPD: the
smaller
influences the mass and size of the CPD: the
smaller ![]() ,
the deeper the potential well of the planet, and
then the larger the CPD. The choice of the equation of state, opacity,
and smoothing length certainly influences the size and mass of the
CPD. The analysis performed in this section concerns only the specific
cases that we studied in this paper, in order to compare the mass and
torque repartition in the Hill sphere with the migration rates
observed.
,
the deeper the potential well of the planet, and
then the larger the CPD. The choice of the equation of state, opacity,
and smoothing length certainly influences the size and mass of the
CPD. The analysis performed in this section concerns only the specific
cases that we studied in this paper, in order to compare the mass and
torque repartition in the Hill sphere with the migration rates
observed.
7 Conclusion
In this study, we have performed experiments to analyse the role of the circum-planetary disc and the gas in the Hill sphere in the numerical simulations of planetary migration of giant planets. The way the material inside the Hill sphere is taken into account has a strong influence on the outcome of simulations in which the gas selfgravity is not computed. Whether or not a part of the Hill sphere is excluded in the computation of the force felt by the planet, the migration rate can vary by a factor 2 in type II migration, and even 3.33 in case of type III migration. This numerical issue is thus critical. Therefore, we would like to encourage authors to specify how they deal with the Hill sphere of giant planets in their simulations, so that their experiments can be reproducible by others.
In Sect. 2.4, we analysed the problem and proposed
several solutions. To deliver the migrating planet from the ball and
chain effect of the CPD, it is possible to exclude a part of the Hill
sphere from the computation of the force exerted by the disc on the
planet. It is also possible to artificially give the CPD the
acceleration felt by the planet. Both methods are not equivalent. In
order to take the CPD into account in the perturbation of the PPD, the
mass of the CPD can be added to the perturbing mass of the planet. In
the second case studied here, this leads to an acceleration of the
migration proportional to the mass of the CPD. To help the planet to
pull the CPD, the gravitational mass of the planet can be increased by
![]() ,
which also accelerates the migration as expected. These
four tricks can be combined.
,
which also accelerates the migration as expected. These
four tricks can be combined.
We would like to point out again that the CPD is not the entire Hill sphere. As demonstrated in Sect. 6.3, its size is only about a half of the Hill radius only. As a consequence, excluding all the Hill sphere of the planet is inappropriate; in fact, our simulations show that this method gives the most divergent results with respect to our reference case (full gas selfgravity computed). Unfortunately, no method matches the full selfgravity case. The role of the selfgravity is more complex than changing the inertial, perturbing, and gravitational masses of the planet.
The present study was conducted for a specific equation of state
and for a specific value of the softening length. Under these
circumstances, it seems appropriate to remove about half
of the Hill sphere in the computation of the force felt by the planet
from the disc, but not more than
![]() .
Authors who consider
different prescriptions should undertake a prior analysis of the CPD
size to infer how they should scale this fraction in their
case. Alternatively, accelerating the material within
.
Authors who consider
different prescriptions should undertake a prior analysis of the CPD
size to infer how they should scale this fraction in their
case. Alternatively, accelerating the material within ![]()
![]() of the planet also provides satisfactory results, but the acceleration
imposed on the CPD should be the one provided to the planet by the
disc outside
of the planet also provides satisfactory results, but the acceleration
imposed on the CPD should be the one provided to the planet by the
disc outside
![]() .
The addition of
.
The addition of
![]() to the perturbing
mass of the planet also seems to be a good idea and leads to an
acceleration of the migration. Of course, the most reliable solution
is to compute the full gas selfgravity, with the highest resolution
possible. In any case, one should be aware of the strong influence of
the CPD on planetary migration.
to the perturbing
mass of the planet also seems to be a good idea and leads to an
acceleration of the migration. Of course, the most reliable solution
is to compute the full gas selfgravity, with the highest resolution
possible. In any case, one should be aware of the strong influence of
the CPD on planetary migration.
Acknowledgements
A. Crida acknowledges the support through the German Research Foundation (DFG) grant KL 650/7. The high-resolution computations were performed on the hpc-bw and hpc-uni clusters of the Rechenzentrum of the University of Tübingen.
References
- Baruteau, C., & Masset, F. 2008a, ApJ, 672, 1054 [NASA ADS] [CrossRef]
- Baruteau, C., & Masset, F. 2008b, in AAS/Division of Dynamical Astronomy Meeting, Vol. 39, AAS/Division of Dynamical Astronomy Meeting, #03.03
- Baruteau, C., & Masset, F. 2008c, ApJ, 678, 483 [NASA ADS] [CrossRef]
- Bate, M. R., Lubow, S. H., Ogilvie, G. I., & Miller, K. A. 2003, MNRAS, 341, 213 [NASA ADS] [CrossRef] (In the text)
- Crida, A. 2006, Ph.D. Thesis, Observatoire de la Côte d'Azur, NICE, France
- Crida, A., & Morbidelli, A. 2007, MNRAS, 377, 1324 [NASA ADS] [CrossRef]
- Crida, A., Morbidelli, A., & Masset, F. 2006, Icarus, 181, 587 [NASA ADS] [CrossRef]
- Crida, A., Sándor, Z., & Kley, W. 2008, A&A, 483, 325 [NASA ADS] [CrossRef] [EDP Sciences] (In the text)
- D'Angelo, G., Kley, W., & Henning, T. 2003, ApJ, 586, 640 [NASA ADS] (In the text)
- D'Angelo, G., Bate, M. R., & Lubow, S. H. 2005, MNRAS, 358, 316 [NASA ADS] [CrossRef] (In the text)
- De Val-Borro, M., Edgar, R. G., Artymowicz, P., et al. 2006, MNRAS, 370, 529 [NASA ADS] (In the text)
- Goldreich, P., & Tremaine, S. 1979, ApJ, 233, 857 [NASA ADS] [CrossRef]
- Kley, W., & Crida, A. 2008, A&A, 487, L9 [NASA ADS] [CrossRef] [EDP Sciences]
- Lin, D. N. C., & Papaloizou, J. 1979, MNRAS, 186, 799 [NASA ADS]
- Lin, D. N. C., & Papaloizou, J. 1986a, ApJ, 307, 395 [NASA ADS] [CrossRef]
- Lin, D. N. C., & Papaloizou, J. 1986b, ApJ, 309, 846 [NASA ADS] [CrossRef]
- Masset, F. 2000a, A&AS, 141, 165 [NASA ADS] [CrossRef] [EDP Sciences]
- Masset, F. 2000b, in Disks, Planetesimals, and Planets, ed. G. Garzón, C. Eiroa, D. de Winter, & T. J. Mahoney, ASP Conf. Ser., 219, 75
- Masset, F. 2006, in Tidal interactions in composite systems, ed. M.-J. Goupil, & J.-P. Zahn
- Masset, F. S. 2001, ApJ, 558, 453 [NASA ADS] [CrossRef]
- Masset, F. S., & Papaloizou, J. C. B. 2003, ApJ, 588, 494 [NASA ADS] [CrossRef] (In the text)
- Masset, F. S., D'Angelo, G., & Kley, W. 2006, ApJ, 652, 730 [NASA ADS] [CrossRef] (In the text)
- Meyer-Vernet, N., & Sicardy, B. 1987, Icarus, 69, 157 [NASA ADS] [CrossRef]
- Nelson, A. F., & Benz, W. 2003, ApJ, 589, 556 [NASA ADS] [CrossRef] (In the text)
- Paardekooper, S.-J., & Mellema, G. 2006, A&A, 459, L17 [NASA ADS] [CrossRef] [EDP Sciences]
- Peplinski, A., Artymowicz, P., & Mellema, G. 2008, MNRAS, 386, 164 [NASA ADS] [CrossRef] (In the text)
- Pierens, A., & Huré, J.-M. 2005, A&A, 433, L37 [NASA ADS] [CrossRef] [EDP Sciences] (In the text)
- Pierens, A., & Nelson, R. P. 2008, A&A, 482, 333 [NASA ADS] [CrossRef] [EDP Sciences] (In the text)
- Ward, W. R. 1986, Icarus, 67, 164 [NASA ADS] [CrossRef]
- Ward, W. R. 1991, in Lunar and Planetary Institute Conference Abstracts, 1463
- Ward, W. R. 1997, Icarus, 126, 261 [NASA ADS] [CrossRef] (In the text)
Footnotes
- ...
![[*]](/icons/foot_motif.png)
- Now at: DAMTP, University of Cambridge, Wilberforce Road, Cambridge CB3 0WA, UK.
- ...
- Now at: Astronomy and Astrophysics Department, University of California, Santa Cruz, CA 95064, USA.
- ... available
- http://fargo.in2p3.fr/
All Tables
Table 1: Resolution of the simulations.
All Figures
| |
Figure 1: Summary of the gravitational interactions in the problem of a planet, surrounded by a CPD, orbiting in a PPD, about a star. |
| In the text | |
| |
Figure 2: The function fb(s) given by Eq. (3) for various values of b. |
| In the text | |
![\begin{figure}
\par\includegraphics[angle=270,width=9cm,clip]{11608f03.ps}
\end{figure}](/articles/aa/full_html/2009/29/aa11608-08/img95.png) |
Figure 3:
Migration path of the Jupiter mass planet after its release
at t=300 orbits, with
|
| In the text | |
| |
Figure 4:
Mass distribution inside the Hill sphere of the Jupiter mass
planet given by Eq. (7), in planet mass units. The measure is
made after 300 orbits on a fixed circular orbit, with a resolution of
|
| In the text | |
| |
Figure 5:
Migration path of the Jupiter-mass planet after its release
at t=375 orbits, with
|
| In the text | |
| |
Figure 6:
Mass distribution inside the Hill sphere of the Jupiter mass
planet given by Eq. (7), after 375 orbits, with a resolution of
|
| In the text | |
| |
Figure 7:
Migration path of the Jupiter mass planet after its release
at t=375 orbits. The label ``large
|
| In the text | |
| |
Figure 8: Migration path of the Jupiter mass planet after its release at t=375 orbits. The perturbing mass of the planet is given by Eq. (9) in every case, except the full selfgravity case (bold solid red line). The acceleration applied to the CPD varies. |
| In the text | |
![\begin{figure}
\par\includegraphics[width=9cm,clip]{11608f09.eps}
\end{figure}](/articles/aa/full_html/2009/29/aa11608-08/img145.png) |
Figure 9: Migration path of the Saturn mass planet after its release at t=300 orbits. Bold curve: simulation where the gas selfgravity is computed. Curves with symbols: simulations with exclusion of a part of the Hill Sphere, using the filter fb, for various values of b. Curves without symbols: exclusion of a part of the Hill Sphere with Heaviside filters. Big dots: exclusion of the Hill sphere with a Gaussian filter. |
| In the text | |
![\begin{figure}
\par\includegraphics[width=9cm,clip]{11608f10.eps}
\end{figure}](/articles/aa/full_html/2009/29/aa11608-08/img149.png) |
Figure 10: Migration path of the Saturn-mass planet after its release at t=475 orbits. Bold red curve: the full gas selfgravity is computed. Other curves: only the axisymmetric part of the gas selfgravity is computed. Thin solid red curve with + symbols: the whole disc is taken into account. The other curves come from simulations with exclusion of a part of the Hill sphere, with the filter fb for various values of b, for the Gaussian filter g, or for the Heaviside filter h. |
| In the text | |
| |
Figure 11:
Density profiles at t=300 orbits (
|
| In the text | |
| |
Figure 12:
Migration path of the Saturn mass planet after its release at
t=300 orbits, for different perturbing masses. The label ``large
|
| In the text | |
| |
Figure 13:
Migration path of the Saturn mass planet after its release at
t=475 orbits. The label ``large
|
| In the text | |
| |
Figure 14:
Mass
|
| In the text | |
![\begin{figure}
\par\includegraphics[width=9cm,clip]{11608f15.eps}
\end{figure}](/articles/aa/full_html/2009/29/aa11608-08/img178.png) |
Figure 15:
Torque exerted on the planet as a function of time, during
its migration, by all the disc ( bottom, solid line), the Hill sphere
(dashed line b=1.0), the inner |
| In the text | |
| |
Figure 16:
Mass
|
| In the text | |
![\begin{figure}
\par\includegraphics[width=\linewidth,angle=0]{11608f17.eps}
\end{figure}](/articles/aa/full_html/2009/29/aa11608-08/img182.png) |
Figure 17:
Torque exerted on the planet as a function of time, during
its migration, by all the disc ( bottom, solid line), the Hill sphere
(dashed line b=1.0), the inner |
| In the text | |
![\begin{figure}
\par\includegraphics[width=9cm,clip]{11608f18cmyk.eps} \includegraphics[width=9cm,clip]{11608f19cmyk.eps}
\end{figure}](/articles/aa/full_html/2009/29/aa11608-08/img190.png) |
Figure 18:
Top: surface density contour at 300 orbits for the
middle-resolution run with the Saturn-mass planet. The planet and
its Hill sphere are respectively represented by the + symbol and
the dashed circle. The grid mesh is superimposed, as well as
streamlines in the planet's frame. Bottom: same as the top panel,
except the quantity
|
| In the text | |
| |
Figure 19: Same as Fig. 18, but for the very-high-resolution run, just before the release of the planet at 475 orbits. To improve legibility, the grid mesh is not displayed. |
| In the text | |
Copyright ESO 2009
Current usage metrics show cumulative count of Article Views (full-text article views including HTML views, PDF and ePub downloads, according to the available data) and Abstracts Views on Vision4Press platform.
Data correspond to usage on the plateform after 2015. The current usage metrics is available 48-96 hours after online publication and is updated daily on week days.
Initial download of the metrics may take a while.