| Issue |
A&A
Volume 502, Number 2, August I 2009
|
|
|---|---|---|
| Page(s) | 599 - 603 | |
| Section | Interstellar and circumstellar matter | |
| DOI | https://doi.org/10.1051/0004-6361/200811359 | |
| Published online | 04 June 2009 | |
Heavy ion irradiation of condensed CO2: sputtering and molecule formation
E. Seperuelo Duarte1,2,3 - P. Boduch1 - H. Rothard1 - T. Been1 - E. Dartois4 - L. S. Farenzena5 - E. F. da Silveira2
1 - Centre de Recherche sur les Ions, les Matériaux et la Photonique (CEA /CNRS /ENSICAEN /Université de Caen-Basse Normandie), CIMAP - CIRIL
- Ganil, Boulevard Henri Becquerel, BP 5133, 14070 Caen Cedex 05, France
2 - Physics Department, Pontifícia Universidade Católica, Rua Marquês de
S. Vicente 225, 22453-900 Rio de Janeiro, Brazil
3 - Grupo de Física e Astronomia - CEFET/Química de Nilópolis, Rua Lúcio Tavares 1045, Centro,
26530-060 Nilópolis, Brazil
4 - Institut d'Astrophysique Spatiale, Astrochimie Expérimentale, UMR-8617 Université Paris-Sud, bâtiment 121, 91405
Orsay, France
5 - Physics Department, Universidade Federal de Santa Catarina, Florianópolis, SC, Brazil
Received 16 November 2008 / Accepted 28 April 2009
Abstract
Context. Ices present in different astrophysical environments are exposed to ion irradiation from cosmic rays (H to heavier than Fe) in the keV to GeV energy range.
Aims. The objective of this work is to study the effects produced in astrophysical ices by heavy ions at relatively high energies (MeV) in the electronic energy loss regime and compare them with those produced by protons.
Methods. C18O2 was condensed on a CsI substrate at 13 K and it was irradiated by 46 MeV 58Ni11+ up to a final fluence of
![]() cm-2 at a flux of
cm-2 at a flux of
![]() cm-2 s-1. The ice was analyzed in situ by infrared spectroscopy (FTIR) in the
5000-600 cm-1 range.
cm-2 s-1. The ice was analyzed in situ by infrared spectroscopy (FTIR) in the
5000-600 cm-1 range.
Results. The CO2 destruction was observed, as well as the formation of other species such as CO, CO3, O3, and C3. The destruction cross section of CO2 is found to be
![]() cm2, while those for the formation of CO, CO3, and O3 molecules are
cm2, while those for the formation of CO, CO3, and O3 molecules are
![]() cm2,
cm2,
![]() cm2, and
cm2, and
![]() cm2, respectively. The sputtering yield of the CO2 ice is
cm2, respectively. The sputtering yield of the CO2 ice is
![]() molecules/impact, four orders of magnitude higher than for H projectiles at the same velocity. This allows us to estimate the contribution of the sputtering by heavy ions as compared to protons in the solar winds and in cosmic rays.
molecules/impact, four orders of magnitude higher than for H projectiles at the same velocity. This allows us to estimate the contribution of the sputtering by heavy ions as compared to protons in the solar winds and in cosmic rays.
Conclusions. The present results show that heavy ions play an important role in the sputtering of astrophysical ices. Furthermore, this work confirms the quadratic stopping power dependence of sputtering yields.
Key words: molecular data - molecular processes - methods: laboratory - techniques: spectroscopic
1 Introduction
Interstellar ice grain mantles consist of small molecules containing hydrogen, carbon, nitrogen and oxygen atoms. In the solar system, condensed gases are also found in comets, rings, and cold satellites. Among the interstellar ices, H2O, CO, and CO2 are the most abundant materials (e.g. van Dishoeck 2004; Gibb et al. 2004; Dartois 2005; Pontoppidan et al. 2008). Therefore, these particular ices are widely studied (Jenniskens & Blake 1994; d'Hendecourt & Allamandola 1986; van Broekhuizen et al. 2006; Wood & Roux 1982; Ehrenfreund et al. 1996; Falk 1986). The occurrence of molecular synthesis in these astrophysical ices by cosmic rays, solar wind, UV radiation, and electron collision has been the object of research over the last decades (e.g. Hudson & Moore 1999; Palumbo et al. 1998; Ponciano et al. 2005; Farenzena et al. 2005; Gerakines et al. 2000; Baragiola et al. 2008; Lafosse et al. 2006). Ion beam irradiation leads to energy deposition on electrons (electronic stopping power) and on the target nuclei (nuclear stopping power). This in turn causes on the one hand the ejection of particles (electron emission, sputtering of neutrals and ions), and, on the other hand, material modification (chemical reactions and phase changes). Here, we focus our study on high energy particles in the electronic energy loss regime. In space, this kind of particles is present in interstellar cosmic rays (e.g. Webber & Yushak 1983; Boezio et al. 1999) and in other astrophysical objects or phases, like protoplanetary disks, stellar winds and supernovae shocks (e.g. Jones et al. 1996, 2000).
The formation of solid CO2 and its evolution are still under debate in the literature (Roser et al. 2001; Pontoppidan et al. 2008). Laboratory experiments show that CO2 can be formed from a CO ice when it is exposed to UV, and also by ion irradiation (Loeffler et al. 2005; Jamieson et al. 2006; d'Hendecourt et al. 1986; Grim et al. 1989; Allamandola et al. 1997; Gerakines et al. 1996; Moore et al. 1991). The opposite situation also occurs: CO is produced when a CO2 ice is irradiated by energetic particles (Strazzulla et al. 2005). The energetic particle abundance (mainly H to Fe) in cosmic rays and solar wind has been the subject of research to understand their production mechanisms and their effects on cosmic bodies (Mewaldt et al. 2007). Although the flux of Fe nuclei is three orders of magnitude lower than that of protons, their effects may play an important role because they are multicharged and their stopping power in matter may be up to two orders of magnitude higher. In order to understand the effects of swift heavy ions on ice, it is necessary to measure their sputtering yields and reaction cross sections and then compare them to those caused by H flux. Here, we present first Fourier Transform InfraRed (FTIR) measurements of condensed C18O2 irradiated by heavy projectiles at high energies (46 MeV 58Ni11+) for which the electronic energy loss dominates. For the same velocity, the target ionizing effects of Ni and Fe projectiles are almost identical.
In space, protons are the most abundant ions present in the solar wind and galactic cosmic rays. Mewaldt et al. (2007) measured the velocity
distribution of helium, oxygen, and iron fluences in the solar wind. The data cover a velocity range from 102 eV/u to 109 eV/u. For the
galactic cosmic rays, Shen et al. (2004) calculated velocity distributions for proton, oxygen, and iron fluxes. The velocity range was from
106 eV/u to 1011 eV/u. In both environments, the proton abundance is three orders of magnitude higher than iron abundance. However, the
sputtering produced by these particles is velocity dependent. To compare the contribution of protons and heavy ions to sputter ices in astrophysical
environments, the specific sputtering flux (SSF), defined as the product of each ion flux in cosmic rays and solar wind by its corresponding
sputtering yield on ice, should be considered. Using the relation
![]() ,
with
,
with
![]() being the electronic stopping
power, found by Brown et al. (1982) and supported by the present experimental data, Y was calculated as a function of projectile velocity using SRIM.
The SSF as a function of velocity squared is presented in Fig. 1 for solar wind particles as well as for galactic cosmic rays. The ratio between Ni
and Fe was taken from Karrer et al. (2007).
being the electronic stopping
power, found by Brown et al. (1982) and supported by the present experimental data, Y was calculated as a function of projectile velocity using SRIM.
The SSF as a function of velocity squared is presented in Fig. 1 for solar wind particles as well as for galactic cosmic rays. The ratio between Ni
and Fe was taken from Karrer et al. (2007).
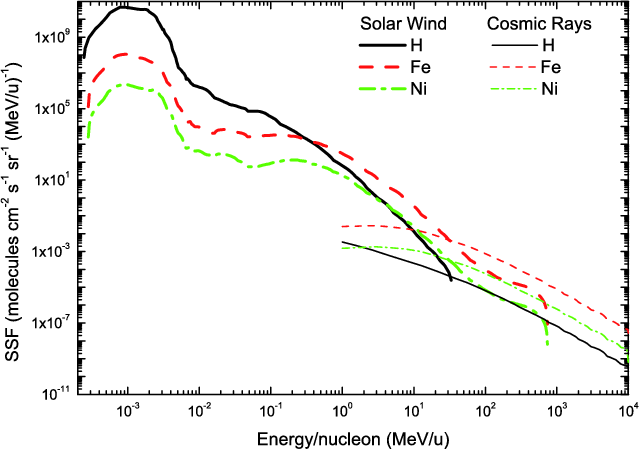 |
Figure 1: Specific sputtering flux for H, Fe, and Ni ions in solar wind and cosmic rays. Ions are supposed to be in their respective charge states. |
For solar wind particles, the specific sputtering flux can be divided in two regions: (i) for squared velocities lower than 0.3 MeV/u, the SSF produced by protons is dominant; and (ii) for higher velocities, heavy ions become more important. In the case of cosmic rays in dense clouds, the SSF of heavy ions are dominant in the whole velocity range considered. Therefore, further studies of swift heavy ions irradiation on astrophysical ices are need.
2 Experimental
The sketch of the experimental set-up is presented in Fig. 2. The 46 MeV 58Ni11+ ion projectiles produced by the IRRSUD beamline of the
heavy ion accelerator GANIL (Grand Accélérateur National d'Ions Lourds) impinge perpendicularly to the ice target. The procedure to ensure a precise
dosimetry (determination of the ion flux within ![]() 10%) is as follow: the ion beam is swept horizontally and vertically by means of sweeping
magnets. These are operated with saw tooth shaped pulses at very different frequencies (about 3 Hz and 300 Hz) in order to homogenously distribute
the single ion impacts over the irradiated surface. A set of slits, situated between the sweeping device and the target, allows measurement of the
current and thus the number of ions stopped by the slits. A Faraday cup can be inserted in front of the target and allows measurement of the number
of ions that would impact on the target. Since the swept ion beam radiation field is homogenous, the ratio of the current measured on the slits and
in the Faraday cup is constant (even if variations in the absolute intensity of the beam occur). When the Faraday cup is removed and the beam
impinges on the target, the flux of ions can thus be calculated from the ion beam current measured on the slits.
10%) is as follow: the ion beam is swept horizontally and vertically by means of sweeping
magnets. These are operated with saw tooth shaped pulses at very different frequencies (about 3 Hz and 300 Hz) in order to homogenously distribute
the single ion impacts over the irradiated surface. A set of slits, situated between the sweeping device and the target, allows measurement of the
current and thus the number of ions stopped by the slits. A Faraday cup can be inserted in front of the target and allows measurement of the number
of ions that would impact on the target. Since the swept ion beam radiation field is homogenous, the ratio of the current measured on the slits and
in the Faraday cup is constant (even if variations in the absolute intensity of the beam occur). When the Faraday cup is removed and the beam
impinges on the target, the flux of ions can thus be calculated from the ion beam current measured on the slits.
The thin ice film was prepared by condensation of C18O2 gas
(purity 97.7%, Euriso-top) onto a CsI substrate. The 18O
isotope-enriched ice was selected because, on the one hand, its chemistry is expected to be the same as that of 16O, and on the other hand,
experiments with H2O+CO2 ice are planned in the near future and labeled compounds are useful to follow the chemical reactions on the
target. The thermal contact with the holder is maintained by indium rings. The copper holder is attached to a closed-cycle helium cryostat. The
system is situated in a high-vacuum chamber (
![]() mbar at room temperature and
mbar at room temperature and ![]()
![]() mbar at low
temperature). The temperature is controlled by two sensors: a carbon resistance and a compound linear thermal sensor (CLTS) situated on the holder,
providing a precision of 0.1 K.
mbar at low
temperature). The temperature is controlled by two sensors: a carbon resistance and a compound linear thermal sensor (CLTS) situated on the holder,
providing a precision of 0.1 K.
The column density (initially
![]() molecules/cm2) was estimated from the first order relation
molecules/cm2) was estimated from the first order relation

where
The electronic and nuclear stopping powers predicted by SRIM (Ziegler & Biersack 2006) are
![]() eV/(1015 molecules/cm2) and
8.7 eV/(1015 molecules/cm2), respectively, for the 46 MeV 58Ni11+ ion beam. Note that this electronic stopping power is close to
the maximum possible energy loss for an Ni projectile.
eV/(1015 molecules/cm2) and
8.7 eV/(1015 molecules/cm2), respectively, for the 46 MeV 58Ni11+ ion beam. Note that this electronic stopping power is close to
the maximum possible energy loss for an Ni projectile.
Table 1: Peak position and assignments for unirradiated C18O2 ice.
3 Results and discussion
IR spectra of both unirradiated and irradiated C18O2 are shown in Fig. 3 in the 4500-600 cm-1 region. The position of the
C18O2 observed lines and its associated assignments are presented in
Table 1. New lines appeared in the IR spectra due to ion irradiation.
The main lines are associated with the ![]() vibration of CO molecules at
2140 cm-1 (16O) and 2088 cm-1 (18O). The bands of
O3, C3 and CO3 molecules are also observed at 989 cm-1,
2039 cm-1 and 2008 cm-1, respectively. These radiolysis
products present a maximum column density at
vibration of CO molecules at
2140 cm-1 (16O) and 2088 cm-1 (18O). The bands of
O3, C3 and CO3 molecules are also observed at 989 cm-1,
2039 cm-1 and 2008 cm-1, respectively. These radiolysis
products present a maximum column density at
![]() ions cm-2 except CO3 for which the maximum occurs at
ions cm-2 except CO3 for which the maximum occurs at
![]() ions cm-2 (Fig. 4).
ions cm-2 (Fig. 4).
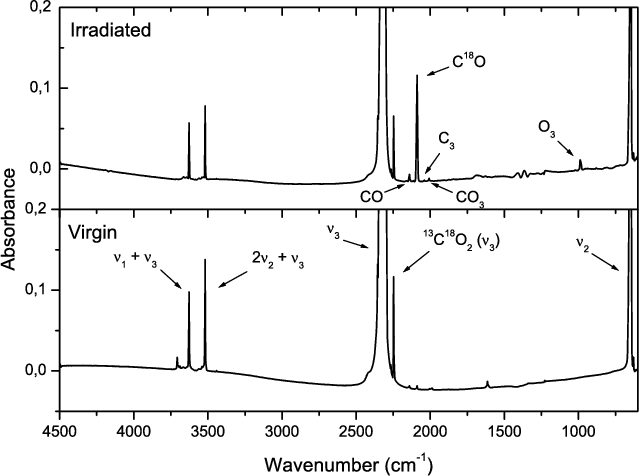 |
Figure 3:
C18O2 spectra before ( bottom) and after
( top) the irradiation of
|
Table 2: Maximum column densities and the respective band strength for the species identified in this work.
The band areas were measured and converted to column densities using Eq. (1). These values and the corresponding maximum column densities for the
species identified in this work are presented in Table 2. After a
![]() ions cm-2 fluence, these lines disappear, indicating that
the sputtering effect of the incoming projectile is important.
ions cm-2 fluence, these lines disappear, indicating that
the sputtering effect of the incoming projectile is important.
Figure 5 presents the evolution of the CO2 column density as a function of fluence. The figure presents two regimes: the first one for
![]() cm-2, and the second one above this value.
cm-2, and the second one above this value.
3.1 First regime
For this regime, two approaches were used to understand which processes occur during irradiation. In the first model, the projectile breaks the
molecules and their fragments stay inside the ice. In this case, the CO2 column density varies exponentially as a function of fluence (Fig. 5,
curve a). The obtained destruction cross section is
![]() cm2. At low fluences, the data and the fit are in good agreement,
showing that the CO2 destruction is obviously the main physical process. However, for
cm2. At low fluences, the data and the fit are in good agreement,
showing that the CO2 destruction is obviously the main physical process. However, for
![]() cm-2, the column density
deviates from exponential behavior. This indicates the existence of a second process. In heavy ion irradiation of materials, sputtering is an
important effect (Toulemonde et al. 2003) leading to sputtering yields as high as up to 105 atoms per incoming ion in the electronic sputering
regime. In the second model studied, sputtering was included and the differential equation describing the column density variation as a function of
fluence (d
cm-2, the column density
deviates from exponential behavior. This indicates the existence of a second process. In heavy ion irradiation of materials, sputtering is an
important effect (Toulemonde et al. 2003) leading to sputtering yields as high as up to 105 atoms per incoming ion in the electronic sputering
regime. In the second model studied, sputtering was included and the differential equation describing the column density variation as a function of
fluence (d
![]() )
is
)
is
where
Equation (3) was used to fit the evolution of the C18O2 column density (Fig. 5, curve b) for the first regime. For this fluence domain, the agreement between the experimental data and the fitting is excellent. The corresponding destruction cross section and sputtering yield are
The interaction between a fast heavy ion and an ice target is complex and partial scenarios may be set up by considering successive aspects of the
phenomenon. Since we are in the electronic energy loss domain, most of the deposited energy leads to excitation of target electrons. In turn, the
electrons thus liberated transfer their kinetic energy to the surrounding condensed molecules. The re-neutralization of the track proceeds
concomitantly with the local temperature rise, leading to an eventual sublimation. A first approach consists of considering that all the energy lost
by the projectile to the target is driven uniquely into thermal motion. For a given ice volume
![]() (S being the track area)
heated by the beam, the (homogenously) transferred energy can be written as
(S being the track area)
heated by the beam, the (homogenously) transferred energy can be written as
where d
3.2 Second regime
The second regime is interpreted as a failure of the
d
![]() condition, a consequence of the fact that the projectile is not impacting
onto a CO2 virgin region any longer. This occurs when the column density becomes lower than
condition, a consequence of the fact that the projectile is not impacting
onto a CO2 virgin region any longer. This occurs when the column density becomes lower than
![]() molecules/cm2, attained for fluences higher than
molecules/cm2, attained for fluences higher than
![]() projectiles/cm2. Under such conditions, the CO2 ice
thickness (660 nm, at the beginning of irradiation) decreases considerably and surface and bulk interactions cannot be treated independently. Y is
not constant any longer and starts to be dependent on the column density of the CO2, either because the density of new molecular species has
become relatively high or because the ice surface is now too close to the substrate and the effects of projectile-substrate interaction can
intervene. Since the second regime seems to exhibit an exponential decay, an ``extra'' cross section
projectiles/cm2. Under such conditions, the CO2 ice
thickness (660 nm, at the beginning of irradiation) decreases considerably and surface and bulk interactions cannot be treated independently. Y is
not constant any longer and starts to be dependent on the column density of the CO2, either because the density of new molecular species has
become relatively high or because the ice surface is now too close to the substrate and the effects of projectile-substrate interaction can
intervene. Since the second regime seems to exhibit an exponential decay, an ``extra'' cross section
![]() can be extracted from data to cover
the mentioned overall effects. The fact that
can be extracted from data to cover
the mentioned overall effects. The fact that
![]() can be partially attributed to the increasing density of free radicals in
the ice produced by the beam.
can be partially attributed to the increasing density of free radicals in
the ice produced by the beam.
3.3 Formation of molecules
From the evolution of column density as a function of fluence (Fig. 4) the formation cross sections of CO, CO3, and O3 molecules were determined. Since at the beginning of the experiment the sputtering is negligible for these molecules, the main process occurring in the ice is the molecule formation. The corresponding cross sections can be then obtained directly from the slope of each curve from the first four points. The estimated cross sections are presented in Table 3.
Table 3: Cross sections for the CO, O3, CO3, and C3 molecule formation.
CO molecule production has the highest cross section, showing that CO are the main species produced observable by FTIR spectroscopy; CO2dissociation occurs mainly via the CO
![]() pathway. The formation cross sections of the other molecules are one order of
magnitude lower. In particular, the C3 line was too weak to determine the associated cross section. Therefore, carbonization, although it exists
(Strazzulla et al. 2005), is of minor importance here.
pathway. The formation cross sections of the other molecules are one order of
magnitude lower. In particular, the C3 line was too weak to determine the associated cross section. Therefore, carbonization, although it exists
(Strazzulla et al. 2005), is of minor importance here.
4 Conclusions
18O-labelled condensed CO2 at 13 K was bombarded with 46 MeV 58Ni11+. Irradiation causes formation of CO, O3, CO3, and
C3 molecules in the ![]() 0.66
0.66 ![]() m thick CO2 matrix. The ice essentially disappears after a fluence of
m thick CO2 matrix. The ice essentially disappears after a fluence of
![]() particles/cm2. From the present measurements, some relevant projectile-ice parameters were extracted: i) the total sputtering yield of 0.8 MeV/u
Ni11+ on CO2 ice is
particles/cm2. From the present measurements, some relevant projectile-ice parameters were extracted: i) the total sputtering yield of 0.8 MeV/u
Ni11+ on CO2 ice is
![]() molecules/impact; ii) the CO2 destruction cross section is
molecules/impact; ii) the CO2 destruction cross section is
![]() cm2; and
iii) the CO, O3, and CO3 production cross sections are
cm2; and
iii) the CO, O3, and CO3 production cross sections are
![]() cm2,
cm2,
![]() cm2, and
cm2, and
![]() cm2, respectively. Heavy ion cosmic rays, such as Fe and Ni ions, have an important role in sputtering of astrophysical ices.
cm2, respectively. Heavy ion cosmic rays, such as Fe and Ni ions, have an important role in sputtering of astrophysical ices.
Acknowledgements
The authors acknowledge the agencies COFECUB (France) as well as CAPES, CNPq and FAPERJ (Brazil) for partial support. It is a pleasure to thank E. Balanzat, Y. Ngono-Ravache, M. Ferry, and I. Monnet for technical assistance. Special thanks to A. Domaracka for carefully reading and commenting on the manuscript. In addition, the authors would like to acknowledge the referee for pertinent suggestions in order to improve this manuscript.
References
- Allamandola, L. J., Bernstein, M. P., & Sandford, S. A. 1997, Proceedings of the 5th international conference on bioastronomy, IAU Coll., 161, 23 (In the text)
- Baragaiola, R. A. 2005, Nucl. Instr. Meth. B, 232, 98 [NASA ADS] [CrossRef]
- Baragiola, R. A., Fama, M., Loeffler, M. J., Raut, U., & Shi, J. 2008, Nucl. Instr. Meth. B, 266, 3057 [NASA ADS] [CrossRef] (In the text)
- Boezio, M., Carlson, P., Francke, T., et al. 1999, ApJ, 518, 457 [NASA ADS] [CrossRef] (In the text)
- Brena, B., Nordlund, D., Odelius, M., et al. 2004, Phys. Rev. Lett., 93, 14 [CrossRef]
- Brown, W. L., Augustyniak, W. M., Simmons, et al. 1982, Nucl. Instr. Meth., 198, 1 [NASA ADS] [CrossRef] (In the text)
- van Broekhuizen, F. A., Groot, I. M. N., Fraser, H. J., van Dishoeck, E. F., & Schlemmer, S. 2006, A&A, 451, 723 [NASA ADS] [CrossRef] [EDP Sciences] (In the text)
- Dartois, E. 2005, Space Sci. Rev., 119, 293 [NASA ADS] [CrossRef] (In the text)
- van Dishoeck, E. F. 2004, ARA&A, 42, 119 [NASA ADS] [CrossRef] (In the text)
- Ehrenfreund, P., Boorgert, A. C. A., Gerakines, P. A., et al. 1996, A&A, 315, L341 [NASA ADS] (In the text)
- Falk, M. 1986, J. Chem. Phys., 86, 560 [NASA ADS] [CrossRef] (In the text)
- Farenzena, L. S., Isa, P., Martinez, et al. 2005, Earth, Moon, and Planets, 97, 311 (In the text)
- Farenzena, L. S., Ponciano, C. R., da Silveira, E. F., & Wien, K. 2005, Int. J. Mass Spectrom., 243, 85 [CrossRef]
- Farenzena, L. S., Martinez, R., Iza, P., et al. 2006, Int. J. Mass Spectrom., 251, 1 [CrossRef]
- Gerakines, P. A., Schutte, W. A., Greenberg, J. M., & van Dishoeck, E. F. 1995, A&A, 296, 810 [NASA ADS] (In the text)
- Gerakines, P. A., Schutte, W. A., & Ehrenfreund, P. 1996, A&A, 312, 289 [NASA ADS] (In the text)
- Gerakines, P. A., Moore, M. H., & Hudson, R. L. 2000, A&A, 357, 793 [NASA ADS] (In the text)
- Gibb, E. L., Whittet, D. C. B., Boogert, A. C. A., & Tielens, A. G. G. M. 2004, ApJS, 151, 35 [NASA ADS] [CrossRef] (In the text)
- Grim, R. J. A., Greenberg, J. M., de Groot, M. S., et al. 1989, A&AS, 78, 161 [NASA ADS] (In the text)
- d' Hendecourt, L. B., & Allamandola, L. J. 1986, A&A, 64, 453 [NASA ADS] (In the text)
- Handbook of Chemistry and Physics-CRC Press- Boca Raton, 1996
- Hudson, R. L., & Moore, M. H. 1999, Icarus, 140, 451 [NASA ADS] [CrossRef] (In the text)
- Hutter, J., Lüthi, H. P., & Diederich, F. 1994, J. Am. Chem. Soc., 116, 750 [CrossRef]
- Jamieson, C. S., Mebel, A. M., & Kaiser, R. I. 2006, ApJS, 163, 184 [NASA ADS] [CrossRef] (In the text)
- Jenniskens, P., & Blake, D. F. 1994, Science, 265, 753 [NASA ADS] [CrossRef] (In the text)
- Jones, A. 2000, Atomic and Molecular Data for Astrophysics: New Developments, Case Studies and Future Needs, 24th meeting of the IAU, Joint Discussion 1, August 2000, Manchester, England, meeting abstract., 1, (In the text)
- Jones, A. P., Tielens, A. G. G. M., & Hollenbach, D. J. 1996, ApJ, 469, 740 [NASA ADS] [CrossRef] (In the text)
- Karrer, R., Bochsler, P., Giammanco, C., et al. 2007, Space Sci. Rev., 130, 317 [NASA ADS] [CrossRef] (In the text)
- Lafosse, A., Bertin, M., Domaracka, A., et al. 2006, Phys. Chem. Chem. Phys., 8, 5564 [CrossRef] (In the text)
- Loeffler, M. J., Baratta, G. A., Palumbo, M. E., Strazzulla, G., & Baragiola, R. A. 2005, A&A, 435, 587 [NASA ADS] [CrossRef] [EDP Sciences] (In the text)
- Mewaldt, R. A., Cohen, C. M. S., Mason, G. M., Haggerty, D. K., & Desai, M. I. 2007, Space Sci. Rev., 130, 323 [NASA ADS] [CrossRef] (In the text)
- Moore, M. H., Khanna, R., & Donn, B. 1991, J. Geophys. Res., 96, 17541 [NASA ADS] [CrossRef] (In the text)
- Palumbo, M. E., Baratta, G. A., Brucato, J. R., et al. 1998, A&A, 334, 247 [NASA ADS] (In the text)
- Pinchas, S., & Laulicht, I. 1971, Infrared Spectra of Labelled Compounds (London and New York: Academic Press)
- Ponciano, C. R., Farenzena, L. S., Collado, V. M., da Silveira, E. F., & Wien, K. 2005, Int. J. Mass Spectrom., 244, 41 [CrossRef] (In the text)
- Ponciano, C. R., Martinez, R., Farenzena, L. S., et al. 2006, J. Am. Mass Spectrom., 17, 1120 [CrossRef] (In the text)
- Ponciano, C. R., Martinez, R., Farenzena, et al. 2008, J. Mass Spectrom., 43, 1521 [CrossRef]
- Pontoppidan, K. M., Boogert, A. C. A., Fraser, H. J., et al. 2008, ApJ, 678, 1005P [NASA ADS] [CrossRef] (In the text)
- Roser, J. E., Vidali, G., Manicò, G., & Pirronello, V. 2001, ApJ, 555, 61 [NASA ADS] [CrossRef] (In the text)
- Schmidt, R., Schoppmann C., Brandl, D., et al. 1991, Phys. Rev. B, 44, 2 [CrossRef]. (In the text)
- Shen, C. J., Greenberg, J. M., Schutte, W. A., & van Dishoeck, E. F. 2004, A&A, 415, 203 [NASA ADS] [CrossRef] [EDP Sciences] (In the text)
- Strazzulla, G., Leto, G., LaDelfa, S., Spinella, F., & Gomis, O. 2005, Mem. S. A. It. Suppl., 6, 51 (In the text)
- Toulemonde, M., Assmann, W., Trautmann, C., et al. 2003, Nucl. Instr. Meth. Phys. Res. Sec. B, 212, 346 [NASA ADS] [CrossRef] (In the text)
- Webber, W. R., & Yushak, S. M. 1983, ApJ, 275, 391 [NASA ADS] [CrossRef] (In the text)
- Whittet, D. C. B., Shenoy, S. S., Bergin, E. A., et al. 2007, ApJ, 655, 332 [NASA ADS] [CrossRef]
- Wood, B. E., & Roux, J. A. 1982, J. Opt. Soc. Am., 72, 720 [NASA ADS] [CrossRef] (In the text)
- Ziegler, J. F., & Biersack, J. P. 2006, http://www.srim.org, version 2006.02 (In the text)
All Tables
Table 1: Peak position and assignments for unirradiated C18O2 ice.
Table 2: Maximum column densities and the respective band strength for the species identified in this work.
Table 3: Cross sections for the CO, O3, CO3, and C3 molecule formation.
All Figures
| |
Figure 1: Specific sputtering flux for H, Fe, and Ni ions in solar wind and cosmic rays. Ions are supposed to be in their respective charge states. |
| In the text | |
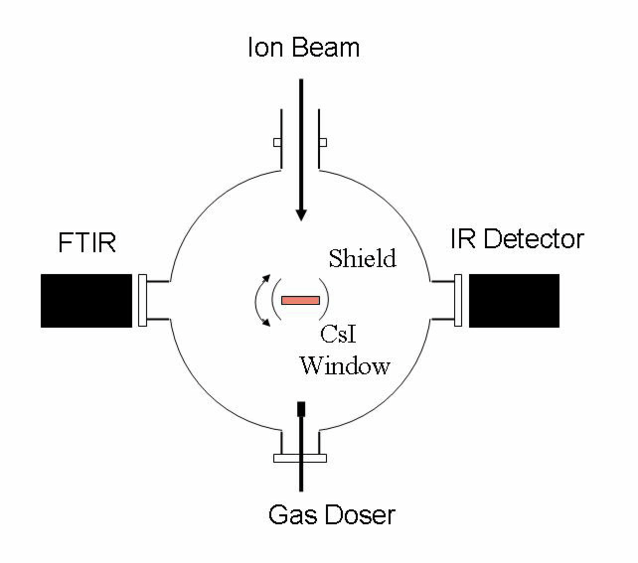 |
Figure 2:
A schematic representation of the experimental set-up. The ion beam impinges
perpendicularly on the thin film ice deposited on a CsI disk. After partial irradiation, the target is rotated 90 |
| In the text | |
| |
Figure 3:
C18O2 spectra before ( bottom) and after
( top) the irradiation of
|
| In the text | |
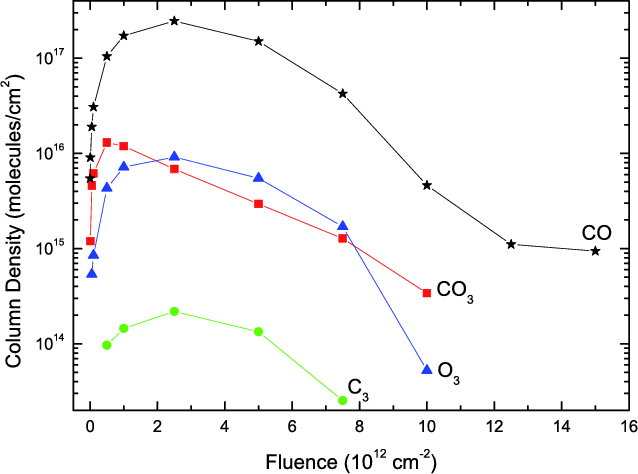 |
Figure 4: Column density of C18O, C18O3, C3 and 18O3molecules as a function of fluence. |
| In the text | |
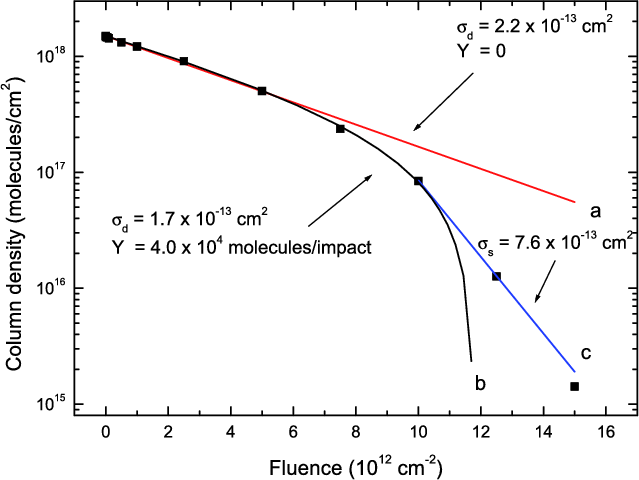 |
Figure 5:
Column density of 12C18O2 molecule as a function of fluence
calculated from the absorbance 2311 cm-1 line. The data are fitted by
Eq. (3) in the first regime and by
|
| In the text | |
Copyright ESO 2009
Current usage metrics show cumulative count of Article Views (full-text article views including HTML views, PDF and ePub downloads, according to the available data) and Abstracts Views on Vision4Press platform.
Data correspond to usage on the plateform after 2015. The current usage metrics is available 48-96 hours after online publication and is updated daily on week days.
Initial download of the metrics may take a while.