| Issue |
A&A
Volume 502, Number 1, July IV 2009
|
|
|---|---|---|
| Page(s) | 253 - 265 | |
| Section | Stellar structure and evolution | |
| DOI | https://doi.org/10.1051/0004-6361/200912362 | |
| Published online | 27 May 2009 | |
Absolute dimensions of solar-type eclipsing binaries![[*]](/icons/foot_motif.png)
II. V636 Centauri:
A 1.05 M
 primary with an active, cool, oversize
0.85 M
secondary
primary with an active, cool, oversize
0.85 M
secondary
J. V. Clausen1 - H. Bruntt1,2 - A. Claret3 - A. Larsen1 - J. Andersen1,4 - B. Nordström1 - A. Giménez5
1 - Niels Bohr Institute, Copenhagen University,
Juliane Maries Vej 30,
2100 Copenhagen Ø, Denmark
2 -
Sydney Institute for Astronomy, School of Physics, University of Sydney,
NSW 2006, Australia
3 -
Instituto de Astrofísica de Andalucía, CSIC,
Apartado 3004, 18080 Granada, Spain
4 -
Nordic Optical Telescope Scientific Association, Apartado 474, 38 700
Santa Cruz de La Palma, Spain
5 -
Centro de Astrobiologia (CSIC/INTA),
28 850 Torrejon de Ardoz, Madrid, Spain
Received 21 April 2009 / Accepted 9 May 2009
Abstract
Context. The influence of stellar activity on the fundamental properties of stars around and below 1 ![]() is not well understood. Accurate mass, radius, and abundance determinations from solar-type binaries exhibiting various levels of activity are needed for a better insight into the structure and evolution of these stars.
is not well understood. Accurate mass, radius, and abundance determinations from solar-type binaries exhibiting various levels of activity are needed for a better insight into the structure and evolution of these stars.
Aims. We aim to determine absolute dimensions and abundances for the solar-type detached eclipsing binary V636 Cen, and to perform a detailed comparison with results from recent stellar evolutionary models.
Methods.
![]() light curves and
light curves and
![]() standard photometry were obtained with the Strömgren Automatic Telescope, radial velocity observations with the CORAVEL spectrometer, and high-resolution spectra with the FEROS spectrograph, all at ESO, La Silla. State-of-the-art methods were applied for the photometric and spectroscopic analyses.
standard photometry were obtained with the Strömgren Automatic Telescope, radial velocity observations with the CORAVEL spectrometer, and high-resolution spectra with the FEROS spectrograph, all at ESO, La Silla. State-of-the-art methods were applied for the photometric and spectroscopic analyses.
Results. Masses and radii that are precise to 0.5% have been established for the components of V636 Cen. The 0.85 ![]() secondary component is moderately active with starspots and Ca II H and K emission, and the 1.05
secondary component is moderately active with starspots and Ca II H and K emission, and the 1.05 ![]() primary shows signs of activity as well, but at a much lower level. We derive a
primary shows signs of activity as well, but at a much lower level. We derive a
![]() abundance of
abundance of
![]() and similar abundances for Si, Ca, Ti, V, Cr, Co, and Ni. Corresponding solar-scaled stellar models are unable to reproduce V636 Cen, especially its secondary component, which is
and similar abundances for Si, Ca, Ti, V, Cr, Co, and Ni. Corresponding solar-scaled stellar models are unable to reproduce V636 Cen, especially its secondary component, which is ![]() 10% larger and
10% larger and ![]() 400 K cooler than predicted. Models adopting significantly lower mixing-length parameters
400 K cooler than predicted. Models adopting significantly lower mixing-length parameters
![]() remove these discrepancies, seen also for other solar-type binary components. For the observed
remove these discrepancies, seen also for other solar-type binary components. For the observed
![]() ,
Claret models for
,
Claret models for
![]() (primary) and 1.0 (secondary) reproduce the components of V636 Cen at a common age of 1.35 Gyr. The orbit is eccentric (
(primary) and 1.0 (secondary) reproduce the components of V636 Cen at a common age of 1.35 Gyr. The orbit is eccentric (
![]() ), and apsidal motion with a 40% relativistic contribution has been detected. The period is
), and apsidal motion with a 40% relativistic contribution has been detected. The period is
![]() yr, and the inferred mean central density concentration coefficient, log(k2) =
yr, and the inferred mean central density concentration coefficient, log(k2) =
![]() ,
agrees marginally with model predictions. The measured rotational velocities,
,
agrees marginally with model predictions. The measured rotational velocities,
![]() (primary) and
(primary) and
![]() (secondary) kms-1, are in remarkable agreement with the theoretically predicted pseudo-synchronous velocities, but are about 15% lower than the periastron values.
(secondary) kms-1, are in remarkable agreement with the theoretically predicted pseudo-synchronous velocities, but are about 15% lower than the periastron values.
Conclusions. V636 Cen and 10 other well-studied inactive and active solar-type binaries suggest that chromospheric activity, and its effect on envelope convection, is likely to cause radius and temperature discrepancies, which can be removed by adjusting the model mixing length parameters downwards. Noting this, the sample may also lend support to theoretical 2D radiation hydrodynamics studies, which predict a slight decrease of the mixing length parameter with increasing temperature/mass for
![]() main sequence stars. More binaries are, however, needed for a description/calibration in terms of physical parameters and level of activity.
main sequence stars. More binaries are, however, needed for a description/calibration in terms of physical parameters and level of activity.
Key words: stars: evolution - stars: fundamental parameters - Stars: abundances - stars: activity - stars: binaries: eclipsing - techniques: spectroscopic
1 Introduction
As pointed out by e.g. Hoxie (1973), Popper (1997), Clausen et al. (1999), Torres & Ribas (2002), Ribas (2003), Dawson & De Robertis (2004), and López-Morales & Ribas (2005), current stellar models, scaled to the Sun, are unable to reproduce the measured temperatures and radii for many binary components less massive the Sun. Such models tend to predict too high temperatures, and radii, which are up to 10% too small, compared to a measured accuracy of about 1% for several systems. The model luminosities seem, however, to agree fairly well with observations. Chromospheric activity has been suggested as a likely cause, and e.g. Gabriel (1969), Cox et al. (1981), Clausen et al. (1999), and Torres et al.(2006) have demonstrated that the model fits can be improved by using a reduced mixing-length parameter when calculating envelope convection. The latter authors also show that there is a link between activity and increased radii. Morales et al. (2008) find strong radius and temperature dependencies on stellar activity for both single and binary low-mass stars, and López-Morales (2007) finds correlation between activity level (X-ray emission level) and radius for faster rotating binary components, but not for slowly rotating single stars. On the theoretical side, Chabrier et al. (2007) have, via a phenomenological approach, examined the consequences on the evolution of low-mass stars and brown dwarf eclipsing binaries of a) inhibiting convection due to rotation and/or internal magnetic field, and b) the presence of surface magnetic spots.
The current situation is summarized by Ribas et al. (2008).
Clearly, accurate data for additional binaries are needed, as well as
more models, which include first of all dynamo magnetic fields and the
evolution of stellar rotation and activity (e.g. D'Antona et al.
2000).
We are presently studying several new systems with solar-type components,
either constant or exhibiting various levels of chromospheric activity
(e.g. Clausen et al. 2001), and in this paper, we present
results from a complete analysis of the F8/G0 V![]() system
V636 Cen = HD 124 784 = HIP 69 781.
system
V636 Cen = HD 124 784 = HIP 69 781.
2 V636 Cen
V636 Cen was discovered by Hoffmeister (1958) to be a
![]() period
eclipsing binary, and Popper (1966) reported sharp but single lines.
Today V636 Cen is known to be double-lined, but the lines of the secondary
component are much fainter than those of the primary.
V636 Cen is well detached with two quite different components in an eccentric
orbit (e = 0.135). Apsidal motion with a period of
period
eclipsing binary, and Popper (1966) reported sharp but single lines.
Today V636 Cen is known to be double-lined, but the lines of the secondary
component are much fainter than those of the primary.
V636 Cen is well detached with two quite different components in an eccentric
orbit (e = 0.135). Apsidal motion with a period of
![]() yr
has been detected (Clausen et al. 2008a, hereafter CVG08).
Signs of chromospheric activity (spots) are clearly present in the light
curves, but the level of the light variations is modest (CVG08).
Furthermore, we see emission from both
components in the Ca II H and K lines, whereas
yr
has been detected (Clausen et al. 2008a, hereafter CVG08).
Signs of chromospheric activity (spots) are clearly present in the light
curves, but the level of the light variations is modest (CVG08).
Furthermore, we see emission from both
components in the Ca II H and K lines, whereas
![]() emission is not noticed; see Sect. 3.
Chromospheric emission in the Ca II H and K lines was also observed
by Henry et al. (1996), and X-ray emission was detected
in the
emission is not noticed; see Sect. 3.
Chromospheric emission in the Ca II H and K lines was also observed
by Henry et al. (1996), and X-ray emission was detected
in the
![]() All-Sky Survey (Voges et al. 1999).
All-Sky Survey (Voges et al. 1999).
Our study is based on the first modern light curves and spectroscopic observations for V636 Cen; preliminary dimensions based on part of the data were derived by Larsen (1998). For the spectroscopic and photometric analyses of V636 Cen presented below, we have adopted the linear ephemeris by CVG08 (Eq. (4)). Throughout the paper, the component eclipsed at the deeper eclipse at phase 0.0 is referred to as the primary (p), and the other as the secondary (s) component.
3 Photometric elements
The uvby light curves of V636 Cen (CVG08) contain 853 observations in each band and were observed on 76 nights during six periods between March 1985 and April 1991. The number of observations per season are 8 (1985), 165 (1987), 261 (1988), 233 (1989), 17 (1990), and 169 (1991). Further eclipse observations, but none outside eclipses, were done on ten nights between January 2002 and July 2007, primarily to determine the apsidal motion period of the eccentric orbit. Primary eclipse is much deeper than secondary eclipse, which is total and occurs near phase 0.52.
The average observational accuracy per data point is about 5 mmag (![]() )
and
7 mmag (u), and the magnitude differences between the two comparison stars
were found to be constant at that level.
Additional scatter due to chromospheric activity (spots) is, however, clearly
seen in the light curves, with total amplitudes increasing from about 0.02
mag in y to about 0.04 mag in u, and changing somewhat from year to year.
We refer to Fig. 6 and Table 9 in CVG08 for further details.
)
and
7 mmag (u), and the magnitude differences between the two comparison stars
were found to be constant at that level.
Additional scatter due to chromospheric activity (spots) is, however, clearly
seen in the light curves, with total amplitudes increasing from about 0.02
mag in y to about 0.04 mag in u, and changing somewhat from year to year.
We refer to Fig. 6 and Table 9 in CVG08 for further details.
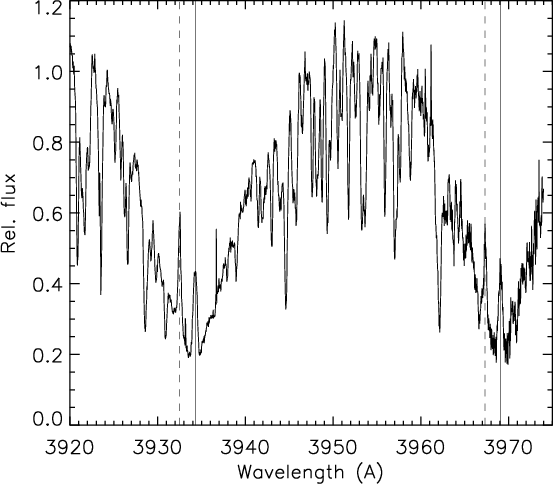 |
Figure 1: Ca II H and K emission in V636 Cen. The vertical lines show the positions for the primary (full) and secondary (dashed) components. The FEROS spectrum of V636 Cen was observed at JD2451211.85 (orbital phase 0.63). |
| Open with DEXTER | |
As mentioned in Sect. 1, Ca II H and K emission is present from both components. This is seen in two orders of two FEROS spectra from February 1999 (Table 6), and (dark) spots may therefore be present at the surface of both stars. Figure 1 illustrates that the emission features of the two components appear to have about the same strength, but since the primary dominates the total light of V636 Cen, the real emission from the secondary is by far the strongest.
Between 1987 and 1991, the depths of the total secondary eclipses were nearly
identical, whereas those of the primary eclipses differed significantly.
During this period, the activity must therefore have been dominated by
contributions from the secondary component. As mentioned below, this is
supported by frequency analyses of the out-of-eclipse data.
On the other hand, the depths of both eclipses varied from 2002 to 2006.
This is not due to the slow apsidal motion detected for V636 Cen, and must
be caused by spots at both stars during at least some of those years.
The Rossby![]() numbers for the primary and
secondary components are approximately 0.44 and 0.10, respectively. This
places the secondary in the range where other stars tend to show spot
activity and the primary close to onset of spottedness (Hall 1994).
numbers for the primary and
secondary components are approximately 0.44 and 0.10, respectively. This
places the secondary in the range where other stars tend to show spot
activity and the primary close to onset of spottedness (Hall 1994).
Table 1: Photometric solutions for V636 Cen from JKTEBOP analyses of the 1987 and 1988 light curve observations (426 points per band).
Out-of-eclipse phases were covered on several nights during 1987, 1988,
1989, and 1991. Frequency analyses of the corresponding data, done
separately for each year and band, reveal the existence of one significant
period per year. The results from the four bands agree
well, and the average periods and estimated uncertainties are
![]() (1987),
(1987),
![]() (1988),
(1988),
![]() (1989),
and
(1989),
and
![]() (1991).
They are all shorter than the orbital period
(1991).
They are all shorter than the orbital period
![]() ,
but transformed
to equatorial surface velocities they agree quite well with the observed
rotational velocities of both components (Sect. 4).
,
but transformed
to equatorial surface velocities they agree quite well with the observed
rotational velocities of both components (Sect. 4).
Based on this information on eclipse depths and periodicity of the out-of-eclipse variability, we conclude that the 1987-1991 surface activities can be modeled adequately by including a few dominating spots (or spot groups) on the surface of the secondary component.
We have used the Wilson-Devinney (WD) model and code for the analyses.
As described below, some initial analyses, which ignore surface activity,
were based on the JKTEBOP program.
We refer to Clausen et al. (2008b, hereafter CTB08) for references
and details on the binary models and codes, and on the general approach
applied.
In tables and text, we use the following symbols:
i orbital inclination;
r relative radius;
![]() ;
;
![]() surface potential;
u linear limb darkening coefficient;
y gravity darkening coefficient;
J central surface brightness;
L luminosity;
surface potential;
u linear limb darkening coefficient;
y gravity darkening coefficient;
J central surface brightness;
L luminosity;
![]() effective temperature.
effective temperature.
A linear limb darkening law has been assumed throughout with coefficients
adopted from Van Hamme (1993) and/or Claret (2000).
They differ by 0.02-0.10 only, leading to identical photometric elements
within errors.
Gravity darkening coefficients/exponents corresponding to convective
atmospheres were applied, and bolometric reflection albedo coefficients of 0.5
were chosen in the WD analyses, again due to convection. For JKTEBOP, the
simple bolometric reflection model was used.
The mass ratio between the components was kept at the spectroscopic value
(
![]() ). In order to model the spots properly, the
(very nearly spherical) components were assumed to rotate at the periods
determined from the frequency analyses mentioned above.
As initial analyses showed that the orbital eccentricity is not as well
constrained from the light curve analyses as from the spectroscopic orbit,
we have adopted the spectroscopic result throughout;
see Table 5.
The longitude of periastron
). In order to model the spots properly, the
(very nearly spherical) components were assumed to rotate at the periods
determined from the frequency analyses mentioned above.
As initial analyses showed that the orbital eccentricity is not as well
constrained from the light curve analyses as from the spectroscopic orbit,
we have adopted the spectroscopic result throughout;
see Table 5.
The longitude of periastron ![]() is then defined through
is then defined through
![]() from the well determined phase of central secondary eclipse, which did not change
significantly relative to primary eclipse during the light curve observations
from 1987 to 1991.
from the well determined phase of central secondary eclipse, which did not change
significantly relative to primary eclipse during the light curve observations
from 1987 to 1991.
Table 2: WD solutions from the 1987 light curve observations (165 per band).
As the activity level of V636 Cen is modest, it is appropriate to first analyse
the light curves without taking spots into account, and to adopt a simple
but adequate binary model/code like JKTEBOP, which allows easy determination
of realistic errors of the photometric elements from Monte Carlo simulations.
Since the average out-of-eclipse level of the 1991 observations is
significantly off, and since there are very few 1985 and 1990 observations,
these data sets were not included in the analyses.
Results from the combined 1987 and 1988 observations, which both cover all
phases well, are given in Table 1. Including also
the 1989 observations increases the scatter significantly but leads to
identical solutions within errors.
As seen, the results from the four bands agree remarkably well, and relative
radii with a realistic precision of about 1% are obtained.
Changing the adopted orbital eccentricity by +0.005, i.e. four times the error
of the spectroscopic result, decreases the relative radii of both components
by only 0.5%.
Adjusting e and ![]() leads to spurious results, due to
asymmetries in the observed light curves caused by spots.
As expected, photometric elements from similar WD analyses, not accounting for
spots, agree very well with those from JKTEBOP.
leads to spurious results, due to
asymmetries in the observed light curves caused by spots.
As expected, photometric elements from similar WD analyses, not accounting for
spots, agree very well with those from JKTEBOP.
Results from WD analyses of the 1987 and 1988 observations are presented in Tables 2 and 3, and out-of-eclipse comparisons in the y band are shown in Figs. 2 and 3. The activity is modeled by including two rather big spots at the surface of the secondary component. Most probably, this simplified approach does not represent the real surface structure in detail, but it reproduces the light variations quite closely, and somewhat better than if only one spot is included. Based on extensive tests, the spots were placed at the equator of the secondary component, and a ratio of 0.9 between the temperatures of spotted and unspotted areas was selected. Longitudes (LO) and angular radii (AR) of the spots were adjusted together with orbital and stellar parameters.
As seen, the eight independent WD solutions yield nearly identical relative
radii of the components, which are systematically about 1.5% smaller
than the JKTEBOP results (Table 1).
The orbital inclinations of the 1987 solutions are on average about
![]() higher than those from the 1988 solutions, but tests show that
the realistic error of i is at least 3-4 times larger than the formal
errors listed.
The luminosity ratios given in Tables 2 and 3, which for the sake of comparison do not include
the spots, agree well within realistic errors; we will return to
this point below.
For each year, the spot parameters from the four bands differ slightly, but
not more than can be expected from the simple approach we have adopted and the
limited number of observations available.
The two spots applied cover about 10% of the surface of the secondary
component.
Finally, the rms errors (
higher than those from the 1988 solutions, but tests show that
the realistic error of i is at least 3-4 times larger than the formal
errors listed.
The luminosity ratios given in Tables 2 and 3, which for the sake of comparison do not include
the spots, agree well within realistic errors; we will return to
this point below.
For each year, the spot parameters from the four bands differ slightly, but
not more than can be expected from the simple approach we have adopted and the
limited number of observations available.
The two spots applied cover about 10% of the surface of the secondary
component.
Finally, the rms errors (![]() )
of the fits to the observations are close
to the observational errors per data point.
)
of the fits to the observations are close
to the observational errors per data point.
Similar WD analyses of the 1989 observations were not successful. The ascending branch of secondary eclipse is not covered, and the level of activity seems to have changed during the last half of the observing period. Secondary eclipse was not covered in 1991, and very few 1985 and 1990 observations exist, so these data sets were not analysed.
Table 3: WD solutions from the 1988 light curve observations (261 per band). See Table 2.
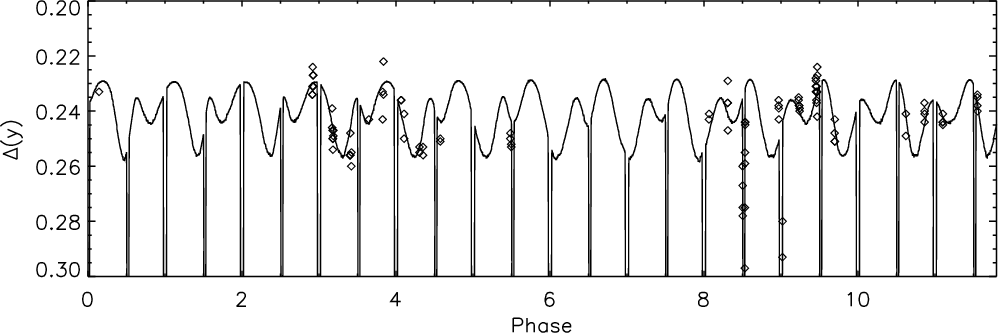 |
Figure 2: Fit of the theoretical light curve of the WD solution from Table 2 to the 1987 y observations. |
| Open with DEXTER | |
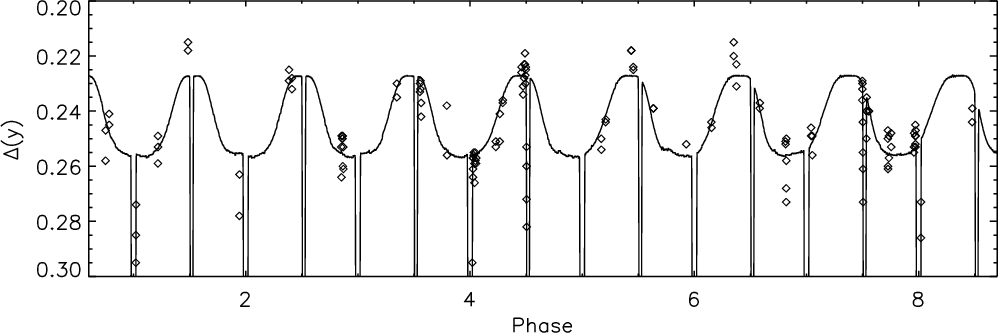 |
Figure 3: Fit of the theoretical light curve of the WD solution from Table 3 to the 1988 y observations. |
| Open with DEXTER | |
As a further test of the simple spot model adopted, it is of interest to compare the 1987 and 1988 light curves cleaned for spot effects. This is easily done by calculating, year by year and band per band, theoretical light curves with and without spots and then subtract the difference between them from the observations. First, the cleaned 1987 and 1988 light curves agree well, and second, JKTEBOP analyses of the combined cleaned data yield stellar radii, which are now in perfect agreement with those from the WD solutions. The orbital inclination is close to the mean of the 1987 and 1988 WD results.
The adopted photometric elements are presented in Table 4.
The main result of the photometric analyses is that we have, in spite of the
surface activity, been able to determine very accurate relative radii for
the components of V636 Cen. The system is well detached and the stars are quite
different, especially with respect to temperature and luminosity.
As seen, the orbital inclination is high, and consequently
secondary eclipse is total.
The luminosity ratios listed in Table 4 are based on the
mean stellar and orbital parameters and include the average spot level seen in
the 1987 and 1988 observations; errors reflect the difference between the
two years. This approach was adopted in order to allow calculation of realistic
![]() indices for the components; see Table 8.
Due to the spots on the surface of the secondary component, the ratio of the
light contributions outside eclipses of course change significantly through
the orbit. However, the b-y, m1, and c1 indices of the components
remain nearly unaffected.
indices for the components; see Table 8.
Due to the spots on the surface of the secondary component, the ratio of the
light contributions outside eclipses of course change significantly through
the orbit. However, the b-y, m1, and c1 indices of the components
remain nearly unaffected.
4 Spectroscopic orbit
Table 4: Adopted photometric elements for V636 Cen.
The radial velocity measurements of V636 Cen were obtained with the photoelectric cross-correlation spectrometer CORAVEL (Baranne et al. 1979; Mayor 1985) operated at the Danish 1.5-m telescope at ESO, La Silla. In total, 38 and 39 measurement were obtained for the primary and secondary components, respectively, on 30 nights between March 1986 and June 1989. The internal velocity errors range between 0.39 and 0.65 kms-1 (median 0.44 kms-1) for the primary component and between 0.71 and 1.81 kms-1 (median 0.88 kms-1) for the fainter secondary component. The observations, which cover the out-of-eclipse phases well, are listed in Table A.1.
The spectroscopic orbits were calculated using the method of
Lehman-Filhés implemented in the SBOP![]() program (Etzel 2004), which is a modified and expanded version of
an earlier code by Wolfe, Horak & Storer (1967).
Following several tests, we have decided to weight the individual radial
velocities according to the inverse square of their internal errors.
The SB1 and SB2 solutions for V636 Cen are given in Table 5, and the
observations and computed orbit are shown in Fig. 4.
As seen, the SB2 solution, which we adopt, agrees well with the individual
SB1 solutions.
The semiamplitudes yield minimum masses accurate to about 0.4% for both
components,
and the eccentricity and periastron longitude of the orbit are well constrained.
Also, the standard deviations of a single velocity agree well with the internal
median velocity errors.
program (Etzel 2004), which is a modified and expanded version of
an earlier code by Wolfe, Horak & Storer (1967).
Following several tests, we have decided to weight the individual radial
velocities according to the inverse square of their internal errors.
The SB1 and SB2 solutions for V636 Cen are given in Table 5, and the
observations and computed orbit are shown in Fig. 4.
As seen, the SB2 solution, which we adopt, agrees well with the individual
SB1 solutions.
The semiamplitudes yield minimum masses accurate to about 0.4% for both
components,
and the eccentricity and periastron longitude of the orbit are well constrained.
Also, the standard deviations of a single velocity agree well with the internal
median velocity errors.
The measured ![]() values are
values are
![]() kms-1 and
kms-1 and
![]() kms-1, respectively, with the velocity of the secondary
being more uncertain due to its much weaker lines.
These rotational velocities are supported by the frequency analyses of
the out-of-eclipse photometry described in Sect.3.
As discussed in Sect. 6, the rotation of the components
corresponds closely to pseudo-synchronization.
kms-1, respectively, with the velocity of the secondary
being more uncertain due to its much weaker lines.
These rotational velocities are supported by the frequency analyses of
the out-of-eclipse photometry described in Sect.3.
As discussed in Sect. 6, the rotation of the components
corresponds closely to pseudo-synchronization.
5 Abundances
For abundance determinations, we have obtained two high-resolution
spectra of V636 Cen with the FEROS fiber echelle spectrograph at ESO,
La Silla in February 1999; see Table 6.
Details on the spectrograph and the reduction of the spectra are given by CTB08.
The late-type components of V636 Cen have rich absorption
line spectra, and unlike many known solar-type systems
(Table 10), the components
of V636 Cen are relatively slow rotators. This is a clear advantage
for the abundances studies. The ideal case would be to have
enough spectra for disentangling![]() ,
since mutual blending is avoided and the reconstructed component
spectra
get a higher signal-to-noise ratio than each of the observed spectra.
However, as will be demonstrated below, the wide spectral
coverage of FEROS provides a large number of unblended lines
from both components which are usable for the analyses of the combined spectra.
Furthermore, the two spectra have been observed at
different phases giving opposite line shifts.
Since the primary component is 3-5 times more luminous than the secondary,
depending on wavelength, its lines are only diluted by a factor of about 1.3,
meaning that an accuracy close to that for a similar single star with spectra
of comparable quality can be reached. For the secondary, the situation is on
the other hand worse; its dilution factor is about 4.7.
A lower accuracy must therefore be expected for the secondary
due to higher errors of the intrinsic equivalent widths.
In general, also intrinsically stronger lines, for which the equivalent widths
are less sensitive to abundance and more sensitive to e.g. microturbulence and
pressure broadening, have to be used for the secondary.
This is in principle avoided in disentangling, but the signal-to-noise ratio
of the reconstructed spectrum for the secondary would on the other hand
still be much lower than for the primary.
,
since mutual blending is avoided and the reconstructed component
spectra
get a higher signal-to-noise ratio than each of the observed spectra.
However, as will be demonstrated below, the wide spectral
coverage of FEROS provides a large number of unblended lines
from both components which are usable for the analyses of the combined spectra.
Furthermore, the two spectra have been observed at
different phases giving opposite line shifts.
Since the primary component is 3-5 times more luminous than the secondary,
depending on wavelength, its lines are only diluted by a factor of about 1.3,
meaning that an accuracy close to that for a similar single star with spectra
of comparable quality can be reached. For the secondary, the situation is on
the other hand worse; its dilution factor is about 4.7.
A lower accuracy must therefore be expected for the secondary
due to higher errors of the intrinsic equivalent widths.
In general, also intrinsically stronger lines, for which the equivalent widths
are less sensitive to abundance and more sensitive to e.g. microturbulence and
pressure broadening, have to be used for the secondary.
This is in principle avoided in disentangling, but the signal-to-noise ratio
of the reconstructed spectrum for the secondary would on the other hand
still be much lower than for the primary.
The basic approach followed in the abundance analyses is described by CTB08. The versatile VWA tool, now extended to analyses of double-lined spectra, was used; we refer to Bruntt et al. (2004, 2008) for an updated description of VWA. It uses the SYNTH software (Valenti & Piskunov 1996) to generate the synthetic spectra. Atmosphere models were interpolated from the grid of modified ATLAS9 models by Heiter et al. (2002). Line information was taken from the Vienna Atomic Line Database (VALD; Kupka et al. 1999), but in order to derive abundances relative to the Sun, log (gf) values have been adjusted in such a way that each measured line in the Wallace et al. (1998) solar atlas reproduces the atmospheric abundances by Grevesse & Sauval (1998). Analyses of a FEROS sky spectrum reproduce these adjustments closely.
Table 5: Spectroscopic orbital elements of V636 Cen.
Table 6: Log of the FEROS observations of V636 Cen.
The abundance results derived from all useful lines in both spectra
are presented in Table 7.
Except for a few ions, we have only included lines with measured equivalent
widths above 10 mÅ and below 80 mÅ (primary) and 50 mÅ (secondary).
Comparing the results from the individual spectra, we find no significant
differences. The effective temperatures, surface gravities
and rotational velocities listed in Table 8 were adopted.
Microturbulence velocities were tuned until Fe I abundances were
independent of line equivalent widths, and the resulting values are 1.15
(primary) and 1.35 (secondary) kms-1. The calibration by Edvardsson
et al. (1993) predicts
![]() kms-1 for the primary component,
whereas the secondary lies outside its effective temperature range.
For the adopted effective temperatures we see no dependency of the
abundance on excitation potential, which, however, occurs if they are changed
by more than
kms-1 for the primary component,
whereas the secondary lies outside its effective temperature range.
For the adopted effective temperatures we see no dependency of the
abundance on excitation potential, which, however, occurs if they are changed
by more than ![]() 100-150 K.
100-150 K.
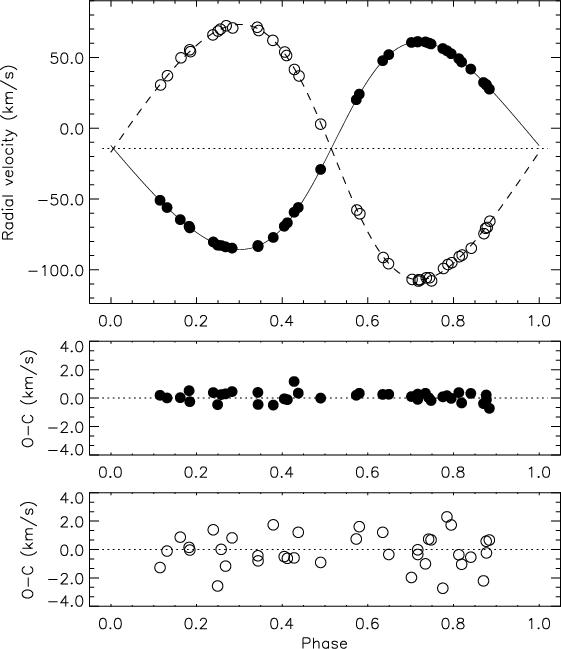 |
Figure 4: Spectroscopic orbital solution for V636 Cen (solid line: primary; dashed line: secondary) and radial velocities (filled circles: primary; open circles: secondary). The dotted line ( upper panel) represents the center-of-mass velocity of the system. Phase 0.0 corresponds to central primary eclipse. |
| Open with DEXTER | |
As seen, a robust
![]() is obtained for the primary, with identical
results from Fe I and Fe II lines. Within errors, the
less precise result for the secondary from Fe I lines agrees;
unfortunately no suitable, unblended Fe II lines are available.
Changing the primary model temperatures by
is obtained for the primary, with identical
results from Fe I and Fe II lines. Within errors, the
less precise result for the secondary from Fe I lines agrees;
unfortunately no suitable, unblended Fe II lines are available.
Changing the primary model temperatures by ![]() 100 K modifies
100 K modifies
![]() from the Fe I lines by
from the Fe I lines by ![]() dex, and a similar but
opposite effect is seen for Fe II lines.
If 0.3 kms-1 higher microturbulence velocities are adopted,
dex, and a similar but
opposite effect is seen for Fe II lines.
If 0.3 kms-1 higher microturbulence velocities are adopted,
![]() decreases by about 0.05 dex for both neutral and ionized lines.
Finally, changing the adopted luminosity ratio between the
components (Table 4) by +1
decreases by about 0.05 dex for both neutral and ionized lines.
Finally, changing the adopted luminosity ratio between the
components (Table 4) by +1![]() changes
changes
![]() by +0.015 dex for the primary and -0.04 dex for the secondary.
Taking these contributions to the uncertainties into account,
and giving higher weight to
the primary, we adopt
by +0.015 dex for the primary and -0.04 dex for the secondary.
Taking these contributions to the uncertainties into account,
and giving higher weight to
the primary, we adopt
![]() =
=
![]() for V636 Cen.
Except for Cr II we also find relative abundances close to -0.20 dex
for the other ions listed in Table 7, including the
for V636 Cen.
Except for Cr II we also find relative abundances close to -0.20 dex
for the other ions listed in Table 7, including the
![]() -elements. The reason for the Cr II discrepancy is not clear,
but a similar result was recently found for the G0 V system WZ Oph (CTB08).
-elements. The reason for the Cr II discrepancy is not clear,
but a similar result was recently found for the G0 V system WZ Oph (CTB08).
Table 7: Abundances ( [El./H]) for the primary and secondary components of V636 Cen determined from the two FEROS spectra.
We have also done abundance analyses based on the recent grid of MARCS
model atmospheres (Gustafsson et al. 2008), which adopt
the solar composition by Grevesse et al. (2007).
Adjusting the log (gf) accordingly, as described above, we obtain
abundances for V636 Cen which agree with those listed in
Table 7 within about
![]() dex.
dex.
As a supplement to the spectroscopic abundance analyses, we have
derived metal abundances from the de-reddened
![]() indices for the
individual components (see Table 8) and
the calibration by Holmberg et al. (2007).
For the primary component, the result,
indices for the
individual components (see Table 8) and
the calibration by Holmberg et al. (2007).
For the primary component, the result,
![]() =
=
![]() ,
agrees perfectly well with the spectroscopic determination, whereas an
unrealistically low value,
,
agrees perfectly well with the spectroscopic determination, whereas an
unrealistically low value,
![]() =
=
![]() ,
is obtained
for the secondary. Their previous calibration for late type
stars (Nordström et al. 2004) gives
,
is obtained
for the secondary. Their previous calibration for late type
stars (Nordström et al. 2004) gives
![]() =
=
![]() .
The quoted
.
The quoted
![]() errors include the uncertainties of the photometric indices
and the published spread of the calibrations, and the reason for the
discrepancy between the primary and secondary results is not clear. It may,
however, very likely be due to m1 deficiency for the secondary related to
activity, as in fact seen for active binaries (Giménez et al. 1991),
rather than a strong metal underabundance.
Adopting the definitions by Giménez et al., we find
errors include the uncertainties of the photometric indices
and the published spread of the calibrations, and the reason for the
discrepancy between the primary and secondary results is not clear. It may,
however, very likely be due to m1 deficiency for the secondary related to
activity, as in fact seen for active binaries (Giménez et al. 1991),
rather than a strong metal underabundance.
Adopting the definitions by Giménez et al., we find
![]() and
and
![]() for the secondary. If we modify m1
accordingly and assume that b-y is unaffected, the two calibrations
mentioned above lead to
for the secondary. If we modify m1
accordingly and assume that b-y is unaffected, the two calibrations
mentioned above lead to
![]()
![]() and
and
![]() =
=
![]() ,
respectively, i.e. reasonable agreement with the result for the primary is
reached.
,
respectively, i.e. reasonable agreement with the result for the primary is
reached.
6 Absolute dimensions
Table 8: Astrophysical data for V636 Cen.
Absolute dimensions for the components of V636 Cen are calculated from the elements given in Tables 4 and 5. As seen in Table 8, both masses and radii have been obtained to an accuracy of about 0.5%.
Individual standard
![]() indices are included in Table 8,
as calculated from the combined indices of V636 Cen outside eclipses (CVG08)
and the luminosity ratios (Table 4).
The calibration by Olsen 1988, the
indices are included in Table 8,
as calculated from the combined indices of V636 Cen outside eclipses (CVG08)
and the luminosity ratios (Table 4).
The calibration by Olsen 1988, the
![]() indices of the
primary component and
indices of the
primary component and ![]() observations obtained during the total secondary
eclipse (
observations obtained during the total secondary
eclipse (
![]() )
then yield a very small interstellar
reddening of
)
then yield a very small interstellar
reddening of
![]() .
.
The adopted effective temperatures (5900 K, 5000 K) were calculated from the
calibration by Holmberg et al. (2007), assuming
![]() = -0.20(Sect. 5). The uncertainties include those of the
= -0.20(Sect. 5). The uncertainties include those of the
![]() indices,
E(b-y),
indices,
E(b-y),
![]() and the calibration itself.
Temperatures based on the calibrations by Alonso et al. (1996)
and Ramírez & Meléndez (2005) agree within errors,
but are, however, systematically about 100 K lower for the primary component.
and the calibration itself.
Temperatures based on the calibrations by Alonso et al. (1996)
and Ramírez & Meléndez (2005) agree within errors,
but are, however, systematically about 100 K lower for the primary component.
From the orbital and stellar parameters, the observed rotational velocities,
and the apsidal motion period determined by CVG08, we derive a mean central
density coefficient of log(k2) =
![]() .
The observed rate
of change of the longitude of periastron
.
The observed rate
of change of the longitude of periastron
![]()
![]() /c was corrected for a 40%
relativistic contribution of
/c was corrected for a 40%
relativistic contribution of
![]()
![]() /c, as calculated
from general relativity (Giménez 1985). The higher order k3
and k4 terms are negligible.
From theoretical coefficients, calculated for the models described in
Sect. 7.2 along the lines described by Claret (1995,1997),
we derive a theoretical log (k2) of -1.74.
/c, as calculated
from general relativity (Giménez 1985). The higher order k3
and k4 terms are negligible.
From theoretical coefficients, calculated for the models described in
Sect. 7.2 along the lines described by Claret (1995,1997),
we derive a theoretical log (k2) of -1.74.
As seen in Table 8, the measured rotational velocities are in remarkable agreement with the theoretically predicted pseudo-synchronous velocities (Hut 1981, Eq. (42)), but are about 15% lower than the periastron values. The turbulent dissipation and radiative damping formalism of Zahn (1977,1989) predicts synchronization time scales of 0.1 Gyr for both components and a time scale for circularization of 7.5 Gyr, whereas the hydrodynamical mechanism by Tassoul & Tassoul (1997, and references therein) yields much lower values of 0.3 Myr (primary synchronization), 0.4 Myr (secondary synchronization), and 0.04 Gyr (circularization). We refer to Claret & Cunha (1997) and Claret et al. (1995) for details on the calculations. From model comparisons (Sect. 7.2), we derive an age for V636 Cen of about 1.35 Gyr, meaning that both theories are in agreement with the observed pseudo-synchronization. On the other hand, the mechanism by Tassoul & Tassoul predicts a circular orbit, which is certainly not the case.
The distance to V636 Cen was calculated from the ``classical'' relation
(see e.g. CTB08), adopting the solar values and bolometric corrections
given in Table 8 and
AV/E(b-y) = 4.27,
and accounting for all error sources.
As seen, nearly identical results are obtained from the two components.
The mean distance, 71.8 pc, which has been established to about 4%, is in perfect agreement with the result of the
new Hipparcos reduction by van Leeuwen (2007),
![]() pc, but
is marginally larger than the original Hipparcos result
pc, but
is marginally larger than the original Hipparcos result
![]() pc
(ESA 1997).
We note that V636 Cen belongs to the group of eclipsing binaries within 125 pc,
discussed by Popper (1998), which could be useful for improving the
radiative flux scale.
pc
(ESA 1997).
We note that V636 Cen belongs to the group of eclipsing binaries within 125 pc,
discussed by Popper (1998), which could be useful for improving the
radiative flux scale.
7 Discussion
In the following, we first compare the absolute dimensions obtained
for V636 Cen with properties of recent theoretical stellar evolutionary models.
We then compare V636 Cen to other well-studied eclipsing binaries with at least
one component in the 0.8-1.1 ![]() mass interval.
mass interval.
7.1 Comparison with solar-scaled models
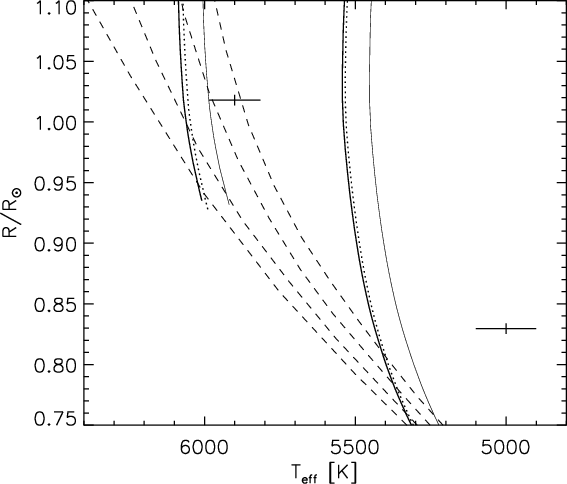 |
Figure 5:
V636 Cen compared to Y2 models
calculated for the measured abundance
|
| Open with DEXTER | |
Figures 5, 6,
and 7 illustrate the results from comparisons with the
Yonsei-Yale (Y2) evolutionary tracks and isochrones by Demarque et al.
(2004)![]() .
The mixing-length parameter in convective envelopes is calibrated using
the Sun, and is held fixed at
.
The mixing-length parameter in convective envelopes is calibrated using
the Sun, and is held fixed at
![]() .
The enrichment law
Y = 0.23 + 2Z is adopted, together with the solar
mixture by Grevesse et al. (1996), leading to
(X, Y, Z)
.
The enrichment law
Y = 0.23 + 2Z is adopted, together with the solar
mixture by Grevesse et al. (1996), leading to
(X, Y, Z)![]() = (0.71564, 0.26624, 0.01812).
Only models for
= (0.71564, 0.26624, 0.01812).
Only models for
![]() = 0.0 have been considered.
We refer to CTB08 for a brief description of other aspects of their
up-to-date input physics.
= 0.0 have been considered.
We refer to CTB08 for a brief description of other aspects of their
up-to-date input physics.
As seen from Fig. 5, models for the observed
masses and abundance,
![]() = -0.20, equivalent to
(X, Y, Z) = (0.73475, 0.25350, 0.01175),
are significantly hotter than observed,
especially for the secondary component. The uncertainty of
= -0.20, equivalent to
(X, Y, Z) = (0.73475, 0.25350, 0.01175),
are significantly hotter than observed,
especially for the secondary component. The uncertainty of
![]() is
is
![]() dex, and models for
dex, and models for
![]() = -0.12,
equivalent to (X, Y, Z) = (0.72809, 0.25790, 0.01397),
marginally fit
the primary but not the secondary component. In order to fit the primary
perfectly, Y2 models with a heavy element content close to solar,
or a higher He abundance, are required. Such models would, however, still be
unable to reproduce the secondary.
The same picture is seen for e.g. Victoria-Regina (VandenBerg et al.
2006)
= -0.12,
equivalent to (X, Y, Z) = (0.72809, 0.25790, 0.01397),
marginally fit
the primary but not the secondary component. In order to fit the primary
perfectly, Y2 models with a heavy element content close to solar,
or a higher He abundance, are required. Such models would, however, still be
unable to reproduce the secondary.
The same picture is seen for e.g. Victoria-Regina (VandenBerg et al.
2006)![]() and BaSTI (Pietrinferni et al.
2004)
and BaSTI (Pietrinferni et al.
2004)![]() models, which differ slightly from Y2, e.g. with respect to input physics
and He enrichment law. We refer to CTB08 for a brief comparison of the three model grids.
models, which differ slightly from Y2, e.g. with respect to input physics
and He enrichment law. We refer to CTB08 for a brief comparison of the three model grids.
The most direct comparison, based on the scale independent masses
and radii of V636 Cen, is shown in Fig. 6.
For the primary component, the models predict an age of
2.6-3.2 Gyr, depending on the assumed
![]() ,
whereas the
secondary is predicted to be more than two times older.
At the predicted age of the primary, the observed radius of the
secondary, which has been determined to an accuracy of 0.5%, is about 10% larger than that of the corresponding
model.
Mass-luminosity comparisons are shown in Fig. 7.
Within the errors of the observed luminosities, the models predict
identical - but lower - ages for the two components.
,
whereas the
secondary is predicted to be more than two times older.
At the predicted age of the primary, the observed radius of the
secondary, which has been determined to an accuracy of 0.5%, is about 10% larger than that of the corresponding
model.
Mass-luminosity comparisons are shown in Fig. 7.
Within the errors of the observed luminosities, the models predict
identical - but lower - ages for the two components.
In conclusion, the secondary component of V636 Cen is significantly larger
and ![]() 400 K cooler than predicted by models which
adopt a mixing-length parameter matching the Sun. For the observed
400 K cooler than predicted by models which
adopt a mixing-length parameter matching the Sun. For the observed
![]() ,
such models are
,
such models are ![]() 200 K hotter than the primary component, indicating
a discrepancy as well.
200 K hotter than the primary component, indicating
a discrepancy as well.
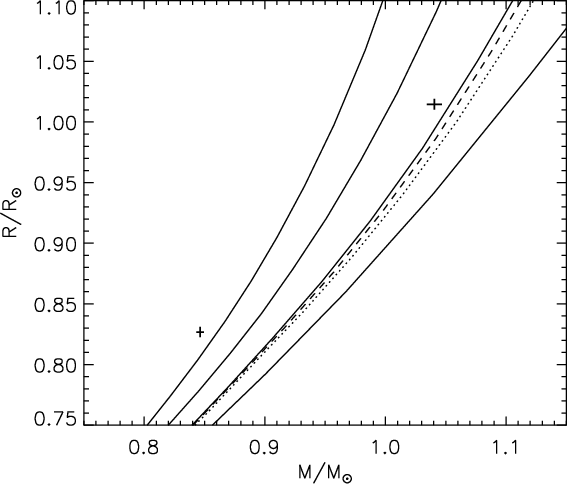 |
Figure 6:
V636 Cen compared to Y2 models
calculated for
|
| Open with DEXTER | |
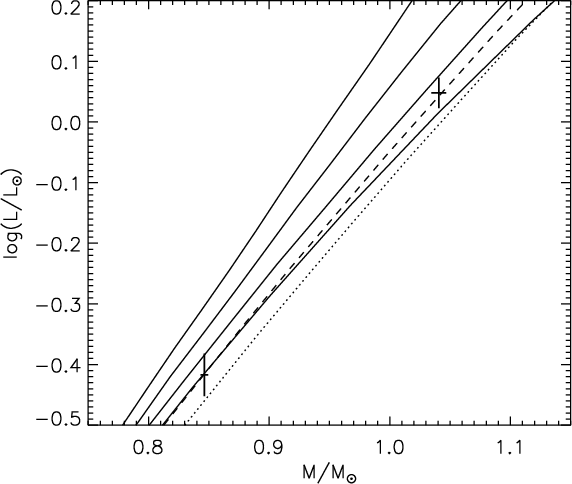 |
Figure 7:
V636 Cen compared to Y2 models
calculated for
|
| Open with DEXTER | |
7.2 Comparison with mixing-length ``tuned'' models
As mentioned in Sect. 1, several authors have demonstrated that models which adopt a reduced envelope convection mixing-length parameter fit active late-type binary components better. Since V636 Cen exhibits intrinsic variation and Ca II H and K emission (Fig. 1), and has relatively high rotational velocities (Table 8), compared to single field G-type stars, we have investigated such models.
Models with reduced mixing-length parameters, including non-gray atmospheres
and an improved equation of state, have been published by
Baraffe et al. (1998)![]() ,
but only for solar metallicity (up to 1.4
,
but only for solar metallicity (up to 1.4 ![]() )
and
)
and
![]() = -0.5 (up to 1.0
= -0.5 (up to 1.0 ![]() ).
).
Guided by a comparison between V636 Cen and these models, we have calculated
dedicated models for the observed masses and
![]() ,
tuning the mixing length
parameter individually for the components. We have adopted the code by
Claret (2004, 2005, 2006, 2007), which assumes
an enrichment law of
Y = 0.24 + 2.3Z
together with the solar mixture by Grevesse & Sauval (1998),
leading to (X, Y, Z)
,
tuning the mixing length
parameter individually for the components. We have adopted the code by
Claret (2004, 2005, 2006, 2007), which assumes
an enrichment law of
Y = 0.24 + 2.3Z
together with the solar mixture by Grevesse & Sauval (1998),
leading to (X, Y, Z)![]() = (0.704, 0.279, 0.017).
The observed
= (0.704, 0.279, 0.017).
The observed
![]() = -0.20 then corresponds to
(X, Y, Z) = (0.724, 0.264, 0.012).
We note that the envelope mixing length parameter needed to reproduce
the Sun is
= -0.20 then corresponds to
(X, Y, Z) = (0.724, 0.264, 0.012).
We note that the envelope mixing length parameter needed to reproduce
the Sun is
![]() .
.
Table 9: Ages (Gyr) for the primary (p) and secondary (s) components of V636 Cen determined from comparison between their masses and radii and Claret models for different mixing length parameters and abundances.
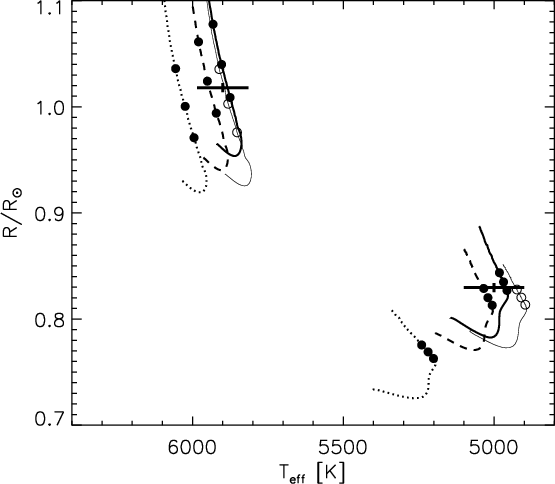 |
Figure 8: V636 Cen compared to Claret models for the observed masses, calculated with different mixing length parameters. The four cases listed in Table 9 are shown. The circles on the evolutionary tracks mark model ages of 1.0, 2.0, and 3.0 Gyr. Case 1 = full drawn, thick; Case 2 = dashed; Case 3 = full drawn, thin, open circles; Case 4 = dotted. |
| Open with DEXTER | |
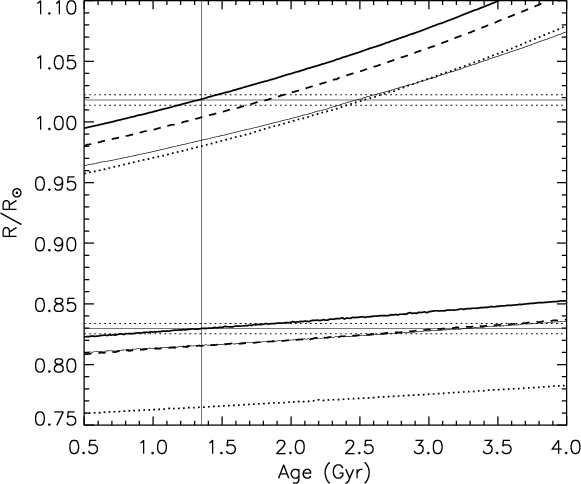 |
Figure 9: V636 Cen compared to Claret models. The four cases listed in Table 9 are shown. The curves illustrate model radii as function of age for the component masses (upper: primary; lower: secondary). Case 1 = full drawn, thick; Case 2 = dashed; Case 3 = full drawn, thin; Case 4 = dotted. The horizontal full drawn lines mark the observed radii of the components with errors (dotted lines). The vertical line marks the common age (1.35 Gyr) predicted by the case 1 models. |
| Open with DEXTER | |
Four different cases, listed in Table 9, will be
discussed here.
Figure 8 shows temperature-radius comparisons
between V636 Cen and models with different mixing length parameters,
calculated for the component masses.
For the observed
![]() ,
the temperature of the primary component is fitted
well by the
,
the temperature of the primary component is fitted
well by the
![]() model, whereas 1.0 is adequate for the secondary
(case 1).
As seen from the age-radius diagram in Fig. 9,
these models also predict practically identical ages for the components.
Changing the mixing length parameters by just +0.1 (case 2),
i.e. considering models which still fit the observed masses and
temperatures within errors (Fig. 8),
lead to significantly higher ages, which are, however, no longer
identical for the components.
To illustrate the effect of the abundance uncertainty
model, whereas 1.0 is adequate for the secondary
(case 1).
As seen from the age-radius diagram in Fig. 9,
these models also predict practically identical ages for the components.
Changing the mixing length parameters by just +0.1 (case 2),
i.e. considering models which still fit the observed masses and
temperatures within errors (Fig. 8),
lead to significantly higher ages, which are, however, no longer
identical for the components.
To illustrate the effect of the abundance uncertainty
![]() dex,
models for
dex,
models for
![]() = -0.12 have been included in the two figures (case 3).
For this abundance, mixing length parameters of about 1.6 (primary)
and 1.1 (secondary) are needed to fit the observed masses and
temperatures. Ages determined from the masses and radii become
even higher, and they differ for the components.
Finally, Claret models adopting a solar
= -0.12 have been included in the two figures (case 3).
For this abundance, mixing length parameters of about 1.6 (primary)
and 1.1 (secondary) are needed to fit the observed masses and
temperatures. Ages determined from the masses and radii become
even higher, and they differ for the components.
Finally, Claret models adopting a solar
![]() are, like the
Y2 models, unable to fit V636 Cen (case 4).
are, like the
Y2 models, unable to fit V636 Cen (case 4).
Table 10:
Properties of well-studied main sequence binaries (e.g. footnote 9) with at least one
component in the 0.80-1.10 ![]() mass interval.
mass interval.
Table 9 summarizes the ages derived from the
different model cases.
Effects from the mass uncertainties are negligible and have not been
included; see Fig. 5.
In conclusion, only the case 1 models
reproduce all observed properties of the components of V636 Cen
well at a common age (1.35 Gyr).
This implies that
![]() can be tuned fairly precisely, provided
accurate dimensions and abundances are available.
We finally note, that according to the Claret models both components
have pronounced convective envelopes, starting at
can be tuned fairly precisely, provided
accurate dimensions and abundances are available.
We finally note, that according to the Claret models both components
have pronounced convective envelopes, starting at
![]() and
and
![]() .
.
7.3 Comparison with other binaries
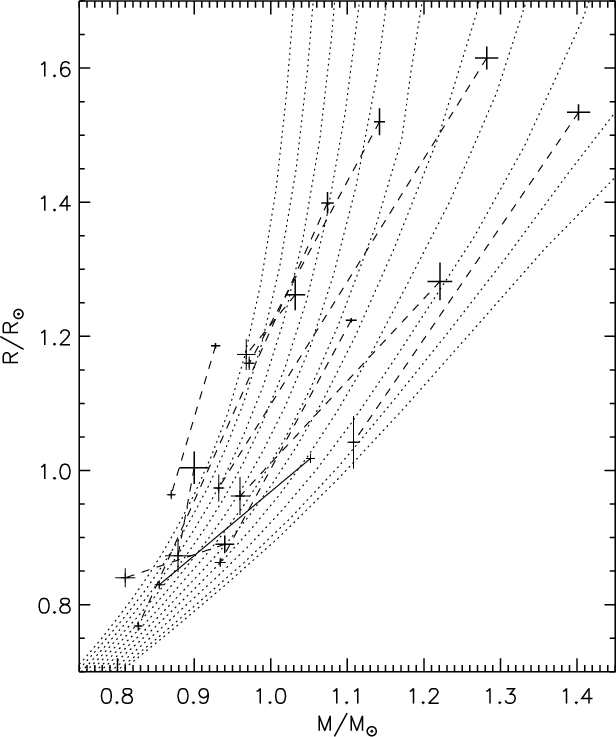 |
Figure 10:
Main-sequence binaries with one or both components in the
0.80-1.10 |
| Open with DEXTER | |
Currently, nine other main sequence eclipsing binaries with
at least one component in the 0.80-1.10 ![]() mass interval have
well-established (
mass interval have
well-established (
![]() or better) masses and
radii
or better) masses and
radii![]()
![]() .
Furthermore, the A and B components of
.
Furthermore, the A and B components of ![]() Cen can be added, since
their masses, radii, temperatures, and abundances are known to high
accuracy (e.g. Eggenberger et al. 2004).
Cen can be added, since
their masses, radii, temperatures, and abundances are known to high
accuracy (e.g. Eggenberger et al. 2004).
These 11 binaries are listed in Table 10 and shown in
Fig. 10 together with Y2 solar composition isochrones.
We note, that V636 Cen and ![]() Cen are the only systems in this sample
with
Cen are the only systems in this sample
with
![]() measured spectroscopically.
With one exception, VZ Cep, the systems fall in two groups:
measured spectroscopically.
With one exception, VZ Cep, the systems fall in two groups:
- 1.
- For CG Cyg, CV Boo,
ZZ UMa, FL Lyr, and V1061 Cyg,
like for V636 Cen, the Y2 models predict higher ages for
the secondary components than for the primary components,
resulting from larger radii than predicted. Also, the
effective temperatures of the secondary components are lower
than predicted. Their orbital periods are short (
 -
-
 ),
and the rotational velocities of their components are high (20-73 kms-1).
Intrinsic variations are present, and some of the binaries are
known, strong X-ray sources.
Information on Ca II emission is unfortunately scarce.
A few further systems with similar characteristics, but less accurate
dimensions
(RT And,
BH Vir,
UV Leo, and
UV Psc),
could be added to this group (Clausen et al. 1999).
),
and the rotational velocities of their components are high (20-73 kms-1).
Intrinsic variations are present, and some of the binaries are
known, strong X-ray sources.
Information on Ca II emission is unfortunately scarce.
A few further systems with similar characteristics, but less accurate
dimensions
(RT And,
BH Vir,
UV Leo, and
UV Psc),
could be added to this group (Clausen et al. 1999).
- 2.
- For HS Aur, RW Lac,
 Cen, and
V568 Lyr (V20 in NGC 6791), the observed masses,
radii, and temperatures agree much better with those predicted by the
solar-scaled Y2 models.
They have fairly long orbital periods (
Cen, and
V568 Lyr (V20 in NGC 6791), the observed masses,
radii, and temperatures agree much better with those predicted by the
solar-scaled Y2 models.
They have fairly long orbital periods (
 -79.9 yr),
and the rotational velocities of the components are below 6 kms-1.
Popper et al. (1986) saw no Ca II emission
but found evidence for intrinsic variability of HS Aur and/or
the K0 comparison star used (HD 49 987). The other three binaries are
reported to be stable; no information on Ca II emission is
available. None of the four is a known strong X-ray source.
According to models, RW Lac is somewhat metal deficient,
and its age is about 11 Gyr (Lacy et al. 2005).
V568 Lyr has an age of about 8 Gyr and its metal content is
about 2.5 times solar (Grundahl et al. 2008).
-79.9 yr),
and the rotational velocities of the components are below 6 kms-1.
Popper et al. (1986) saw no Ca II emission
but found evidence for intrinsic variability of HS Aur and/or
the K0 comparison star used (HD 49 987). The other three binaries are
reported to be stable; no information on Ca II emission is
available. None of the four is a known strong X-ray source.
According to models, RW Lac is somewhat metal deficient,
and its age is about 11 Gyr (Lacy et al. 2005).
V568 Lyr has an age of about 8 Gyr and its metal content is
about 2.5 times solar (Grundahl et al. 2008).
From a comparison of V1061 Cyg and FL Lyr (group 1) against RW Lac and HS Aur (group 2), Torres et al. (2006) identified chromospheric activity as the likely cause of the radius and temperature discrepancies. Our sample strengthens this suggestion, not at least through a comparison between V636 Cen and V568 Lyr, whose components have nearly identical masses.
7.4 Mixing-length calibrations
It is worth linking our sample to the ongoing discussion on the
mixing-length parameter for stars in the 0.7-1.1 ![]() range, where stars
have convective envelopes but are not fully convective.
From 2D radiation hydrodynamics (RHD) calculations, Ludwig et al. (1999)
calibrated the mixing-length parameter for solar-type stars (
range, where stars
have convective envelopes but are not fully convective.
From 2D radiation hydrodynamics (RHD) calculations, Ludwig et al. (1999)
calibrated the mixing-length parameter for solar-type stars (
![]() 4300-7100 K;
4300-7100 K;
![]() -4.74) and found a moderate but significant variation of
-4.74) and found a moderate but significant variation of
![]() .
On the main sequence, a decrease with increasing temperature, and
thereby mass, from about 1.8 to about 1.3 was obtained.
On the other hand, Yildiz et al. (2006) and Yildiz (2008)
found a significant increase with mass from model fits to four Hyades binaries,
FL Lyr, and V442 Cyg.
As an illustration,
.
On the main sequence, a decrease with increasing temperature, and
thereby mass, from about 1.8 to about 1.3 was obtained.
On the other hand, Yildiz et al. (2006) and Yildiz (2008)
found a significant increase with mass from model fits to four Hyades binaries,
FL Lyr, and V442 Cyg.
As an illustration,
![]() values calculated from the fitting functions
by these authors are listed in Table 11; no scaling, e.g. to
the Sun, has been done.
Finally, including seismic constraints, several studies of
values calculated from the fitting functions
by these authors are listed in Table 11; no scaling, e.g. to
the Sun, has been done.
Finally, including seismic constraints, several studies of ![]() Cen,
most recently by Eggenberger et al. (2004) and Yildiz (2007),
find that
Cen,
most recently by Eggenberger et al. (2004) and Yildiz (2007),
find that
![]() is higher for the less massive B component
than for the A component.
Eggenberger et al., who use the seismological data by Carrier & Bourban
(2003), obtain 1.83 (A) and 1.97 (B), and Yildiz, who include the
data by Kjeldsen et al. (2005), get 1.64 (A) and 2.10 (B).
is higher for the less massive B component
than for the A component.
Eggenberger et al., who use the seismological data by Carrier & Bourban
(2003), obtain 1.83 (A) and 1.97 (B), and Yildiz, who include the
data by Kjeldsen et al. (2005), get 1.64 (A) and 2.10 (B).
Table 11:
Mixing-length parameters (
![]() )
for the binary components
(Table 10)
calculated from the temperature-gravity fitting function by Ludwig et al.
(1999) and the mass fitting formula by Yildiz et al. (2006).
)
for the binary components
(Table 10)
calculated from the temperature-gravity fitting function by Ludwig et al.
(1999) and the mass fitting formula by Yildiz et al. (2006).
The fact that our sample can be divided in two different groups seems to suggest that the behaviour of the mixing length parameter may be governed by two different effects:
- a slight decrease of
 with increasing temperature/mass for
inactive main sequence stars, as predicted by Ludwig et al. (1999)
and found for Cen and possibly also V568 Lyr
(Grundahl et al. 2008), and
with increasing temperature/mass for
inactive main sequence stars, as predicted by Ludwig et al. (1999)
and found for Cen and possibly also V568 Lyr
(Grundahl et al. 2008), and
- a decrease of
for active stars compared to inactive ones
of similar mass, as seen for group 2.
It would be of interest to extend the systematic study of the evolution
of low-mass stars and brown dwarf eclipsing binaries by
Chabrier et al. (2007) to higher masses. For masses up to
0.8 ![]() ,
they found that the effects of decreasing
,
they found that the effects of decreasing
![]() ,
i.e. reducing
the convective efficiency, increases with mass, leading to lower effective
temperatures, luminosities, central temperatures, and nuclear energy
production. In parallel, magnetic spots covering a significant fraction
of the stellar surfaces cause similar changes.
They adopted a phenomenological approach, and more complete models,
which directly couple rotation, convection, and dynamo magnetic fields are
also desirable; see e.g. D'Antona et al. (2000) for pre-main-sequence
models.
,
i.e. reducing
the convective efficiency, increases with mass, leading to lower effective
temperatures, luminosities, central temperatures, and nuclear energy
production. In parallel, magnetic spots covering a significant fraction
of the stellar surfaces cause similar changes.
They adopted a phenomenological approach, and more complete models,
which directly couple rotation, convection, and dynamo magnetic fields are
also desirable; see e.g. D'Antona et al. (2000) for pre-main-sequence
models.
8 Summary and conclusions
From state-of-the-art observations and analyses, precise (0.5%) absolute
dimensions have been obtained for the totally eclipsing solar-type system V636 Cen.
A detailed spectroscopic analysis yields a Fe abundance relative to the Sun
of
![]() =
=
![]() and similar relative abundances for Si, Ca, Ti, V, Cr, Co,
and Ni.
and similar relative abundances for Si, Ca, Ti, V, Cr, Co,
and Ni.
The 0.85 ![]() secondary component is found to be moderately active with
starspots and Ca II H and K emission, and the 1.05
secondary component is found to be moderately active with
starspots and Ca II H and K emission, and the 1.05 ![]() primary shows
signs of activity as well, but at a much lower level.
Apsidal motion (
primary shows
signs of activity as well, but at a much lower level.
Apsidal motion (
![]() yr) with a 40% relativistic contribution
has been detected for the eccentric orbit (
yr) with a 40% relativistic contribution
has been detected for the eccentric orbit (
![]() ), and the
inferred mean central density concentration coefficient,
log (k2) =
), and the
inferred mean central density concentration coefficient,
log (k2) =
![]() ,
agrees marginally with model predictions.
The measured rotational velocities,
,
agrees marginally with model predictions.
The measured rotational velocities,
![]() (primary) and
(primary) and
![]() (secondary) kms-1, are in remarkable agreement with the
theoretically predicted pseudo-synchronous velocities, but are about 15%
lower than the periastron values.
(secondary) kms-1, are in remarkable agreement with the
theoretically predicted pseudo-synchronous velocities, but are about 15%
lower than the periastron values.
We have shown that stellar models with solar-scaled mixing length parameters
are unable to match the components of V636 Cen at identical ages.
At the age of the primary, the secondary component is ![]()
![]() larger
than predicted. Also, the components are
larger
than predicted. Also, the components are ![]() 200 K (primary) and
200 K (primary) and
![]() 400 K (secondary) cooler than predicted.
400 K (secondary) cooler than predicted.
However, models adopting significantly lower mixing-length parameters can
remove these discrepancies.
For the observed
![]() ,
Claret models for
,
Claret models for
![]() (primary) and 1.0
(secondary) reproduce the properties of the components of V636 Cen well for a
common age of 1.35 Gyr.
(primary) and 1.0
(secondary) reproduce the properties of the components of V636 Cen well for a
common age of 1.35 Gyr.
Currently, 10 other solar-type binaries have well-established dimensions, although spectroscopic abundance results are lacking for most of them; see Fig. 10 and Table 10. With one exception, VZ Cep, they fall in two groups: Four long period, slowly rotating inactive systems, which seem to be fitted reasonably well by solar-scaled models. And five systems, which exhibit intrinsic variation, and have short orbital periods and high rotational velocities. Like V636 Cen, they can not be reproduced by solar-scaled models. Therefore, the sample strengthens the suggestion by Torres et al. (2006), based on fewer systems, that chromospheric activity, and the associated changes of the convective envelope, is the likely cause of the radius and temperature discrepancies. The strongest case is perhaps a comparison between V636 Cen (active) and the newly studied V568 Lyr in NGC 6791 (inactive), whose components have nearly identical masses.
Finally, the clear division of our sample in two groups might
suggest that two different effects influence the mixing length
parameter for 0.7-1.1 ![]() main sequence stars:
a) a slight decrease of
main sequence stars:
a) a slight decrease of
![]() with increasing temperature/mass for inactive main sequence stars, as found by e.g. Ludwig et al. (1999) and seen for
with increasing temperature/mass for inactive main sequence stars, as found by e.g. Ludwig et al. (1999) and seen for
![]() Cen and possibly also V568 Lyr;
and b) a decrease of
Cen and possibly also V568 Lyr;
and b) a decrease of
![]() for active stars compared to
inactive ones of similar mass.
for active stars compared to
inactive ones of similar mass.
More well-studied eclipsing binaries, as well as more complete stellar models,
are needed to fully understand and describe
envelope convection in terms of effective temperature,
gravity, mass, age, rotation, dynamo magnetic field, activity level etc.
We are presently studying several systems with main sequence components
in the 0.5-1.2 ![]() range, including
V1123 Tau,
V963 Cen,
AL Dor,
QR Hya,
KY Hya,
AL Ari,
UW LMi,
EW Ori, and
NY Hya;
see also Clausen et al. (2001).
They exhibit various levels of activity, from none to modest,
and should therefore provide valuable new insight into this matter.
Spectroscopic abundance determinations will be part of the analyses.
range, including
V1123 Tau,
V963 Cen,
AL Dor,
QR Hya,
KY Hya,
AL Ari,
UW LMi,
EW Ori, and
NY Hya;
see also Clausen et al. (2001).
They exhibit various levels of activity, from none to modest,
and should therefore provide valuable new insight into this matter.
Spectroscopic abundance determinations will be part of the analyses.
Acknowledgements
We thank M. Imbert and L. Prévot for the use of their CORAVEL observations, and P. Figueira for extracting the radial velocity data from the CORAVEL database. We are grateful to the referee, G. Torres, for a prompt and very helpful report. The projects ``Stellar structure and evolution - new challenges from ground and space observations'' and ``Stars: Central engines of the evolution of the Universe'', carried out at Copenhagen University and Aarhus University, are supported by the Danish National Science Research Council. Furthermore, this investigation was supported by the Spanish Science Research Council. J.A. and B.N. acknowledge support from the Carlsberg Foundation. H.B. was supported by the Australian Research Council. The following internet-based resources were used in research for this paper: the NASA Astrophysics Data System; the SIMBAD database and the VizieR service operated by CDS, Strasbourg, France; the VALD database made available through the Institute of Astronomy, Vienna, Austria.
References
- Alonso, A., Arribas, S., & Martínez-Roger, C. 1996, A&A, 313, 873 [NASA ADS] (In the text)
- Baraffe, I., Chabrier, G., Allard, F., & Hauschildt, P. 1998, A&A, 337, 403 [NASA ADS] (In the text)
- Baranne, A., Mayor, M., & Poncet, J.-L. 1979, Vistas in Astron., 23, 279 [NASA ADS] [CrossRef] (In the text)
- Bruntt, H., Bikmaev, I. F., Catala, C., et al. 2004, A&A, 425, 683 [NASA ADS] [CrossRef] [EDP Sciences] (In the text)
- Bruntt, H., De Cat, P., & Aerts, C. 2008, A&A, 478, 487 [NASA ADS] [CrossRef] [EDP Sciences] (In the text)
- Carrier, F. & Bouran, G. 2003, A&A, 406, L23 [NASA ADS] [CrossRef] [EDP Sciences] (In the text)
- Chabrier, G., Gallardo, J., & Baraffe, I. 2007, A&A, 472, L17 [NASA ADS] [CrossRef] [EDP Sciences] (In the text)
- Claret, A. 1995, A&AS, 109, 441 [NASA ADS] (In the text)
- Claret, A. 1997, A&AS, 125, 439 [NASA ADS] [CrossRef] [EDP Sciences]
- Claret, A. 2000, A&A, 363, 1081 [NASA ADS] (In the text)
- Claret, A. 2004, A&A, 424, 919 [NASA ADS] [CrossRef] [EDP Sciences] (In the text)
- Claret, A. 2005, A&A, 440, 647 [NASA ADS] [CrossRef] [EDP Sciences] (In the text)
- Claret, A. 2006, A&A, 453, 769 [NASA ADS] [CrossRef] [EDP Sciences] (In the text)
- Claret, A. 2007, A&A, 467, 1389 [NASA ADS] [CrossRef] [EDP Sciences] (In the text)
- Claret, A., & Cunha, N. C. S. 1997, A&A, 318, 187 [NASA ADS] (In the text)
- Claret, A., Giménez, A., & Cunha, N. C. S. 1995, A&A, 299, 724 [NASA ADS] (In the text)
- Clausen, J. V., Baraffe, I., Claret, A., & VandenBerg, D. B. 1999, in Theory and Tests of Convection in Stellar Structure, ed. A. Giménez, E. F. Guinan, & B. Montesinos, ASP Conf. Ser., 173, 265 (In the text)
- Clausen, J. V., Helt, B. E., & Olsen, E. H. 2001, A&A, 374, 980 [NASA ADS] [CrossRef] [EDP Sciences] (In the text)
- Clausen, J. V., Vaz, L. P. R., García, J. M., et al. 2008a, A&A, 487, 1081 [NASA ADS] [CrossRef] [EDP Sciences] (CVG08) (In the text)
- Clausen, J. V., Torres, G., Bruntt, H., et al. 2008b, A&A, 487, 1095 [NASA ADS] [CrossRef] [EDP Sciences] (CTB08) (In the text)
- Cox, A. N., Shaviv, G., & Hodson, S. W. 1981, ApJ, 245, L37 [NASA ADS] [CrossRef] (In the text)
- D'Antona, F., Ventura, P., & Mazzitelli, I. 2000, ApJ, 543, L77 [NASA ADS] [CrossRef] (In the text)
- Dawson, P. C., & De Robertis, M. M. 2004, AJ, 127, 2909 [NASA ADS] [CrossRef] (In the text)
- Demarque, P., Woo, J.-H., Kim, Y.-C., & Yi, S. K. 2004, ApJS, 155, 667 [NASA ADS] [CrossRef] (In the text)
- Eggenberger, P., Charbonnel, C., Talon, S., et al. 2004, A&A, 417, 235 [NASA ADS] [CrossRef] [EDP Sciences] (In the text)
- ESA 1997, The Hipparcos and Tycho Catalogues, ESA SP-1200 (In the text)
- Edvardsson, B., Andersen, J., Gustafsson, B., et al. 1993, A&A, 275, 101 [NASA ADS] (In the text)
- Etzel, P. B. 2004, SBOP: Spectroscopic Binary Orbit Program San Diego State University) (In the text)
- Flower, P. J. 1996, ApJ, 469, 355 [NASA ADS] [CrossRef]
- Gabriel, M. 1969, in Low-Luminosity Stars, ed. S. S. Kumar (New York: Gordon & Breach), 267 (In the text)
- Giménez, A. 1985, ApJ, 297, 405 [NASA ADS] [CrossRef] (In the text)
- Giménez, A., Reglero, V., de Castro, E., & Fernández-Figueroa, M. J. 1991, A&A, 248, 563 [NASA ADS] (In the text)
- Grevesse, N., & Sauval, A. J. 1998, Space Sci. Rev., 85, 161 [NASA ADS] [CrossRef] (In the text)
- Grevesse, N., Noels, A., & Sauval, A. J. 1996, in Cosmic Abundances, ed. S. S. Holt, & G. Sonneborn (San Francisco: ASP), 117 (In the text)
- Grevesse, N., Asplund, M., & Sauval, A. J. 2007, Space Sci. Rev., 130, 105 [NASA ADS] [CrossRef] (In the text)
- Grundahl, F., Clausen, J. V., Hardis, S., & Frandsen, S. 2008, A&A, 492, 171 [NASA ADS] [CrossRef] [EDP Sciences] (In the text)
- Gustafsson, B., Edvardsson, B., Eriksson, K., et al. 2008, A&A, 486, 951 [NASA ADS] [CrossRef] [EDP Sciences] (In the text)
- Hall, D. S. 1994, Mem. Soc. Astron. Italiana, 65, 73 [NASA ADS] (In the text)
- Heiter, U., Kupka, F., van't Menneret, C., et al. 2002, A&A, 392, 619 [NASA ADS] [CrossRef] [EDP Sciences] (In the text)
- Henry, T. J., Soderblom, D. R., Donahue, R. A., & Baliunas, S. L. 1996, AJ, 111, 439 [NASA ADS] [CrossRef] (In the text)
- Hoffmeister, C. 1958, Veröffentlichungen der Sternwarte in Sonneberg, 3, 439 [NASA ADS] (In the text)
- Holmberg, J., Nordström, B., & Andersen, J. 2007 A&A, 475, 519 (In the text)
- Houk, N. 1978, Michigan Catalogue of two-dimensional spectraltypes for HD stars, 2, Dep. Astron., Univ. Michigan, Ann Arbor, Michigan, USA
- Hoxie, D. T. 1973, A&A, 26, 437 [NASA ADS] (In the text)
- Hut, P. 1981, A&A, 99, 126 [NASA ADS] (In the text)
- Kjeldsen, H., Bedding, T. R., Butler, R. P., et al. 2005, ApJ, 635, 1281 [NASA ADS] [CrossRef] (In the text)
- Kupka, F., Piskunov, N., Ryabchikova, T. A., Stempels, H. C., & Weiss, W. 1999, A&AS, 138, 119 [NASA ADS] [CrossRef] [EDP Sciences] (In the text)
- Lacy, C. H. S., Torres, G., Claret, A., & Vaz, L. P. V. 2005, AJ, 130, 2838 [NASA ADS] [CrossRef] (In the text)
- Larsen, A. 1998, Master Thesis, Copenhagen University (In the text)
- López-Morales, M. 2007, ApJ, 660, 732 [NASA ADS] [CrossRef] (In the text)
- López-Morales, M., & Ribas, I. 2005, ApJ, 631, 1120 [NASA ADS] [CrossRef] (In the text)
- Ludwig, H:-G., Freytag, B., & Steffen, M. 1999, A&A, 346, 111 [NASA ADS] (In the text)
- Mayor, M. 1985, in Stellar Radial Velocities, ed. A. G. D. Philip, & D. W. Latham (Schenectady, New York: L. Davis Press), IAU Coll., 88, 35 (In the text)
- Morales, J. C., Ribas, I., & Jordi, C. 2008, A&A, 478, 507 [NASA ADS] [CrossRef] [EDP Sciences] (In the text)
- Motch, C., Guillout, P., Haberl, F., et al. 1997, A&AS, 122, 201 [NASA ADS] [CrossRef] [EDP Sciences]
- Nordström, B., Mayor, M., Andersen, J., et al. 2004, A&A, 418, 989 [NASA ADS] [CrossRef] [EDP Sciences] (In the text)
- Olsen, E. H. 1988, A&A, 189, 173 [NASA ADS] (In the text)
- Pietrinferni, A., Cassisi, S., & Salaris, M. 2004, Mem. Soc. Astron. Italiana, 75, 170 [NASA ADS] (In the text)
- Popper, D. M. 1966, AJ, 71, 175 [NASA ADS] [CrossRef] (In the text)
- Popper, D. M. 1997, AJ, 114, 1195 [NASA ADS] [CrossRef] (In the text)
- Popper, D. M. 1998, PASP, 110, 919 [NASA ADS] [CrossRef] (In the text)
- Popper, D. M., Lacy, C. H., Frueh, M. I., & Turner, A. E. 1986, AJ, 91, 383 [NASA ADS] [CrossRef] (In the text)
- Ramírez, I., & Meléndez, J. 2005, AJ, 626, 465 [NASA ADS] [CrossRef] (In the text)
- Ribas, I. 2003, A&A, 398, 239 [NASA ADS] [CrossRef] [EDP Sciences] (In the text)
- Ribas, I., Morales, J. C., Jordi, C. et al. 2008, Mem. Soc. Astron. Italiana, 79, 562 [NASA ADS] (In the text)
- Stassun, K. G., Mathieu, R. D., Vaz, L. P. R., et al. 2004, ApJS, 151, 357 [NASA ADS] [CrossRef]
- Siviero, A., Munari, U., Sordo, R., et al. 2004, A&A, 417, 1083 [NASA ADS] [CrossRef] [EDP Sciences]
- Tassoul, M. & Tassoul, J.-L. 1997, ApJ, 481, 363 [NASA ADS] [CrossRef] (In the text)
- Torres, G., & Ribas, I. 2002, ApJ, 567, 1140 [NASA ADS] [CrossRef] (In the text)
- Torres, G., & Lacy, C. H. S. 2009, AJ, 137, 507 [NASA ADS] [CrossRef] (In the text)
- Torres, G., Lacy, C.H., Marschall, L. A., Sheets, H. A., & Mader, J. A. 2006, AJ, 640, 1018 [NASA ADS] [CrossRef] (In the text)
- Valenti, J., & Piskunov, N. 1996, A&AS, 118, 595 [NASA ADS] [CrossRef] [EDP Sciences] (In the text)
- VandenBerg, D. A., Bergbusch, P. A., & Dowler, P. D. 2006 ApJS, 162, 375 (In the text)
- Van Hamme, W. 1993, AJ, 106, 2096 [NASA ADS] [CrossRef] (In the text)
- van Leeuwen, F. 2007, Hipparcos, the new reduction of the raw data (Dordrecht: Springer) (In the text)
- Voges, W., Aschenbach, B., Boller, T., et al. 1999, A&A, 349, 389 [NASA ADS] (In the text)
- Voges, W., Aschenbach, B., Boller, T., et al. 2000, IAU Circ., 7432, 1 [NASA ADS]
- Zahn, J.-P. 1977, A&A, 57, 383 [NASA ADS] (In the text)
- Zahn, J.-P. 1989, A&A, 220, 112 [NASA ADS]
- Wallace, L., Hinkle, K., & Livingston, W. 1998, An atlas of the spectrum of the solar photosphere from 13 500 to 28 000 cm-1 (3570 to 7405 A), Tucon, AZ: NOAO (In the text)
- Wolfe, R. H., Horak, H. G., & Storer, N. W. 1967, in Modern Astrophysics: a Memorial to Otto Struve, ed. M. Hack, 251 (In the text)
- Yildiz, M. 2007, MNRAS, 374, 1264 [NASA ADS] [CrossRef] (In the text)
- Yildiz, M. 2008, in The Art of Modelling Stars in the 21th Century, ed. L. Deng, & K. L. Chan, IAU Symp., 252, 183 (In the text)
- Yildiz, M., Yakut, K., Bakis, H., & Noels, A. 2006, MNRAS, 368, 1941 [NASA ADS] [CrossRef] (In the text)
Footnotes
- ... binaries
- Based on observations carried out at the Strömgren Automatic Telescope (SAT), the Danish 1.54 m telescope, and the 1.5 m telescope (62.L-0284) at ESO, La Silla, Chile.
- ... secondary
- Table A.1 is only available in electronic form at the CDS via anonymous ftp to cdsarc.u-strasbg.fr (130.79.128.5) or via http://cdsweb.u-strasbg.fr/cgi-bin/qcat?J/A+A/502/253
- ... F8/G0 V
- Houk (1978); spectral type of primary component.
- ... Rossby
- Defined as the ratio of the rotation period to the convective turnover time.
- ... SBOP
- Spectroscopic Binary Orbit Program, http://mintaka.sdsu.edu/faculty/etzel/
- ... disentangling
- About 10 spectra with
 ,
well distributed in phase, would be required.
,
well distributed in phase, would be required.
- ...2004)
- http://www.astro.yale.edu/demarque/yystar.html
- ...2006)
- http://www1.cadc-ccda.hia-iha.nrc-cnrc.gc.ca/cvo/community/VictoriaReginaModels/
- ...2004)
- http://www.te.astro.it/BASTI/index.php
- ...1998)
- ftp.ens-lyon.fr
- ...
radii
- see e.g. http://www.astro.keele.ac.uk/~jkt/
- ...
- Two additional binaries in this mass interval, the pre-main-sequence system V1174 Ori (Stassun et al. 2004), and V432 Aur, which has an evolved component (Siviero et al. 2004), have not been been included in the comparison.
All Tables
Table 1: Photometric solutions for V636 Cen from JKTEBOP analyses of the 1987 and 1988 light curve observations (426 points per band).
Table 2: WD solutions from the 1987 light curve observations (165 per band).
Table 3: WD solutions from the 1988 light curve observations (261 per band). See Table 2.
Table 4: Adopted photometric elements for V636 Cen.
Table 5: Spectroscopic orbital elements of V636 Cen.
Table 6: Log of the FEROS observations of V636 Cen.
Table 7: Abundances ( [El./H]) for the primary and secondary components of V636 Cen determined from the two FEROS spectra.
Table 8: Astrophysical data for V636 Cen.
Table 9: Ages (Gyr) for the primary (p) and secondary (s) components of V636 Cen determined from comparison between their masses and radii and Claret models for different mixing length parameters and abundances.
Table 10:
Properties of well-studied main sequence binaries (e.g. footnote 9) with at least one
component in the 0.80-1.10 ![]() mass interval.
mass interval.
Table 11:
Mixing-length parameters (
![]() )
for the binary components
(Table 10)
calculated from the temperature-gravity fitting function by Ludwig et al.
(1999) and the mass fitting formula by Yildiz et al. (2006).
)
for the binary components
(Table 10)
calculated from the temperature-gravity fitting function by Ludwig et al.
(1999) and the mass fitting formula by Yildiz et al. (2006).
All Figures
| |
Figure 1: Ca II H and K emission in V636 Cen. The vertical lines show the positions for the primary (full) and secondary (dashed) components. The FEROS spectrum of V636 Cen was observed at JD2451211.85 (orbital phase 0.63). |
| Open with DEXTER | |
| In the text | |
| |
Figure 2: Fit of the theoretical light curve of the WD solution from Table 2 to the 1987 y observations. |
| Open with DEXTER | |
| In the text | |
| |
Figure 3: Fit of the theoretical light curve of the WD solution from Table 3 to the 1988 y observations. |
| Open with DEXTER | |
| In the text | |
| |
Figure 4: Spectroscopic orbital solution for V636 Cen (solid line: primary; dashed line: secondary) and radial velocities (filled circles: primary; open circles: secondary). The dotted line ( upper panel) represents the center-of-mass velocity of the system. Phase 0.0 corresponds to central primary eclipse. |
| Open with DEXTER | |
| In the text | |
| |
Figure 5:
V636 Cen compared to Y2 models
calculated for the measured abundance
|
| Open with DEXTER | |
| In the text | |
| |
Figure 6:
V636 Cen compared to Y2 models
calculated for
|
| Open with DEXTER | |
| In the text | |
| |
Figure 7:
V636 Cen compared to Y2 models
calculated for
|
| Open with DEXTER | |
| In the text | |
| |
Figure 8: V636 Cen compared to Claret models for the observed masses, calculated with different mixing length parameters. The four cases listed in Table 9 are shown. The circles on the evolutionary tracks mark model ages of 1.0, 2.0, and 3.0 Gyr. Case 1 = full drawn, thick; Case 2 = dashed; Case 3 = full drawn, thin, open circles; Case 4 = dotted. |
| Open with DEXTER | |
| In the text | |
| |
Figure 9: V636 Cen compared to Claret models. The four cases listed in Table 9 are shown. The curves illustrate model radii as function of age for the component masses (upper: primary; lower: secondary). Case 1 = full drawn, thick; Case 2 = dashed; Case 3 = full drawn, thin; Case 4 = dotted. The horizontal full drawn lines mark the observed radii of the components with errors (dotted lines). The vertical line marks the common age (1.35 Gyr) predicted by the case 1 models. |
| Open with DEXTER | |
| In the text | |
| |
Figure 10:
Main-sequence binaries with one or both components in the
0.80-1.10 |
| Open with DEXTER | |
| In the text | |
Copyright ESO 2009
Current usage metrics show cumulative count of Article Views (full-text article views including HTML views, PDF and ePub downloads, according to the available data) and Abstracts Views on Vision4Press platform.
Data correspond to usage on the plateform after 2015. The current usage metrics is available 48-96 hours after online publication and is updated daily on week days.
Initial download of the metrics may take a while.