| Issue |
A&A
Volume 502, Number 1, July IV 2009
|
|
|---|---|---|
| Page(s) | 155 - 173 | |
| Section | Interstellar and circumstellar matter | |
| DOI | https://doi.org/10.1051/0004-6361/200912250 | |
| Published online | 27 May 2009 | |
The diversity of methanol maser morphologies from VLBI observations![[*]](/icons/foot_motif.png)
A. Bartkiewicz1 - M. Szymczak1 - H. J. van Langevelde2,3 - A. M. S. Richards4 - Y. M. Pihlström5,6
1 - Torun Centre for Astronomy, Nicolaus Copernicus
University, Gagarina 11, 87-100 Torun, Poland
2 - Joint Institute for VLBI in Europe, Postbus 2, 7990 AA
Dwingeloo, The Netherlands
3 - Sterrewacht Leiden, Postbus 9513, 2300 RA Leiden, The Netherlands
4 - Jodrell Bank Centre for Astrophysics, School of Physics and Astronomy,
University of Manchester, M13 9PL, UK
5 - Department of Physics and Astronomy, MSC07 4220, University of New Mexico, Albuquerque,
NM 87131, USA
6 - National Radio Astronomy Observatory, 1003 Lopezville Road, Socorro, NM 87801, USA
Received 1 April 2009 / Accepted 23 April 2009
Abstract
Context. The 6.7 GHz methanol maser marks an early stage of high-mass star formation, but the origin of this maser is currently a matter of debate. In particular it is unclear whether the maser emission arises in discs, outflows or behind shocks running into rotating molecular clouds.
Aims. We investigated which structures the methanol masers trace in the environment of high-mass protostar candidates by observing a homogenous sample of methanol masers selected from Torun surveys. We also probed their origins by looking for associated H II regions and IR emission.
Methods. We selected 30 methanol sources with improved position accuracies achieved using MERLIN and another 3 from the literature. We imaged 31 of these using the European VLBI Network's expanded array of telescopes with 5-cm (6-GHz) receivers. We used the VLA to search for 8.4 GHz radio continuum counterparts and inspected Spitzer GLIMPSE data at 3.6-8 ![]() m from the archive.
m from the archive.
Results. High angular resolution images allowed us to analyze the morphology and kinematics of the methanol masers in great detail and verify their association with radio continuum and mid-infrared emission. A new class of ``ring-like'' methanol masers in star-forming regions appeared to be suprisingly common, 29% of the sample.
Conclusions. The new morphology strongly suggests that methanol masers originate in the disc or torus around a proto- or a young massive star. However, the maser kinematics indicate the strong influence of outflow or infall. This suggests that they form at the interface between the disc/torus and a flow. This is also strongly supported by Spitzer results because the majority of the masers coincide with 4.5 ![]() m emission to within less than 1
m emission to within less than 1
![]() .
Only four masers are associated with the central parts of UC H II regions. This implies that 6.7 GHz methanol maser emission occurs before H II region observable at cm wavelengths is formed.
.
Only four masers are associated with the central parts of UC H II regions. This implies that 6.7 GHz methanol maser emission occurs before H II region observable at cm wavelengths is formed.
Key words: stars: formation - ISM: molecules - masers - instrumentation: high angular resolution
1 Introduction
Methanol masers are commonly assumed to be associated with the environments of high-mass protostars, which provide the conditions required for methanol first to form on grains and then to be sublimated off, and finally to excite the maser transitions (Dartois et al. 1999; Cragg et al. 2002). Methanol maser emission at 6668.519 MHz is one of the strongest and most widespread (Menten 1991) of the the first observable manifestations of a newly formed high-mass star. Emission towards the archetypical source W3(OH) is characterized with a brightness temperature of up toAll major methanol targeted surveys of high angular resolution taken to date are summarized in Table 1. This indicates the diversity of the sample selections and observing parameters, which might have affected the data interpretation.
The first observations of the 6.7 GHz maser line at arcsec
resolution, using the ATCA, concentrated on the brightest sources
(Norris et al. 1993), followed by more extensive surveys
(Phillips et al. 1998; Walsh et al. 1998).
The relative positions of individual maser spots were determined with
![]() 0
0
![]() 05 accuracy and the distribution of bright
(>0.5 Jy beam-1) maser spots was resolved for the majority of
targets. Various morphological structures, such as simple, linear,
curved, complex and double, were found. The linear sizes varied between 190 and 5600 AU. Norris et al. (1993) found that in 10 out
of the 15 sources imaged the masers are located along lines or arcs of
which five sources show a clear velocity gradient along the line. They
proposed that the linear structures with velocity gradients are produced by
the masers residing in rotating discs seen edge-on. Phillips et al. (1998) increased the sample of masers studied with the
ATCA to 45 objects, finding that 17 of them show morphologies and
monotonic velocity gradients consistent with the circumstellar disc
hypothesis. Assuming a Keplerian disc, the enclosed masses range from 1 to
75
05 accuracy and the distribution of bright
(>0.5 Jy beam-1) maser spots was resolved for the majority of
targets. Various morphological structures, such as simple, linear,
curved, complex and double, were found. The linear sizes varied between 190 and 5600 AU. Norris et al. (1993) found that in 10 out
of the 15 sources imaged the masers are located along lines or arcs of
which five sources show a clear velocity gradient along the line. They
proposed that the linear structures with velocity gradients are produced by
the masers residing in rotating discs seen edge-on. Phillips et al. (1998) increased the sample of masers studied with the
ATCA to 45 objects, finding that 17 of them show morphologies and
monotonic velocity gradients consistent with the circumstellar disc
hypothesis. Assuming a Keplerian disc, the enclosed masses range from 1 to
75 ![]() .
In a sample of 97 sources Walsh et al. (1998) found
36 masers with some linear structure but
this was clearly-defined for only 9 sources. Therefore, the Keplerian
disc hypothesis accounts for only a small proportion of their sources;
most maser sites do not exhibit a systematic velocity gradient. They
suggested that the masers form rather behind shock fronts.
.
In a sample of 97 sources Walsh et al. (1998) found
36 masers with some linear structure but
this was clearly-defined for only 9 sources. Therefore, the Keplerian
disc hypothesis accounts for only a small proportion of their sources;
most maser sites do not exhibit a systematic velocity gradient. They
suggested that the masers form rather behind shock fronts.
The methanol masers are often not associated with detectable continuum
emission at centimeter wavelengths. Twenty-five of sources in the sample of
Phillips et al. (1998) are associated with an
ultra-compact H II (UC H II) region wherein the
methanol masers are slightly offset from the peak continuum
emission. They argued that the methanol sources without an H II region are possibly associated with less massive stars than those
with coincident radio continuum emission. Walsh et al. (1998) also found that most of their maser sources are
not associated with radio continuum brighter than ![]() 1 mJy,
implying that the phase of methanol maser occurs before an observable
UC H II region is formed. This suggestion was confirmed for
another sample of high-mass protostellar candidates (Beuther et al. 2002).
1 mJy,
implying that the phase of methanol maser occurs before an observable
UC H II region is formed. This suggestion was confirmed for
another sample of high-mass protostellar candidates (Beuther et al. 2002).
The detailed spatial structure of the methanol maser emission in these sources should provide further clues to their origin. To date, only a few observations at mas resolution have been published. Minier et al. (2000) observed 14 bright sources with the EVN. In 10 targets they found elongated structures with linear velocity gradients, which can be interpreted in terms of a circumstellar edge-on disc model. However, the estimates of central mass with this model for all but one source seemed to be far lower than expected for a high-mass star. Minier et al. (2000) suggested that this could be because the detectable masers delineate only part of the full diameters of the discs. They also proposed other models, such as accelerating outflows and shock fronts. Dodson et al. (2004) used the LBA to image five maser sites with linear morphologies at arcsecond resolutions. Their milliarcsecond resolution data were interpreted using a model of an externally generated planar shock propagating through a rotating dense molecular clump or star-forming core.
Van der Walt et al. (2007) argued that the model of Dodson et al. is inconsistent with the observed kinematic properties of the masers. They concluded that the observed rest frame distribution of maser velocities can be reproduced well with a simple Keplerian-like disc model. Source NGC 7538 IRS 1 is understood to be a good example of an edge-on Keplerian disc (Minier et al. 2000; Pestalozzi et al. 2004). However, high angular resolution mid-infrared (MIR) data were used to demonstrate that the outflow scenario is also plausible since the maser is not oriented perpendicular to the outflow as expected (De Buizer & Minier 2005). The kinematic and spatial distribution of the 12 GHz methanol masers in W3(OH) were successfully fitted by a model of a conical bipolar outflow (Moscadelli et al. 2002).
The initial methanol imaging surveys were mostly of relatively low
(arcsec) resolution, whilst very long baseline
interferometer (VLBI) studies probably missed fainter emission, such as
from the edges or the far side of putative discs. For the first time,
we have studied a large sample, detecting 31 sources at mas resolution and
![]() 10 mJy sensitivity, with sufficient astrometric precision to
complete robust identifications. This enables us to test the
competing hypotheses for the origins of methanol 6.7 GHz maser
emission, namely circumstellar discs, outflows, or propagating shock
fronts. In
this paper, we present EVN
10 mJy sensitivity, with sufficient astrometric precision to
complete robust identifications. This enables us to test the
competing hypotheses for the origins of methanol 6.7 GHz maser
emission, namely circumstellar discs, outflows, or propagating shock
fronts. In
this paper, we present EVN![]() observations of the methanol line and VLA observations of continuum
emission for a homogeneous sample of the methanol masers discovered in
the Torun untargeted survey (Szymczak et al. 2000,
2002). The preliminary results of methanol observations
were partly published in Bartkiewicz et al. (2004,
2006, 2009). As part of this survey
the discovery of a ring structure in G23.657-00.127 was reported by
Bartkiewicz et al. (2005). Our observations have enabled us
to detect a wide diversity of methanol maser geometries and demonstrate
for the first time that in a large fraction of sources the distribution
of the spots is ring-like.
observations of the methanol line and VLA observations of continuum
emission for a homogeneous sample of the methanol masers discovered in
the Torun untargeted survey (Szymczak et al. 2000,
2002). The preliminary results of methanol observations
were partly published in Bartkiewicz et al. (2004,
2006, 2009). As part of this survey
the discovery of a ring structure in G23.657-00.127 was reported by
Bartkiewicz et al. (2005). Our observations have enabled us
to detect a wide diversity of methanol maser geometries and demonstrate
for the first time that in a large fraction of sources the distribution
of the spots is ring-like.
2 Observations and data reduction
2.1 Sample selection
The sources were selected from two previous samples obtained using the
Torun 32 m antenna: the blind survey of the 6.7 GHz methanol maser
line (Szymczak et al. 2002) and the methanol survey of
IRAS-selected objects (Szymczak et al. 2000). The
untargeted flux-limited (3
![]() Jy) complete survey of
the Galactic plane region
Jy) complete survey of
the Galactic plane region
![]() and
and
![]() enabled the detection of
100 sources of which 26 were new. The same field includes 22 sources
discovered in the earlier survey of IRAS-selected objects. These 48 objects
were chosen as a sample for detailed studies.
We note that the mean single-dish methanol maser flux density
of these 48 sources is 16 Jy, a factor of 2 lower than that of the rest sources in the original samples.
This may have introduced a selection effect for masers that are
more distant, have intrinsically weaker maser emission, or are less
aligned with the line of sight.
enabled the detection of
100 sources of which 26 were new. The same field includes 22 sources
discovered in the earlier survey of IRAS-selected objects. These 48 objects
were chosen as a sample for detailed studies.
We note that the mean single-dish methanol maser flux density
of these 48 sources is 16 Jy, a factor of 2 lower than that of the rest sources in the original samples.
This may have introduced a selection effect for masers that are
more distant, have intrinsically weaker maser emission, or are less
aligned with the line of sight.
Depending on the maser flux densities the source coordinates
obtained using the 32 m dish are accurate to within 25-70
![]() .
We undertook astrometric
measurements using the first two MERLIN
.
We undertook astrometric
measurements using the first two MERLIN![]() antennas to be equipped with
6.7-GHz receivers (Mark II and Cambridge). These single baseline
observations detected 30 of the 48 objects, providing positions with
sub-arcsecond accuracy (see Sect. 2.2).
We included three additional objects in the same region that had not been
detected in the Torun surveys, for which accurate positions are reported in the
literature. These are: G22.357+00.066 (Walsh et al. 1998),
G25.411+00.105, and G32.992+00.034 (Beuther et al. 2002). The total sample selected for VLBI
observations comprised 33 sources in the Galactic within the region defined by
antennas to be equipped with
6.7-GHz receivers (Mark II and Cambridge). These single baseline
observations detected 30 of the 48 objects, providing positions with
sub-arcsecond accuracy (see Sect. 2.2).
We included three additional objects in the same region that had not been
detected in the Torun surveys, for which accurate positions are reported in the
literature. These are: G22.357+00.066 (Walsh et al. 1998),
G25.411+00.105, and G32.992+00.034 (Beuther et al. 2002). The total sample selected for VLBI
observations comprised 33 sources in the Galactic within the region defined by
![]() and
and
![]() (Table 2).
(Table 2).
2.2 MERLIN astrometry
The MERLIN observations at a rest frame frequency of 6668.519 MHz were carried out during observing runs between 2002 May and June and 2003 March and May. The typical on-source observing time was about 1 h for each target, and frequent observations of nearby phase reference sources and other calibrators were completed. Standard single-baseline data reduction procedures were applied (Diamond et al. 2003) using AIPS (the Astronomical Image Processing System). We searched for emission from each target in its vector-averaged spectrum by shifting the phase center from -200
Methanol maser emission was detected towards 30 of the 48 sources
observed, giving absolute positions of sufficient accuracy for
follow-up EVN observations. The MERLIN single-baseline astrometric
accuracy was between 0
![]() 3 and 1
3 and 1
![]() in most cases, depending on the
source brightness. However, the absolute position uncertainty of
sources at |Dec.| < 3
in most cases, depending on the
source brightness. However, the absolute position uncertainty of
sources at |Dec.| < 3
![]() 5 increased to 5-10
5 increased to 5-10
![]() .
The mean differences between the coordinates obtained
using a single dish and using the MERLIN single baseline were
30
.
The mean differences between the coordinates obtained
using a single dish and using the MERLIN single baseline were
30
![]()
![]() 6
6
![]() and 20
and 20
![]()
![]() 4
4
![]() in right
ascension and declination, respectively. No emission was detected
towards the remaining 18 sources above a sensitvity limit of 0.3 Jy
(Table 3). The possible causes of non-detection are:
variability, large errors in the single dish positions, interference
(for a few targets), or extended emission, resolved out by the
interferometer.
in right
ascension and declination, respectively. No emission was detected
towards the remaining 18 sources above a sensitvity limit of 0.3 Jy
(Table 3). The possible causes of non-detection are:
variability, large errors in the single dish positions, interference
(for a few targets), or extended emission, resolved out by the
interferometer.
2.3 EVN observations
The EVN observations of 33 targets in the 6.7 GHz methanol maser line were carried out in seven observing runs between 2003 and 2007 (projects EN001, EN003, EB031, EB034). The observing parameters are summarized in Table 4 including the date, duration of each run, working antennas, cycle time between the maser and phase-calibrator, spectral resolution, typical synthesized beam size, and 1Table 4: Details of EVN observations.
Table 5: Results of EVN observations.
Each observing run included scans of 3C 345, which was adopted as a
bandpass, delay and rate
calibrator. Five or six sources were, typically, observed in each
run, selected to be within a few degrees of each other in projection
on the sky and of similar maser emission velocities. A
phase-referencing scheme was applied in which a nearby, sufficiently bright
phase-calibrator for each session was selected from the VLBA
list. Details are given in Table 2. We used a spectral
bandwidth of 2 MHz yielding a velocity coverage of
![]() 100 km s-1. In all sessions, the Mk V recording system
was used with the exception of the first epoch when data were recorded
on tapes (Mk IV system). The data were correlated with the Mk IV Data
Processor operated by JIVE with 1024 spectral channels. In 4a and 4b
runs only, when all nine antennas were operating, data were correlated with
512 spectral channels in two passes i.e., separately for LHC and RHC
polarization, because of the correlator limitations. Left- and right-hand
circular polarization data were averaged to increase the
signal-to-noise ratio.
100 km s-1. In all sessions, the Mk V recording system
was used with the exception of the first epoch when data were recorded
on tapes (Mk IV system). The data were correlated with the Mk IV Data
Processor operated by JIVE with 1024 spectral channels. In 4a and 4b
runs only, when all nine antennas were operating, data were correlated with
512 spectral channels in two passes i.e., separately for LHC and RHC
polarization, because of the correlator limitations. Left- and right-hand
circular polarization data were averaged to increase the
signal-to-noise ratio.
2.3.1 Calibration and imaging
The data calibration and reduction were carried out in AIPS, employing standard procedures for spectral line observations. First, the amplitude was calibrated using measured antenna gain curves and system temperatures. In the second step, the parallactic angle corrections were added. The Effelsberg antenna was used as a reference when calibrating the data from all sessions. The instrumental delays for calibrated using phase-calibrator and 3C 345 observations. The phase-calibrator was mapped and a few iterations of self-calibration were completed, gradually shortening the time interval from 120 min to 1 min. Flux densities of 240, 202, 80, and 237 mJy were obtained for phase-calibrators J1825-0737, J1834-0301, J1856+0610, and J1907+0127, respectively. The maser data were corrected for the effects of the Earth's rotation and its motion within the Solar System and towards the LSR. After applying all corrections from the calibration sources, we compiled preliminary maps of the channel containing the brightest and most compact peak. We then used the clean components of that map, if possible, as the starting model for further rounds of self-calibration. In two cases, high quality images could only be obtained after the first round of self-calibration using a default model at the pointing position.
We searched for emission using large (2
![]()
![]() 2
2
![]() )
maps
over the entire band. We then created naturally-weighted
0.5
)
maps
over the entire band. We then created naturally-weighted
0.5
![]()
![]() 0.5
0.5
![]() cleaned images to use in analyzing maser
properties. The beam sizes for each data set are listed in Table 4. The pixel separation was 1 mas. The rms noise levels
in line-free channels were typically between 4 and 10 mJy beam-1depending on the run. The positions of all maser spots (above
5
cleaned images to use in analyzing maser
properties. The beam sizes for each data set are listed in Table 4. The pixel separation was 1 mas. The rms noise levels
in line-free channels were typically between 4 and 10 mJy beam-1depending on the run. The positions of all maser spots (above
5
![]() )
in each individual channel map were
determined by fitting two-dimensional Gaussian components. The formal
fitting errors were, typically, 0.01-0.15 mas in right ascension and
0.02-0.5 mas in declination, depending on the source strength and
structure.
)
in each individual channel map were
determined by fitting two-dimensional Gaussian components. The formal
fitting errors were, typically, 0.01-0.15 mas in right ascension and
0.02-0.5 mas in declination, depending on the source strength and
structure.
The astrometric accuracy for the 29 sources with
phase-referenced maps is limited by four factors. Firstly, the
phase-reference source positions have an accuracy of <1.5 mas. Secondly,
the antenna positions have an accuracy of ![]() 1 cm, corresponding to
an uncertainty of
1 cm, corresponding to
an uncertainty of ![]() 1 mas in RA and 2-3 mas in Dec. Thirdly, the separations
between the targets and phase reference sources were
1 mas in RA and 2-3 mas in Dec. Thirdly, the separations
between the targets and phase reference sources were ![]() 4
4
![]() 5,
which translate into a potential phase solution transfer error equivalent to 2 mas
in RA and 4-5 mas in Dec. Fourthly, the position uncertainty due to
noise is given by (beamsize)/(signal-to-noise ratio), which is
5,
which translate into a potential phase solution transfer error equivalent to 2 mas
in RA and 4-5 mas in Dec. Fourthly, the position uncertainty due to
noise is given by (beamsize)/(signal-to-noise ratio), which is ![]() 1 mas
for all our reference features. This infers a total astrometric
uncertainty of 3 mas in RA and 6 mas in Dec. For the remaining four
sources, we were unable to improve on the original MERLIN positions.
1 mas
for all our reference features. This infers a total astrometric
uncertainty of 3 mas in RA and 6 mas in Dec. For the remaining four
sources, we were unable to improve on the original MERLIN positions.
2.4 VLA continuum observations
In order to investigate the presence, position, and distribution of radio continuum emission associated with the 6.7 GHz methanol maser emission, we used the VLA at 8.4 GHz in A configuration (the project AB1250). Data were taken on 2007 August 18 for 12 h in a standard VLA continuum mode towards 30 sources in the sample. We did not observe the three sources that had not been included in the Torun surveys. We used 3C 286 as a flux calibrator and two phase-calibrators, 18517+0355 and 18323-1035, from a standard VLA list. To increase signal-to-noise ratio, we employed the fast switching mode with a cycle time between the phase-calibrator and the target of 50 s+250 s. This sequence lasted for 20 min for each target.
The data reduction was carried out following to the standard recipies
from AIPS Cookbook Appendix A (NRAO 2007). The amplitude and phases of
3C 286 were corrected using the default source model and 3C 286 was then
used to find the phase-calibrator flux densities. The antenna gains
were calibrated using the phase-calibrator data. Some bad points were
flagged and finally the images were created with natural
weighting. The 1
![]() noise level in the maps was typically
noise level in the maps was typically
![]() 50
50 ![]() Jy beam-1 and the beam was
0
Jy beam-1 and the beam was
0
![]() 35
35 ![]() 0
0
![]() 25.
25.
3 Results
3.1 Maser emission
We successfully mapped a total of 31 out of 33 methanol masers observed
with the EVN.
We were unable to image G31.156+00.045 and G37.479-00.105 because of
the weakness (<30 mJy) of the emission and to strong spike
artefacts in the channels at the maser velocity, respectively. We
were unable to improve on the MERLIN astrometry for G33.641-00.228
and G35.793-00.175 due to a problem with the EVN phase-referencing that
appeared during the first observing run.
We created fringe rate maps of the brightest channels of the targets
but still failed to determine the absolute position of these two sources.
The target sources were near zero declination (from +0
![]() 5 to +2
5 to +2
![]() 5).
Furthermore, because of the use of only four EVN telescopes,
the uv-plane coverage was poor for N-S baselines.
It is probable that these factors together with a too long
phase-referencing cycle time precluded a proper phase calibration. The
position of the third source, G36.115+00.552, observed in the first run,
was easily ascertained during the 4c run when eight antennas were working and the
cycle time between the maser and phase-calibrator was shorter.
5).
Furthermore, because of the use of only four EVN telescopes,
the uv-plane coverage was poor for N-S baselines.
It is probable that these factors together with a too long
phase-referencing cycle time precluded a proper phase calibration. The
position of the third source, G36.115+00.552, observed in the first run,
was easily ascertained during the 4c run when eight antennas were working and the
cycle time between the maser and phase-calibrator was shorter.
The results are summarized in Table 5. The names of the maser
sources correspond to the Galactic coordinates of the brightest spot of each target.
The absolute coordinates, the LSR velocity (![]() ), and the intensity
(
), and the intensity
(![]() )
are given for the brightest spot of each target.
We also indicate the velocity range of emission
)
are given for the brightest spot of each target.
We also indicate the velocity range of emission ![]() .
The area
containing all maser emission from each source was parameterised by
measuring the extent of the maser emission along the line given by a
least squares fit to the maser spot distribution (major axis and
position angle) and in the
perpendicular direction (minor axis). The morphological
class based on the relative positions of methanol maser spots and the
angular separation
.
The area
containing all maser emission from each source was parameterised by
measuring the extent of the maser emission along the line given by a
least squares fit to the maser spot distribution (major axis and
position angle) and in the
perpendicular direction (minor axis). The morphological
class based on the relative positions of methanol maser spots and the
angular separation
![]() of the brightest spot of each
source from the nearest 4.5
of the brightest spot of each
source from the nearest 4.5 ![]() m source (see Sect. 4.2) are also
given in Table 5.
m source (see Sect. 4.2) are also
given in Table 5.
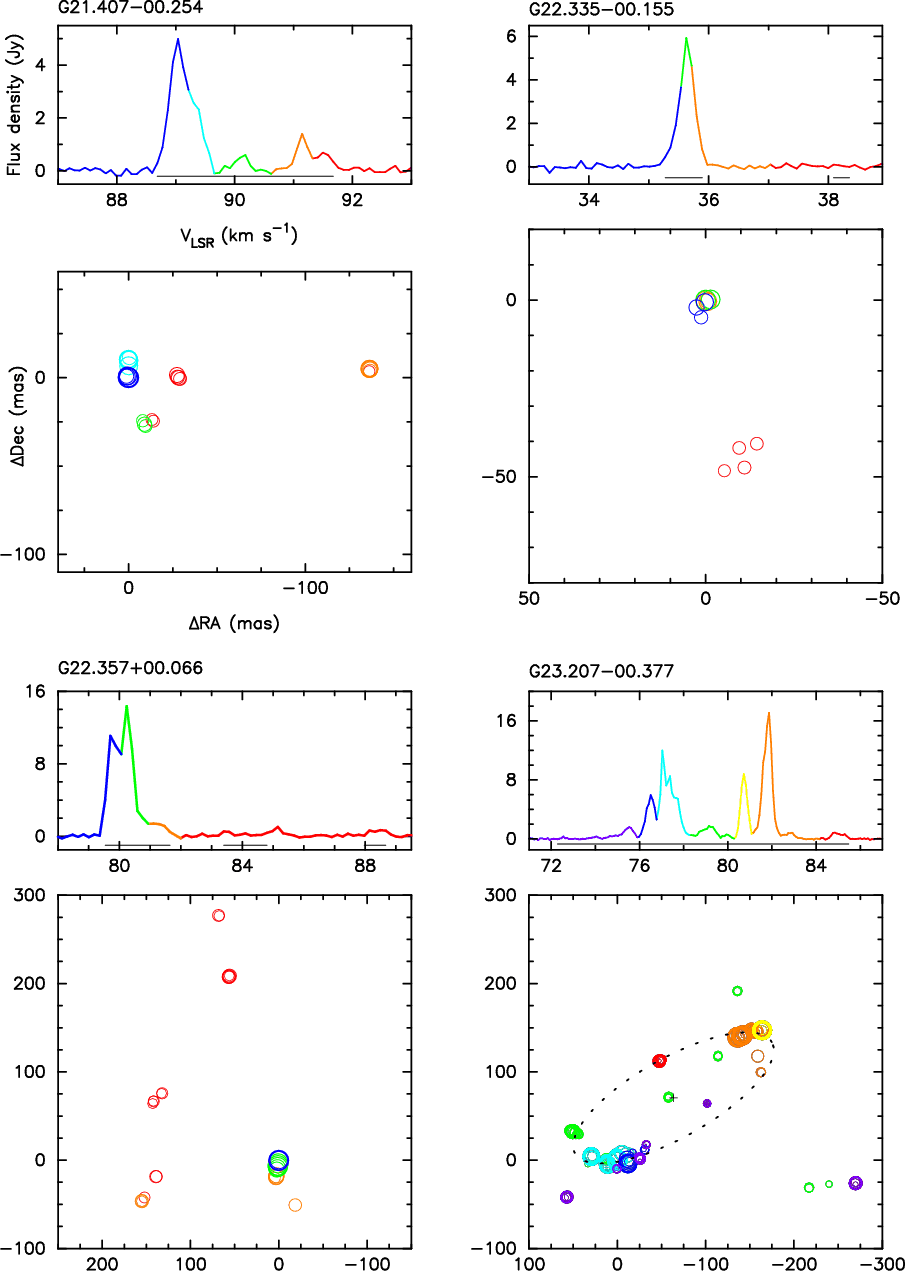 |
Figure 1: Spectra and maps of 6.7 GHz methanol maser emission of sources detected with the EVN. The names are the Galactic coordinates of the brightest spot as listed in Table 5. The thin bars under the spectra show the velocity ranges of spots displayed. The coordinates are relative to the brightest spots (Table 5). The sizes of circles are proportional to the logarithm of the intensities of maser spots. The colors of circles relate to the LSR velocities as indicated in the spectra, respectively. For the sources with ring-like morphologies, the best-fit ellipse and its center are marked by a dotted curve and a cross, respectively. The crosses coincide (within the uncertainties) with Spitzer IRAC MIR emission (Sect. 4.2). |
| Open with DEXTER | |
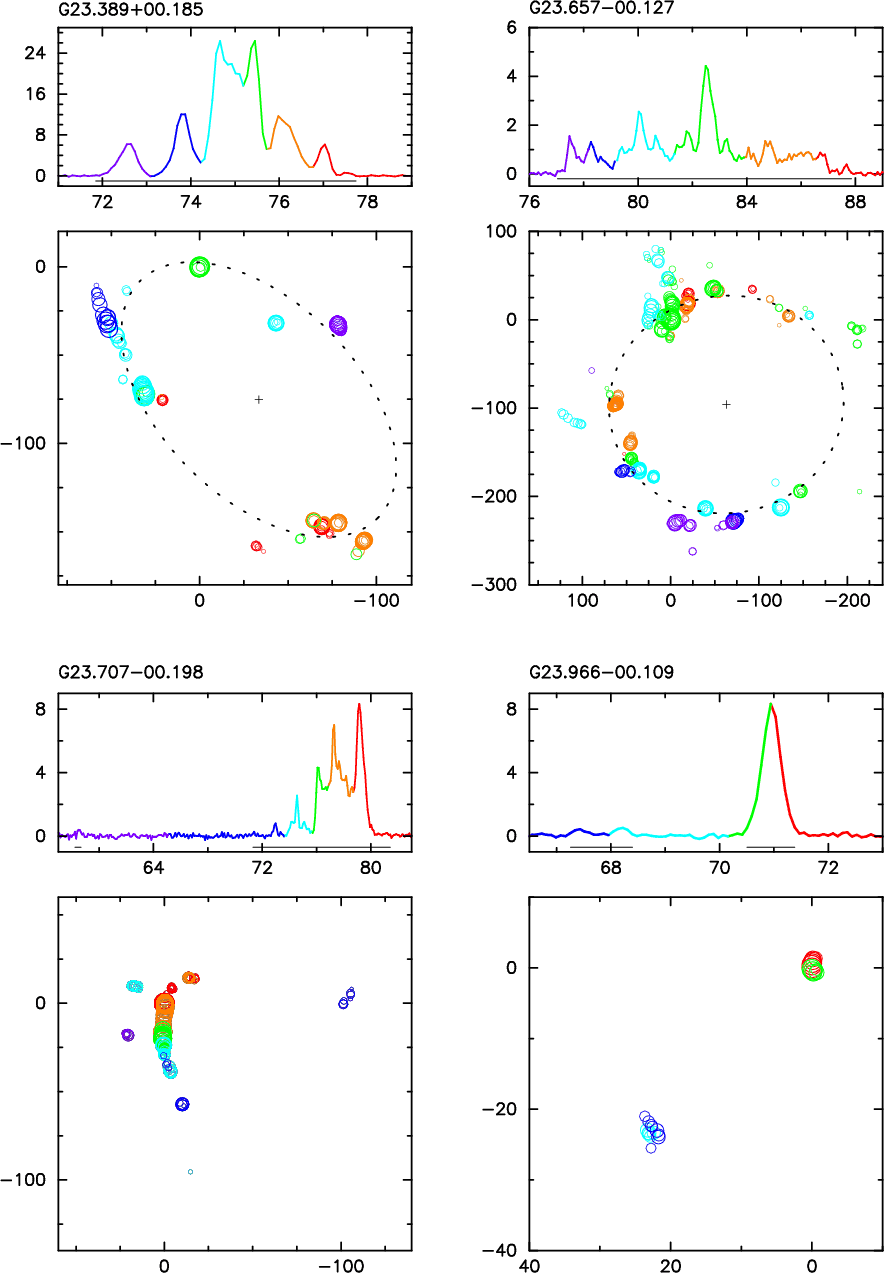 |
Figure 1: continued. |
| Open with DEXTER | |
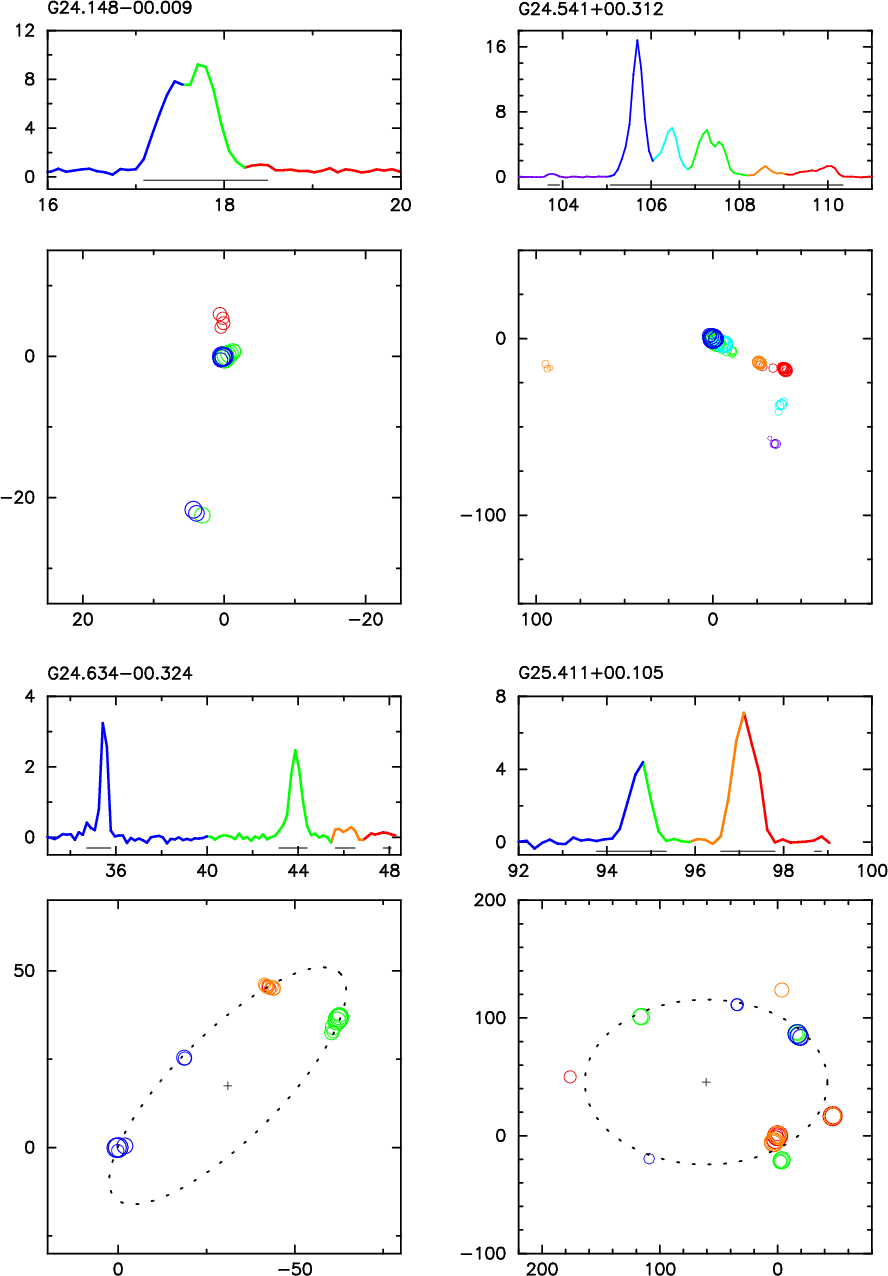 |
Figure 1: continued. |
| Open with DEXTER | |
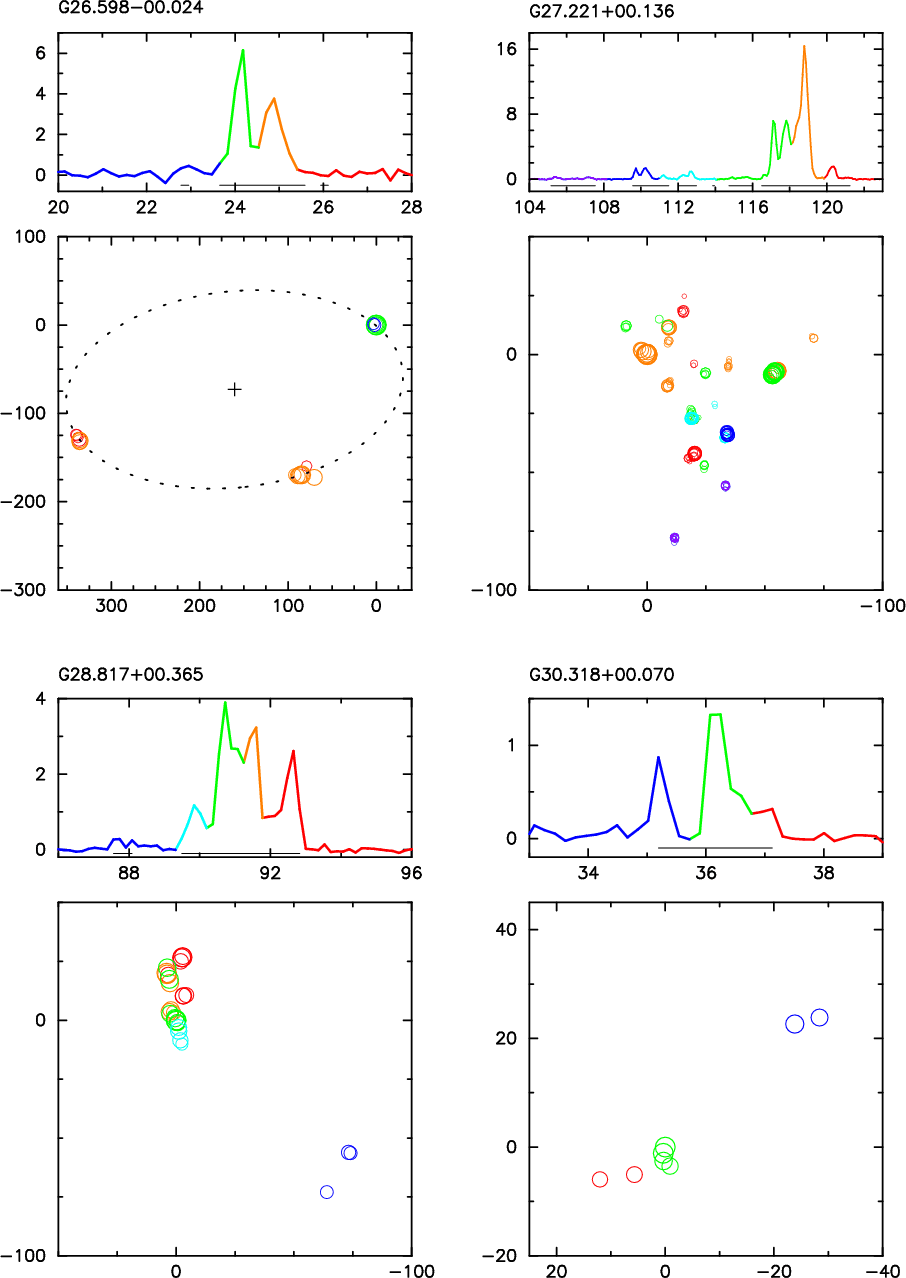 |
Figure 1: continued. |
| Open with DEXTER | |
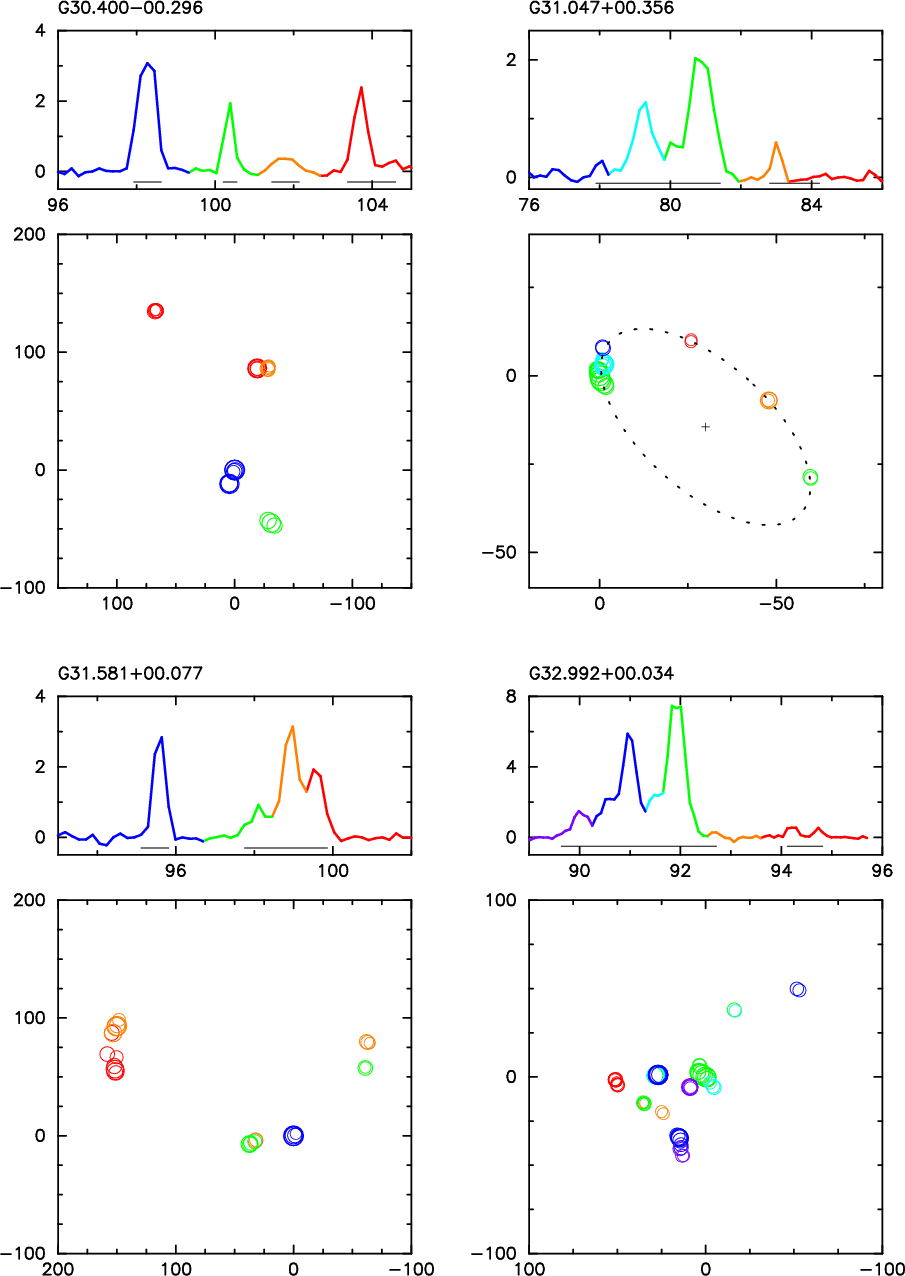 |
Figure 1: continued. |
| Open with DEXTER | |
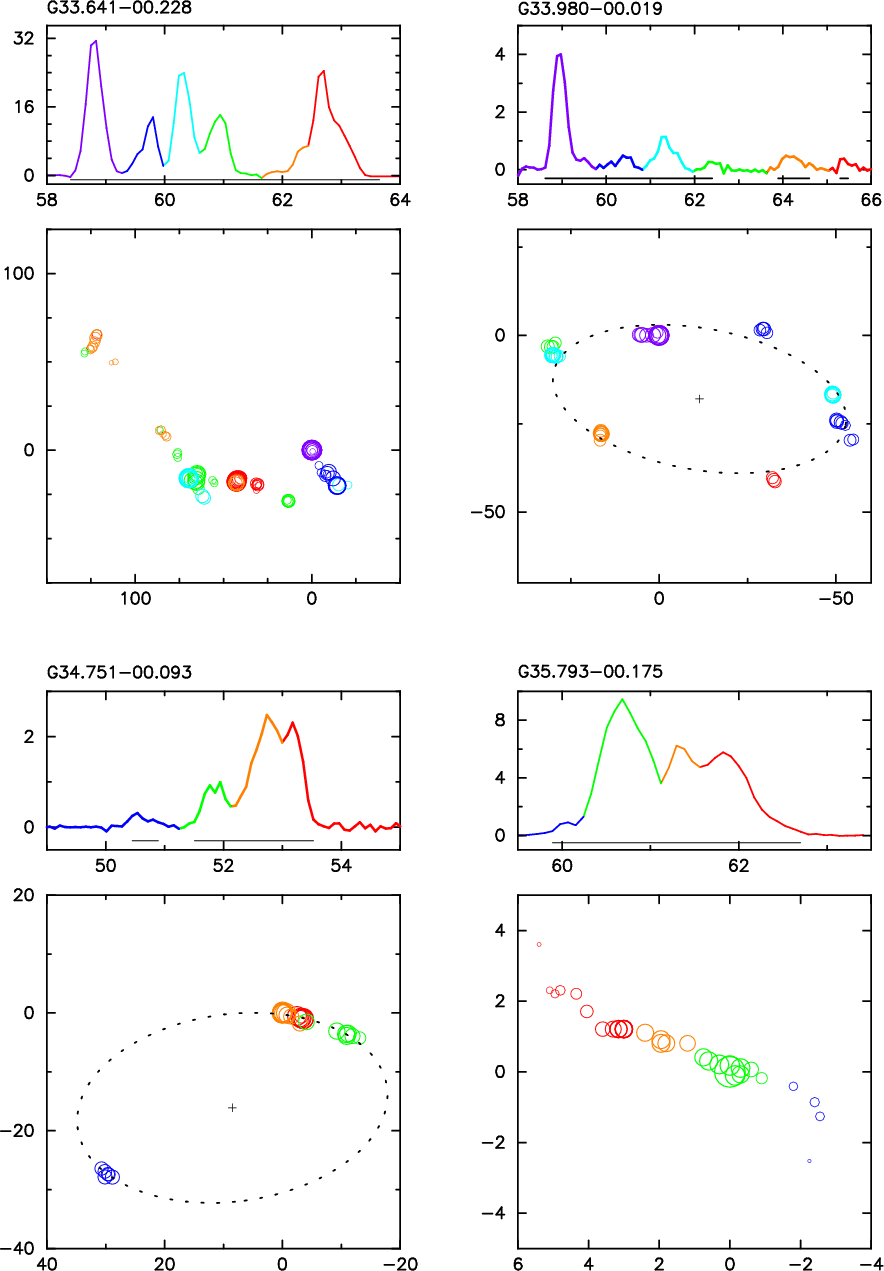 |
Figure 1: continued. |
| Open with DEXTER | |
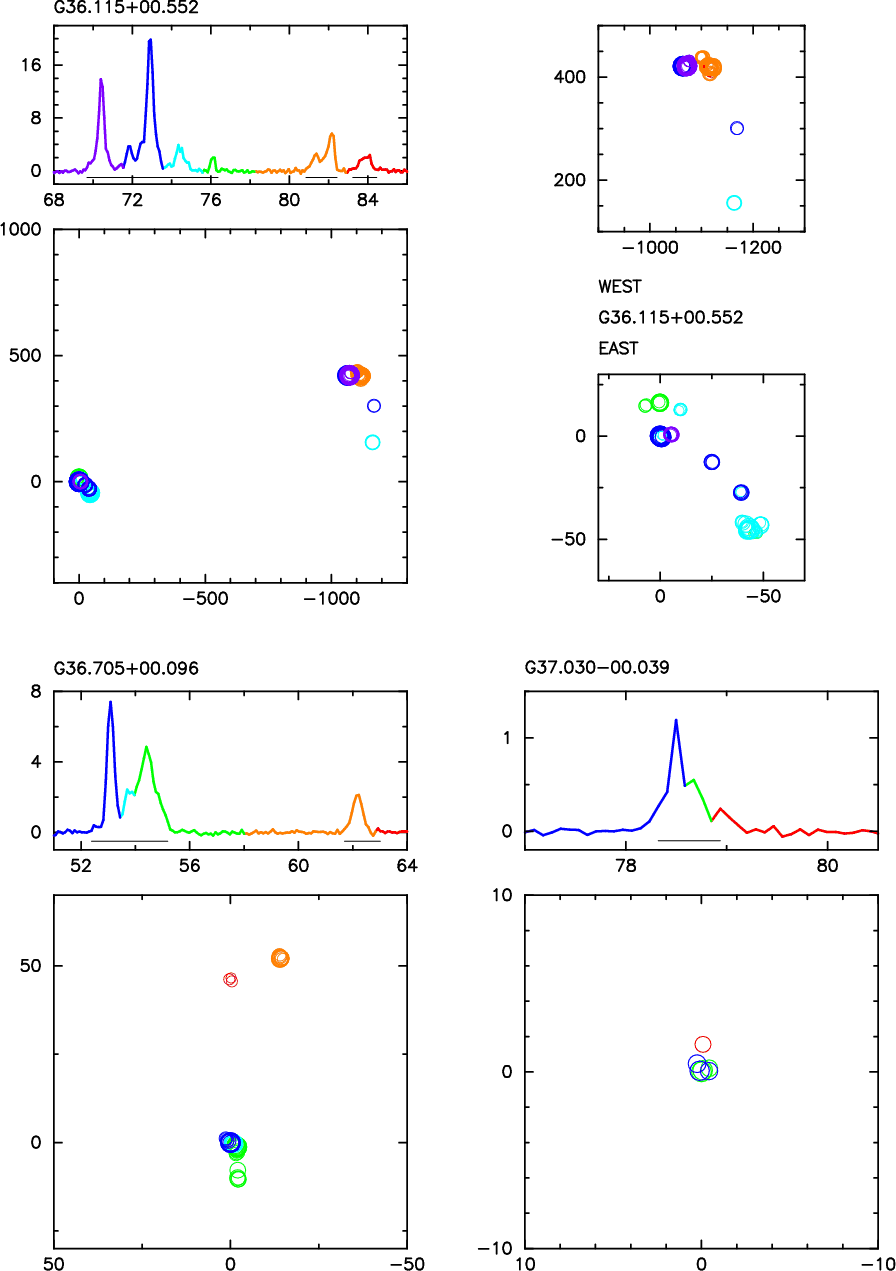 |
Figure 1: continued. |
| Open with DEXTER | |
 |
Figure 1: continued. |
| Open with DEXTER | |
In Fig. 1, we present the spectra and distribution
of the methanol maser emission for the 31 imaged targets. The spectra
were extracted from the map datacubes using the AIPS task ISPEC. They
represent the total amount of emission seen in the maps. In order to display
the detailed structures of masers, we show all the spots detected in each of
the individual channel maps. If spots appear at the same positions within
half of the beamwidth in at least three or two consecutive channels, for
observations with a spectral resolution of 0.09 km s-1 and
0.18 km s-1, respectively, we refer to them as a cluster. The
relevant parameters of all maser clusters for each source are
listed in Table 6: the position (![]() RA,
RA, ![]() Dec.)
relative to the brightest spot (given in Table 5), the
peak intensity (
Dec.)
relative to the brightest spot (given in Table 5), the
peak intensity (![]() ), and the LSR velocity (
), and the LSR velocity (
![]() )
of the brightest spot within a cluster. The velocity full-width at
half-maximum (FWHM) and the fitted peak amplitude (
)
of the brightest spot within a cluster. The velocity full-width at
half-maximum (FWHM) and the fitted peak amplitude (
![]() )
are
given if the spectrum of the cluster has a Gaussian profile.
)
are
given if the spectrum of the cluster has a Gaussian profile.
3.2 Radio continuum emission
We detected 8.4 GHz continuum emission in eight of the fields centered on methanol masers. Table 7 lists the continuum source names (derived from the Galactic coordinates of the 8.4-GHz peak fluxes), the peak and the integrated intensities, and the angular size of the radio continuum emission at the 3
The contour maps of all detections are shown in Figs. 2 and
3. The majority of sources are single peaked and their
angular sizes range from 0
![]() 6 to 3
6 to 3
![]() 8. Both G24.148-00.009 and
G36.115+00.552 have integrated flux densities that are equivalent to their peak
flux densities within the noise, suggesting that these sources are unresolved. The
values given for these sources in Table 7 correspond to
the angular size upper limits. G31.582+00.075 is one of the weakest
sources (
8. Both G24.148-00.009 and
G36.115+00.552 have integrated flux densities that are equivalent to their peak
flux densities within the noise, suggesting that these sources are unresolved. The
values given for these sources in Table 7 correspond to
the angular size upper limits. G31.582+00.075 is one of the weakest
sources (
![]() mJy beam-1) but has an
exceptionally complex structure. It is extended
(4
mJy beam-1) but has an
exceptionally complex structure. It is extended
(4
![]()
![]() 3
3
![]() )
and contains multiple emission peaks. The
typical upper limit (3
)
and contains multiple emission peaks. The
typical upper limit (3
![]() )
for the fluxes of the
remaining 22, non-detected sources is 0.15 mJy beam-1.
)
for the fluxes of the
remaining 22, non-detected sources is 0.15 mJy beam-1.
The 6.7-GHz methanol maser emission is found to be within 0
![]() 2 of the
8.4-GHz continuum position peaks of G24.148-00.009, G28.817+00.365, and
G36.115+00.552. The maser spots of source G26.598-00.024 are
0
2 of the
8.4-GHz continuum position peaks of G24.148-00.009, G28.817+00.365, and
G36.115+00.552. The maser spots of source G26.598-00.024 are
0
![]() 8 from the NE edge of the radio continuum source. Therefore, these
four sources are closely associated with the methanol masers
(Fig. 2). The continuum object G31.160+00.045 is located
11
8 from the NE edge of the radio continuum source. Therefore, these
four sources are closely associated with the methanol masers
(Fig. 2). The continuum object G31.160+00.045 is located
11
![]() 9 from the nominal position of the maser source
G31.156+00.045, but this maser has a position uncertainty of
10
9 from the nominal position of the maser source
G31.156+00.045, but this maser has a position uncertainty of
10
![]() because we were unable to image it with the EVN (Sect.
3.1), so it may also be associated with the radio continuum. On the
other hand, the continuum source G31.582+00.075 has a separation of
because we were unable to image it with the EVN (Sect.
3.1), so it may also be associated with the radio continuum. On the
other hand, the continuum source G31.582+00.075 has a separation of
![]() 9
9
![]() from the maser G31.581+00.077, but the latter has a
position accuracy of a few mas implying that the source and maser
are unlikely to be associated.
from the maser G31.581+00.077, but the latter has a
position accuracy of a few mas implying that the source and maser
are unlikely to be associated.
We conclude that only 4 (possibly 5) of 30 masers are associated with radio continuum at 8.4 GHz. This is consistent with previous findings (Phillips et al. 1998; Walsh et al. 1998; Beuther et al. 2002) that the 6.7 GHz methanol masers are rarely associated with centimeter wavelength continuum emission. However, 24-GHz ATCA observations detected continuum emission associated with methanol masers toward which no continuum at 8.4 GHz had been previously detected (Longmore et al. 2007). This opens the possibility of methanol masers being associated with hyper-compact H II regions (HC H II), which are ptically thick at frequencies <10 GHz.
Table 7: Results of VLA observations at 8.4 GHz.
![\begin{figure}
\par\includegraphics[scale=0.9]{12250fg9.eps}
\end{figure}](/articles/aa/full_html/2009/28/aa12250-09/img42.png) |
Figure 2:
The 8.4 GHz continuum emission towards four methanol maser sites taken
using VLA on 2007 August 18. The names of radio continuum sources (RC)
relate to the
Galactic coordinates of their peak fluxes. The peak and integrated fluxes
as well as the levels of rms
(1
|
| Open with DEXTER | |
3.3 General properties of the 6.7 GHz methanol masers
In 31 sources, we detected a total of 1934 maser spots that form 333 clusters.
The spectral profiles of 265 (80%) clusters are well fitted with
a Gaussian. The mean FWHM is
![]() km s-1 and
the median value is 0.37 km s-1. This is consistent with results from
single dish spectra at
km s-1 and
the median value is 0.37 km s-1. This is consistent with results from
single dish spectra at ![]() 0.05 km s-1 resolution
(Menten 1991; Caswell et al. 1995).
Nineteen sources have complex spectra, that is indicative of spectral blending, so that
the line width of individual features cannot be properly determined solely
from the spectrum.
0.05 km s-1 resolution
(Menten 1991; Caswell et al. 1995).
Nineteen sources have complex spectra, that is indicative of spectral blending, so that
the line width of individual features cannot be properly determined solely
from the spectrum.
We compared the basic parameters of the spectra and distributions of all masers from the sample. However, we did not find any relationships between the line parameters such as FWHM, brightness temperature, velocity range of the maser emission, and the size and geometry of the maser region.
The sources show a wide diversity of structures. The following types of morphology can be identified (Table 5):
Simple - the emission appears in a narrow velocity range
(
![]() km s-1) as a single peaked spectrum. The maser spots
form one cluster of size smaller than a few mas. G37.030-00.039 is the
only source with these properties. Its spectrum is obviously blended.
km s-1) as a single peaked spectrum. The maser spots
form one cluster of size smaller than a few mas. G37.030-00.039 is the
only source with these properties. Its spectrum is obviously blended.
Linear - the maser spots form a line in the plane of the sky. The angular extent of these maser structures ranges from 9 to 54 mas. In some sources (G30.318+00.070, G35.793-00.175) a monotonic velocity gradient is clearly seen. There are five linear sources in the sample.
Ring - this morphology appears to be ubiquitous in our
sample. The distributions of no less than nine sources display a ring
structure. Using the GNU Octave script developed by Fitzgibbon et al. (1999), we fitted an ellipse to the spatial
positions of the maser spots for each source. The results are
summarized in Table 8. The semi-major (a) and semi-minor
(b) axes range from 27 to 192 mas and from 15 to 128 mas,
respectively. The average size of the semi-major axis and the standard
dispersion in the mean is ![]() mas. The eccentricity (e) of the
best-fit model ellipses ranges from 0.38 to 0.94. The average
eccentricity and the standard dispersion of the mean is
mas. The eccentricity (e) of the
best-fit model ellipses ranges from 0.38 to 0.94. The average
eccentricity and the standard dispersion of the mean is
![]() .
The emission spans a modest velocity range of
(3.1-13.4 km s-1). All nine sources possess MIR counterparts
that coincide with the ellipse center to within less than
2
.
The emission spans a modest velocity range of
(3.1-13.4 km s-1). All nine sources possess MIR counterparts
that coincide with the ellipse center to within less than
2
![]() 5 (Table 5). In these objects it is very likely
that ring-like maser emission surrounds a central embedded star
(see Sect. 4.2). Three other sources (G28.817+00.365, G30.400-00.296,
G31.581+00.077) have a ring-like morphology,
although the separation between the MIR candidate counterpart and the ellipse
center is greater than 2
5 (Table 5). In these objects it is very likely
that ring-like maser emission surrounds a central embedded star
(see Sect. 4.2). Three other sources (G28.817+00.365, G30.400-00.296,
G31.581+00.077) have a ring-like morphology,
although the separation between the MIR candidate counterpart and the ellipse
center is greater than 2
![]() 5 (Table 5).
This is probably caused by the larger uncertainties in the maser
positions, since all three sources are at declinations near 0
5 (Table 5).
This is probably caused by the larger uncertainties in the maser
positions, since all three sources are at declinations near 0![]() .
These are assigned a tentative classification of the
ring-like class in Table 5.
.
These are assigned a tentative classification of the
ring-like class in Table 5.
Arched - maser spots are distributed along an arc of between 70 and 220 mas in length. The entire structure may show a systematic velocity gradient. Three (or possibly five) sources exhibit this morphology.
Complex - 9 (possibly 10) sources, i.e. about one third of the sample,
do not show any regularities in their spatial and velocity distributions.
These sources vary greatly in size from 31 ![]() 23 mas2 to
330
23 mas2 to
330 ![]() 174 mas2.
174 mas2.
Pair - this class was defined by Phillips et al. (1998), comprising two maser groups separated by
![]() 1 arcsec with
1 arcsec with ![]() 10 km s-1 difference in velocity. The
major axes of individual clusters are perpendicular to the line joining
them. In our sample, we found only one source with such a morphology.
10 km s-1 difference in velocity. The
major axes of individual clusters are perpendicular to the line joining
them. In our sample, we found only one source with such a morphology.
The most striking aspect of this study is that we find that the
commonest morphology of sources with a systematic maser structure is a
ring-like distribution of emission, seen in ![]() 29% of
objects. These rings probably surround young massive objects (see
Sect. 4). A similar proportion (
29% of
objects. These rings probably surround young massive objects (see
Sect. 4). A similar proportion (![]() 29-32%) of sources possess a
complex morphology. Linear sources with a monotonic velocity gradient
are relatively rare in the sample (
29-32%) of sources possess a
complex morphology. Linear sources with a monotonic velocity gradient
are relatively rare in the sample (![]() 16%).
16%).
3.4 Individual sources
This section presents comments on individual sources, including additional observational data relevant to the main aims of this paper. If not stated otherwise, we present the linear sizes of masers derived using the near (and far) kinematic distances given in Szymczak et al. (2005).
G22.357+00.066. The ATCA observations detected three maser
spots (Walsh et al. 1998), while the EVN revealed 31 spots
in 10 clusters. The strongest emission detected with both
interferometers, at 80.0 km s-1, coincides to within 1
![]() 7. We
detected new emission at close to 88.5 km s-1, 0
7. We
detected new emission at close to 88.5 km s-1, 0
![]() 20-0
20-0
![]() 27
north of the brightest spot, but a 77.0 km s-1 spot reported by
Walsh et al. (1998) was not redetected.
27
north of the brightest spot, but a 77.0 km s-1 spot reported by
Walsh et al. (1998) was not redetected.
G23.657-00.127. The parallax of this source was measured by Bartkiewicz et al. (2008) and its value indicates that the circular distribution of masers has a linear radius of 405 AU, which differs significantly from the sizes inferred from the kinematic distances. The source was observed at three epochs (Tables 2, 4) and the ring-like morphology clearly persisted over time spans of 1.25 and 2.5 yr. A detailed description of the brightness variability in the source will be presented in a forthcoming paper.
G23.707-00.198. Walsh et al. (1998) detected 7 masers in a velocity range of 74.9-81.4 km s-1, randomly
scattered over a 0
![]() 15 area. The first epoch of EVN maps of this
source (run 2) detected 23 clusters (140 spots) of which 19 form a
71 mas (corresponding to 360/750 AU for near/far kinematic
distance, respectively) long arc in the NS direction, which has a
velocity span of 8 km s-1. A clear velocity gradient is seen in
the overall arched distribution. The remaining clusters (all
blue-shifted) are located
15 area. The first epoch of EVN maps of this
source (run 2) detected 23 clusters (140 spots) of which 19 form a
71 mas (corresponding to 360/750 AU for near/far kinematic
distance, respectively) long arc in the NS direction, which has a
velocity span of 8 km s-1. A clear velocity gradient is seen in
the overall arched distribution. The remaining clusters (all
blue-shifted) are located ![]() 100 mas to the west (two clusters)
and
100 mas to the west (two clusters)
and ![]() 20 mas to the east (two clusters), relative to the
brightest spot. All four clusters are weak and were not
detected at a later epoch (run 3a), but this data had poorer
sensitivity. The brightest methanol maser component (Table 5) coincides in position (within 82 mas) and velocity
(within 0.1 km s-1) with weak (60 mJy beam-1) H2CO maser
emission at 4.8 GHz (Araya et al. 2006). We note that this is
well within the absolute positional accuracy of the H2CO
maser. Both masers lie at the edges of two probable H II
regions (Araya et al. 2006, their Fig. 2) with a peak
intensity of 6.1 mJy beam-1 at 5 GHz (VLA
C-configuration). Our VLA A-configuration data at 8.4 GHz do not show
any emission above the 0.15 mJy beam-1 sensitivity limit, nor
was this source detected at 8.6 GHz with a 2 mJy beam-1 limit
(Walsh et al. (1998). Therefore, the H II regions
are intrinsically weak at frequencies >5 GHz or they are possibly
resolved at subarcsec angular resolution.
20 mas to the east (two clusters), relative to the
brightest spot. All four clusters are weak and were not
detected at a later epoch (run 3a), but this data had poorer
sensitivity. The brightest methanol maser component (Table 5) coincides in position (within 82 mas) and velocity
(within 0.1 km s-1) with weak (60 mJy beam-1) H2CO maser
emission at 4.8 GHz (Araya et al. 2006). We note that this is
well within the absolute positional accuracy of the H2CO
maser. Both masers lie at the edges of two probable H II
regions (Araya et al. 2006, their Fig. 2) with a peak
intensity of 6.1 mJy beam-1 at 5 GHz (VLA
C-configuration). Our VLA A-configuration data at 8.4 GHz do not show
any emission above the 0.15 mJy beam-1 sensitivity limit, nor
was this source detected at 8.6 GHz with a 2 mJy beam-1 limit
(Walsh et al. (1998). Therefore, the H II regions
are intrinsically weak at frequencies >5 GHz or they are possibly
resolved at subarcsec angular resolution.
Table 8: Parameters of ellipses fitted to the maser spot distributions.
G25.411+00.105. Beuther et al. (2002) observed
this source with the ATCA and found only two components at velocities
of 94 and 97 km s-1 at positions that coincide to within 0
![]() 2
with the brightest spots in the EVN maps. We detected 30 spots,
probably because of our
2
with the brightest spots in the EVN maps. We detected 30 spots,
probably because of our ![]() 50 times higher sensitivity, although
variability may also be involved. The distance of 9.5 kpc (Sridharan
et al. 2002) implies that the linear radius of the ring
distribution is 980 AU.
50 times higher sensitivity, although
variability may also be involved. The distance of 9.5 kpc (Sridharan
et al. 2002) implies that the linear radius of the ring
distribution is 980 AU.
G26.598-00.024. The maser is located 0
![]() 85 from a cometary
H II region (Fig. 2) with a spectral index of 0.23 between 1.4 and 5 GHz (Becker et al. 1994). This
corresponds to linear distances of 1530(11 400) AU. The flux density
of 4.4 mJy at 8.4 GHz, compared with 55 mJy at 5 GHz, implies that
the turnover frequency is near 5 GHz. The methanol maser probably
forms behind a shock front induced by the H II region. The
strongest maser component, at 24.2 km s-1, coincides in
velocity with a 24.3 km s-1 absorption feature (-59.8 mJy)
in the H2CO line at 4.8 GHz (Sewilo et al. 2004).
85 from a cometary
H II region (Fig. 2) with a spectral index of 0.23 between 1.4 and 5 GHz (Becker et al. 1994). This
corresponds to linear distances of 1530(11 400) AU. The flux density
of 4.4 mJy at 8.4 GHz, compared with 55 mJy at 5 GHz, implies that
the turnover frequency is near 5 GHz. The methanol maser probably
forms behind a shock front induced by the H II region. The
strongest maser component, at 24.2 km s-1, coincides in
velocity with a 24.3 km s-1 absorption feature (-59.8 mJy)
in the H2CO line at 4.8 GHz (Sewilo et al. 2004).
G36.115+00.552. The brightest component of the NW maser
structure is 0
![]() 2 away from the weak point continuum source at
PA = 120
2 away from the weak point continuum source at
PA = 120![]() (Fig. 2). The shape of this complex suggests the
existence of an outflow. However, the kinematics are not consistent
with an outflow model (Sect. 4.2.3), nor do CO (2-1) line maps
at 29
(Fig. 2). The shape of this complex suggests the
existence of an outflow. However, the kinematics are not consistent
with an outflow model (Sect. 4.2.3), nor do CO (2-1) line maps
at 29
![]() resolution detect any molecular outflow (Zhang et al. 2005).
resolution detect any molecular outflow (Zhang et al. 2005).
4 Discussion
4.1 Kinematic models of the origins of methanol masers
The diverse morphologies of methanol masers indicate that there is no straighforward explanation of the origin of this emission, as discussed previously (Norris et al. 1993; Phillips et al. 1998; Minier et al. 2000). The main hypotheses for the origin of methanol masers assume that they originate in a circumstellar disc or torus, in outflows or a shock colliding with a rotating molecular cloud. The results that we obtained by applying the existing models to our data are summarized below.
4.1.1 Rotating and expanding ring
Ring-like masers, which are prevalent in the present sample,
may represent an inclined disc or torus around a
massive protostar or young star. There is a tendency for flatter
structures to have a larger velocity width, in all sources apart from
G23.657-00.127, (see Table 5), which suggests that we
observe the effects of inclination and all motion is
intrinsic to the plane of the ring. To test this
hypothesis, we applied the model of a rotating and expanding thin disc
(Uscanga et al. 2008) to the nine ring-like masers. First,
the coordinates of the spots (xj, yj) were
transformed to a reference system (xj', yj') in
which the origin was the center of the ellipse and the x'-axis was
directed along the major axis of the projected ellipse (see Fig. 1 in
Uscanga et al. 2008). We then attempted to reproduce the
kinematics using the LSR velocities (
![]() )
of the maser spots
to determine rotation (
)
of the maser spots
to determine rotation (
![]() ), expansion (
), expansion (
![]() ), and systemic (
), and systemic (
![]() )
velocities of each source. The
solutions were based on the minimisation of the
)
velocities of each source. The
solutions were based on the minimisation of the
![]() function
expressed in Eq. (8) by Uscanga et al. (2008)
function
expressed in Eq. (8) by Uscanga et al. (2008)
 |
where
We note that in general the expansion/infall velocity is higher than
the rotation component in the majority of sources, as can be
clearly seen in the maser spot distributions
(Fig. 1). If the rotation velocity was instead higher than that of
expansion or infall, the extreme values of
velocities could be produced where the major axis and ellipse
intersect (at a position angle of 0![]() from the major axis). In four
of nine sources, the opposite result is found that higher blue- or red-shifted
velocities appear where the minor axes intersect the ellipses (see
plots of G23.207-00.377, G23.389+00.185, G24.634-00.324, and
G25.411+00.105). The average position angle of the most extreme
velocity with respect to the major axis in all nine rings, and the
standard dispersion in the mean, is 52
from the major axis). In four
of nine sources, the opposite result is found that higher blue- or red-shifted
velocities appear where the minor axes intersect the ellipses (see
plots of G23.207-00.377, G23.389+00.185, G24.634-00.324, and
G25.411+00.105). The average position angle of the most extreme
velocity with respect to the major axis in all nine rings, and the
standard dispersion in the mean, is 52![]()
![]() 11
11![]() .
This suggests
that the masers originate in the zone where the radial motions exist
and expansion/infall plays a role. This could occur at the interface
between the disc/torus and outflow. A similar result was
reported for the archetypical object Cep A (Torstensson et al. 2009), where the major axis of the elliptical
distribution of 6.7 GHz methanol masers is perpendicular to the
bipolar outflow. Their LSR velocity distributions show similar
characteristics in that expansion or contraction dominates over the
rotation.
.
This suggests
that the masers originate in the zone where the radial motions exist
and expansion/infall plays a role. This could occur at the interface
between the disc/torus and outflow. A similar result was
reported for the archetypical object Cep A (Torstensson et al. 2009), where the major axis of the elliptical
distribution of 6.7 GHz methanol masers is perpendicular to the
bipolar outflow. Their LSR velocity distributions show similar
characteristics in that expansion or contraction dominates over the
rotation.
Table 9: Parameters derived by fitting kinematics of the rotating and expanding disc model.
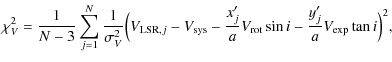
 |
Figure 4: Velocity of the maser spots in G33.980-00.019 versus azimuth angle measured from the major axis (north to east). The open circles represent the data and are proportional to the logarithm of the flux densities. The sinusoidal line represents the best-fit kinematical model of a rotating and expanding disc (with infintesimal thickness) using the parameters listed in Table 9. |
| Open with DEXTER | |
4.1.2 Linear maser as edge-on disc?
A thin disc seen edge-on would appear to have a linear morphology. Norris et al. (1998) argued that maser radiation propagates most strongly in the plane of the disc due to the greater column depth, to explain why so many methanol masers with linear morphology appeared in the data then available.We do not confirm this selection effect and note that the increased sensitivity detects more complex structures of masing regions. Only 16% of our sample are linear masers (compared to 29% ring-like masers) and they are also not the brightest, although it is possible that if there is strong expansion or infall, this would produce a steeper velocity gradient in edge-on discs and possibly make the masers fainter.
We calculated the mass that each linear maser structure would contain if
it originated in a disc in Keplerian rotation, using a
method similar to that of Minier et al. (2000). Assuming
that the masing area corresponds to the diameter of the disc, the
average central mass of these five linear structures is
0.12 ![]() or 0.44
or 0.44 ![]() for the near or far kinematic
distances, respectively. These subsolar values are very unlikely
for massive protostars. We agree with Minier et al. (2000)
that the underlying assumption is wrong and we do not detect the
full diameter of the disc. However, if we assume that the true extent of the
linear masers is similar to the average size of the major axis
of the nine ellipses (188 mas), this implies a mean central mass
of 76
for the near or far kinematic
distances, respectively. These subsolar values are very unlikely
for massive protostars. We agree with Minier et al. (2000)
that the underlying assumption is wrong and we do not detect the
full diameter of the disc. However, if we assume that the true extent of the
linear masers is similar to the average size of the major axis
of the nine ellipses (188 mas), this implies a mean central mass
of 76 ![]() or 190
or 190 ![]() for the near or far kinematic
distance, respectively. These values seem unrealistically high. Another
solution is that the masers are not bound by Keplerian rotation and
we argue that the most likely explanation is that
the linear morphology results from a different scenario. Linear
structures with ordered velocity gradients may be produced readily by
geometric effects in outflows. It seems significant that Szymczak
et al. (2007) detected molecular line emission from HCO+,
CO, and CS towards these five sources using the IRAM 30 m telescope,
supporting the outflow scenario. In addition, De Buizer et al. (2009) imaged SiO outflows towards five methanol masers
with linear morphologies. They found that the spatial orientations of
the outflows were inconsistent with the methanol masers tracing
discs. Linear masers produced by outflows seemed to provide a much more
plausible scenario. Finally, we also note that the linear masers have
a smaller extent than most other maser structures (Table 5). In particular, the entire G35.793-00.175 structure
is only 10 mas long corresponding to the typical size of an
individual maser cluster in other sources. We conclude that most of
the linear masers are more likely to be associated with outflows than
with edge-on discs, although it is possible that more sensitive
observations might indicate that some are part of ring-like or
other structures. G25.411+00.105 (see Sect. 3.4)
provides such an example, since Beuther et al. (2002)
found only two maser spots, whilst in the present study we detected
30 spots, forming a ring-like morphology.
for the near or far kinematic
distance, respectively. These values seem unrealistically high. Another
solution is that the masers are not bound by Keplerian rotation and
we argue that the most likely explanation is that
the linear morphology results from a different scenario. Linear
structures with ordered velocity gradients may be produced readily by
geometric effects in outflows. It seems significant that Szymczak
et al. (2007) detected molecular line emission from HCO+,
CO, and CS towards these five sources using the IRAM 30 m telescope,
supporting the outflow scenario. In addition, De Buizer et al. (2009) imaged SiO outflows towards five methanol masers
with linear morphologies. They found that the spatial orientations of
the outflows were inconsistent with the methanol masers tracing
discs. Linear masers produced by outflows seemed to provide a much more
plausible scenario. Finally, we also note that the linear masers have
a smaller extent than most other maser structures (Table 5). In particular, the entire G35.793-00.175 structure
is only 10 mas long corresponding to the typical size of an
individual maser cluster in other sources. We conclude that most of
the linear masers are more likely to be associated with outflows than
with edge-on discs, although it is possible that more sensitive
observations might indicate that some are part of ring-like or
other structures. G25.411+00.105 (see Sect. 3.4)
provides such an example, since Beuther et al. (2002)
found only two maser spots, whilst in the present study we detected
30 spots, forming a ring-like morphology.
4.1.3 Propagating shock front
Dodson et al. (2004) proposed another model for linear
methanol masers. A low speed planar shock propagating through the
rotating molecular cloud would produce a linear spatial distribution
of maser spots if the shock was propagating close to perpendicular to
the line of sight. The linearity would be distrupted where the shock
interacted with density perturbations in the star-forming regions. The
main diagnostic for this scenario is the perpendicular orientation of
velocity gradients within individual clusters with respect to the
main large-scale velocity gradient. We analyzed the internal gradients
of clusters and found this behaviour in three out of five masers with
linear morphologies (G22.335-00.155, G23.966-00.109, and
G30.318+00.070). In addition, the arched source, G33.641-00.228,
shows similar characteristics in four (out of six) clusters, which have
internal velocity gradients perpendicular to the longest axis of the
overall structure. All these masers have young massive objects in
close proximity less then 1
![]() 22 away
(Sect. 4.2), which could be responsible for the external shocks.
Proper motions studies are needed to verify this scenario.
22 away
(Sect. 4.2), which could be responsible for the external shocks.
Proper motions studies are needed to verify this scenario.
4.1.4 Bipolar outflow
The bipolar outflow model for H2O masers associated with a high-mass young stellar object was proposed by Moscadelli et al. (2000) and confirmed in IRAS20126+4104 by proper motion studies (Moscadelli et al. 2005). We also tested this model for all sources in this study. The assumptions of the model are as follows: masers originate in the surface of a conical bipolar jet due to the interaction between the ionised jet and the surrounding neutral medium, and the velocity of a maser spot,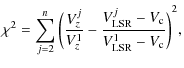 |
where n is the number of spots,
Table 10: Parameters derived from fitting the biconical outflow model of Moscadelli et al. (2000).
We obtained reasonable fits for only two of the arched sources,
G23.707-00.198 and G24.541+00.312. The following best-fit model parameters are
listed in Table 10: the position of the vertex, the
opening angle of the cone (2![]() ), the inclination angle between
the outflow axis and the z-axis (
), the inclination angle between
the outflow axis and the z-axis (![]() ), and the direction of the
x-axis, PA, which is the position angle of the outflow on the plane
of the sky. A comparison between the modelled and observed data and a
sketch of the orientation of the outflow was presented previously in
Fig. 1 in Bartkiewicz et al. (2006). It is
significant that the vertices of the cones calculated for both sources
coincide with infrared sources within the position uncertainties
(Sect. 4.2). In addition, molecular line emission at
similar LSR velocities was reported towards both sources (Szymczak et al. 2007). As we mentioned previously, Araya et al. (2006) imaged H2CO maser emission at 4.8 GHz towards
G24.541+00.312. All of these findings ensure that the outflow scenario is
plausible for these two objects.
), and the direction of the
x-axis, PA, which is the position angle of the outflow on the plane
of the sky. A comparison between the modelled and observed data and a
sketch of the orientation of the outflow was presented previously in
Fig. 1 in Bartkiewicz et al. (2006). It is
significant that the vertices of the cones calculated for both sources
coincide with infrared sources within the position uncertainties
(Sect. 4.2). In addition, molecular line emission at
similar LSR velocities was reported towards both sources (Szymczak et al. 2007). As we mentioned previously, Araya et al. (2006) imaged H2CO maser emission at 4.8 GHz towards
G24.541+00.312. All of these findings ensure that the outflow scenario is
plausible for these two objects.
We tested the outflow model intensively on the four maser sources associated with H II regions. However, we did not achieve a reasonable fit that would place the vertex of the cone at the center of the radio continuum object, whilst reproducing the maser spot kinematics, for any of these sources.
4.2 Association with MIR emission
Early work by Szymczak et al. (2002) showed that
![]() 80% of methanol masers have infrared counterparts in IRAS
and/or MSX catalogues. Since
maser data with position accuracy as good or better than these IR
catalogues (30
80% of methanol masers have infrared counterparts in IRAS
and/or MSX catalogues. Since
maser data with position accuracy as good or better than these IR
catalogues (30
![]() -5
-5
![]() )
have become available, the fraction
of secure identifications has diminished (Pandian et al. 2007). We can now attempt identifications with
sub-arcsec resolution data.
)
have become available, the fraction
of secure identifications has diminished (Pandian et al. 2007). We can now attempt identifications with
sub-arcsec resolution data.
We used Spitzer IRAC data to test the association between methanol
masers and MIR emission. Images at 3.6, 4.5, 5.8, and 8.0 ![]() m from
the GLIMPSE survey, all at 0
m from
the GLIMPSE survey, all at 0
![]() 6 resolution (Fazio et al. 2004), were retrieved from the Spitzer
archive
6 resolution (Fazio et al. 2004), were retrieved from the Spitzer
archive![]() and compared with the radio data using AIPS.
and compared with the radio data using AIPS.
 |
Figure 5:
Histogram of number of the methanol masers as a function
of angular separation from associated MIR sources at
4.5 |
| Open with DEXTER | |
The angular separation between the brightest maser spot of each source
in our sample and the nearest MIR source at 4.5 ![]() m (
m (
![]() )
is given in Table 5 and a histogram of the results
is shown in Fig. 5. The average separation for the entire
sample is 1
)
is given in Table 5 and a histogram of the results
is shown in Fig. 5. The average separation for the entire
sample is 1
![]() 18
18 ![]() 0
0
![]() 19 and the median value is 0
19 and the median value is 0
![]() 89,
whereas, for the subsample of 19 objects at |Dec.|>3
89,
whereas, for the subsample of 19 objects at |Dec.|>3
![]() 5 with
coordinates measured using the EVN, the corresponding values are
0
5 with
coordinates measured using the EVN, the corresponding values are
0
![]() 61
61 ![]() 0
0
![]() 09 and 0
09 and 0
![]() 51, respectively. The remaining 14
targets with |Dec.|<3
51, respectively. The remaining 14
targets with |Dec.|<3
![]() 5, or with positions derived from the
MERLIN data alone, show a larger
5, or with positions derived from the
MERLIN data alone, show a larger
![]() with the mean and
median values of 1
with the mean and
median values of 1
![]() 96
96 ![]() 0
0
![]() 35 and 1
35 and 1
![]() 61, respectively.
Since the images of these sources had poor uv-plane coverage and hence
less accurate astrometry, we suggest that their higher estimates of
61, respectively.
Since the images of these sources had poor uv-plane coverage and hence
less accurate astrometry, we suggest that their higher estimates of
![]() have a higher uncertainty and that most associations
are also likely to be genuine.
have a higher uncertainty and that most associations
are also likely to be genuine.
We conclude that the majority of maser sources coincide, within
![]() 1
1
![]() with MIR emission, i.e., the maser emission from each
source falls within one Spitzer pixel (nominal size
with MIR emission, i.e., the maser emission from each
source falls within one Spitzer pixel (nominal size ![]() 1
1
![]() 2,
see Fazio et al. 2004) in the IRAC 4.5
2,
see Fazio et al. 2004) in the IRAC 4.5 ![]() m image. This
strongly reinforces the finding by Cyganowski et al. (2008), who reported coincidences to within
m image. This
strongly reinforces the finding by Cyganowski et al. (2008), who reported coincidences to within
![]() 5
5
![]() for 46 out of 64 methanol sources with positions
measured using the ATCA. Extended emission in the IRAC 4.5
for 46 out of 64 methanol sources with positions
measured using the ATCA. Extended emission in the IRAC 4.5 ![]() m
band has been postulated to be a tracer of shocked molecular gas in
protostellar outflows (e.g., Davies et al. 2007; Cyganowski
et al. 2008 and references therein). This IRAC band
contains H2 and CO lines that may be excited by shocks. Using
shock models, Smith & Rosen (2005) predicted that H2emission in outflows is 5-14 times stronger in the 4.5
m
band has been postulated to be a tracer of shocked molecular gas in
protostellar outflows (e.g., Davies et al. 2007; Cyganowski
et al. 2008 and references therein). This IRAC band
contains H2 and CO lines that may be excited by shocks. Using
shock models, Smith & Rosen (2005) predicted that H2emission in outflows is 5-14 times stronger in the 4.5 ![]() m band
than in the 3.6
m band
than in the 3.6 ![]() m band. Cyganowski et al. (2008)
identified more than 300 objects with extended 4.5
m band. Cyganowski et al. (2008)
identified more than 300 objects with extended 4.5 ![]() m emission,
which may relate to outflows in massive stars. Four maser sources from
our sample, G23.966-00.109, G35.793-00.175, G37.479-00.105, and
G39.100+00.491, were included in their catalogue.
m emission,
which may relate to outflows in massive stars. Four maser sources from
our sample, G23.966-00.109, G35.793-00.175, G37.479-00.105, and
G39.100+00.491, were included in their catalogue.
In order to search for extended emission, we created images of the
4.5 ![]() m-3.6
m-3.6 ![]() m excess by subtracting the 3.6
m excess by subtracting the 3.6 ![]() m
image of each of our sources from its 4.5
m
image of each of our sources from its 4.5 ![]() m counterpart, and
compared these with the 4.5
m counterpart, and
compared these with the 4.5 ![]() m image.
All the sources have extended 4.5
m image.
All the sources have extended 4.5 ![]() m emission.
Figure 6 shows the
4.5
m emission.
Figure 6 shows the
4.5 ![]() m-3.6
m-3.6 ![]() m excess superimposed on the 4.5
m excess superimposed on the 4.5 ![]() m image
for selected sources. Source G21.407-00.254
illustrates how the maser emission located precisely inside the brightest
pixel of the 4.5
m image
for selected sources. Source G21.407-00.254
illustrates how the maser emission located precisely inside the brightest
pixel of the 4.5 ![]() m-3.6
m-3.6 ![]() m image outside the 4.5
m image outside the 4.5 ![]() m peak.
There is also evidence that maser clusters in at least three sources
are associated with 4.5
m peak.
There is also evidence that maser clusters in at least three sources
are associated with 4.5 ![]() m emission excess. The image at the
position of G24.148-00.009 shows that the maser
coincides exactly with maxima of both the 4.5
m emission excess. The image at the
position of G24.148-00.009 shows that the maser
coincides exactly with maxima of both the 4.5 ![]() m-3.6
m-3.6 ![]() m excess
and of the 4.5
m excess
and of the 4.5 ![]() m emission. Weak, extended 4.5
m emission. Weak, extended 4.5 ![]() m emission is also
seen at the edges of two neighbouring sources and in diffuse lanes.
The maser G37.598+00.425 coincides with
a maximum in a very asymmetric distribution of 4.5
m emission is also
seen at the edges of two neighbouring sources and in diffuse lanes.
The maser G37.598+00.425 coincides with
a maximum in a very asymmetric distribution of 4.5 ![]() m-3.6
m-3.6 ![]() m
emission excess that is displaced by
m
emission excess that is displaced by ![]() 1
1
![]() 5 from a peak of
4.5
5 from a peak of
4.5 ![]() m emission, implying that the methanol maser and the
excess in the 4.5
m emission, implying that the methanol maser and the
excess in the 4.5 ![]() m IRAC band are very strongly related.
Similar evidence is provided by G38.203-00.067, where the maser is
offset by more than 8
m IRAC band are very strongly related.
Similar evidence is provided by G38.203-00.067, where the maser is
offset by more than 8
![]() from a bright MIR object. The maser is
from a bright MIR object. The maser is
![]() 1
1
![]() 7 away from a weak bump in a large lane of diffuse
4.5
7 away from a weak bump in a large lane of diffuse
4.5 ![]() m-3.6
m-3.6 ![]() m emission excess. Inspection of IRAC images
for other bands suggests that the maser is probably associated with a faint
MIR object.
m emission excess. Inspection of IRAC images
for other bands suggests that the maser is probably associated with a faint
MIR object.
All the counterparts in the sample have MIR properties typical of
embedded young massive objects (e.g., Kumar et al. 2007) associated
with the methanol masers (Ellingsen 2006). We defer a detailed
discussion of the MIR spectral indices of individual objects, because several
bright sources (e.g., G23.389+00.185, G23.657-00.127, and
G24.634-00.324) are saturated in the IRAC images, while for others
only upper limits to the 3.6 ![]() m flux can be derived
(e.g., G23.966-00.109, G37.030-00.039, and G38.203-00.067). We
note only, that the MIR objects associated with methanol masers that have a
ring-like morphology have much stronger emission at 8
m flux can be derived
(e.g., G23.966-00.109, G37.030-00.039, and G38.203-00.067). We
note only, that the MIR objects associated with methanol masers that have a
ring-like morphology have much stronger emission at 8 ![]() m, and all
the objects that are saturated in the IRAC images have regular maser
structures. In contrast, no object saturated in the IRAC images has a
complex maser morphology. This suggests that the MIR counterparts of
masers with less regular structures are deeply embedded massive
stars that are younger than the counterparts of those with more
regular, ring-like maser structures. One can speculate that in those
younger objects the methanol maser originates in a limited number of
confined regions, whilst more regular structures emerge during later
evolutionary stages.
m, and all
the objects that are saturated in the IRAC images have regular maser
structures. In contrast, no object saturated in the IRAC images has a
complex maser morphology. This suggests that the MIR counterparts of
masers with less regular structures are deeply embedded massive
stars that are younger than the counterparts of those with more
regular, ring-like maser structures. One can speculate that in those
younger objects the methanol maser originates in a limited number of
confined regions, whilst more regular structures emerge during later
evolutionary stages.
In summary, we have found strong evidence of a close coincidence of
6.7 GHz methanol masers with 4.5 ![]() m emission excess. This
provides a firm argument that methanol emission originates in those inner
parts of an outflow or disc/torus where the molecular gas is shocked.
m emission excess. This
provides a firm argument that methanol emission originates in those inner
parts of an outflow or disc/torus where the molecular gas is shocked.
This hypothesis is strongly supported by the kinematic model that can be successfully applied to the ring masers in our sample, which involved a rotating and expanding disc wherein expansion dominates the velocity field. Moreover, a fraction of masers seem to fit the model of a bipolar jet or that of a shock front colliding with the surrounding molecular material.
5 Conclusions
We have completed a 6.7 GHz methanol line imaging survey of 33 maser sources in the Galactic plane. High quality EVN images were obtained for 31 targets showing their mas-scale structures, from which we derived the absolute positions of 29 sources with a few mas accuracy. In most cases, the masers exhibit complex structures. The observed morphologies can be divided into five groups: simple, linear, ring-like, complex, arched, and pair. It is surprising that about 29% of the sources exhibit ring-like distributions of maser spots that were not apparent in previous VLBI surveys, which were less sensitive and concentrated on brighter masers. We find that many of the other ordered structures, notably linear and arched, can be interpreted as originating from the interaction between collimated or biconical outflows and the surrounding medium.A simultaneous survey at high angular resolution of continuum emission at 8.4 GHz towards the maser targets revealed that only 16% of the methanol masers appear to be physically related to H II regions. In three cases, the maser coincides with a peak in a compact and relatively weak continuum object. These are believed to be young UC H II regions. In general, these results seem to imply that 6.7 GHz methanol masers appear before the ionised region is detectable at cm wavelengths. The hypothesis that these masers are possible associated with HC H II regions needs to be verified.
We used the Spitzer GLIMPSE survey to demonstrate that the majority of methanol masers are closely associated with MIR emission. Analyzis of the MIR counterparts suggests that masers with a regular, ring-like morphology are associated with more evolved proto- or young stars, relative to the counterparts of masers with more complex, irregular structures. Moreover, both the kinematics of the masers with a ring-like distribution and the characteristics of associated MIR emission are consistent with a scenario in which the methanol emission is produced by shocked material associated with a disk or torus, possibly from an interaction with the outflow.
Acknowledgements
Our special acknowledgements to Dr. Peter Thomasson at Jodrell Bank Observatory and to Dr. Bob Campbell at JIVE for detailed support in many stages of this project. We also thank Dr. Riccardo Cesaroni, Dr. Luca Moscadelli, Dr. Lucero Uscanga, Dr. Krzysztof Gozdziewski, Dr. Piotr Niezurawski and Kalle Torstensson for useful discussions. This work was benefited from the Polish MNiI grant 1P03D02729 and from research funding from the EC 6th Framework Programme.
The European VLBI Network (EVN) is a joint facility of European, Chinese, South African and other radio astronomy institutes funded by their national research councils. MERLIN is a National Facility operated by the University of Manchester at Jodrell Bank Observatory on behalf of STFC. The Very Large Array (VLA) of the National Radio Astronomy Observatory is a facility of the National Science Foundation operated under cooperative agreement by Associated Universities, Inc. This research has made use of the NASA/IPAC Infrared Science Archive, which is operated by the Jet Propulsion Laboratory, California Institute of Technology, under contract with the National Aeronautics and Space Administration.
References
- Araya, E., Hofner, P., Goss, W. M., et al. 2006, ApJ, 643, L33 [NASA ADS] [CrossRef] (In the text)
- Bartkiewicz, A., Szymczak, M., & van Langevelde, H. J. 2004, PoS, Proceeding of the 7th European VLBI Network Symposium, ed. R. Bachiller, F. Colomer, J. F. Desmurs, & P. de Vincente, Toledo, Spain, 187 (In the text)
- Bartkiewicz, A., Szymczak, M., & van Langevelde, H. J. 2005, A&A, 442, L61 [NASA ADS] [CrossRef] [EDP Sciences] (In the text)
- Bartkiewicz, A., Szymczak, M., & van Langevelde, H. J. 2006, PoS, Proceedings of the 8th European VLBI Network Symposium, ed. A. Marecki, 039 (In the text)
- Bartkiewicz, A., Brunthaler, A., Szymczak, M., van Langevelde, H. J., & Reid, M. J. 2008, A&A, 490, 787 [NASA ADS] [CrossRef] [EDP Sciences] (In the text)
- Bartkiewicz, A., Szymczak, M., & van Langevelde, H. J. 2009, PoS, Proceedings of the 9th European VLBI Network Symposium, ed. F. Montovani, 037 (In the text)
- Becker, R. H., White, R. L., Helfand, D. J., & Zoonematkermani, S. 1994, ApJS, 91, 347 [NASA ADS] [CrossRef] (In the text)
- Beuther, H., Walsh, A., Schilke, P., et al. 2002, A&A, 390, 289 [NASA ADS] [CrossRef] [EDP Sciences] (In the text)
- Caswell, J. L., Vaile, R. A., Ellingsen, S. P., Whiteoak, J. B., & Norris, R. P. 1995, MNRAS, 272, 96 [NASA ADS] (In the text)
- Cragg, D. M., Sobolev, A. M., & Godfrey, P. D. 2002, MNRAS, 331, 521 [NASA ADS] [CrossRef] (In the text)
- Cyganowski, C. J., Whitney, B. A., Holden, E., et al. 2008, AJ, 136, 2391 [NASA ADS] [CrossRef] (In the text)
- Dartois, E., Schutte, W., Geballe, T. R., et al. 1999, A&A, 342, L32 [NASA ADS] (In the text)
- De Buizer, J. M., & Minier, V. 2005, ApJ, 628, L151 [NASA ADS] [CrossRef] (In the text)
- De Buizer, J. M., Redman, R. O., Longmore, S. N., Caswell, J., & Feldman, P. A. 2009, A&A, 493, 127 [NASA ADS] [CrossRef] [EDP Sciences] (In the text)
- Davis, C. J., Kumar, M. S. N., Sandell, G., et al. 2007, MNRAS, 374, 29 [NASA ADS] [CrossRef] (In the text)
- Diamond, P. J., Garrington, S. T., Gunn, A. G., et al. 2003, MERLIN USer Guide, Ver. 3 (In the text)
- Dodson, R., Ojha, R., & Ellingsen, S. P. 2004, MNRAS, 351, 779 [NASA ADS] [CrossRef] (In the text)
- Ellingsen, S. P. 2006, ApJ, 638, 241 [NASA ADS] [CrossRef]
- Fazio, G. G., Hora, J. L., Allen, L. E., et al. 2004, ApJS, 154, 10 [NASA ADS] [CrossRef] (In the text)
- Fitzgibbon, A., Pilu, M., & Fisher, R. B. 1999, IEEE Transactions on Pattern Analysis and Machine Intelligence, 21, 476 [CrossRef] (In the text)
- Kumar, M. S. N., & Grave, J. M. C. 2007, A&A, 472, 155 [NASA ADS] [CrossRef] [EDP Sciences]
- Longmore, S. N., Burton, M. G., Barnes, P. J., et al. 2007, MNRAS, 379, 535 [NASA ADS] [CrossRef] (In the text)
- Menten, K. M. 1991, ApJ, 380, L75 [NASA ADS] [CrossRef] (In the text)
- Menten, K. M., Reid, M. J., Pratap, P., Moran, J. M., & Wilson, T. L. 1992, ApJ, 401, L39 [NASA ADS] [CrossRef] (In the text)
- Minier, V., Booth, R. S., & Conway, J. E. 2000, A&A, 362, 1093 [NASA ADS] (In the text)
- Moscadelli, L., Cesaroni, R., & Rioja, M. J. 2000, A&A, 360, 663 [NASA ADS] (In the text)
- Moscadelli, L., Menten, K. M., Walmsley, C. M., & Reid, M. J. 2002, ApJ, 564, 813 [NASA ADS] [CrossRef] (In the text)
- Moscadelli, L., Cesaroni, R., & Rioja, M. J. 2005, A&A, 438, 889 [NASA ADS] [CrossRef] [EDP Sciences] (In the text)
- Norris, R. P., Whiteoak, J. B., Caswell, J. L., Wieringa, M. H., & Goigh, R. G. 1993, ApJ, 412, 222 [NASA ADS] [CrossRef] (In the text)
- Norris, R. P., Byleveld, S. E., Diamond, P. J., et al. 1998, ApJ, 508, 275 [NASA ADS] [CrossRef] (In the text)
- Pandian, J. D., & Goldsmith, P. F. 2007, ApJ, 669, 435 [NASA ADS] [CrossRef] (In the text)
- Pestalozzi, M. R., Elitzur, M., Conway, J. E., & Booth, R. S. 2004, ApJ, 603, L113 [NASA ADS] [CrossRef] (In the text)
- Philips, C. J., Norris, R. P., Ellingsen, S. P., & McCulloch, P. M. 1998, MNRAS, 300, 1131 [NASA ADS] [CrossRef] (In the text)
- Sewilo, M., Watson, C., Araya, E., et al. 2004, ApJS, 154, 553 [NASA ADS] [CrossRef] (In the text)
- Smith, M. D., & Rosen, A. 2005, MNRAS, 357, 1370 [NASA ADS] [CrossRef] (In the text)
- Sridharan, T. K., Beuther, H., Schilke, P., Menten, K. M., & Wyrowski, F. 2002, ApJ, 566, 931 [NASA ADS] [CrossRef] (In the text)
- Szymczak, M., Hrynek, G., & Kus, A. J. 2000, A&ASS, 143, 269 [NASA ADS] [CrossRef] (In the text)
- Szymczak, M., Kus, A. J., Hrynek, G., Kepa, A., & Pazderski, E. 2002, A&A, 392, 277 [NASA ADS] [CrossRef] [EDP Sciences] (In the text)
- Szymczak, M., Pillai, T., & Menten, K. M. 2005, A&A, 434, 613 [NASA ADS] [CrossRef] [EDP Sciences] (In the text)
- Szymczak, M., Bartkiewicz, A., & Richards, A. M. S. 2007, A&A, 468, 617 [NASA ADS] [CrossRef] [EDP Sciences] (In the text)
- Uscanga, L., Gomez, Y., Raga, A. C., et al. 2008, MNRAS, 390, 1127 [NASA ADS] [CrossRef] (In the text)
- Torstensson, K., van Langevelde, H. J., Vlemmings, W., & van der Tak, F. 2009, PoS, Proceedings of the 9th European VLBI Network Symposium, ed. F. Montovani, 39 (In the text)
- Walsh, A. J., Burton, M. G., Hyland, A. R., & Robinson, G. 1998, MNRAS, 301, 640 [NASA ADS] [CrossRef] (In the text)
- van der Walt, D. J., Sobolev, A. M., & Butner, H. 2007, A&A, 464, 1015 [NASA ADS] [CrossRef] [EDP Sciences] (In the text)
- Zhang, Q., Hunter, T. R., Brand, J., et al. 2005, ApJ, 625, 864 [NASA ADS] [CrossRef] (In the text)
Online Material
Table 1: Summary of previous high angular resolution studies of 6.7 GHz methanol masers.
Table 2: Sample of methanol masers observed with the EVN. The names are the Galactic coordinates of the brightest spot of each target obtained in post-processing EVN data. The dates of each observing run are listed in Table 4. The phase-calibrator names and angular separations from the targets are given.
Table 3: Targets not detected with the MERLIN single baseline. The source names, coordinates, and peak flux velocities are taken from Szymczak et al. (2002).
Table 6:
Maser clusters towards 31 sources. If a spectrum of a maser
cluster does not show a Gaussian profile we enter the sign - in the
Cols. of FWHM and
![]() .
.
![\begin{figure}\par\includegraphics[scale=0.9]{12250f10.eps}
\end{figure}](/articles/aa/full_html/2009/28/aa12250-09/img68.png) |
Figure 3:
The 8.4 GHz continuum emission detected using VLA on 2007 August 18.
The names of radio continuum sources (RC) are the Galactic coordinates of
peak fluxes. The peak and integrated fluxes as well as the levels of rms
(1
|
| Open with DEXTER | |
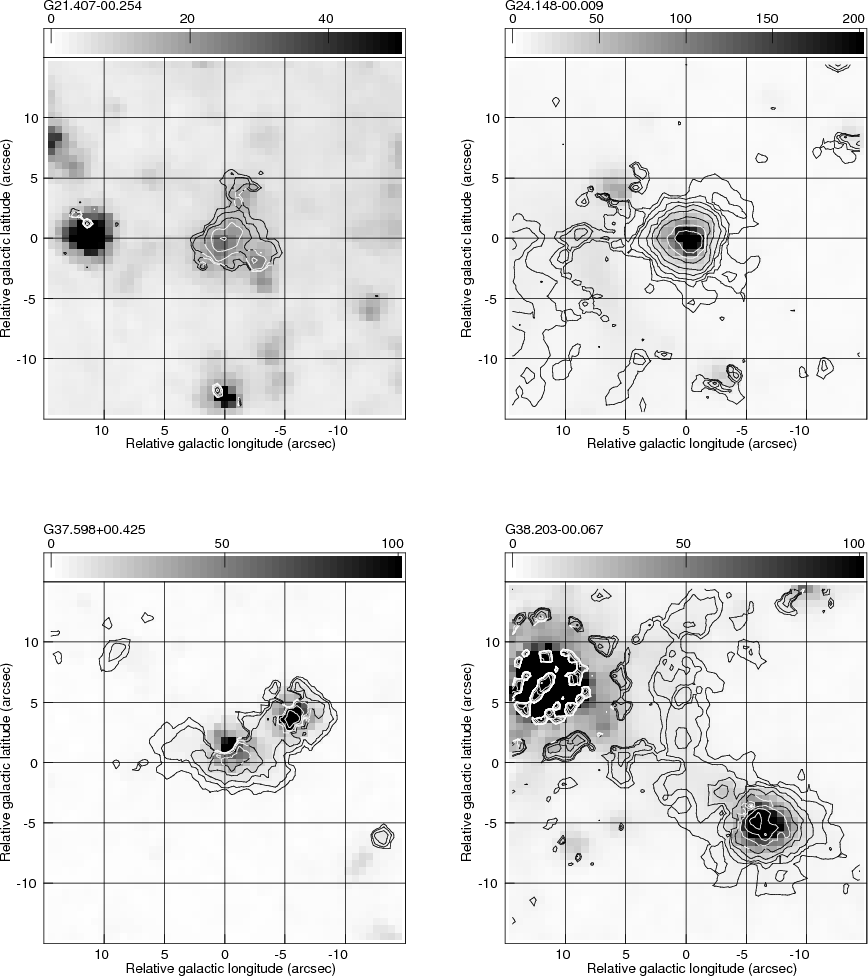 |
Figure 6:
Spitzer IRAC 4.5 |
| Open with DEXTER | |
Footnotes
- ... observations
- Tables 1-3, 6 and Figs. 3, 6 are only available in electronic form at http://www.aanda.org
- ... EVN
- The European VLBI Network.
- ... MERLIN
- The Multi-Element Radio Linked Interferometer Network.
- ...
archive
- http://irsa.ipac.caltech.edu/applications/Cutouts/
All Tables
Table 4: Details of EVN observations.
Table 5: Results of EVN observations.
Table 7: Results of VLA observations at 8.4 GHz.
Table 8: Parameters of ellipses fitted to the maser spot distributions.
Table 9: Parameters derived by fitting kinematics of the rotating and expanding disc model.
Table 10: Parameters derived from fitting the biconical outflow model of Moscadelli et al. (2000).
Table 1: Summary of previous high angular resolution studies of 6.7 GHz methanol masers.
Table 2: Sample of methanol masers observed with the EVN. The names are the Galactic coordinates of the brightest spot of each target obtained in post-processing EVN data. The dates of each observing run are listed in Table 4. The phase-calibrator names and angular separations from the targets are given.
Table 3: Targets not detected with the MERLIN single baseline. The source names, coordinates, and peak flux velocities are taken from Szymczak et al. (2002).
Table 6:
Maser clusters towards 31 sources. If a spectrum of a maser
cluster does not show a Gaussian profile we enter the sign - in the
Cols. of FWHM and
![]() .
.
All Figures
| |
Figure 1: Spectra and maps of 6.7 GHz methanol maser emission of sources detected with the EVN. The names are the Galactic coordinates of the brightest spot as listed in Table 5. The thin bars under the spectra show the velocity ranges of spots displayed. The coordinates are relative to the brightest spots (Table 5). The sizes of circles are proportional to the logarithm of the intensities of maser spots. The colors of circles relate to the LSR velocities as indicated in the spectra, respectively. For the sources with ring-like morphologies, the best-fit ellipse and its center are marked by a dotted curve and a cross, respectively. The crosses coincide (within the uncertainties) with Spitzer IRAC MIR emission (Sect. 4.2). |
| Open with DEXTER | |
| In the text | |
| |
Figure 1: continued. |
| Open with DEXTER | |
| In the text | |
| |
Figure 1: continued. |
| Open with DEXTER | |
| In the text | |
| |
Figure 1: continued. |
| Open with DEXTER | |
| In the text | |
| |
Figure 1: continued. |
| Open with DEXTER | |
| In the text | |
| |
Figure 1: continued. |
| Open with DEXTER | |
| In the text | |
| |
Figure 1: continued. |
| Open with DEXTER | |
| In the text | |
| |
Figure 1: continued. |
| Open with DEXTER | |
| In the text | |
| |
Figure 2:
The 8.4 GHz continuum emission towards four methanol maser sites taken
using VLA on 2007 August 18. The names of radio continuum sources (RC)
relate to the
Galactic coordinates of their peak fluxes. The peak and integrated fluxes
as well as the levels of rms
(1
|
| Open with DEXTER | |
| In the text | |
| |
Figure 4: Velocity of the maser spots in G33.980-00.019 versus azimuth angle measured from the major axis (north to east). The open circles represent the data and are proportional to the logarithm of the flux densities. The sinusoidal line represents the best-fit kinematical model of a rotating and expanding disc (with infintesimal thickness) using the parameters listed in Table 9. |
| Open with DEXTER | |
| In the text | |
| |
Figure 5:
Histogram of number of the methanol masers as a function
of angular separation from associated MIR sources at
4.5 |
| Open with DEXTER | |
| In the text | |
| |
Figure 3:
The 8.4 GHz continuum emission detected using VLA on 2007 August 18.
The names of radio continuum sources (RC) are the Galactic coordinates of
peak fluxes. The peak and integrated fluxes as well as the levels of rms
(1
|
| Open with DEXTER | |
| In the text | |
| |
Figure 6:
Spitzer IRAC 4.5 |
| Open with DEXTER | |
| In the text | |
Copyright ESO 2009
Current usage metrics show cumulative count of Article Views (full-text article views including HTML views, PDF and ePub downloads, according to the available data) and Abstracts Views on Vision4Press platform.
Data correspond to usage on the plateform after 2015. The current usage metrics is available 48-96 hours after online publication and is updated daily on week days.
Initial download of the metrics may take a while.