| Issue |
A&A
Volume 502, Number 1, July IV 2009
|
|
|---|---|---|
| Page(s) | 355 - 365 | |
| Section | Planets and planetary systems | |
| DOI | https://doi.org/10.1051/0004-6361/200811527 | |
| Published online | 27 May 2009 | |
The distant activity of the Long Period Comets C/2003 O1 (LINEAR) and C/2004 K1
(Catalina)![[*]](/icons/foot_motif.png)
E. Mazzotta Epifani1 - P. Palumbo2 - M. T. Capria3 - G. Cremonese4 - M. Fulle5 - L. Colangeli1
1 - INAF-Osservatorio Astronomico di Capodimonte, via Moiariello 16, 80131 Napoli, Italy
2 - Universitá Parthenope, Dip. Scienze Applicate, Centro Direzionale Isola C4, 80143 Napoli, Italy
3 - INAF-Istituto di Astrofisica Spaziale, via del Fosso del Cavaliere 100, 00133 Roma, Italy
4 - INAF-Osservatorio Astronomico di Padova, vicolo dell'Osservatorio 5, 35122 Padova, Italy
5 - INAF-Osservatorio Astronomico di Trieste, via Tiepolo 11, 34131 Trieste, Italy
Received 16 December 2008 / Accepted 7 April 2009
Abstract
Aims. We study the distant dust environment of two Long Period Comets: C/2003 O1 (LINEAR) (observed at
![]() AU) and C/2004 K1 (Catalina) (observed at
AU) and C/2004 K1 (Catalina) (observed at
![]() AU). The case of C/2003 O1 is particularly interesting since the comet has a quite large perihelion heliocentric distance (
AU). The case of C/2003 O1 is particularly interesting since the comet has a quite large perihelion heliocentric distance (
![]() AU).
AU).
Methods. We analysed R-band images taken at the CAHA 2.2 m telescope to characterise the properties of the cometary dust coma. The images of both comets were also used as input into an inverse numerical model, to derive information about the dynamical parameters of coma dust grains until a time ![]() 500 days before the observation.
500 days before the observation.
Results. Both the comets appeared to be active, and of similar shape and size despite the great difference in their heliocentric distance of observation. C/2003 O1 exhibited a tail extending to at least 3.7 ![]() 105 km. It is a very active object, since its Af
105 km. It is a very active object, since its Af![]() is 552
is 552 ![]() 36 cm within the inner 5
36 cm within the inner 5
![]() .
C/2004 K1 showed a similar long tail, extending to 2.6
.
C/2004 K1 showed a similar long tail, extending to 2.6 ![]() 105 km. Its Af
105 km. Its Af![]() is 539
is 539 ![]() 35 cm within the inner 5
35 cm within the inner 5
![]() .
An almost constant dust grain ejection velocity between 0.5 and 0.9 m/s at 1 cm dust size has been derived for C/2003 O1 and an increase from 0.5 to 2 m/s at 1 cm dust size for C/2004 K1, reflecting the different volatile dragging the dust environment (probably CO for C/2003 O1 and water for C/2004 K1). Model results allow some speculations about the comet nucleus size of C/2003 O1 (LINEAR) and its CO content: for a
.
An almost constant dust grain ejection velocity between 0.5 and 0.9 m/s at 1 cm dust size has been derived for C/2003 O1 and an increase from 0.5 to 2 m/s at 1 cm dust size for C/2004 K1, reflecting the different volatile dragging the dust environment (probably CO for C/2003 O1 and water for C/2004 K1). Model results allow some speculations about the comet nucleus size of C/2003 O1 (LINEAR) and its CO content: for a
![]() similar in value to those observed for other distant cometary objects, a comet radius
similar in value to those observed for other distant cometary objects, a comet radius ![]() from 13 to 17 km can be inferred.
from 13 to 17 km can be inferred.
Key words: comets: individual: C/2003 O1 (LINEAR) and C/2004 K1 (Catalina) - comets: general
1 Introduction
The observation of comets at large distances from the Sun can provide important information about the dynamics, collisions, and physical and chemical conditions in the early solar nebula. Meech & Hainout (2001) discussed extensively the importance of observing distant comets and how the information gathered could help in investigating the processes of formation and evolution of planetesimals (collisional accretions, size distribution, chemical conditions) at different heliocentric distances in the primordial solar nebula.
It is now widely accepted that cometary nuclei originate in at least two different regions of the solar
system, implying that physical properties should be diverse because of differences in e.g. collisional
environment, chemical composition of the primordial nebula, and radiation processing, etc. Based on
the present Tisserand parameter (with respect to Jupiter), the classification scheme proposed by
Levison (1996) distinguishes between Ecliptic Comets (EC) (
![]() )
and Nearly Isotropic Comets (NIC)
(
)
and Nearly Isotropic Comets (NIC)
(
![]() ). The first family has a quasi-correspondance with the group of Short Period Comets (SPC). The
second family includes both the Halley-type comets and the Long Period Comets.
Following the definition of Lamy et al. (2005), the population of the NICs is further
divided into two subgroups: the Dynamically New Comets (DNC), with original semi-major axis
). The first family has a quasi-correspondance with the group of Short Period Comets (SPC). The
second family includes both the Halley-type comets and the Long Period Comets.
Following the definition of Lamy et al. (2005), the population of the NICs is further
divided into two subgroups: the Dynamically New Comets (DNC), with original semi-major axis
![]() AU, which are on their first passage in the solar system, and
the returning NICs, that have already passed in the solar system, which typically have a
AU, which are on their first passage in the solar system, and
the returning NICs, that have already passed in the solar system, which typically have a ![]() 104 AU.
Originating in-situ in the Uranus-Neptune zone, ECs are thought to be collisional fragments of Kuiper Belt
Objects, while the NICs probably formed in the region of giant planets (the Jupiter-Neptune zone) and then
scattered towards the Oort cloud region.
104 AU.
Originating in-situ in the Uranus-Neptune zone, ECs are thought to be collisional fragments of Kuiper Belt
Objects, while the NICs probably formed in the region of giant planets (the Jupiter-Neptune zone) and then
scattered towards the Oort cloud region.
There is much reference in the literature to ``new'' comets (i.e., comets that rarely pass
through the Solar System) being intrinsically more active at
large distances from the Sun than the periodic (``old'') comets (i.e., comets for which many passages
inside the Solar System have been recorded). The first extensive analysis in this field
was summarised by Meech (1991), but at that time too few observations of cometary nuclei at
large heliocentric distances (R > 3-4 AU, e.g., beyond the region where H2O ice activity is expected
to dominate) were available to make a conclusive claim. Meech (1988) presented an
observational program for 28 comets belonging to different dynamical families and discussed the greater
activity of dynamically new comets (e.g., an extensive coma for comet C/1984 W2 (Hartley) at
![]() AU and for comet C/1980 E1 (Bowell) at
AU and for comet C/1980 E1 (Bowell) at
![]() AU) with respect to periodic targets (e.g., comet
9P/Tempel 1 presenting an asteroidal light curve from recovery until about
AU) with respect to periodic targets (e.g., comet
9P/Tempel 1 presenting an asteroidal light curve from recovery until about
![]() AU). The
chemical and physical aging effects on cometary nuclei have also been studied (Meech 1999) in terms
of their different role and consequence for different dynamical cometary families, resulting in
significant differences in the amount of outgassing between DNCs and SPCs, and a more uniform activity
along the orbit in new comets, a larger surface area being available for gas sublimation due to lack
of mantling.
AU). The
chemical and physical aging effects on cometary nuclei have also been studied (Meech 1999) in terms
of their different role and consequence for different dynamical cometary families, resulting in
significant differences in the amount of outgassing between DNCs and SPCs, and a more uniform activity
along the orbit in new comets, a larger surface area being available for gas sublimation due to lack
of mantling.
Several long-term programs have been developed to observe from the ground (mostly visible imaging) a huge number of SPCs at large heliocentric distances, to perform an extensive analysis of the nuclear properties of this family, such as magnitude, shape, rotational status, albedo, and size (Meech et al. 2004; Licandro et al. 2000; Lowry et al. 1999; Lowry & Fitzsimmons 2001, 2005; Lowry et al. 2003; Lowry & Weissman 2003; Mazzotta Epifani et al. 2007, 2008). Two extensive works (Lamy et al. 2005; Tancredi et al. 2006) collected all the data available on SPCs from these systematic surveys, to investigate the nucleus size distribution and the cumulative luminosity function within the family. In contrast, a relative small number of studies have been devoted until now to analyse the distant properties of Long Period Comets. A summary of the analysis of the distant environment of comets pertaining to this family is presented in Table 1.
Table 1: Summary of analysis of the distant environment of Long Period Comets.
The distant activity of 20 LPCs, where ![]() at the observation ranges from 3.35 to 19.4 AU (with the
exceptional case of comet C/1995 O1 observed at
at the observation ranges from 3.35 to 19.4 AU (with the
exceptional case of comet C/1995 O1 observed at ![]()
![]() 26 AU), has been
studied in more or less detail by several methods. The majority of information comes from visible
photometry, by
which the morphology of the coma, general dust characteristics such as the Af
26 AU), has been
studied in more or less detail by several methods. The majority of information comes from visible
photometry, by
which the morphology of the coma, general dust characteristics such as the Af![]() parameter
and V - R colour, and estimates of the nuclear diameter can be derived. For some of the
brightest comets, a visible spectrum has been derived for the coma, obtaining interesting information
about unusual richness in CO+ (Korsun et al. 2006), even if the low spectral resolution
leaves some doubts about the line identification, or distant detection of C3
(Rauer et al. 2003), both depicting a scenario of CO-rich comets. The advent of the IR space
telescope SPITZER allowed us to investigate the IR environment of a distant LPC (C/2001
HT50 (LINEAR-NEAT), Kelley et al. 2006), and analyse its relative mineralogy. In one
only case, for comet C/1995 O1 (Hale-Bopp), the distant dust environment of a LPC has been analysed by means
of a numerical dust model, to derive detailed information about the dust grain ejection velocity,
dust-loss rate and size distribution of particles (Fulle et al. 1998). The main results in
terms of image analysis (integrated magnitude, Af
parameter
and V - R colour, and estimates of the nuclear diameter can be derived. For some of the
brightest comets, a visible spectrum has been derived for the coma, obtaining interesting information
about unusual richness in CO+ (Korsun et al. 2006), even if the low spectral resolution
leaves some doubts about the line identification, or distant detection of C3
(Rauer et al. 2003), both depicting a scenario of CO-rich comets. The advent of the IR space
telescope SPITZER allowed us to investigate the IR environment of a distant LPC (C/2001
HT50 (LINEAR-NEAT), Kelley et al. 2006), and analyse its relative mineralogy. In one
only case, for comet C/1995 O1 (Hale-Bopp), the distant dust environment of a LPC has been analysed by means
of a numerical dust model, to derive detailed information about the dust grain ejection velocity,
dust-loss rate and size distribution of particles (Fulle et al. 1998). The main results in
terms of image analysis (integrated magnitude, Af![]() parameter) obtained for the distant
comets listed in Table 1 are summarised in Table 2.
parameter) obtained for the distant
comets listed in Table 1 are summarised in Table 2.
The main aim of our work is to contribute to the field of ground-based investigation of the dust environment of distant LPCs, by means of the detailed analysis of two LPCs: C/2003 O1 (LINEAR) and C/2004 K1 (Catalina). The orbital parameters of the two objects are summarised in Table 3.
C/2003 O1 (LINEAR) was discovered in July 2003 in the course of the LINEAR (Lincoln Near-Earth
Asteroid Research) project (Kusnirak & Birtwhistle 2003). It is a hyperbolic comet of
perihelion distance quite distant from the Sun (
![]() AU). The integration of its orbit to compute its original orbital parameters (in particular, 1/a) shows that the target is not
a strictly ``new'' comet (e.g., this has not been its first passage close to the Sun). The observations
presented in this paper were performed after its last passage at perihelion.
AU). The integration of its orbit to compute its original orbital parameters (in particular, 1/a) shows that the target is not
a strictly ``new'' comet (e.g., this has not been its first passage close to the Sun). The observations
presented in this paper were performed after its last passage at perihelion.
C/2004 K1 (Catalina) was discovered by the Catalina Sky Survey in May 2004, initially classified as an
asteroid and shortly after identified as exhibiting a weak coma (Spahr et al. 2004). It is
classified as a returning Nearly Isotropic Comet, with a quite large semi-major axis (a = 1816 AU) and
a close perihelion distance (
![]() AU). The observations presented in this paper were
performed shortly before its perihelion passage.
AU). The observations presented in this paper were
performed shortly before its perihelion passage.
Table 2: Summary of available results from image analysis of Long Period Comets.
Section 2 describes the observations performed in May 2005. The analysis of the obtained R-band images is presented in Sect. 3. In Sect. 4 the possible sources of cometary distant activity are discussed, while in Sect. 5 the theoretical model applied to the images is described. The results of the model application to the comet images are described in Sect. 6. In Sect. 7, we discuss the implications of the obtained results for comet C/2003 O1 (LINEAR) for the determination of its nucleus size and the analysis of its volatile content. Summary and conclusions are given in Sect. 8.
Table 3: Orbital parameters of the target comets.
2 Observations and reduction
Table 4: Observing conditions.
The two comets C/2003 O1 (LINEAR) and C/2004 K1 (Catalina) were observed on May 15, 2005 with
the 2.2 m telescope at the Centro Astronómico Hispano Alemán
(CAHA) at Calar Alto (Spain). The images were obtained with the CAFOS (Calar Alto Faint Object
Spectrograph) instrument, equipped with the 2k ![]() 2k SITE
2k SITE![]() 1d CCD with 24
1d CCD with 24 ![]() m
pixels (pixel scale of 0.53 arcsec/px) and the Cousin broadband filter R.
m
pixels (pixel scale of 0.53 arcsec/px) and the Cousin broadband filter R.
In both cases, several long (>300 s) exposures were obtained for the object, during which the telescope tracking at the non-sidereal rate corresponded to the predicted motion of the comets. All the images were bias-subtracted and flat-fielded in the standard manner using the ESO Munich Image Data Analysis System, MIDAS (1998). The bias value was obtained using zero-second exposure bias frames. A flat field was created averaging several twilight sky exposures.
For comet C/2003 O1 (LINEAR), we obtained 3 long-exposure consecutive images of
![]() s and
s and
![]() s. For comet C/2004 K1 (Catalina), we obtained 3 long-exposure consecutive images of
s. For comet C/2004 K1 (Catalina), we obtained 3 long-exposure consecutive images of
![]() s and
s and
![]() s. The two comets
were easily identificable and appeared active in all the single exposures.
s. The two comets
were easily identificable and appeared active in all the single exposures.
To improve the SNR for the image analysis, we decided to coadd the single images for each comet. The position of the comet optocentre in each single image selected for coadding was determined by fitting a two-dimensional Gaussian to the innermost 80 and 36 pixels of the coma images of comet C/2003 O1 (LINEAR) and C/2004 K1 (Catalina), respectively. The images were then recentred using this optocentre and summed. Sky correction was performed by subtracting a first-order polynomial sky approximation computed from the pixel areas containing no stars. The observing conditions are summarised in Table 4. The final images are reported in Figs. 1 and 2.
To perform an absolute flux calibration of the comet images, appropriate fields from the
list of Landolt (1992) (SA104 350, PG1530, and PG1633) were observed at different
airmasses during the observation night. The night was photometric, the
seeing value, which was measured as the average FWHM of several sample stars from
individual short-exposure frames, being stable around 1.9
![]() .
.
3 Image analysis
3.1 Comet C/2003 O1 (LINEAR)
Despite the large heliocentric distance at the time of observation, the comet C/2003 O1 (LINEAR)
(Fig. 1) reveals a very active object with a well-developed coma and a
long tail extending in the E direction. The coma is slightly asymmetric: it extends
(counts above 1![]() of the background) to
of the background) to
![]() km in the S and in the W
directions and to 2.6
km in the S and in the W
directions and to 2.6 ![]() 104 km in the N direction. The projected length of the tail
(measured along the E direction) is at least 3.7
104 km in the N direction. The projected length of the tail
(measured along the E direction) is at least 3.7 ![]() 105 km (counts above 1
105 km (counts above 1![]() of the background).
of the background).
The R magnitudes of the comet, derived in different optical apertures
centred on the optocentre, are summarised in Table 5. In the inner 5
![]() ,
the
integrated R magnitude is
,
the
integrated R magnitude is
![]() .
The final uncertainity in
the comet magnitude was derived from the photometric error
.
The final uncertainity in
the comet magnitude was derived from the photometric error
![]() in the calibration
curve, taken as the rms of the weighted standard stars fit.
in the calibration
curve, taken as the rms of the weighted standard stars fit.
Table 2 summarises the information about the integrated R magnitudes of Long Period Comets available until now. Little data are available, and direct comparison does not seem easy. For example, compared to C/1999 J2 (Skiff), observed at a rather similar heliocentric distance, comet C/2003 O1 (LINEAR) may be interpreted to be darker in the R band, but unfortunately we have no indication of the aperture value used by those authors to derive the magnitude, so a precise and direct comparison is impossible.
The reduced R magnitude of the comet can be computed as
| (1) |
where
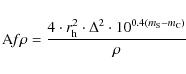
A proxy for the dust production is the Af![]() value (cm) (A'Hearn et al. 1984),
where A is the average grain albedo, f the filling factor in the aperture
field of view, and
value (cm) (A'Hearn et al. 1984),
where A is the average grain albedo, f the filling factor in the aperture
field of view, and ![]() the linear radius of the aperture at the comet, i.e.
the sky-plane radius. Interpreted to be the percentage of solar radiation
scattered by the cometary dust towards the observer, Af
the linear radius of the aperture at the comet, i.e.
the sky-plane radius. Interpreted to be the percentage of solar radiation
scattered by the cometary dust towards the observer, Af![]() can be derived from
the calculated photometric magnitude
can be derived from
the calculated photometric magnitude
 |
(2) |
where
Values of Af![]() for C/2003 O1 (LINEAR), in different aperture radii, are given
in Table 5. In the inner 5
for C/2003 O1 (LINEAR), in different aperture radii, are given
in Table 5. In the inner 5
![]() ,
the computed Af
,
the computed Af![]() is
is
![]() .
A monotonic decrease in Af
.
A monotonic decrease in Af![]() values with the nucleocentric distance
values with the nucleocentric distance ![]() may
be indicative of non-steady-state dust emission and possibly dust grain fading or destruction, as
reported for several comets such as C/2000 WM1 (LINEAR) (Lara et al. 2004) and
C/2001 Q4 (NEAT) (Tozzi et al. 2003). In contrast, for an ideal steady-state coma,
Af
may
be indicative of non-steady-state dust emission and possibly dust grain fading or destruction, as
reported for several comets such as C/2000 WM1 (LINEAR) (Lara et al. 2004) and
C/2001 Q4 (NEAT) (Tozzi et al. 2003). In contrast, for an ideal steady-state coma,
Af![]() should be constant at all apertures.
Values of C/2003 O1 (LINEAR), reported in Table 5, differ slightly for
different cometocentric distances, but the values are compatible within the measurements errors.
Therefore, we can conclude that the dust environment of C/2003 O1 (LINEAR), derived from
analysis of coma photometry, is consistent with a scenario of steady-state emission.
should be constant at all apertures.
Values of C/2003 O1 (LINEAR), reported in Table 5, differ slightly for
different cometocentric distances, but the values are compatible within the measurements errors.
Therefore, we can conclude that the dust environment of C/2003 O1 (LINEAR), derived from
analysis of coma photometry, is consistent with a scenario of steady-state emission.
Little data are available for Af![]() for distant LPCs, as summarised in Table 2. The Af
for distant LPCs, as summarised in Table 2. The Af![]() for our target (observed at
for our target (observed at
![]() AU) is of the
same order of magnitude as that obtained for the second target presented in this paper (see
sect. below), observed at a much lower heliocentric distance. Meech et al. (2009) measured
the Af
AU) is of the
same order of magnitude as that obtained for the second target presented in this paper (see
sect. below), observed at a much lower heliocentric distance. Meech et al. (2009) measured
the Af![]() for C/2003 O1 (LINEAR) at two values of heliocentric distances (
for C/2003 O1 (LINEAR) at two values of heliocentric distances (![]() = 6.92
and 8.18 AU postperihelion) bracketing our value at
= 6.92
and 8.18 AU postperihelion) bracketing our value at
![]() AU. The overall behaviour of
Af
AU. The overall behaviour of
Af![]() is that (expected) of a decrease with increasing heliocentric distance, reflecting
a general decrease in the dust activity.
is that (expected) of a decrease with increasing heliocentric distance, reflecting
a general decrease in the dust activity.
Our results for comet C/2003 O1 (LINEAR) indicate a significant dust production rate,
and support the idea that LPCs are far more active than SPCs along the entire orbit and especially
at large heliocentric distance (Meech 1988). For example, Af![]() =
195 cm for P/2002 T5 (LINEAR) observed at 5.24 AU (Mazzotta Epifani et al. 2008), and
Af
=
195 cm for P/2002 T5 (LINEAR) observed at 5.24 AU (Mazzotta Epifani et al. 2008), and
Af![]() cm for P/1998 U4 (Spahr) observed at 6.14 AU (Lowry & Fitzsimmons
2005).
cm for P/1998 U4 (Spahr) observed at 6.14 AU (Lowry & Fitzsimmons
2005).
![\begin{figure}
\par\includegraphics[width=7cm]{11527f1.ps} \end{figure}](/articles/aa/full_html/2009/28/aa11527-08/img52.png) |
Figure 1:
Composite image of comet C/2003 O1 (LINEAR). The image width
is 82 |
| Open with DEXTER | |
![\begin{figure}
\par\includegraphics[width=7cm]{11527f2.ps} \end{figure}](/articles/aa/full_html/2009/28/aa11527-08/img53.png) |
Figure 2:
Composite image of comet C/2004 K1 (Catalina). The image width
is 110 |
| Open with DEXTER | |
3.2 Comet C/2004 K1 (Catalina)
Observed at
![]() AU, comet C/2004 K1 (Catalina) is not really a ``distant'' object, but
results for this comet are interesting because few data are available for LPCs.
Figure 2 shows a very active object with a well-developed coma and a
long tail extending in the S-E quadrant. The coma is only slightly asymmetric: it extends
(counts above 1
AU, comet C/2004 K1 (Catalina) is not really a ``distant'' object, but
results for this comet are interesting because few data are available for LPCs.
Figure 2 shows a very active object with a well-developed coma and a
long tail extending in the S-E quadrant. The coma is only slightly asymmetric: it extends
(counts above 1![]() of the background) to
of the background) to
![]() km in the N direction and
up to
km in the N direction and
up to
![]() km in the W direction. The projected length of the tail (measured
along a direction perpendicular to the PA of the comet, which is 204.3
km in the W direction. The projected length of the tail (measured
along a direction perpendicular to the PA of the comet, which is 204.3![]() )
is at least
)
is at least
![]() km (counts above 1
km (counts above 1![]() of the background) .
of the background) .
The R magnitudes of the comet, derived in different optical apertures centred on the optocentre,
are summarised in Table 5. In the inner 5
![]() ,
the integrated R magnitude is 15.80
,
the integrated R magnitude is 15.80
![]() 0.07. The final uncertainity in the comet magnitude was derived from the photometric
error
0.07. The final uncertainity in the comet magnitude was derived from the photometric
error
![]() in the calibration curve, taken to be the rms of the weighted fit to
standard stars. By comparison with data in Table 2, we can conclude that comet
C/2004 K1 (Catalina) is a rather ``standard'' comet in terms of brightness: at almost the same
heliocentric distance, C/1999 T2 (LINEAR) (Szabó et al. 2001) and C/2000 SV74
(LINEAR) (Szabó et al. 2002) exhibit similar integrated magnitudes.
in the calibration curve, taken to be the rms of the weighted fit to
standard stars. By comparison with data in Table 2, we can conclude that comet
C/2004 K1 (Catalina) is a rather ``standard'' comet in terms of brightness: at almost the same
heliocentric distance, C/1999 T2 (LINEAR) (Szabó et al. 2001) and C/2000 SV74
(LINEAR) (Szabó et al. 2002) exhibit similar integrated magnitudes.
For different aperture radii, values of Af![]() for C/2004 K1 (LINEAR) are shown
in Table 5. In the inner 5
for C/2004 K1 (LINEAR) are shown
in Table 5. In the inner 5
![]() ,
the computed Af
,
the computed Af![]() is 539
is 539 ![]() 35.
Figure 3 shows a clear monotonic decrease in Af
35.
Figure 3 shows a clear monotonic decrease in Af![]() values with
the nucleocentric distance
values with
the nucleocentric distance ![]() ,
possibly indicative of non-steady-state dust emission
and dust grain fading or destruction, as reported for several comets such as
C/2000 WM1 (LINEAR) (Lara et al. 2004) and C/2001 Q4 (NEAT) (Tozzi et al.
2003).
,
possibly indicative of non-steady-state dust emission
and dust grain fading or destruction, as reported for several comets such as
C/2000 WM1 (LINEAR) (Lara et al. 2004) and C/2001 Q4 (NEAT) (Tozzi et al.
2003).
Also Af![]() data for C/2004 K1 (LINEAR) support the idea that LPCs are far
more active than Short Period Comets along the whole orbit (Meech 1988):
SPCs observed at the same heliocentric distance exhibit Af
data for C/2004 K1 (LINEAR) support the idea that LPCs are far
more active than Short Period Comets along the whole orbit (Meech 1988):
SPCs observed at the same heliocentric distance exhibit Af![]() values an order of
magnitude lower than that measured for our target: for example, 48 cm for
139P/Väisälä-Oterma (Lowry & Fitzsimmons 2001), 75 cm for
119P/Parker-Hartley (Lowry et al. 1999), and 49 cm for 103P/Hartley 2
(Mazzotta Epifani et al. 2008).
values an order of
magnitude lower than that measured for our target: for example, 48 cm for
139P/Väisälä-Oterma (Lowry & Fitzsimmons 2001), 75 cm for
119P/Parker-Hartley (Lowry et al. 1999), and 49 cm for 103P/Hartley 2
(Mazzotta Epifani et al. 2008).
4 Source of cometary distant activity
Table 5:
Magnitude and A f![]() of the target comets.
of the target comets.
The primary driver of activity in comets close to the Sun is sublimation of H2O ice, but there
is debate about the cause of activity at heliocentric distances too far and too cold for significant
water sublimation. Calculations of gas production for sublimation from different volatiles indicate
that the sublimation rate for H2O ice decrease significantly beyond a heliocentric distance of
![]() AU. Sublimation of H2O ice could be sufficient to lift observable dust grains from the
cometary surface and account for the development of a dust coma out to 5-6 AU
(Meech & Svoren 2005). Activity beyond this distance could be caused by the perihelion heat wave
penetrating into the volatile-rich depths in the nucleus (Meech & Svoren 2005), but the
discovery of active comets that have likely not been close to the Sun enough (or ever) to experience
heating (as for example C/2003 O1 (LINEAR)) implies that a different mechanism exists. For these comets, the distant
activity could be explained more accurately by the sublimation or the release of very volatile gases, in
particular CO and/or CO2.
AU. Sublimation of H2O ice could be sufficient to lift observable dust grains from the
cometary surface and account for the development of a dust coma out to 5-6 AU
(Meech & Svoren 2005). Activity beyond this distance could be caused by the perihelion heat wave
penetrating into the volatile-rich depths in the nucleus (Meech & Svoren 2005), but the
discovery of active comets that have likely not been close to the Sun enough (or ever) to experience
heating (as for example C/2003 O1 (LINEAR)) implies that a different mechanism exists. For these comets, the distant
activity could be explained more accurately by the sublimation or the release of very volatile gases, in
particular CO and/or CO2.
It is widely believed that highly volatile material froze on the surface
of cometesimals in the outer regions of the presolar nebula in which comets formed
(Notesco et al. 2003). In cometary nuclei CO has been observed to be quite abundant
(as high as 24% relative to water in some comets) (Bockelée-Morvan et al. 2005), but it is
still unclear whether these highly volatile materials are present in so significant amounts as pure
ice in the cometary nucleus to sustain (by sublimation) various degrees of activity. In this case, the
activity could begin at significant distances from the Sun, since the CO ice sublimation begins at 25 K,
corresponding to
![]() AU. In contrast, models and simulations performed on
the SPCs and the few observed LPCs showed that CO and other volatiles can be present in the
cometary nuclei as gases trapped in the cells of amorphous water ice and that a significant
release of gas can occur when the irreversible transition from amorphous to crystalline state
takes place, at temperatures around 90 K (Prialnik et al. 2005), corresponding
to
AU. In contrast, models and simulations performed on
the SPCs and the few observed LPCs showed that CO and other volatiles can be present in the
cometary nuclei as gases trapped in the cells of amorphous water ice and that a significant
release of gas can occur when the irreversible transition from amorphous to crystalline state
takes place, at temperatures around 90 K (Prialnik et al. 2005), corresponding
to
![]() AU. In this case, the trapped gas could be of relatively high abundance:
water ice
has the ability to trap gases up to a gas-to-ice ratio of 3.3, as seen in laboratory experiments
(Laufer et al. 1987).
AU. In this case, the trapped gas could be of relatively high abundance:
water ice
has the ability to trap gases up to a gas-to-ice ratio of 3.3, as seen in laboratory experiments
(Laufer et al. 1987).
![\begin{figure}
\par\includegraphics[width=6cm]{11527f3.ps} \end{figure}](/articles/aa/full_html/2009/28/aa11527-08/img61.png) |
Figure 3:
A f |
| Open with DEXTER | |
Cometary activity along the comet's orbit, and in particular at large heliocentric distances (often characterised by outbursts, erratic activity in periodic comets, and unusually high coma brightness), has been studied by several groups from a theoretical point of view, compiling reliable mathematical models of both the thermal evolution and the differentiation inside the nucleus and simulating the structure and the evolution of the comet nucleus itself (Tancredi et al. 1994; Coradini et al. 1997; Julian et al. 2000; Gutiérrez et al. 2001; Capria 2002; Cohen et al. 2003; Prialnik et al. 2005). All the nucleus models attempt to solve the heat transport and the gas diffuse equations in the nucleus by assuming different levels of symmetry and sphericity, and depicting the nucleus as a porous object composed of a mixture of dust and different ices. For comet C/1995 O1 (Hale-Bopp), the observed activity and volatile production rate over a wide range of heliocentric distances was well reproduced by a numerical model (Capria et al 2000).
The results of the models in terms of CO outgassing and production rate show that for CO both in a pure ice and in a trapped gas form, the source of a CO-driven activity should be beneath the surface, where the internal temperatures could drop quickly to very low values. Another characteristic of CO-driven activity that can be derived from the theoretical models is that CO, when present, tends to flow from the body along most of its orbit and from everywhere on the surface, due to the low sublimation temperature and the depth of the sublimation and transition fronts. The sublimation front, in particular, should be at a quasi-constant temperature.
The dust release from the nucleus surface caused by CO drag is then expected to differ from that due to water, i.e., CO, and its associated dust flux, are expected to leave the comet nucleus uniformly from all the nucleus surface, on both the night and day sides. Since it originates from the nucleus interior, its loss rate is also expected to change very slowly with time after the onset of activity.
5 The numerical dust tail model
The theoretical fitting of the observed tail cannot be achieved with a direct dust-tail model,
i.e., changing all possible input parameters and determining which provides the closest fit, because
the high number of parameters in every realistic dust model implies that hundreds of
different parameter combinations, not necessarily similar, would provide fits
of similar quality. Therefore, to fit the observed cometary tails and reconstruct the dust
environment of the two comets and its time evolution starting from the observation and going
back in time, we adopted a regularized inverse approach
that ensures we reach the most probable fit (with a least squares criterium).
This approach characterises the inverse dust-tail model, extensively described in Fulle
(1989) and Epifani et al. (2001). Here we briefly recall only that the
approach consists of two main steps: (i) computing the model dust tail; and (ii)
fitting this to the observed tail to derive the dust parameters. The solution of the fit gives
sampled values of the dust loss rate,
![]() ,
the size distribution n(d,t),
and Af
,
the size distribution n(d,t),
and Af![]() .
Other non-linear parameters must be determined by a trial-and-error
procedure:
.
Other non-linear parameters must be determined by a trial-and-error
procedure:
- (i)
- the dust ejection velocity, v(t,d0), which describes the time evolution of
the dust ejection, where t is the time of dust ejection from the inner coma and
d0 a reference diameter;
- (ii)
- the power index, u =
 logv(t,d)/log d,
which characterises
the power-law dependence of the dust velocity on the grain diameter d:
v(t,d) = v(t,d0)
logv(t,d)/log d,
which characterises
the power-law dependence of the dust velocity on the grain diameter d:
v(t,d) = v(t,d0) (d/d0)u;
- (iii)
- the dust ejection anisotropy parameter, w, which is the half width of the
Sun-pointing dust ejection cone, where w = 180
 means isotropic emission, w =
90
stands for emispherical emission, and w = 45
means strongly anisotropic emission.
means isotropic emission, w =
90
stands for emispherical emission, and w = 45
means strongly anisotropic emission.
This approach allows us to reduce significantly the number of tests necessary to ensure the uniqueness of the output parameter combination, because all the linear parameter are automatic outputs of the code, and only combinations of non-linear parameters must be investigated. Since the time-dependent dust loss rate and the time and size-dependent dust distribution are linear parameters of the model, the uniqueness of the output is stabler than in every direct approach. In the inverse approach, only the time- and size-dependent dust ejection velocity vector must be found by means of a trial-and-error procedure. Therefore, this quantity must be constrained by physical considerations, independent of the dust tail model, which we can derive taking into account considerations discussed in Sect. 4.
6 Results for observed comets
6.1 Comet C/2003 O1 (LINEAR)
![\begin{figure}
\par\includegraphics[width=14cm,clip]{11527f4.eps} \end{figure}](/articles/aa/full_html/2009/28/aa11527-08/img66.png) |
Figure 4: Observed (continuous lines) and calculated (dashed lines) isophotes of comet C/2003 O1 (LINEAR). The innermost isophote corresponds to 23.8 R-mag arcsec-2. The isophote step is 0.75 R-mag arcsec-2. The Sun-pointing sky-projected vector is towards bottom. The different panels refer to different (u, w) combinations (see text for more details). |
| Open with DEXTER | |
![\begin{figure}
\par\includegraphics[width=10.5cm,clip]{11527f5.ps}
\end{figure}](/articles/aa/full_html/2009/28/aa11527-08/img67.png) |
Figure 5:
Dust environment of comet C/2003 O1 (LINEAR) derived from the modelling of the
CAHA image. Dust ejection velocity ( upper left), power index of the differential size
distribution ( upper right), size interval to which all the shown outputs are related
( lower left), mass-loss rate, and A f |
| Open with DEXTER | |
Figure 4 shows isophotes of the CAHA image of comet C/2003 O1 (LINEAR) (panels a
to f refer to different (u, w) combinations, see Sect. 5 for details).
Figure 5 shows the time evolution in the cometary dust environment,
as derived from the modelling of the CAHA image (Fig. 4,
dashed isophotes). The results cover a time span from a heliocentric distance
![]() AU
pre-perihelion to the date of observation (
AU
pre-perihelion to the date of observation (
![]() AU post-perihelion).
As discussed in Sect. 4, the rather large perihelion distance of the comet
C/2003 O1 (LINEAR) implies that water should provide a negligible contribution to dust drag in
the coma. Assuming that most of the gas released along the orbit (and responsible for the
cometary activity) is CO, with an approximately constant loss rate and speed, and isotropic
distribution, we should select in Fig. 5 the solutions that match this
hypothesis more closely.
AU post-perihelion).
As discussed in Sect. 4, the rather large perihelion distance of the comet
C/2003 O1 (LINEAR) implies that water should provide a negligible contribution to dust drag in
the coma. Assuming that most of the gas released along the orbit (and responsible for the
cometary activity) is CO, with an approximately constant loss rate and speed, and isotropic
distribution, we should select in Fig. 5 the solutions that match this
hypothesis more closely.
![\begin{figure}
\par\includegraphics[width=14cm,clip]{11527f6.eps} \end{figure}](/articles/aa/full_html/2009/28/aa11527-08/img69.png) |
Figure 6: Observed (continuous lines) and calculated (dashed lines) isophotes of comet C/2004 K1 (Catalina). The innermost isophote corresponds to 20.9 R-mag arcsec-2. The isophote step is 0.75 R-mag arcsec-2. The Sun-pointing sky-projected vector is towards bottom. The different panels refer to different (u, w) combinations (see text for more details). |
| Open with DEXTER | |
Panel a shows the time evolution in the dust ejection velocity. Its size-dependence is tested
by the u parameter: u = -1/2 is expected for perfectly spherical grains, u
> -1/2 is expected for more and more aspherical grains, and u = -1/6 is the upper
limit to all results obtained by means of photometric analysis of dust tails. Many inverse tail model
applications have shown that dust tail brightness data are unable to
constrain the u parameter uniquely. Changes in the outputs related to different u input
values allow us to estimate the uncertainty affecting the model solutions.
We indeed find that isotropic solutions (w = 180![]() ), with aspherical grains,
provide an almost constant ejection velocity, of between 0.5 and 0.9 m/s for 1 cm dust grain size.
), with aspherical grains,
provide an almost constant ejection velocity, of between 0.5 and 0.9 m/s for 1 cm dust grain size.
Panel c of Fig. 5 shows which time-dependent ![]() parameter
range allows us to fit the observed dust tail. We have already converted the
parameter
range allows us to fit the observed dust tail. We have already converted the ![]() parameter in sizes, by means of Eq. (3) (for more details, see for example Krishna Swamy 1986)
parameter in sizes, by means of Eq. (3) (for more details, see for example Krishna Swamy 1986)
 |
(3) |
where
Panel d shows the time evolution in the dust mass loss rate. This value comes out a factor of ten lower than that obtained by the same inverse dust tail model applied to the active Centaur P/2004 A1 (LONEOS) (Mazzotta Epifani et al. 2006), decreasing from 30 kg/s before perihelion to about 4 kg/s shortly before the observations. The most probable explanation of this decrease is a systematic change in the size distribution along the orbit, whose mean power-index time evolution is shown in panel b. The mean power-index decreases from about -3.5 (dust mass dominated by the largest ejected grains) to values lower than -4 (dust mass dominated by the smallest grains scattering light in the coma). Since dust ejection driven by CO is presumably isotropic, such long-term changes cannot be due to seasons of the nucleus, as is well known, for example, for the SPC 2P/Encke (Epifani et al 2001). A more consistent explanation is given by inhomogeneities in the dust population at different nucleus depths, i.e., before perihelion layers with a slightly larger population of large grains were ejected. After perihelion, CO started to drag dust from lower nucleus layers with a mean dust population slightly depleted of these large grains.
Panel d of Fig. 5 also provides the Af![]() values that are
consistent with the dust models that reproduce most closely the observed dust tail. Since the dust model
considers a limited dust size range (see panel c), the model can only predict lower
limits to the Af
values that are
consistent with the dust models that reproduce most closely the observed dust tail. Since the dust model
considers a limited dust size range (see panel c), the model can only predict lower
limits to the Af![]() observed values. Shortly before the observations, the model infers
Af
observed values. Shortly before the observations, the model infers
Af![]()
![]() 2 m, which is consistent with the observed value of 5.5 m.
2 m, which is consistent with the observed value of 5.5 m.
6.2 Comet C/2004 K1 (Catalina)
![\begin{figure}
\par\includegraphics[width=10.5cm,clip]{11527f7.ps} \end{figure}](/articles/aa/full_html/2009/28/aa11527-08/img78.png) |
Figure 7:
Dust environment of comet C/2004 K1 (Catalina) derived from the modelling of the
CAHA image. Dust ejection velocity ( upper left), power index of the differential size
distribution ( upper right), size interval to which all the shown outputs are related
( lower left), mass loss rate, and A f |
| Open with DEXTER | |
Figure 6 shows isophotes of the CAHA image of comet C/2004 K1 (Catalina) (panels a
to f refer to different (u, w) combinations, see Sect. 5 for details).
Figure 7 shows the time evolution in the cometary dust environment,
as derived from the modelling of the CAHA image (Fig. 6,
dashed isophotes). The results cover a time span between the time coresponding to a heliocentric
distance of
![]() AU
pre-perihelion and the date of observation (
AU
pre-perihelion and the date of observation (
![]() AU pre-perihelion).
As discussed in Sect. 4, the perihelion distance of comet C/2004 K1
(Catalina) is consistent with classic dust drag by water, and therefore all solutions of the
dust tail model should provide a
AU pre-perihelion).
As discussed in Sect. 4, the perihelion distance of comet C/2004 K1
(Catalina) is consistent with classic dust drag by water, and therefore all solutions of the
dust tail model should provide a ![]() -dependent velocity. This is indeed the case: panel
a of Fig. 7 shows that both isotropic (w = 180
-dependent velocity. This is indeed the case: panel
a of Fig. 7 shows that both isotropic (w = 180![]() )
or anisotropic
(w = 45
)
or anisotropic
(w = 45![]() )
ejections, during the two years before perihelion (
)
ejections, during the two years before perihelion (![]() the time of present
observations), require an increase in the dust velocity from 0.5 m/s to 1.5-2 m/s (at 1 cm
dust size) to reproduce the observed dust tail, although the shape of the comet tail
appears to be similar to that of comet C/2003 O1 (LINEAR).
the time of present
observations), require an increase in the dust velocity from 0.5 m/s to 1.5-2 m/s (at 1 cm
dust size) to reproduce the observed dust tail, although the shape of the comet tail
appears to be similar to that of comet C/2003 O1 (LINEAR).
Panel c of Fig. 7 shows which time-dependent ![]() parameter
range allows us to fit the observed dust tail, which has been converted into sizes (see Sect. 6.1).
The same dust bulk density of 10
parameter
range allows us to fit the observed dust tail, which has been converted into sizes (see Sect. 6.1).
The same dust bulk density of 10
![]() was adopted, and a dust scattering efficiency
was adopted, and a dust scattering efficiency
![]() ,
as is probable for absorbing grains. This panel of Fig. 7 suggests
that all the observed tail must consist of grains larger than 0.1 mm if the dust bulk density
is 10
,
as is probable for absorbing grains. This panel of Fig. 7 suggests
that all the observed tail must consist of grains larger than 0.1 mm if the dust bulk density
is 10
![]() ,
and also that slightly larger grains with respect to comet C/2003 O1 (LINEAR)
(grain size
,
and also that slightly larger grains with respect to comet C/2003 O1 (LINEAR)
(grain size ![]() 10 cm) are needed to fit the tail brightness distribution.
10 cm) are needed to fit the tail brightness distribution.
Panel b shows the time evolution in the dust size distribution for the comet. The time
variation in the two years preceeding the observation is almost negligible, with values rising
from
![]() two years before perihelion to
two years before perihelion to
![]() shortly before perihelion.
However, the uncertainty in these values is such that a constant dust size distribution seems
consistent with the tail brightness distribution. As shown in panel d, the
dust mass loss-rate indeed remains almost constant at 10 kg/s, while the Af
shortly before perihelion.
However, the uncertainty in these values is such that a constant dust size distribution seems
consistent with the tail brightness distribution. As shown in panel d, the
dust mass loss-rate indeed remains almost constant at 10 kg/s, while the Af![]() value
increased slightly from 1 to 4 m in the same two years, which is again consistent with the
observed value of 5 m reported in Table 5.
value
increased slightly from 1 to 4 m in the same two years, which is again consistent with the
observed value of 5 m reported in Table 5.
7 C/2003 O1 (LINEAR) nucleus size and volatile content
Comet nucleus size distributions are of great interest because they preserve a record of the outer nebula mass distributions in the late stages of planetary formation, as well as a record of collisional evolution. In this sense, the differences in the size distribution between different cometary classes are crucial: Short-Period Comets are thought to be collisional fragments from the Edgeworth-Kuiper Belt population, injected into resonaces to form the present family (Davis & Farinella 1997). In contrast, Long-Period Comets that have been stored inside the Oort Cloud may not have been affected by collisions, so that their size distribution could be considered primordial.
The results of the dust model application to the image of comet C/2003 O1 (LINEAR)
can be used to derive indirect information about the nucleus size of the target and its volatile
content. The fit to the
cometary isophote suggests that all the observed tail must consist of grains larger
than 0.1 mm if the dust bulk density is 10
![]() .
Assuming
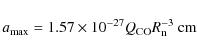
that all of the dust rate is due to CO sublimation, this size allows us to infer
the lower value of the CO loss rate
.
Assuming
that all of the dust rate is due to CO sublimation, this size allows us to infer
the lower value of the CO loss rate
![]() necessary to lift this grain. For
uniform outgassing, the (maximum) size of lifted grain is (Crifo 1999)
necessary to lift this grain. For
uniform outgassing, the (maximum) size of lifted grain is (Crifo 1999)
 |
(4) |
where
![\begin{figure}
\par\includegraphics[width=8cm,clip]{11527f8.ps} \end{figure}](/articles/aa/full_html/2009/28/aa11527-08/img83.png) |
Figure 8:
CO production rate versus different cometary nucleus radius |
| Open with DEXTER | |
The few values of nucleus radius for LPCs available in literature
have been recently summarised by Lamy et al. (2005): they range from a sub-km radius of
![]() km for comet C/1983 J1 (Sugano-Saigusa-Fujikawa) (Hanner et al. 1987) to
km for comet C/1983 J1 (Sugano-Saigusa-Fujikawa) (Hanner et al. 1987) to
![]() km for comet C/2001 OG108 (LONEOS) (Abell et al. 2003) and the large value of
km for comet C/2001 OG108 (LONEOS) (Abell et al. 2003) and the large value of
![]() km for the ``giant'' comet C/1995 O1 (Hale-Bopp) (Weaver & Lamy 1997). Since we do not
have information about the nucleus of comet C/2003 O1 (LINEAR), we are only able to make realistic
assumptions based on the possible CO production rate (as the probable driver of cometary activity)
at large heliocentric distance.
km for the ``giant'' comet C/1995 O1 (Hale-Bopp) (Weaver & Lamy 1997). Since we do not
have information about the nucleus of comet C/2003 O1 (LINEAR), we are only able to make realistic
assumptions based on the possible CO production rate (as the probable driver of cometary activity)
at large heliocentric distance.
To our knowledge, a direct measurement of the CO production at large
heliocentric distances (>4-5 AU) is available for only a few comets (and even less for LPCs).
Using data obtained from radio wavelength observations of the strongest CO transitions,
Biver et al. (2002) summarised values for comet C/1995 O1 (Hale-Bopp) (![]()
![]() at
at
![]() AU pre-perihelion, and
AU pre-perihelion, and ![]()
![]() at
at
![]() AU post-perihelion). At
AU post-perihelion). At
![]() AU post-perihelion (the
heliocentric distance of the C/2003 O1 observations presented in this paper), they reported
a value of
AU post-perihelion (the
heliocentric distance of the C/2003 O1 observations presented in this paper), they reported
a value of
![]() .
For the active Centaur 29P/Schwassmann-Wachmann,
a
.
For the active Centaur 29P/Schwassmann-Wachmann,
a
![]() was measured around
was measured around
![]() AU (Senay &
Jewitt 1994; Crovisier et al. 1995; Festou et al. 2001).
Womack & Stern (1999) derived a production rate of
AU (Senay &
Jewitt 1994; Crovisier et al. 1995; Festou et al. 2001).
Womack & Stern (1999) derived a production rate of
![]() for the active Centaur (2060) Chiron, although this marginal detetion has not
been confirmed by independent observations (Rauer et al. 1997; Bockelée-Morvan et
al. 2001).
Only upper limits to the production rate have been derived for
the LPC C/1999 J2 (Skiff) observed at
for the active Centaur (2060) Chiron, although this marginal detetion has not
been confirmed by independent observations (Rauer et al. 1997; Bockelée-Morvan et
al. 2001).
Only upper limits to the production rate have been derived for
the LPC C/1999 J2 (Skiff) observed at
![]() AU (
AU (![]()
![]() ,
Biver 2001) and for the active Centaur C/2001 T4 (NEAT) at
,
Biver 2001) and for the active Centaur C/2001 T4 (NEAT) at
![]() AU (
AU (![]()
![]() ,
Jewitt et al. 2008).
,
Jewitt et al. 2008).
Although the
![]() observed in distant cometary objects depends strongly on observational
bias and heliocentric distance, we can summarise that a value in the range 1.5-
observed in distant cometary objects depends strongly on observational
bias and heliocentric distance, we can summarise that a value in the range 1.5-
![]() could be considered to be typical for a heliocentric distance
could be considered to be typical for a heliocentric distance ![]() 6-8 AU.
Considering the results of the dust-tail modelling of comet C/2003 O1 (LINEAR) (the fit to the
cometary
isophote suggests that all the observed tail must consist of grains larger than 0.1 mm if the
dust bulk density is 10
6-8 AU.
Considering the results of the dust-tail modelling of comet C/2003 O1 (LINEAR) (the fit to the
cometary
isophote suggests that all the observed tail must consist of grains larger than 0.1 mm if the
dust bulk density is 10
![]() ,
see Sect. 6.1), the results plotted in Fig. 8 infer,
for a minimum
,
see Sect. 6.1), the results plotted in Fig. 8 infer,
for a minimum
![]() from 1.5 to
from 1.5 to
![]() ,
a cometary radius
,
a cometary radius ![]() from
13 to 17 km. For a dust bulk density of
from
13 to 17 km. For a dust bulk density of
![]() (and therefore a minimum grain
size of
(and therefore a minimum grain
size of
![]() mm in the tail), the inferred cometary nucleus radius would become
even larger than 20 km. A smaller (and probably more realistic) value for the nucleus of C/2003 O1
(LINEAR) would imply (see Fig. 8) a quite low
mm in the tail), the inferred cometary nucleus radius would become
even larger than 20 km. A smaller (and probably more realistic) value for the nucleus of C/2003 O1
(LINEAR) would imply (see Fig. 8) a quite low
![]() :
for
:
for
![]() km we would
obtain
km we would
obtain
![]() .
.
The amount of CO (relative to water) in comets observed until now is highly variable (from 0.4 to 24%, see Mumma et al. (2003) and Bockelée-Morvan et al. (2005), even if these [CO]/[H2O] ratios are observed for non-distant comets, where a strong sublimation of water is established, so that these values could be close to the true abundances ratios of cometary ices). Therefore, the CO content in a cometary nucleus could reflect the different formation history of the nuclei (different regions in the nebula, e.g., different temperatures and condensation rate) (Hill et al. 2001), and this is particularly interesting in LPCs, which are understood to have formed elsewhere and then been scattered in the ``storage'' of the Oort Cloud. The detection of CO and the amount of CO outgassing in LPCs therefore provides an interesting clue to constrain the formation and evolution processes of minor bodies in the Solar System, considering also that for CO an extended source could also be present in the coma (Capria et al. 2000; Gunnarsson 2003; Gunnarsson et al. 2003), and we should distinguish between these two contributes.
8 Summary and conclusions
We have presented data for two Long Period Comets: C/2003 O1 (LINEAR) and C/2004 K1 (Catalina), observed
at heliocentric distances larger than
![]() AU. Both were active at time of observation,
C/2003 O1 (LINEAR) in particular exhibiting significant activity at its very large heliocentric distance of
AU. Both were active at time of observation,
C/2003 O1 (LINEAR) in particular exhibiting significant activity at its very large heliocentric distance of
![]() AU post-perihelion. We used the images as input to an inverse numerical model,
to derive information on the physical parameters of dust grains in the coma and their time evolution.
AU post-perihelion. We used the images as input to an inverse numerical model,
to derive information on the physical parameters of dust grains in the coma and their time evolution.
Our main results can be summarised as follows:
- 1.
- Both the comets appeared to be active with a coma and a well-developed dust tail, and were similar in
shape and size, despite the great difference in their heliocentric distances of observation.
We observed C/2003 O1 (LINEAR) at
 AU post-perihelion, where it exhibited a coma
extending to at least 3.7
AU post-perihelion, where it exhibited a coma
extending to at least 3.7  104 km in the S-W quadrant, and a long dust tail extending
at least to a projected distance of 3.7
105 km. We observed C/2004 K1 (Catalina)
shortly before its
perihelion at
104 km in the S-W quadrant, and a long dust tail extending
at least to a projected distance of 3.7
105 km. We observed C/2004 K1 (Catalina)
shortly before its
perihelion at
 AU, where it exhibited a coma extending at least to 2.6
104 km in
the N-W quadrant and a long tail extending to at least a projected distance of
AU, where it exhibited a coma extending at least to 2.6
104 km in
the N-W quadrant and a long tail extending to at least a projected distance of
 km.
km.
- 2.
- For comet C/2003 O1 (LINEAR), in the inner 5
 the integrated R magnitude is
 and
the Af
and
the Af value is
 cm, indicative of a significant dust production rate even at
large heliocentric distances. The Af
value is constant at different nucleocentric
distances ,
in a way that is consistent with a scenario of steady-state emission.
cm, indicative of a significant dust production rate even at
large heliocentric distances. The Af
value is constant at different nucleocentric
distances ,
in a way that is consistent with a scenario of steady-state emission.
- 3.
- For comet C/2004 K1 (Catalina), in the inner 5
the integrated R magnitude is
 and the Af
value is
and the Af
value is
 cm. A clear monotonic decrease in Af
values is visible for the nucleocentric distance :
this may indicate non-steady-state
dust emission and possible dust grain fading or destruction inside the coma.
cm. A clear monotonic decrease in Af
values is visible for the nucleocentric distance :
this may indicate non-steady-state
dust emission and possible dust grain fading or destruction inside the coma.
- 4.
- For comet C/2003 O1 (LINEAR), the application of the inverse numerical model has allowed the reconstruction of the time evolution in the dust ejection velocity for a time interval around the perihelion corresponding to heliocentric distances from 7.01 AU pre-perihelion to the distance at observing time. The velocity remains almost constant between 0.5 and 0.9 m/s for 1 cm dust size, which is consistent with a scenario of dust drag dominated by steady CO emission.
- 5.
- For comet C/2004 K1 (Catalina), the dust ejection velocity increased from 0.5 m/s at a
heliocentric distance of 6.51 AU pre-perihelion to 2 m/s at the distance at observing time,
which is consistent with a scenario of a classical
 -dependent dust drag dominated by water in the inner
part of the cometary orbit.
-dependent dust drag dominated by water in the inner
part of the cometary orbit.
- 6.
- The dust mass loss-rate for C/2003 O1 (LINEAR) decreases from
 30 kg/s before
perihelion to 4 kg/s shortly before the observations. The most probable explanation of
this decrease is the inhomogeneity in the dust population at different nucleus depths:
before perihelion, layers with a slightly larger population of large grains were ejected.
After perihelion, CO started to drag dust from lower nucleus layers that have a mean dust population
slightly depleted of large grains.
30 kg/s before
perihelion to 4 kg/s shortly before the observations. The most probable explanation of
this decrease is the inhomogeneity in the dust population at different nucleus depths:
before perihelion, layers with a slightly larger population of large grains were ejected.
After perihelion, CO started to drag dust from lower nucleus layers that have a mean dust population
slightly depleted of large grains.
- 7.
- The dust mass loss rate for C/2004 K1 (Catalina) remains almost constant at 10 kg/s
between 6.51 AU and 3.43 AU pre-perihelion.
- 8.
- Based on the isophote fitting by the model, all the observed tail of comet C/2003 O1 (LINEAR)
must consist of grains larger than 0.1 mm if the dust bulk density is 10
 .
This
allows us to speculate about the comet nucleus size and its volatile (CO) content: for a
minimum
.
This
allows us to speculate about the comet nucleus size and its volatile (CO) content: for a
minimum
 of between 1.5 and
 (as for the only
three distant cometary objects for which the CO outgassing has been measured), a comet radius
(as for the only
three distant cometary objects for which the CO outgassing has been measured), a comet radius
 from 13 to 17 km can be inferred. In contrast, a smaller (and probably more realistic)
value for the nucleus of C/2003 O1 (LINEAR) would result in a quite low
:
for
= 1 km, we would obtain
from 13 to 17 km can be inferred. In contrast, a smaller (and probably more realistic)
value for the nucleus of C/2003 O1 (LINEAR) would result in a quite low
:
for
= 1 km, we would obtain
 .
.
Acknowledgements
We warmly thank the referee (J. Crovisier) for his helpful comments on the paper, especially in the interpretation and discussion of cometary radio observations. Observations presented in this paper have been funded by the Optical Infrared Coordination Network (OPTICON), a major international collaboration supported by the Research Infrastructures Programme of the European Commission's Sixth Framework Programme. We also gratefully aknowledge funding from Italian Space Agency (ASI) under contract I/015/07/0.
References
- Abell, P. A., Fernández, Y. R., Pravec, P., et al. 2003, in Lunar and Planetary Science XXXIV, Abstract 1253 (Houston: Lunar and Planetary Institute) (In the text)
- A'Hearn, M. F., Schleicher, D. G., Feldman, P. D., Millis, R. L., & Thompson, D. T. 1984, AJ, 89, 579 [NASA ADS] [CrossRef] (In the text)
- Biver, N. 2001, ICQ, 23, 85 [NASA ADS] (In the text)
- Biver, N., Bockelée-Morvan, D., Colom, P., et al. 2002, EM&P, 90, 5 [NASA ADS] (In the text)
- Bockelée-Morvan, D., Lellouch, E., Biver, N., et al. 2001, A&A, 377, 343 [NASA ADS] [CrossRef] [EDP Sciences] (In the text)
- Bockelée-Morvan, D., Crovisier, J., Mumma, M. J., & Weaver, H. 2005, in Comets II, ed. M., Festou, H. U., Keller, & H. A., Weaver (Tucson: Univ. Arizona Press) (In the text)
- Capria, M. T. 2002, EM&P, 89, 161 [NASA ADS] (In the text)
- Capria, M. T., Coradini, A., De Sanctis, M. C., & Orosei, R. 2000, A&A, 357, 359 [NASA ADS] (In the text)
- Cohen, M., Prialnik, D., & Podolak, M. 2003, New Astron., 8, 179 [NASA ADS] [CrossRef] (In the text)
- Coradini, A., Capaccioni, F., Capria M. T., et al. 1997, Icarus, 129, 2, 317 (In the text)
- Crovisier, J., Biver, N., Bockelée-Morvan, D., et al. 1995, Icarus, 115, 213 [NASA ADS] [CrossRef] (In the text)
- Crifo, J. F., Rodionov, A. V., & Bockelée-Morvan, D. 1999, Icarus, 138, 1 [CrossRef], 85 (In the text)
- Davis, D. R., & Farinella, P. 1997, Icarus, 125, 50 [NASA ADS] [CrossRef] (In the text)
- Epifani, E., Colangeli, L., Fulle, M., et al. 2001, Icarus, 149, 339 [NASA ADS] [CrossRef] (In the text)
- Festou, M. C., Gunnarsson, M., Rickman, H., et al. 2001, Icarus, 150, 140 [NASA ADS] [CrossRef] (In the text)
- Fulle, M. 1989, A&A, 217, 283 [NASA ADS] (In the text)
- Fulle, M., Cremonese, G., & Bohm, C. 1998, AJ, 116, 1470 [NASA ADS] [CrossRef] (In the text)
- Gunnarsson, M. 2003, A&A, 398, 353 [NASA ADS] [CrossRef] [EDP Sciences] (In the text)
- Gunnarsson, M., Bockelée-Morvan, D., Winniberg, A., et al. 2003, A&A, 402, 383 [NASA ADS] [CrossRef] [EDP Sciences] (In the text)
- Gutiérrez, P. J., Ortiz, J. L., Rodrigo, R., & López-Moreno, J. J. 2001, A&A, 374, 326 [NASA ADS] [CrossRef] [EDP Sciences] (In the text)
- Hanner, M. S., Newburn, R. L., Spinrad, H., & Veeder, G. J. 1987, AJ, 94, 1081 [NASA ADS] [CrossRef] (In the text)
- Hill, H. G. M., Grady, C. A., & Nuth, J. A., III, et al. 2001, PNASS, 98, 2182 [NASA ADS] [CrossRef] (In the text)
- Jewitt, D., Garland, C. A., & Aussel, H. 2008, AJ, 135, 400 [NASA ADS] [CrossRef] (In the text)
- Julian, W. H., Samarasinha, N. H., & Belton, M. J. S. 2000, Icarus, 144, 160 [NASA ADS] [CrossRef] (In the text)
- Kawakita, H., Watanabe, J., Ootsubo, T., et al. 2004, ApJ, 601, L191 [NASA ADS] [CrossRef]
- Kelley, M. S., Woodward, C. E., Harker, D. E., et al. 2006, ApJ, 651, 1256 [NASA ADS] [CrossRef] (In the text)
- Korsun, P. P., & Chorny, G. F. 2003, A&A, 410, 1029 [NASA ADS] [CrossRef] [EDP Sciences]
- Korsun, P. P., Ivanova, O. V., & Afanasiev, V. L. 2006, A&A, 459, 977 [NASA ADS] [CrossRef] [EDP Sciences] (In the text)
- Kusnirak, P., & Birtwhistle, P. 2003, IAU Circ., 8170 (In the text)
- Krishna Swamy, K. S. 1986, Physics of comets (World Scientific Pub.) (In the text)
- Lamy, P. L., Toth, I., Fernández, Y. R., & Weaver, H. A. 2005, in Comets II, ed. M., Festou, H. U. Keller, & H. A., Weaver (Tucson: Univ. Arizona Press) (In the text)
- Landolt, A. U. 1992, AJ, 104, 1 [CrossRef], 340 (In the text)
- Lara, L.-M., Tozzi, G. P., Boehnhardt, H., DiMartino, M., & Schulz, R. 2004, A&A, 422, 717 [NASA ADS] [CrossRef] [EDP Sciences] (In the text)
- Laufer, D., Kochavi, E., & Bar-Nun, A. 1987, Phys. Rev. B, 36, 9219 [NASA ADS] [CrossRef] (In the text)
- Levison, H. F. 1996, in Completing the Inventory of the Solar System, ed. T. W., Retting, & J. M., Hahn (San Francisco: ASP), ASP Conf. Ser., 107 (In the text)
- Licandro, J., Tancredi, G., Lindgren, M., Rickman, H., & Gil Hutton, R. 2000, Icarus, 147, 161 [NASA ADS] [CrossRef] (In the text)
- Lowry, S. C., & Fitzsimmons, A. 2001, A&A, 365, 204 [NASA ADS] [CrossRef] [EDP Sciences] (In the text)
- Lowry, S. C., & Fitzsimmons, A. 2005, MNRAS, 358, 641 [NASA ADS] [CrossRef] (In the text)
- Lowry, S. C., & Weissmann, P. R. 2003, Icarus, 164, 492 [NASA ADS] [CrossRef] (In the text)
- Lowry, S. C., Fitzsimmons, A., Cartwright, I. M., & Williams, I. P. 1999, A&A, 349, 649 [NASA ADS] (In the text)
- Lowry, S. C., Fitzsimmons, A., & Collander-Brown, S. 2003, A&A, 397, 329 [NASA ADS] [CrossRef] [EDP Sciences] (In the text)
- Mazzotta Epifani, E., Palumbo, P., Capria, M. T., et al. 2006, A&A, 460, 935 [NASA ADS] [CrossRef] [EDP Sciences] (In the text)
- Mazzotta Epifani, E., Palumbo, P., Capria, M. T., et al. 2007, MNRAS, 381, 713 [NASA ADS] [CrossRef] (In the text)
- Mazzotta Epifani, E., Palumbo, P., Capria, M. T., et al. 2008, MNRAS, 390, 1 [CrossRef], 265 (In the text)
- Meech, K. J. 1988, BAAS, 20, 835 [NASA ADS] (In the text)
- Meech, K. J. 1990, BAAS, 22, 1103 [NASA ADS]
- Meech, K. J. 1991, in Comets in the Post-Halley Era, ed. R. L., Newburn, Jr., M., Neugebauer, & J., Rahe (Kluwer Acad. Pub.) (In the text)
- Meech, K. J. 1992, BAAS, 24, 993 [NASA ADS]
- Meech, K. J. 1999, in Evolution and Source Regions of Asteroids and Comets, ed. J. Svoren, E. M., Pittich, & H., Rickman, Tatranská Lomnica Astron. Inst. Slovak Acad. Sci., Proc. IAU Coll., 173 (In the text)
- Meech, K. J., & Hainaut, O. R. 2001, in Collisional Processes in the Solar System, ed. M. Y., Marov, & H., Rickman, ASSL, 261 (Dordrecht: Kluwer Acad. Pub.) (In the text)
- Meech, K. J., & Svoren, J. 2005, in Comets II, ed. M., Festou, H. U., Keller, & H. A., Weaver (Tucson: Univ. Arizona Press) (In the text)
- Meech, K. J., Hainaut, O. R., & Marsden, B. G. 2004, Icarus, 170, 463 [NASA ADS] [CrossRef] (In the text)
- Meech, K. J., Pittichova, J., Bar-Nun, A., et al. 2009, Icarus, in press [doi:10.1016/j.icarus.2008.12.045] (In the text)
- Mumma, M. J., DiSanti, M. A., Dello Russo, N., et al. 2003, Adv. Space Res., 31, 2563 [NASA ADS] [CrossRef] (In the text)
- Notesco, G., Bar-Nun, A., & Owen, T. C. 2003, Icarus, 162, 183 [NASA ADS] [CrossRef] (In the text)
- Prialnik, D., Benkhoff, J., & Podolak, M. 2005, in Comets II, ed. M., Festou, H.U., Keller, & H. A., Weaver (Tucson: Univ. Arizona Press) (In the text)
- Rauer, H., Biver, N., Crovisier, J., et al., 1997, Planet. Space Sci., 45, 799 [NASA ADS] [CrossRef] (In the text)
- Rauer, H., Helbert, J., Arpigny, C., et al. 2003, A&A, 397, 1109 [NASA ADS] [CrossRef] [EDP Sciences] (In the text)
- Senay, M. C., & Jewitt, D. 1994, Nature, 371, 229 [NASA ADS] [CrossRef] (In the text)
- Spahr, T., Battat, J. B., Stoss, R., Sanchez, S., & Nomen, J. 2004, IAU Circ., 8343 (In the text)
- Szabó, G. M., Csák, B., Sárneczky, K., & Kiss, L. L. 2001, A&A, 374, 712 [NASA ADS] [CrossRef] [EDP Sciences] (In the text)
- Szabó, G. M., Kiss, L. L., Sárneczky, K., & Sziládi, K. 2002, A&A, 384, 702 [NASA ADS] [CrossRef] [EDP Sciences] (In the text)
- Szabó, G. M., Kiss, L. L., & Sárneczky, K. 2008, ApJ, 677, L121 [NASA ADS] [CrossRef]
- Tancredi, G., Rickman, H., & Greenberg, J. M. 1994, A&A, 286, 659 [NASA ADS] (In the text)
- Tancredi, G., Fernandez, J. A., Rickman, A., & Licandro, J. 2006, Icarus, 182, 2 [CrossRef], 527 (In the text)
- Tozzi, G. P., Boehnhardt, H., & Lo Curto, G. 2003, A&A, 398, L41 [NASA ADS] [CrossRef] [EDP Sciences] (In the text)
- Weaver, H. A., & Lamy, P. L. 1997, EM&P, 79, 17 [NASA ADS] (In the text)
- Weiler, M., Rauer, H., Knollemberg, J., Jorda, L., & Helbert, J. 2003, A&A, 403, 313 [NASA ADS] [CrossRef] [EDP Sciences]
- Womack, M., & Stern, A. S. 1999, Astron. Vestn., 33, 187 (In the text)
Footnotes
- ... (Catalina)
- Based on observations collected at the Centro Astronómico Hispano Alemán (CAHA) at Calar Alto, operated jointly by the Max-Planck Institute für Astronomie and the Instituto de Astrofísica de Andalucia (CSIC).
All Tables
Table 1: Summary of analysis of the distant environment of Long Period Comets.
Table 2: Summary of available results from image analysis of Long Period Comets.
Table 3: Orbital parameters of the target comets.
Table 4: Observing conditions.
Table 5:
Magnitude and A f![]() of the target comets.
of the target comets.
All Figures
| |
Figure 1:
Composite image of comet C/2003 O1 (LINEAR). The image width
is 82 |
| Open with DEXTER | |
| In the text | |
| |
Figure 2:
Composite image of comet C/2004 K1 (Catalina). The image width
is 110 |
| Open with DEXTER | |
| In the text | |
| |
Figure 3:
A f |
| Open with DEXTER | |
| In the text | |
| |
Figure 4: Observed (continuous lines) and calculated (dashed lines) isophotes of comet C/2003 O1 (LINEAR). The innermost isophote corresponds to 23.8 R-mag arcsec-2. The isophote step is 0.75 R-mag arcsec-2. The Sun-pointing sky-projected vector is towards bottom. The different panels refer to different (u, w) combinations (see text for more details). |
| Open with DEXTER | |
| In the text | |
| |
Figure 5:
Dust environment of comet C/2003 O1 (LINEAR) derived from the modelling of the
CAHA image. Dust ejection velocity ( upper left), power index of the differential size
distribution ( upper right), size interval to which all the shown outputs are related
( lower left), mass-loss rate, and A f |
| Open with DEXTER | |
| In the text | |
| |
Figure 6: Observed (continuous lines) and calculated (dashed lines) isophotes of comet C/2004 K1 (Catalina). The innermost isophote corresponds to 20.9 R-mag arcsec-2. The isophote step is 0.75 R-mag arcsec-2. The Sun-pointing sky-projected vector is towards bottom. The different panels refer to different (u, w) combinations (see text for more details). |
| Open with DEXTER | |
| In the text | |
| |
Figure 7:
Dust environment of comet C/2004 K1 (Catalina) derived from the modelling of the
CAHA image. Dust ejection velocity ( upper left), power index of the differential size
distribution ( upper right), size interval to which all the shown outputs are related
( lower left), mass loss rate, and A f |
| Open with DEXTER | |
| In the text | |
| |
Figure 8:
CO production rate versus different cometary nucleus radius |
| Open with DEXTER | |
| In the text | |
Copyright ESO 2009
Current usage metrics show cumulative count of Article Views (full-text article views including HTML views, PDF and ePub downloads, according to the available data) and Abstracts Views on Vision4Press platform.
Data correspond to usage on the plateform after 2015. The current usage metrics is available 48-96 hours after online publication and is updated daily on week days.
Initial download of the metrics may take a while.