| Issue |
A&A
Volume 501, Number 3, July III 2009
|
|
|---|---|---|
| Page(s) | L23 - L26 | |
| Section | Letters | |
| DOI | https://doi.org/10.1051/0004-6361/200912505 | |
| Published online | 22 June 2009 | |
LETTER TO THE EDITOR
The secondary eclipse of the transiting exoplanet CoRoT-2b![[*]](/icons/foot_motif.png)
R. Alonso 1 - T. Guillot 2 - T. Mazeh 3,4 - S. Aigrain 5 - A. Alapini 5 - P. Barge 6 - A. Hatzes 7 - F. Pont 5
1 - Observatoire de Genève, Université de Genève, 51 Ch. des Maillettes, 1290 Sauverny, Switzerland
2 -
Observatoire de la Côte d'Azur, Laboratoire Cassiopée, CNRS UMR 6202, BP 4229, 06304 Nice Cedex 4, France
3 -
Radcliffe Institute for Advanced Studies at Harvard, 8 Garden
St. Cambridge MA 02138, USA
4 -
School of Physics and Astronomy, R. and B. Sackler Faculty of Exact Sciences, Tel Aviv University, Tel Aviv 69978, Israel
5 -
School of Physics, University of Exeter, Stocker Road, Exeter EX4 4QL,
UK
6 -
Laboratoire d'Astrophysique de Marseille, UMR 6110, Technopole de Marseille-Etoile, 13388 Marseille Cedex 13, France
7 -
Thüringer Landessternwarte Tautenburg, Sternwarte 5, 07778 Tautenburg, Germany
Received 15 May 2009 / Accepted 14 June 2009
Abstract
We present a study of the light curve of the transiting
exoplanet CoRoT-2b, aimed at detecting the secondary eclipse and measuring
its depth. The data were obtained
with the CoRoT satellite during its first run of more than
140 days. After filtering the low frequencies with a pre-whitening
technique, we detect a
![]() % secondary eclipse centered on the
orbital phase
% secondary eclipse centered on the
orbital phase
![]() .
Assuming a black-body emission of the
planet, we estimate a surface brightness temperature of
.
Assuming a black-body emission of the
planet, we estimate a surface brightness temperature of
![]() K. We provide the planet's equilibrium temperature and re-distribution factors as a function of the unknown amount of reflected light. The upper limit for the geometric albedo is 0.12. The detected secondary is the shallowest ever found.
K. We provide the planet's equilibrium temperature and re-distribution factors as a function of the unknown amount of reflected light. The upper limit for the geometric albedo is 0.12. The detected secondary is the shallowest ever found.
Key words: stars: planetary systems - techniques: photometric
1 Introduction
Out of the circa 350 exoplanets found to date, the 50 that transit their host stars allow several follow-up studies, based either on the occultation of part of the stellar disk by the planet (transits) or on the disappearance of the planet behind the star (secondary eclipses). Observations of the secondary eclipses of several exoplanets have enabled measurements of their emitted flux at different wavelengths, providing clues to their atmospheres (Deming et al. 2005; Charbonneau et al. 2005). Temperature inversions at stratospheric levels have been found on several occasions among the hottest known transiting Jupiters (Knutson et al. 2008; Burrows et al. 2007; Knutson et al. 2009), and several detections of the modulation of the planetary flux with orbital phase have been claimed by Knutson et al. (2007) and Snellen et al. (2009).
The transiting planet CoRoT-2b (Alonso et al. 2008) was discovered during
the first ![]() 150-d pointing of the CoRoT mission
(Baglin et al. 2006). The spectral type of the star (G0V) and the period
of the planet (1.7 d) suggest that it belongs to the pM class of
exoplanets as defined by Fortney et al. (2008), for which the strong incident
flux is thought to cause stratospheric thermal inversions.
150-d pointing of the CoRoT mission
(Baglin et al. 2006). The spectral type of the star (G0V) and the period
of the planet (1.7 d) suggest that it belongs to the pM class of
exoplanets as defined by Fortney et al. (2008), for which the strong incident
flux is thought to cause stratospheric thermal inversions.
One of the intriguing characteristics of the hot Jupiters is their
variety in planetary radius. While for several planets the measured
radius agrees with theoretical models of planetary formation and
evolution, some of them appear larger than expected. A range of
scenarios have been suggested to account for the phenomenon, but no
clear picture has been delineated to date. CoRoT-2b not only
belongs to this class of ``bloated''' planets, but it is one with the
most difficult radius as to explain, because of its high mass of 3.1
![]() .
.
The host star of CoRoT-2b exhibits several signs of youth (Bouchy et al. 2008), namely the detection of the Li I 6708 Å absorption line, an inversion of the cores of the Ca II H and K lines, and a faster-than-expected rotation period of 4.5 d (Lanza et al. 2009). While these ``patterns'' are traditionally attributed to stellar youth, it is also possible that the stellar evolution has been affected by tidal interactions with the close-in massive planet. Recently, Jackson et al. (2009) and Pont (2009) have suggested some observational evidence for strong tidal effects on exoplanets' host stars.
The activity of the star leaves footprints in the photometric light curve of CoRoT-2 that can be used to infer characteristics of the distribution and lifetimes of the spots on the stellar surface. By modeling the flux of the star in the parts of the light curve without transits, Lanza et al. (2009) observed a cyclic oscillation of the total spotted area of the star with a period of
![]() days. In a different study, Valio et al. (2009) looked at the effects of the occultation of spots in the planet's path along the stellar surface.
days. In a different study, Valio et al. (2009) looked at the effects of the occultation of spots in the planet's path along the stellar surface.
In this paper we describe detection of the secondary eclipse in
the white light curve of the CoRoT public data. The technique is
similar to the one used to detect the secondary eclipse of CoRoT-1b
(Alonso et al. 2009b). A tentative detection of a
![]() eclipse, based on the same data, has been claimed by
Alonso et al. (2009a). Here we refine the analysis by carrying out a more careful filtering of the stellar variability, estimate the significance
of the detection, and discuss the results.
eclipse, based on the same data, has been claimed by
Alonso et al. (2009a). Here we refine the analysis by carrying out a more careful filtering of the stellar variability, estimate the significance
of the detection, and discuss the results.
2 Observations
CoRoT-2b was observed during the first Long Run pointing of the satellite, which lasted 142-days. We used the data corrected to the N2 level (the processing steps are described in Auvergne et al. 2009), which contains 369 695 flux measurements, with a time sampling of 512-s from the first 5.2 days of data, after which it was changed to 32-s. The standard deviation of the normalized data after filtering the low frequencies as described below is 0.0014 (in units of normalized flux) for the 32-s sampled data, while it is 0.00056 for the 512 s data. For comparison, the photon noise level in the 32-s data is of 0.0011, revealing that the real data is only about 20% above the photon noise level, increasing to 90% above the photon noise in the 512-s part. An inspection of the 2MASS plates reveals that the star has a close companion 3.5 mag fainter in V, whose flux falls completely inside the aperture mask. We therefore subtracted a constant value of 5.6% of the median level of the curve before normalizing it, as in Alonso et al. (2008).
3 Analysis of the CoRoT light curve
The two most remarkable features of the light curve of CoRoT-2 are the transits by its companion and the modulation caused by the stellar activity and rotation. Both features tend to hide any secondary eclipse in the light curve; therefore, in this section we explain our efforts to filter these two features, while avoiding to dilute or erase the signal of the secondary eclipse.
To filter out the primary transit we could ignore the data points inside the transit. However, inclusion of data gaps at the orbital period of the transiting planet might result in spurious signals at this period and its harmonics, risking an effect on the signal of secondary eclipse. To reduce this risk, we subtracted the best fit solution of Alonso et al. (2008) from the curve, instead of cutting the parts of the light curves where the transits are detected. We plot the light curve with the transits removed this way in Fig. 1. As noted by Valio et al. (2009), the residuals in the individual transits show the effect of occulted spots during the transit, so they might add some high frequencies in a very short phase of the planet's orbit.
To filter out the stellar activity signal, we pre-whitened the light curve using PERIOD04 (Lenz & Breger 2005), a well-known and tested technique for identifying periodic signals in variable stars. Basically, it consists of successively locating the highest amplitude in the Fourier power spectrum and fitting a combination of sinusoids to the data that contain the frequency with the highest amplitude and all the previously identified frequencies. Before performing the PERIOD04 pre-whitening of the data, we averaged them into 30-min bins. We searched for frequencies between 0 and 24 c/d (cycles per day).
| |
Figure 1: Light curve of CoRoT-2 where the modeled transits have been subtracted. For display purposes, the data have been binned in 30 min bins. |
| Open with DEXTER | |
The amplitude spectra before and after filtering the low
frequencies are plotted in Fig. 2, and the mean noise
level in the 0-24 c/d range in the filtered spectum is of
![]() ,
with a dispersion of
,
with a dispersion of
![]() .
.
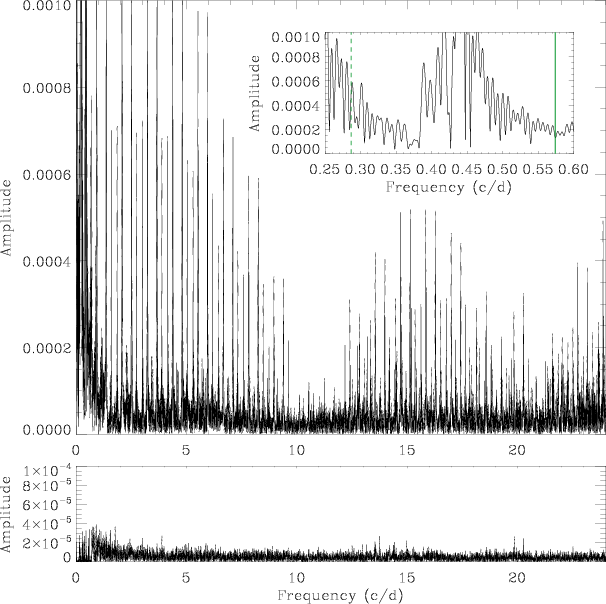 |
Figure 2: The amplitude spectra of the CoRoT-2 light curve, before ( top) and after ( bottom) pre-whitening of the 123 frequencies needed to model the low frequency content of the signal. To avoid including gaps in the data, the transits were previously corrected by the best-fit model of Alonso et al. (2009a). The inset shows a zoom around the planet's orbital frequencies. The vertical solid and dashed green lines mark the planet's period and twice that value, respectively. |
| Open with DEXTER | |
The search for the secondary eclipse was performed using the same techniques as described in Alonso et al. (2009b). Briefly, the search consisted of:
- selecting an orbital phase
 where the secondary depth is
going to be evaluated;
where the secondary depth is
going to be evaluated;
- performing low order polynomial fits (linear fits in this particular case) to the parts of the light
curve surrounding the phase .
The regions where the fits are
evaluated are at a distance of slightly more than the transit
duration, to avoid including an hypothetical secondary centered
on
in the fits. The total number of fits will thus be the
same as the total number of observed secondary eclipses;
- fitting a trapezoid with the same duration and shape as obtained from
the transit parameters, and centered on .
The only free
parameter is the trapezoid depth.
| |
Figure 3:
Depth of a trapezoid with the shape and duration of a
transit, as a function of the planet's orbital phase. The maximum is
centered on phase 0.5, corresponding to the secondary eclipse. In
gray, the result in a light curve where a secondary eclipse of
|
| Open with DEXTER | |
To make sure that any of the corrections explained above did not add or
remove some signal of the secondary eclipse, we inserted a 0.01%
secondary eclipse in phase 0.5 to the raw light curve, and performed
the same analysis on this simulated data. The whole procedure,
using the same filtering and repeating the pre-whitening of the curve,
was performed on the simulated data. The results are plotted in
Fig. 3, along with the results of the real
data. The highest peak in this case is also centered at 0.5, and the
fitted depth is of about
![]() ,
i.e., the sum of the
inserted eclipse and the signal present in the data. We thus suggest
that the whole preparation of the curve before performing the
secondary search does not significantly alter the signal we want to
measure.
,
i.e., the sum of the
inserted eclipse and the signal present in the data. We thus suggest
that the whole preparation of the curve before performing the
secondary search does not significantly alter the signal we want to
measure.
The phase-folded light curve during the phases of expected secondary
eclipse is plotted in Fig. 4, together with the best
fitted trapezoids. We explored the goodness-of-fit through ![]() function around phase 0.5, in a grid of secondary eclipse centers and
depths. The model used for the secondary was a trapezoid with
duration and shape fixed to those of the transit. The observed
secondary eclipse was binned into bins of 0.001 in phase
(
function around phase 0.5, in a grid of secondary eclipse centers and
depths. The model used for the secondary was a trapezoid with
duration and shape fixed to those of the transit. The observed
secondary eclipse was binned into bins of 0.001 in phase
(![]() 2.5 min), and we estimated the error of each bin as the
standard deviation of the measurements inside the bin divided by the
square root of the number of points inside the bin. We plot the
resulting
2.5 min), and we estimated the error of each bin as the
standard deviation of the measurements inside the bin divided by the
square root of the number of points inside the bin. We plot the
resulting ![]() and the formal sigma contours in
Fig. 5. A secondary eclipse with a depth of
and the formal sigma contours in
Fig. 5. A secondary eclipse with a depth of
![]() % is detected in
the CoRoT light curve at an orbital phase of
% is detected in
the CoRoT light curve at an orbital phase of
![]() .
.
 |
Figure 4:
Phase-folded curve of CoRoT-2b during the phases of
secondary eclipse. The data have been binned in 0.01 in phase
( |
| Open with DEXTER | |
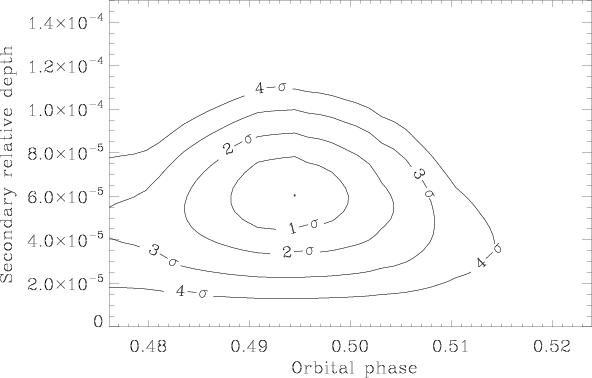 |
Figure 5:
The |
| Open with DEXTER | |
To estimate the significance of the secondary eclipse detection, we performed the following test, which preserved the presence of correlated noise in the data. From the data we subtracted the fitted secondary eclipse and shifted the residuals circularly, and then fitted a trapezoid with the phase and shape expected from the primary eclipse. Again, the only parameter was the secondary eclipse depth. All
our 1000 trials resulted in depths less than 0.006%, the depth derived from the real data. The mean fitted depth was
![]() %, consistent with zero.
Additionally, we checked the uncertainties in the depth measurement by two different methods. In the first one, we reinserted the fitted secondary eclipse after the residual curves of the previous test were constructed and evaluated the fitted depths. We estimated the 1-
%, consistent with zero.
Additionally, we checked the uncertainties in the depth measurement by two different methods. In the first one, we reinserted the fitted secondary eclipse after the residual curves of the previous test were constructed and evaluated the fitted depths. We estimated the 1-![]() uncertainty from the standard deviation of the depths that were fitted during this test. The result of this test gave a depth of
uncertainty from the standard deviation of the depths that were fitted during this test. The result of this test gave a depth of
![]() %.
As a second method, we fitted two Gaussian functions to (1) the distributions of points inside total secondary eclipse and (2) a subset of the part outside secondary eclipse, with the same number of points as (1) and with a randomly selected starting point. In the construction of the distributions, to minimize the effect of an arbitrarily selected histogram bin size, we used random values of the sizes of the histogram bin, between
%.
As a second method, we fitted two Gaussian functions to (1) the distributions of points inside total secondary eclipse and (2) a subset of the part outside secondary eclipse, with the same number of points as (1) and with a randomly selected starting point. In the construction of the distributions, to minimize the effect of an arbitrarily selected histogram bin size, we used random values of the sizes of the histogram bin, between ![]() -6 and
-6 and ![]() -6 in units of normalized flux. We repeated this test using 500 different starting points and values of the bin, and we estimated the 1-
-6 in units of normalized flux. We repeated this test using 500 different starting points and values of the bin, and we estimated the 1-![]() errors as above. This test resulted in a depth of
errors as above. This test resulted in a depth of
![]() %. We adopted a final value of the secondary eclipse depth of
%. We adopted a final value of the secondary eclipse depth of
![]() % from the results of the different tests.
% from the results of the different tests.
The secondary eclipse appears slightly offset, at a 1-![]() level,
from the expected center for a circular orbit, which could be interpreted as a
possible non-zero eccentricity of
level,
from the expected center for a circular orbit, which could be interpreted as a
possible non-zero eccentricity of
![]() .
This eccentricity is within the 1-
.
This eccentricity is within the 1-![]() uncertainty of the orbital solution obtained from the radial velocity measurements (
uncertainty of the orbital solution obtained from the radial velocity measurements (
![]() in Alonso et al. 2008).
in Alonso et al. 2008).
4 Discussion
In the optical, the observed flux of the planet can be expressed:
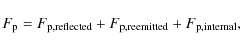 |
(1) |
i.e., the sum of a component of reflected light, a thermal re-emission of the incident stellar flux, and a thermal emission not related to the incident flux from the star (e.g., internal heat or emission due to tidal forces). The reflected light can be estimated as
Assuming blackbody radiation and negligible
![]() ,
Fig. 6 shows that likely values of the albedo (corresponding to f between 0.25 and 0.5) are
,
Fig. 6 shows that likely values of the albedo (corresponding to f between 0.25 and 0.5) are
![]() ,
which confirms the very low reflection of the planet obtained theoretically (e.g. Marley et al. 1999; Seager et al. 2000; Sudarsky et al. 2000; Hood et al. 2008), and observationally: upper limits for the albedos of exoplanets in similar conditions as CoRoT-2b have been reported by Charbonneau et al. (1999,
,
which confirms the very low reflection of the planet obtained theoretically (e.g. Marley et al. 1999; Seager et al. 2000; Sudarsky et al. 2000; Hood et al. 2008), and observationally: upper limits for the albedos of exoplanets in similar conditions as CoRoT-2b have been reported by Charbonneau et al. (1999,
![]() for
for ![]() Bootis b), Leight et al. (2003a,b,
Bootis b), Leight et al. (2003a,b,
![]() for
for ![]() Bootis b,
Bootis b,
![]() for HD 75 289), by Rowe et al. (2008) on HD 209458b (a 3-
for HD 75 289), by Rowe et al. (2008) on HD 209458b (a 3-![]() upper limit of 0.17). Finally, CoRoT-1b was found to be such that
upper limit of 0.17). Finally, CoRoT-1b was found to be such that
![]() using CoRoT's red channel of the light curve (Snellen et al. 2009), and independently by Alonso et al. (2009b) using the white channel.
using CoRoT's red channel of the light curve (Snellen et al. 2009), and independently by Alonso et al. (2009b) using the white channel.
To distinguish among the different components of the observed planetary flux, we would need chromatic information. The CoRoT data are delivered in three band-passes, but we could not reach the level of precision needed to detect the secondary in these data. We attribute this to the difficulty of achieving a good correction of the jitter in the satellite's pointing.
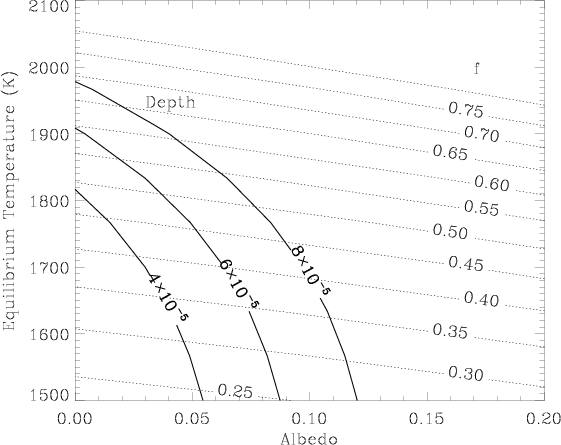 |
Figure 6: The equilibrium temperature of CoRoT-2b as a function of the albedo matching the observed secondary eclipse depth. The zero-albedo equilibrium temperature is about 1910 K. The dotted lines plot the re-distribution factors f. Realistic re-distribution factors require the contribution of some reflected light (non-zero albedo) or the presence of an additional source of energy in the planet (assumed zero in this plot). |
| Open with DEXTER | |
As a concluding remark, the depth of the secondary eclipse of CoRoT-2b is roughly the same as a transit of a 1
![]() in front of a solar radius star. The significance of the detection of the secondary eclipse thus emphasizes the excellent capabilities of the CoRoT mission at detecting planets with radii of only a few
in front of a solar radius star. The significance of the detection of the secondary eclipse thus emphasizes the excellent capabilities of the CoRoT mission at detecting planets with radii of only a few
![]() .
.
Acknowledgements
R.A acknowledges support by the grant CNES-COROT-070879. A.H. acknowledges the support of DLR grant 50OW0204
References
- Alonso, R., Auvergne, M., Baglin, A., et al. 2008, A&A, 482, L21 [NASA ADS] [CrossRef] [EDP Sciences] (In the text)
- Alonso, R., Aigrain, S., Pont, F., Mazeh, T., & The CoRoT Exoplanet Science Team 2009a, IAU Symp., 253, 91 [NASA ADS] (In the text)
- Alonso, R., et al. 2009b, A&A, submitted (In the text)
- Auvergne, M., et al. 2009, A&A, accepted [arXiv:0901.2206v1] (In the text)
- Baglin, A., Auvergne, M., Boisnard, L., et al. 2006, 36th COSPAR Scientific Assembly, 36, 3749 (In the text)
- Bouchy, F., Queloz, D., Deleuil, M., et al. 2008, A&A, 482, L25 [NASA ADS] [CrossRef] [EDP Sciences] (In the text)
- Burrows, A., Hubeny, I., Budaj, J., Knutson, H. A., & Charbonneau, D. 2007, ApJ, 668, L171 [NASA ADS] [CrossRef]
- Charbonneau, D., Noyes, R. W., Korzennik, S. G., et al. 1999, ApJ, 522, L145 [NASA ADS] [CrossRef]
- Charbonneau, D., Allen, L. E., Megeath, S. T., et al. 2005, ApJ, 626, 523 [NASA ADS] [CrossRef]
- Deming, D., Seager, S., Richardson, L. J., & Harrington, J. 2005, Nature, 434, 740 [NASA ADS] [CrossRef]
- Fortney, J. J., Lodders, K., Marley, M. S., & Freedman, R. S. 2008, ApJ, 678, 1419 [NASA ADS] [CrossRef] (In the text)
- Hood, B., Wood, K., Seager, S., & Collier Cameron, A. 2008, MNRAS, 389, 257 [NASA ADS] [CrossRef]
- Jackson, B., Barnes, R., & Greenberg, R. 2009, ApJ, in press (In the text)
- Karkoschka, E. 1994, Icarus, 111, 174 [NASA ADS] [CrossRef] (In the text)
- Knutson, H. A., Charbonneau, D., Allen, L. E., et al. 2007, Nature, 447, 183 [NASA ADS] [CrossRef] (In the text)
- Knutson, H. A., Charbonneau, D., Allen, L. E., Burrows, A., & Megeath, S. T. 2008, ApJ, 673, 526 [NASA ADS] [CrossRef]
- Knutson, H. A., Charbonneau, D., Burrows, A., O'Donovan, F. T., & Mandushev, G. 2009, ApJ, 691, 866 [NASA ADS] [CrossRef]
- Lanza, A. F., Pagano, I., Leto, G., et al. 2009, A&A, 493, 193 [NASA ADS] [CrossRef] [EDP Sciences] (In the text)
- Leigh, C., Cameron, A. C., Horne, K., Penny, A., & James, D. 2003a, MNRAS, 344, 1271 [NASA ADS] [CrossRef]
- Leigh, C., Collier Cameron, A., Udry, S., et al. 2003b, MNRAS, 346, L16 [NASA ADS] [CrossRef]
- Lenz, P., & Breger, M. 2005, Commun. Asteroseismol., 146, 53 [NASA ADS] [CrossRef] (In the text)
- Marley, M. S., Gelino, C., Stephens, D., et al. 1999, ApJ, 513, 879 [NASA ADS] [CrossRef]
- Pickles, A. J. 1998, PASP, 110, 863 [NASA ADS] [CrossRef] (In the text)
- Pont, F. 2009, MNRAS, in press (In the text)
- Rowe, J. F., Matthews, J. M., Seager, S., et al. 2008, ApJ, 689, 1345 [NASA ADS] [CrossRef] (In the text)
- Seager, S., Whitney, B. A., & Sasselov, D. D. 2000, ApJ, 540, 504 [NASA ADS] [CrossRef]
- Snellen, I. A. G., de Mooij, E. J. W., & Albrecht, S. 2009, Nature, 459, 543 [NASA ADS] [CrossRef] (In the text)
- Sudarsky, D., Burrows, A., & Pinto, P. 2000, ApJ, 538, 885 [NASA ADS] [CrossRef]
- Valio, A., et al. 2009, A&A, submitted (In the text)
Footnotes
- ... CoRoT-2b
- Based on observations obtained with CoRoT, a space project operated by the French Space Agency, CNES, with participation of the Science Program of ESA, ESTEC/RSSD, Austria, Belgium, Brazil, Germany, and Spain.
- ... equilibrium
-
![$T_{\rm eq}=T_\star(R_\star/a)^{1/2}[f(1-A)]^{1/4} $](/articles/aa/full_html/2009/27/aa12505-09/img43.png) .
.
All Figures
| |
Figure 1: Light curve of CoRoT-2 where the modeled transits have been subtracted. For display purposes, the data have been binned in 30 min bins. |
| Open with DEXTER | |
| In the text | |
| |
Figure 2: The amplitude spectra of the CoRoT-2 light curve, before ( top) and after ( bottom) pre-whitening of the 123 frequencies needed to model the low frequency content of the signal. To avoid including gaps in the data, the transits were previously corrected by the best-fit model of Alonso et al. (2009a). The inset shows a zoom around the planet's orbital frequencies. The vertical solid and dashed green lines mark the planet's period and twice that value, respectively. |
| Open with DEXTER | |
| In the text | |
| |
Figure 3:
Depth of a trapezoid with the shape and duration of a
transit, as a function of the planet's orbital phase. The maximum is
centered on phase 0.5, corresponding to the secondary eclipse. In
gray, the result in a light curve where a secondary eclipse of
|
| Open with DEXTER | |
| In the text | |
| |
Figure 4:
Phase-folded curve of CoRoT-2b during the phases of
secondary eclipse. The data have been binned in 0.01 in phase
( |
| Open with DEXTER | |
| In the text | |
| |
Figure 5:
The |
| Open with DEXTER | |
| In the text | |
| |
Figure 6: The equilibrium temperature of CoRoT-2b as a function of the albedo matching the observed secondary eclipse depth. The zero-albedo equilibrium temperature is about 1910 K. The dotted lines plot the re-distribution factors f. Realistic re-distribution factors require the contribution of some reflected light (non-zero albedo) or the presence of an additional source of energy in the planet (assumed zero in this plot). |
| Open with DEXTER | |
| In the text | |
Copyright ESO 2009
Current usage metrics show cumulative count of Article Views (full-text article views including HTML views, PDF and ePub downloads, according to the available data) and Abstracts Views on Vision4Press platform.
Data correspond to usage on the plateform after 2015. The current usage metrics is available 48-96 hours after online publication and is updated daily on week days.
Initial download of the metrics may take a while.