| Issue |
A&A
Volume 501, Number 3, July III 2009
|
|
|---|---|---|
| Page(s) | 1123 - 1130 | |
| Section | The Sun | |
| DOI | https://doi.org/10.1051/0004-6361/200911877 | |
| Published online | 19 May 2009 | |
Numerical simulations of homologous coronal mass ejections in the solar wind
A. Soenen1,2 - F. P. Zuccarello1,2 - C. Jacobs1,2 - S. Poedts1,2 - R. Keppens1,2,3 - B. van der Holst4
1 - Centre for Plasma-Astrophysics, K. U. Leuven,
Celestijnenlaan 200B, 3001 Leuven, Belgium
2 -
Leuven Mathematical Modeling & Computational Science Research Center (LMCC), Belgium
3 -
Astronomical Institute, Utrecht University, PO Box 80000,
3508 TA Utrecht, The Netherlands
4 -
Space Physics Research Laboratory, University of Michigan,
MI 48109, USA
Received 19 February 2009 / Accepted 7 May 2009
Abstract
Context. Coronal mass ejections (CMEs) are enormous expulsions of magnetic flux and plasma from the solar corona. Most scientists agree that a coronal mass ejection is the sudden release of magnetic free energy stored in a strongly stressed field. However, the exact reason for this sudden release is still highly debated.
Aims. In an initial multiflux system in steady state equilibrium, containing a pre-eruptive region consisting of three arcades with alternating magnetic flux polarity, we study the initiation and early evolution properties of a sequence of CMEs by shearing a region slightly larger than the central arcade.
Methods. We solve the ideal magnetohydrodynamics (MHD) equations in an axisymmetrical domain from the solar surface up to 30 ![]() .
The ideal MHD equations are advanced in time over a non uniform grid using a modified version of the Versatile Advection Code (VAC).
.
The ideal MHD equations are advanced in time over a non uniform grid using a modified version of the Versatile Advection Code (VAC).
Results. By applying shearing motions on the solar surface, the magnetic field is energised and multiple eruptions are obtained. Magnetic reconnection first opens the overlying field and two new reconnections sites set in on either side of the central arcade. After the disconnection of the large helmet top, the system starts to restore itself but cannot return to its original configuration as a new arcade has already started to erupt. This process then repeats itself as we continue shearing.
Conclusions. The simulations reported in the present paper, demonstrate the ability to obtain a sequence of CMEs by shearing a large region of the central arcade or by shearing a region that is only slightly larger than the central arcade. We show, be it in an axisymmetric configuration, that the breakout model can not only lead to confined eruptions but also to actual coronal mass ejections provided the model includes a realistic solar wind model.
Key words: Sun: coronal mass ejections (CMEs) - Sun: solar wind - magnetohydrodynamics (MHD)
1 Introduction
Coronal mass ejections (CMEs) are the most violent manifestations in the solar system involving enormous amounts of energy that can easily exceed 1032 erg. These events can eject large amounts of mass ( 1013-1016g) at interplanetary velocities that on average range from 350-500 km s-1, while so-called fast CMEs can even reach velocities well in excess of 2000 km s-1. There are a few excellent papers in the literature that review the different CME initiation theories and models (i.e. Roussev & Sokolov 2006; Mikic & Lee 2006; Forbes et al. 2006; Klimchuk 2001)
In the so called flux cancellation models, e.g. Amari et al. (2003); van Ballegooijen & Martens (1989), the magnetic field is first energised by shearing motions followed by converging motions towards the polarity inversion line. The flux cancellation process causes magnetic reconnection to occur between the opposite polarity feet of the sheared magnetic arcade leading to the formation of a flux rope. Amari et al. (2000) investigated, in a simple bipolar topology, the role of flux cancellation in the destabilization of a flux rope formed by shearing/twisting motions and later studied it in a complex multiflux configuration (Amari et al. 2007). An alternative model is the breakout scenario (Antiochos et al. 1999; MacNeice et al. 2005), where the vulnerability of multipolar topologies to rearrangements of the magnetic field's connectivity is exploited to enable the eruption. Here, the reconnection site is located above the sheared arcade which reconnects with the overlying field to create a passage for the CME. Recently, Archontis et al. (2007) demonstrated that during a multiple flux emergence event from just below the photosphere up to a non magnetised lower corona, a configuration typical of the breakout model can be reached as a result of a diffusive relaxation phase. All these models use boundary motions on the Sun's surface to stress the field until a loss of equilibrium causes the eruption. Another model is the flux injection, or flux emergence model as described by Chen & Shibata (2000). In this model a pre-existing flux rope is made unstable by the emergence of new magnetic flux of opposite polarity in the pre-existing coronal loops. This causes a decrease in magnetic pressure and leads to the formation of a current sheet. It is important to know that all three models exhibit a similar evolution once the eruption is underway.
Due to the high CME occurence rate during solar maximum (6 per day on average) and the wide range of observed speeds, one can expect frequent interaction between CMEs (Sheeley et al. 1997). The interaction of CMEs near the Sun is sometimes observed by the LASCO coronagraphs. Gopalswamy et al. (2001) described it as CME cannibalism, where a faster ejection swallows a preceding, slower one. The interaction of multiple coronal mass ejections is thought to be an important cause of geo-effective storms and large solar energetic particle events. More observational evidence is provided by Zhang & Wang (2002), who identified five homologous CMEs associated with five homologous X-class flares during the 2000 November 24-26 event. They suggest that these repeated flare-CME activities are triggered by the continuous emergence of moving magnetic features (MMFs). Burlaga et al. (2002) however, provided three sets of ``successive'' halo CMEs during the ascending phase of solar cycle 23. They looked at the same event as Zhang & Wang (2002) and suggest that as many as 10 successive CMEs were observed during this three day period. Manchester (2003) first demonstrated by means of numerical simulations that homologous CME-like eruptions in magnetic arcades could be obtained as a consequence of shear flows driven by the Lorentz force. Lugaz et al. (2006) on the other hand, present simulation results of two and more CMEs interacting in the inner heliosphere and discuss the observational evidence of the interaction of multiple CMEs. DeVore & Antiochos (2008) reported homologous confined filament eruptions via magnetic breakout from a bipolar active region embedded in the Sun's global background field. The rising flux in their simulations is unable to fully escape the Sun but instead comes to rest as a large, transequatorial loop in the high corona. These simulations however showed homology and reformation to be consequences of magnetic breakout.
Eruptive solar events, like flares and CMEs, are often associated with stressed magnetic fields. This stress may already be present in the active region fields or can be induced by photospheric motions. Linker & Mikic (1995); Jacobs et al. (2006) for example, showed how the shearing of a helmet streamer can initiate CMEs. Observational evidence also suggests that shearing motions along the neutral line seem to play an important role in eruptive events. Yang et al. (2004) reported shear flows prior to an X10 flare while Bemporad et al. (2005) observed a filament eruption preceded by horizontal motions around both filament footpoints. Manchester & Low (2000) put forth a theory explaining that shear flows at polarity inversion lines are driven by the Lorentz Force. We present here a series of simulations showing the ease with which a sequence of CMEs can be obtained. This work is based on the results obtained by van der Holst et al. (2007), where the authors obtained a double flux rope structure by applying photospheric shearing motions at the solar surface. Reconnection on the flanks of the erupting central arcade disconnects the overlying helmet streamer that is closely followed by a second flux rope related to the breakout plasmoid. By extending the shear region we affect the morphology of the CME evolution.
A detailed description of the model, the numerical methods and the boundary conditions is given in Sect. 2. The morphological evolution of the sequence of eruptions and the evolution of the current density are described in the first two subsections of Sect. 3. Section 3 is concluded with the discussion of the evolution of the various energy contributions. In Sect. 4 we discuss the relevance of the reconnection behind the flux rope and the crucial role that the side arcades play in these simulations. Finally, we will focus on the fact that the homologous CMEs obtained are not confined eruptions.
2 Description of the numerical model
The solar corona, the initial arcades and the wind are modeled in the framework of ideal magnetohydrodynamics (MHD). The MHD equations are solved numerically in spherical geometry and assuming axisymmetry (2.5D). The grid contains
![]() cells for (r,
cells for (r, ![]() )
)
![]() [1
[1 ![]() ,
30
,
30 ![]() ]
]
![]() [0,
[0, ![]() ]. A logarithmic grid stretching is used where in the radial direction there is a last to first grid cell ratio of 135 and the ratio for the equator to polar cell size is 0.3. The radial resolution at the solar surface is 1.5 Mm, while the angular resolution at the equator is 5.5 Mm. All the simulations discussed in this paper are performed with a modified version of the Versatile Advection Code (VAC) (Tóth 1996). The robust total variation diminishing Lax Friedrichs scheme is used with a diffusive but stable minmod slope limiter for second-order reconstructions. The magnetic field is kept divergence-free by using an approach similar to Balsara & Spicer (1999) but instead of storing the magnetic field components Br and
]. A logarithmic grid stretching is used where in the radial direction there is a last to first grid cell ratio of 135 and the ratio for the equator to polar cell size is 0.3. The radial resolution at the solar surface is 1.5 Mm, while the angular resolution at the equator is 5.5 Mm. All the simulations discussed in this paper are performed with a modified version of the Versatile Advection Code (VAC) (Tóth 1996). The robust total variation diminishing Lax Friedrichs scheme is used with a diffusive but stable minmod slope limiter for second-order reconstructions. The magnetic field is kept divergence-free by using an approach similar to Balsara & Spicer (1999) but instead of storing the magnetic field components Br and ![]() on a staggered mesh, we use the vector potential component
on a staggered mesh, we use the vector potential component ![]() in the nodes.
in the nodes.
The MHD equations are solved in a frame corotating with the sun where one solar rotation corresponds to a Carrington rotation of approximately 25 days 9 h and 7 mins, resulting in the inclusion of the centrifugal and Coriolis force. The other source terms in our model are the gravitational force, with an escape velocity of
![]() cm s-1, and an additional heating/cooling term that mimics the effect of heat conduction and energy dissipation above the transition region to reproduce a realistic solar wind. For the latter, we use a functional form of the extra heating/cooling term closely resembling that of Groth et al. (2000) and later described in more detail by Manchester et al. (2004), namely
cm s-1, and an additional heating/cooling term that mimics the effect of heat conduction and energy dissipation above the transition region to reproduce a realistic solar wind. For the latter, we use a functional form of the extra heating/cooling term closely resembling that of Groth et al. (2000) and later described in more detail by Manchester et al. (2004), namely
![\begin{displaymath}
Q = \rho q_0(T_0 - T)\exp\left [ \frac{-(r-R_\odot)^2}{\sigma_0^2}\right ],
\end{displaymath}](/articles/aa/full_html/2009/27/aa11877-09/img15.png)
where q0 = 106 erg g-1 s-1 K-1 is the volumetric heating amplitude and
![\begin{figure}
\par\includegraphics[height=.3\textheight]{1877f1.eps}
\end{figure}](/articles/aa/full_html/2009/27/aa11877-09/img27.png) |
Figure 1: The steady-state solution of the system clearly showing the three arcades formed inside the helmet streamer due to the addition of the extra flux in the equatorial region. |
| Open with DEXTER | |
The initial condition is the converged hydrodynamic solar wind solution of Parker (1958) combined with a dipole field of field strength 2.2 G at the poles. An extra vector potential,
![]() ,
is added to obtain the triple arcade system in an equatorial streamer belt. We set at t = 0:
,
is added to obtain the triple arcade system in an equatorial streamer belt. We set at t = 0:
where
![\begin{figure}
\par\includegraphics[height=.3\textheight]{1877f2.eps}
\end{figure}](/articles/aa/full_html/2009/27/aa11877-09/img35.png) |
Figure 2:
The shear velocity as a function of latitude,
|
| Open with DEXTER | |
3 Results
We drive the system by imposing an additional azimuthal velocity on the inner boundary. The velocity profile is given by
![\begin{displaymath}
v_{\varphi} = v_0(\lambda^2 - \Delta \Theta^2)^2 \sin \lambda \sin[\pi(\textit{t} - t_0)/\Delta \textit{t}],
\end{displaymath}](/articles/aa/full_html/2009/27/aa11877-09/img36.png)
if the latitude,
3.1 Time evolution
Figure 3 shows the system's evolution over time of the relative density in response to the applied shearing motions. The colour code indicates the relative density, i.e.
![]() ,
while the white lines represent the magnetic field lines.
,
while the white lines represent the magnetic field lines.
![\begin{figure}
\par\includegraphics[width=17cm]{1877f3.eps}
\end{figure}](/articles/aa/full_html/2009/27/aa11877-09/img41.png) |
Figure 3:
Snapshots showing the relative mass density and magnetic field lines at different times for our simulation with a shear region of
|
| Open with DEXTER | |
![\begin{figure}
\par\includegraphics[width=17cm]{1877f4.eps}
\end{figure}](/articles/aa/full_html/2009/27/aa11877-09/img42.png) |
Figure 4:
Snapshots showing the relative mass density and magnetic field lines at different times for our simulation with a shear region of
|
| Open with DEXTER | |
Finally, at t = 27h2min we can see the different eruptions. At the edge of our computational domain we have the first two flux ropes, who have merged at this point, followed by the third flux rope. Closer to the Sun we can also see that a second eruption has occured producing two more flux ropes similar to those produced by the initial eruption. The density (with respect to the original solar wind density in that region) is lower for the second eruption. Its structure is similar to the initial one because the central arcade and part of the overlying field were able to recover to their original topology before the central arcade started to rise again. At this point we would like to stress that the actual CME is the ejection of the helmet streamer, as is the case in van der Holst et al. (2007), and not the expanding central arcade. This point in our simulation coincides with the latter stages of van der Holst et al. (2007) around time 23 h, i.e. when the system relaxes to its quadrupolar configuration with overlying field.
The previous results were for a shear region of 0.175 radians either side of the equatorial plane. The evolution will be different if we increase the shear region to 0.20 radians. The topological and dynamical evolution of the system is greatly affected as is evident from Fig. 4.
The system evolves faster for this larger shear region since we inject even more energy, as can be seen in Fig. 4 (first panel). We can see that the detachment of the top of the helmet streamer and breakout plasmoid now occurs at t = 11 h. The second flux rope has a more complex topology in the early phase of the evolution. In fact, it carries within it two flux ropes having the same counter-clockwise magnetic field. These flux ropes are detachments of the expanding central arcade. We believe that at this point the side arcades will play a role in the flare reconnection during the detachment phase. The actual CME again consists of the ejected top of the helmet streamer showing a significant increase in relative density.
With the top of the helmet streamer ejected after this initial eruption, the following eruptions will have a different structure. A snapshot of the system after 13h31min is shown in Fig. 4 (second panel). Since we use the same field line density in all snapshots presented in this paper, fewer field lines means a weaker magnetic field that has to be removed for further eruptions. By shearing over a region larger than the central arcade, we are also influencing the side arcades, which as a result, will expand slightly outwards as well. In the meantime however, the central arcade also expands outward so that the picture of the system is as follows:
1) there is a weak overlying field; 2) two expanding side arcades that envelope and protect; 3) the expanding central arcade.
This process is repeated two more times as shown in Fig. 4 (third panel). Here we can see the end of the ejected helmet streamer leaving the numerical domain, followed by the first flux rope, whose internal flux ropes have merged at this point. Next are four breakout CMEs enclosed in a weak overlying field created by the reconnection between the side arcades. The reason why we call these breakout CMEs will be explained below. At the leading edge of these breakout CMEs, symmetric with respect to the equator, two more flux ropes can be seen consisting of the ejected tops of the side arcades. The final CME in this simulation takes off at
![]() h after which the system starts to recover.
In other words, after four-fifths of the total shear time, the final flux rope is completely detached from the Sun. In van der Holst et al. (2007), the flux rope is completely detached from the Sun after
h after which the system starts to recover.
In other words, after four-fifths of the total shear time, the final flux rope is completely detached from the Sun. In van der Holst et al. (2007), the flux rope is completely detached from the Sun after ![]() 23 h, i.e. also four-fifths of the total shear time. While the initial eruption and the reformation of the field after the final eruption are the same, the evolution in between is completely different. These differences start occurring around the maximum of our shear profile, when the effect of increasing our shear region starts to affect the side arcades.
23 h, i.e. also four-fifths of the total shear time. While the initial eruption and the reformation of the field after the final eruption are the same, the evolution in between is completely different. These differences start occurring around the maximum of our shear profile, when the effect of increasing our shear region starts to affect the side arcades.
3.2 Current density
By shearing a region equal in size or larger than the photospheric footpoints of the central arcade we also shear the outer field lines of the central arcade. In spite of the fact that we shear the outer field lines only very slightly, as a result, the angle between the helmet streamer field lines and the outer field lines of the central arcade, initially 180![]() ,
decreases, in turn decreasing the effectiveness of the reconnection taking place. In our analysis, we use the azimuthal component of current density as an indicator of where the reconnection takes place and its intensity (Fig. 5).
,
decreases, in turn decreasing the effectiveness of the reconnection taking place. In our analysis, we use the azimuthal component of current density as an indicator of where the reconnection takes place and its intensity (Fig. 5).
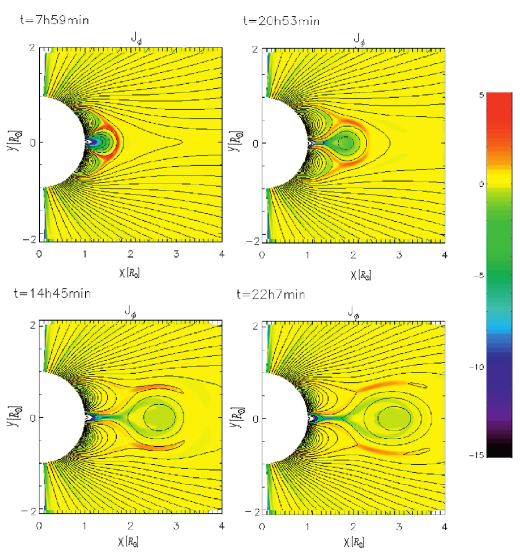 |
Figure 5:
Snapshots showing the current density and magnetic field lines at different times in our simulations. The top left panel shows the reconnection sites in front of the first eruption at time t = 7h59min. The top right panel shows the reconnection sites for the second eruption at t = 20h53min. Both these snapshots are for the simulation with a shear region of
|
| Open with DEXTER | |
As a consequence of the unbalance between the upward magnetic pressure and downward magnetic tension, the X-point is flattened. Reconnection eventually sets in, removing the overlying field and decreasing the downward magnetic tension in a runaway process allowing the central arcade to expand outwards. Figure 5 (top left) shows the moment at which the reconnection between the expanding arcade and the opposite oriented overlying field sets in, for a shear region of 0.175 radians. The effect of shearing the footpoints and the consequential pinching of the magnetic field lines, produces a strong current density inside the expanding arcade, which is usually referred to in literature as flare reconnection. At a certain moment the breakout reconnection stops and two new reconnection sites are formed at the sides of the expanding central arcade ultimately disconnecting the top of the overlying helmet streamer from the Sun. So far, there is no morphological difference with the results presented in van der Holst et al. (2007). Since most of the overlying field has been removed in the previous eruption, the main reconnection sites during the second eruption lie on the flanks of the expanding central arcade (Fig. 5 (top right)).
For the larger shear region, viz. 0.20 radians, the evolution of the first eruption is the same. Figure 5 (bottom left) shows the configuration of the system after ![]() 14 h. As a consequence of the larger shearing region, the magnetic pressure in the side arcades also increases, causing them to expand. Meanwhile, the previous eruption has already removed most of the overlying field facilitating the next expansion of the central arcade. In this figure, three principal reconnection sites can be observed. Two are located at the top of each side arcade, while the other is the flare reconnection at the base of the central arcade. The reconnection in the top of the side arcades results in the formation of two flux ropes that precede each of the four breakout CMEs. Reconnection within these side arcade tops eventually detaches the upper part of the side arcades and reconnection between the central flux rope, or the CME, and the overlying field sets in. The next CME evolves in a similar manner except that the shear profile is now at its peak, causing the side arcades to almost merge before the central arcade is able to expand. The third breakout CME, similar to the first one, and the detached tops of the side arcades are shown in Fig. 5 (bottom right). After the final eruption the system recovers to its initial equilibrium.
14 h. As a consequence of the larger shearing region, the magnetic pressure in the side arcades also increases, causing them to expand. Meanwhile, the previous eruption has already removed most of the overlying field facilitating the next expansion of the central arcade. In this figure, three principal reconnection sites can be observed. Two are located at the top of each side arcade, while the other is the flare reconnection at the base of the central arcade. The reconnection in the top of the side arcades results in the formation of two flux ropes that precede each of the four breakout CMEs. Reconnection within these side arcade tops eventually detaches the upper part of the side arcades and reconnection between the central flux rope, or the CME, and the overlying field sets in. The next CME evolves in a similar manner except that the shear profile is now at its peak, causing the side arcades to almost merge before the central arcade is able to expand. The third breakout CME, similar to the first one, and the detached tops of the side arcades are shown in Fig. 5 (bottom right). After the final eruption the system recovers to its initial equilibrium.
3.3 Energetics
The time evolution of the magnetic free energy, the total magnetic energy, the kinetic energy and the internal energy (with respect to the wind value) are plotted in Figs. 6 and 7, for the shearing region
![]() radians and
radians and
![]() radians, respectively.
radians, respectively.
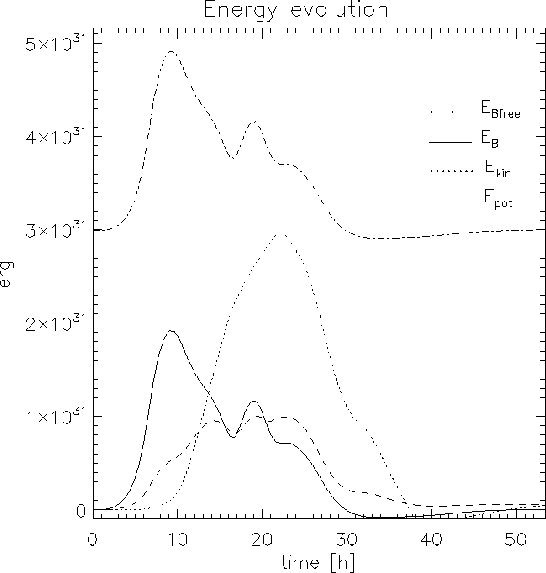 |
Figure 6:
The evolution of the various energy terms with respect to the initial energy in the system (viz. magnetic free energy, magnetic energy, kinetic energy and internal energy) for a shear region of
|
| Open with DEXTER | |
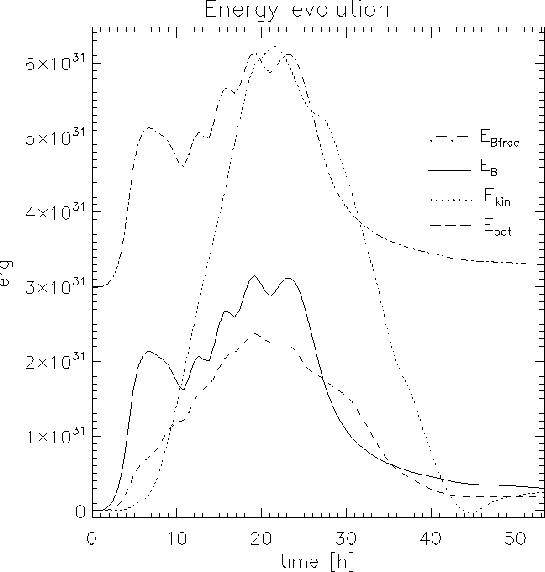 |
Figure 7:
The evolution of the various energy terms with respect to the initial energy in the system (viz. magnetic free energy, magnetic energy, kinetic energy and internal energy) for a shear region of
|
| Open with DEXTER | |
For
![]() radians
radians
![]() erg is added to the system within the first 9 h. At this point the energy available in the system suffices to drive an eruption and convert magnetic free energy into kinetic energy. This kinetic energy increases until 23 h. While the magnetic free energy is decreasing due to this conversion mechanism, we are still shearing the foot points and in effect continuing to pump free magnetic energy at the boundary. The balance between these two effects results in the local minimum of free magnetic energy after about 17 h. After this point in the simulation, the free energy starts to increase again because the amount of energy we are pumping in the system is higher than the amount of free magnetic energy released. After 19 h a new maximum in magnetic free energy is seen, followed by a decrease that drives the second eruption. Between 22 h and 25 h, another balance between the energy pumped in the system due to the shearing motions and the energy released results in a plateau. Finally, the remaining magnetic free energy is released in the system.
However, the two different eruptions cannot be observed in the kinetic energy profile because the energies are integrated over the entire domain. The contribution to the total kinetic energy to the system from the first, denser eruption dominates. The decrease of kinetic energy after its maximum correspond to the first eruption leaving our numerical domain. A careful inspection of the various energy terms shows that the magnetic and internal energy pumped in the system balance the variation of the kinetic energy during the simulation.
erg is added to the system within the first 9 h. At this point the energy available in the system suffices to drive an eruption and convert magnetic free energy into kinetic energy. This kinetic energy increases until 23 h. While the magnetic free energy is decreasing due to this conversion mechanism, we are still shearing the foot points and in effect continuing to pump free magnetic energy at the boundary. The balance between these two effects results in the local minimum of free magnetic energy after about 17 h. After this point in the simulation, the free energy starts to increase again because the amount of energy we are pumping in the system is higher than the amount of free magnetic energy released. After 19 h a new maximum in magnetic free energy is seen, followed by a decrease that drives the second eruption. Between 22 h and 25 h, another balance between the energy pumped in the system due to the shearing motions and the energy released results in a plateau. Finally, the remaining magnetic free energy is released in the system.
However, the two different eruptions cannot be observed in the kinetic energy profile because the energies are integrated over the entire domain. The contribution to the total kinetic energy to the system from the first, denser eruption dominates. The decrease of kinetic energy after its maximum correspond to the first eruption leaving our numerical domain. A careful inspection of the various energy terms shows that the magnetic and internal energy pumped in the system balance the variation of the kinetic energy during the simulation.
The general behaviour of the energies is the same for the shear region of 0.20 radians. Most of the energy is stored in the magnetic energy during the initial shearing phase. When the helmet streamer is detached from the Sun, the first maximum in the free energy and the consequent increase in kinetic energy is observed. The following four peaks in the magnetic free energy corresponds to the ejection of the four breakout CMEs. After the final eruption, the system relaxes to its initial equilibrium.
4 Discussion and conclusions
In this paper, we have demonstrated the ability to obtain a sequence of CMEs from a breakout configuration. By shearing over a region larger than the central arcade, the side arcades will be affected in such a manner that they will play a role in the CME evolution.
This effect can be seen by looking at the distribution of the azimuthal component of the magnetic field over the various flux systems.
Figure 8 shows, in colour scale, the intensity of the azimuthal component of the magnetic field for the shearing regions with
![]() ,
0.175, and 0.20.
,
0.175, and 0.20.
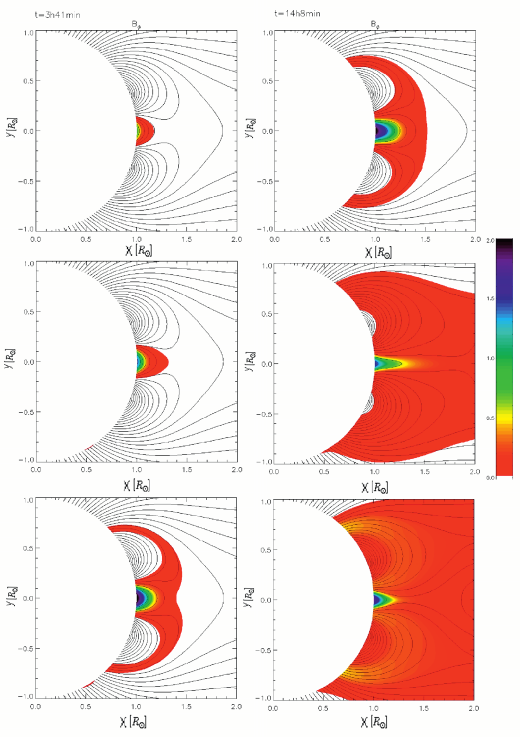 |
Figure 8:
The intensity of the azimuthal component of the magnetic field is shown for three different cases. The top two panels show the distribution at t = 3h41min and at t = 14h8min for a shear region of
|
| Open with DEXTER | |
We showed that the sequence of eruptions we obtained are real CMEs in the sence that an increase in relative density is observed at the core of each eruption. Obviously, the first eruption has a higher relative density with respect to the subsequent eruptions. The first eruption occurs in a stationary wind configuration and consists of the removal of the helmet streamer carrying within it a large amount of plasma. The ensuing eruptions occur in an already perturbed medium with a lower plasma density. Despite this, we still observe an increase in the density
of 80![]() as opposed to 110
as opposed to 110![]() in the initial eruption at 4
in the initial eruption at 4 ![]() .
While the CMEs propagate towards the boundary of our numerical domain the relative density decreases. However, as these eruptions leave the numerical domain they still show a higher relative density with respect to the solar wind. Therefore, the homologous CMEs we obtain are not confined within 30
.
While the CMEs propagate towards the boundary of our numerical domain the relative density decreases. However, as these eruptions leave the numerical domain they still show a higher relative density with respect to the solar wind. Therefore, the homologous CMEs we obtain are not confined within 30 ![]() .
All of the CMEs obtained in our simulations are slow. The CME velocities for the simulation with a shear region of 0.20 radians are shown in Fig. 9.
.
All of the CMEs obtained in our simulations are slow. The CME velocities for the simulation with a shear region of 0.20 radians are shown in Fig. 9.
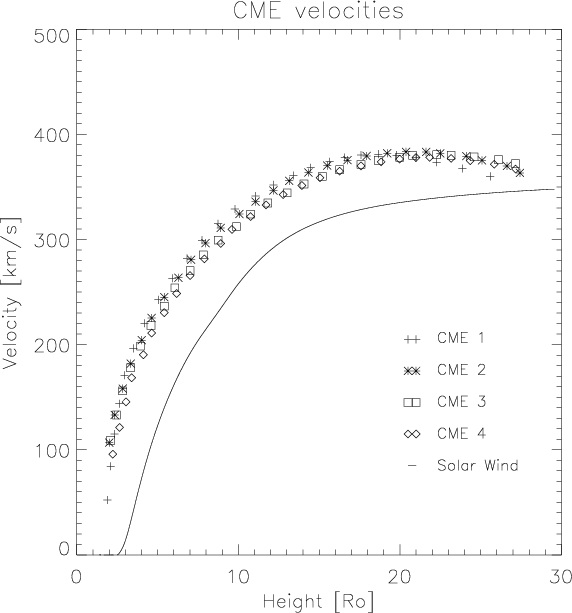 |
Figure 9: The velocities of the first four CMEs in the simulation with a shear region of 0.20 radians are shown. The first CME is accelerated towards 380 km s-1 and then decelerates towards the speed of our solar wind as it moves towards the edge of our numerical domain. The following CMEs are accelerated slightly slower, reach a similar maximum velocity, and then finally decelerate towards the solar wind velocity in that region. The solid curve represents the ambient solar wind speed in the equatorial plane. |
| Open with DEXTER | |
The three-dimensional simulations performed by DeVore & Antiochos (2008) demonstrated the homology of a coronal magnetic configuration via a sequence of self-consistently driven eruptions. They embedded a bipolar active region in the Sun's global background field and subjected it to twisting foot point displacements concentrated near its polarity inversion lines. Their shear profile simulates surface flows detected in active regions by introducing not only a
![]() but also
a
but also
a
![]() component. In our 2.5D simulations, our shear profile only introduces a
component. In our 2.5D simulations, our shear profile only introduces a
![]() component. Both systems however are made up out of a central arcade flanked by two side arcades superimposed on a background field. Their shear profile, as is the case in our simulations, is such that it extends beyond the central arcade and energizes both midlatitudinal arcades at the side. In fact, the reason why we get ejections and they only get confined eruptions is simple. The presence of a background solar wind and a coronal streamer in our simulations facilitates both the ejection and propagation of the flux rope while the absence of both makes it much more difficult to produce CMEs. The presence of a background solar wind model makes the simulations more realistic and again demonstrates the importance of its inclusion and the profound effect it has on the results. We hope to reproduce these results in 3D in the near future.
component. Both systems however are made up out of a central arcade flanked by two side arcades superimposed on a background field. Their shear profile, as is the case in our simulations, is such that it extends beyond the central arcade and energizes both midlatitudinal arcades at the side. In fact, the reason why we get ejections and they only get confined eruptions is simple. The presence of a background solar wind and a coronal streamer in our simulations facilitates both the ejection and propagation of the flux rope while the absence of both makes it much more difficult to produce CMEs. The presence of a background solar wind model makes the simulations more realistic and again demonstrates the importance of its inclusion and the profound effect it has on the results. We hope to reproduce these results in 3D in the near future.
In this paper we have shown, be it in an axisymmetric configuration, that the breakout model can not only lead to confined homologous eruptions but also to actual homologous coronal mass ejections with the inclusion of a realistic solar wind model. The size of the shear region and the total amount of magnetic free energy pumped in the system will determine the number of eruptions.
Acknowledgements
These results were obtained in the framework of the projects GOA/2009-009 (K.U.Leuven), G.0304.07 (FWO-Vlaanderen) and C 90205 (ESA Prodex 9). Financial support by the European Commission through the SOLAIRE Network (MTRN-CT-2006-035484) is gratefully acknowledged. The numerical results were obtained on the HPC cluster VIC of the K.U. Leuven.
References
- Amari, T., Luciani, J. F., Mikic, Z., & Linker, J. A. 2000, ApJ, 529, L49 [NASA ADS] [CrossRef] (In the text)
- Amari, T., Luciani, J. F., Aly, J. J., Mikic, Z., & Linker, J. A. 2003, ApJ, 585, 1073 [NASA ADS] [CrossRef]
- Amari, T., Aly, J. J., Mikic, Z., & Linker, J. 2007, ApJ, 671, L189 [NASA ADS] [CrossRef] (In the text)
- Antiochos, S., DeVore, C., & Klimchuk, J. 1999, ApJ, 510, 485 [NASA ADS] [CrossRef]
- Archontis, V., Hood, A. W., & Brady, C. 2007, A&A, 466, 367 [NASA ADS] [CrossRef] [EDP Sciences] (In the text)
- Balsara, D. S., & Spicer, D. S. 1999, J. Comp. Phys., 149, 270 [NASA ADS] [CrossRef] (In the text)
- Bemporad, A., Sterling, A. C., Moore, R. L., & Poletto, G. 2005, ApJ Lett., 635, L189 [NASA ADS] [CrossRef] (In the text)
- Burlaga, L. F., Plunkett, S. P., & St. Cyr, O. C. 2002, J. Geophys. Res. (Space Physics), 107, 1266 [NASA ADS] [CrossRef] (In the text)
- Chen, P., & Shibata, K. 2000, ApJ, 545, 524 [NASA ADS] [CrossRef] (In the text)
- DeVore, C. R., & Antiochos, S. K. 2008, ApJ, 680, 740 [NASA ADS] [CrossRef] (In the text)
- Forbes, T. G., Linker, J. A., Chen, J., et al. 2006, Space. Sc. Rev., 123, 251 [NASA ADS] [CrossRef]
- Gopalswamy, N., Yashiro, S., Kaiser, M. L., Howard, R. A., & Bougeret, J.-L. 2001, ApJ, 548, L91 [NASA ADS] [CrossRef] (In the text)
- Groth, C. P. T., De Zeeuw, D. L., Gombosi, T. I., & Powell, K. G. 2000, J. Geophys. Res, 105, 25053 [NASA ADS] [CrossRef] (In the text)
- Jacobs, C., Poedts, S., & van der Holst, B. 2006, A&A, 450, 793 [NASA ADS] [CrossRef] [EDP Sciences] (In the text)
- Klimchuk, J. A. 2001, in Space Weather, ed. P. Song, H. J. Singer, & G. L. Siscoe (AGU), Geophys. Monograph Series, 125, 143
- Linker, J., & Mikic, Z. 1995, ApJ, 438, L45 [NASA ADS] [CrossRef] (In the text)
- Lugaz, N., Manchester, W. B., Roussev, I. I., & Gombosi, T. I. 2006, AGU Fall Meeting Abstracts, A1461 (In the text)
- MacNeice, P., Antiochos, S. K., Phillips, A., et al. 2005, ApJ, 614, 1028 [NASA ADS] [CrossRef]
- Manchester, W. 2003, J. Geophys. Res. (Space Phys.), 108, 1162 [NASA ADS] [CrossRef] (In the text)
- Manchester, W., Gombosi, T., Roussev, I., et al. 2004, J. Geophys. Res, 109, A01102 [CrossRef] (In the text)
- Manchester, W. I., & Low, B. C. 2000, Phys. Plasmas, 7, 1263 [NASA ADS] [CrossRef] (In the text)
- Mikic, Z., & Lee, M. A. 2006, Space Sci. Rev., 123, 57 [NASA ADS] [CrossRef]
- Parker, E. N. 1958, ApJ, 128, 664 [NASA ADS] [CrossRef] (In the text)
- Roussev, I. I., & Sokolov, I. V. 2006, Solar Eruptions and Energetic Particles, ed. N. Gopalswamy, R. Mewaldt, & J. Torsti, Geophysical Monograph, 165, 89
- Sheeley, Jr., N. R., Wang, Y.-M., Hawley, S. H., et al. 1997, ApJ, 484, 472 [NASA ADS] [CrossRef] (In the text)
- Tóth, G. 1996, Astrophys. Lett. & Comm., 34, 245 (In the text)
- van Ballegooijen, A. A., & Martens, P. C. H. 1989, ApJ, 343, 971 [NASA ADS] [CrossRef]
- van der Holst, B., Jacobs, C., & Poedts, S. 2007, ApJ, 671, L77 [NASA ADS] [CrossRef] (In the text)
- Yang, G., Xu, Y., Cao, W., et al. 2004, ApJ, 617, L151 [NASA ADS] [CrossRef] (In the text)
- Zhang, J., & Wang, J. 2002, ApJ, 566, L117 [NASA ADS] [CrossRef] (In the text)
All Figures
| |
Figure 1: The steady-state solution of the system clearly showing the three arcades formed inside the helmet streamer due to the addition of the extra flux in the equatorial region. |
| Open with DEXTER | |
| In the text | |
| |
Figure 2:
The shear velocity as a function of latitude,
|
| Open with DEXTER | |
| In the text | |
| |
Figure 3:
Snapshots showing the relative mass density and magnetic field lines at different times for our simulation with a shear region of
|
| Open with DEXTER | |
| In the text | |
| |
Figure 4:
Snapshots showing the relative mass density and magnetic field lines at different times for our simulation with a shear region of
|
| Open with DEXTER | |
| In the text | |
| |
Figure 5:
Snapshots showing the current density and magnetic field lines at different times in our simulations. The top left panel shows the reconnection sites in front of the first eruption at time t = 7h59min. The top right panel shows the reconnection sites for the second eruption at t = 20h53min. Both these snapshots are for the simulation with a shear region of
|
| Open with DEXTER | |
| In the text | |
| |
Figure 6:
The evolution of the various energy terms with respect to the initial energy in the system (viz. magnetic free energy, magnetic energy, kinetic energy and internal energy) for a shear region of
|
| Open with DEXTER | |
| In the text | |
| |
Figure 7:
The evolution of the various energy terms with respect to the initial energy in the system (viz. magnetic free energy, magnetic energy, kinetic energy and internal energy) for a shear region of
|
| Open with DEXTER | |
| In the text | |
| |
Figure 8:
The intensity of the azimuthal component of the magnetic field is shown for three different cases. The top two panels show the distribution at t = 3h41min and at t = 14h8min for a shear region of
|
| Open with DEXTER | |
| In the text | |
| |
Figure 9: The velocities of the first four CMEs in the simulation with a shear region of 0.20 radians are shown. The first CME is accelerated towards 380 km s-1 and then decelerates towards the speed of our solar wind as it moves towards the edge of our numerical domain. The following CMEs are accelerated slightly slower, reach a similar maximum velocity, and then finally decelerate towards the solar wind velocity in that region. The solid curve represents the ambient solar wind speed in the equatorial plane. |
| Open with DEXTER | |
| In the text | |
Copyright ESO 2009
Current usage metrics show cumulative count of Article Views (full-text article views including HTML views, PDF and ePub downloads, according to the available data) and Abstracts Views on Vision4Press platform.
Data correspond to usage on the plateform after 2015. The current usage metrics is available 48-96 hours after online publication and is updated daily on week days.
Initial download of the metrics may take a while.