| Issue |
A&A
Volume 501, Number 1, July I 2009
|
|
|---|---|---|
| Page(s) | 221 - 237 | |
| Section | Interstellar and circumstellar matter | |
| DOI | https://doi.org/10.1051/0004-6361/200810960 | |
| Published online | 19 March 2009 | |
CO emission and variable CH and CH+ absorption
towards HD 34078: evidence for a nascent bow shock?![[*]](/icons/foot_motif.png)
P. Boissé1 - E. Rollinde2 - P. Hily-Blant3 - J. Pety4 - S. R. Federman5 - Y. Sheffer5 - G. Pineau des Forêts6 - E. Roueff7 - B.-G. Andersson8 - G. Hébrard2
1 - Institut d'Astrophysique de Paris (IAP), UMR7095 CNRS,
Université Pierre et Marie Curie-Paris6, 98 bis boulevard
Arago, 75014 Paris, France
2 -
Institut d'Astrophysique de Paris, UMR7095 CNRS,
Université Pierre et Marie Curie-Paris6, 98 bis boulevard Arago,
75014 Paris, France
3 -
IRAM, Domaine Universitaire, 300 rue de la Piscine, 38406
Saint-Martin-d'Hères; Laboratoire d'Astrophysique,
Observatoire de Grenoble, BP 53, 38041 Grenoble Cedex 9,
France
4 -
Institut de Radioastronomie Millimétrique, 300 rue de la
Piscine, 38406 Saint Martin d'Hères; Observatoire de Paris,
61 Av. de l'Observatoire, 75014 Paris, France
5 -
Department of Physics and Astronomy, University of Toledo, Toledo, OH 43606, USA
6 -
IAS, Université d'Orsay, 91405 Orsay Cedex, France
7 -
LUTH, Observatoire de Paris-Meudon, 92195 Meudon Cedex,
France
8 -
NASA Ames Research Center, Moffett Field, CA 94035, USA
Received 11 September 2008 / Accepted 24 January 2009
Abstract
Context. The runaway star HD 34078, initially selected to investigate small scale structure in a foreground diffuse cloud, has been shown to be surrounded by highly excited H2, the origin of which is unclear.
Aims. We first search for an association between the foreground cloud and HD 34078. Second, we extend previous investigations of temporal absorption line variations (CH, CH+, H2) in order to better characterize them and understand their relation to small-scale structure in the molecular gas.
Methods. We have mapped the
![]() emission at 12
emission at 12
![]() resolution around HD 34078's position, using the 30 m IRAM antenna. The follow-up of CH and CH+ absorption lines has been extended over 5 more years: 26 visible spectra have been acquired since 2003 at high or intermediate resolution. In parallel, CH absorption towards the reddened star
resolution around HD 34078's position, using the 30 m IRAM antenna. The follow-up of CH and CH+ absorption lines has been extended over 5 more years: 26 visible spectra have been acquired since 2003 at high or intermediate resolution. In parallel, CH absorption towards the reddened star
![]() has been monitored to check the instrumental stability and homogeneity of our measurements. Three more FUSE spectra have been obtained to search for N(H2) variations.
has been monitored to check the instrumental stability and homogeneity of our measurements. Three more FUSE spectra have been obtained to search for N(H2) variations.
Results. CO observations show a pronounced maximum near HD 34078's position, clearly indicating that the star and diffuse cloud are associated. The optical spectra confirm the reality of strong, rapid and correlated CH and CH+ fluctuations (up to 26% for N(CH+) between 2007 and 2008). On the other hand, N(H2, J=0) has varied by less than 5% over 4 years, indicating the absence of marked density structure at scales below 100 AU. We also discard N(CH) variations towards
![]() at scales less than 20 AU.
at scales less than 20 AU.
Conclusions. Observational constraints from this work and from 24 ![]() m dust emission appear to be consistent with H2 excitation but inconsistent with steady-state bow shock models and rather suggest that the shell of compressed gas surrounding HD 34078 or lying at the boundary of a small foreground clump is seen at an early stage of the interaction. The CH and CH+ time variations as well as their high abundances are likely due to chemical structure in the shocked gas layer located at the stellar wind/ambient cloud interface. Finally, the lack of variation in both N(H2, J=0) towards HD 34078 and N(CH) towards
m dust emission appear to be consistent with H2 excitation but inconsistent with steady-state bow shock models and rather suggest that the shell of compressed gas surrounding HD 34078 or lying at the boundary of a small foreground clump is seen at an early stage of the interaction. The CH and CH+ time variations as well as their high abundances are likely due to chemical structure in the shocked gas layer located at the stellar wind/ambient cloud interface. Finally, the lack of variation in both N(H2, J=0) towards HD 34078 and N(CH) towards
![]() suggests that quiescent molecular gas is not subject to pronounced small-scale structure.
suggests that quiescent molecular gas is not subject to pronounced small-scale structure.
Key words: ISM: molecules - stars: individual: HD 34078 - ISM: structure - ISM: individual objects: HD 34078
1 Introduction
During the past decade strong evidence has accumulated indicating that the spatial distribution of species like Na I and Ca II within neutral interstellar (IS) gas displays significant structure at AU scales (Welty et al. 2008; Crawford 2003; Welty 2007; Lauroesch 2007). H I itself, within the cold neutral medium at least, shows such structure (Deshpande 2007; Frail et al. 1994; Heiles 1997; Weisberg & Stanimirovic 2007). In diffuse molecular gas, similar conclusions have been reached for tracers like H2CO, HCO+, and OH (Liszt & Lucas 2000; Moore & Marscher 1995). Whether or not these spatial variations correspond to true density structure [i.e. to local fluctuations of n(H2)] is obviously of key importance for the modelling of physical and chemical processes within molecular gas.
Table 1:
Observation parameters. The projection center of all the data
is:
![]() ,
,
![]() .
.
To investigate this question, a time variation study
of H2, CH, and CH+ interstellar absorption lines towards the O9.5V
runaway star AE Aur, HD 34078 has been undertaken by
Rollinde et al. (2003, hereafter R03) and Boissé et al. (2005, hereafter B05).
This bright star
is significantly reddened [
E(B-V) = 0.53] and its optical spectrum
displays strong absorption lines from e.g. CH, CH+, CN
(Federman et al. 1994),
typical of diffuse molecular clouds. HD 34078 has a high proper motion
of ![]() = 43 mas yr-1, corresponding to a transverse velocity of
103 km s-1 or 22 AU yr-1 for a distance D=530 pc (this value will be
used in the following for consistency with B05; it
is
compatible with the trigonometric
parallax estimate of
446+220-111 pc). The line of sight is thus drifting
rapidly through the foreground gas; successive column density
measurements then provide a ``cut'' through the cloud revealing its spatial
density structure over scales which typically range from 1 to 100 AU for
time separations ranging from a few weeks to a few years.
= 43 mas yr-1, corresponding to a transverse velocity of
103 km s-1 or 22 AU yr-1 for a distance D=530 pc (this value will be
used in the following for consistency with B05; it
is
compatible with the trigonometric
parallax estimate of
446+220-111 pc). The line of sight is thus drifting
rapidly through the foreground gas; successive column density
measurements then provide a ``cut'' through the cloud revealing its spatial
density structure over scales which typically range from 1 to 100 AU for
time separations ranging from a few weeks to a few years.
The first five FUSE spectra discussed in B05 showed that highly excited H2 gas is present along the line of sight, together with more standard quiescent
gas at ![]() 80 K. The presence of significant amounts of H2 with an
excitation energy higher that 2500 K (corresponding to the v=0, J=5 state)
is very rare (another remarkable case is that of HD 37903 studied by Meyer et al. 2001).
This is certainly related to the fact that by chance, along its long
path from
the Orion nebula where it was ejected a few millions years ago
(Hoogerwerf et al. 2001), HD 34078 has
recently encountered a dense interstellar cloud with which it is currently
interacting, leading to the present-day appearance of the IC 405 nebula
(Herbig 1958).
80 K. The presence of significant amounts of H2 with an
excitation energy higher that 2500 K (corresponding to the v=0, J=5 state)
is very rare (another remarkable case is that of HD 37903 studied by Meyer et al. 2001).
This is certainly related to the fact that by chance, along its long
path from
the Orion nebula where it was ejected a few millions years ago
(Hoogerwerf et al. 2001), HD 34078 has
recently encountered a dense interstellar cloud with which it is currently
interacting, leading to the present-day appearance of the IC 405 nebula
(Herbig 1958).
In previous modelling work of the properties of the gas along the line of sight (B05), it was found that two components are required to account for the observed absorption lines:
- -
- highly excited H2 located in a bow shock, where the stellar wind
impacts on the ambient medium. Illumination of this
gas by the strong UV field of the star satisfactorily explains the
observed H2 excitation diagram. The presence of such a bow shock around
HD 34078 was suspected on the basis of IRAS data (van Buren et al. 1995)
and has been confirmed recently by higher spatial resolution
 observations (France et al. 2007);
- -
- a foreground quiescent cloud (supposedly unrelated to HD 34078/IC 405) giving rise to absorption from cold H2 and other species typical of translucent material (CH, CO, CN).
The potential relation between HD 34078 and the cloud probed has important implications regarding the investigation of small-scale structure. Indeed, in the case of a real association, any mechanical or radiative interaction might significantly affect the initial structure. Further, the gas flow in the bow shock may be subject to instabilities which could lead to time variations of a different nature, not necessarily associated with spatial structure.
Thus, one objective of the present study is to clarify the relation between HD 34078 and the cold cloud. To this end, we have undertaken observations of CO emission in the field surrounding the O star. The second goal of our work is to extend the search for absorption line variations in ground-based spectra (CH and CH+ mainly) and in FUSE spectra (H2) by adding recent data obtained after the initial studies by R03 and B05 were completed.
This paper is organised as follows. We first present high spatial resolution
![]() and 12CO(1-0) observations performed at the 30 m IRAM telescope and their
implications concerning the location and properties of the quiescent
component (Sect. 2).
In Sect. 3, we analyse a new series of optical spectra which allow us to
study in detail the variations of CH and CH+ column densities
[hereafter N(CH) and N(CH+)] and velocity profiles.
Time variations of H2 column densities [hereafter
N(H2)] are then discussed in the light of the observed CH and CH+
variations (Sect. 4). In Sect. 5, we summarize the main observational
results for
and 12CO(1-0) observations performed at the 30 m IRAM telescope and their
implications concerning the location and properties of the quiescent
component (Sect. 2).
In Sect. 3, we analyse a new series of optical spectra which allow us to
study in detail the variations of CH and CH+ column densities
[hereafter N(CH) and N(CH+)] and velocity profiles.
Time variations of H2 column densities [hereafter
N(H2)] are then discussed in the light of the observed CH and CH+
variations (Sect. 4). In Sect. 5, we summarize the main observational
results for
![]() and HD 34078, in particular for readers not interested in
details concerning observations. Then, we discuss the implications
of our observations in terms of processes related to the interaction
between HD 34078 and the surrounding gas and small-scale structure
in foreground unperturbed gas (Sect. 6). Finally, we summarize our
conclusions and present some prospects concerning possible observational
signatures of the future evolution of HD 34078's close environment.
and HD 34078, in particular for readers not interested in
details concerning observations. Then, we discuss the implications
of our observations in terms of processes related to the interaction
between HD 34078 and the surrounding gas and small-scale structure
in foreground unperturbed gas (Sect. 6). Finally, we summarize our
conclusions and present some prospects concerning possible observational
signatures of the future evolution of HD 34078's close environment.
2 CO emission towards HD 34078
12CO emission can be used to investigate a possible connection between HD 34078 and the molecules seen in absorption. Indeed, in the two-component model presented in B05, CO molecules (as well as CH, CH+ etc.) lie far in front of HD 34078 and if this picture were correct, the morphology of the CO emission should not correlate in any manner with the star position. Otherwise, any relation between the CO emission map and HD 34078's position would be a clear indication that the star is closely related to the foreground cloud.
2.1 IRAM-30 m observations
Emission of the rotational transitions of 12CO was
observed with the IRAM-30 m telescope during three consecutive
nights on February 11, 12 and 13, 2004.
Using the HERA
![]() multi-beam array (Schuster et al. 2004), we mapped
the 12CO(2-1) emission in a
multi-beam array (Schuster et al. 2004), we mapped
the 12CO(2-1) emission in a
![]() arcsec2region centred on HD 34078's position. The single side-band
receiver temperature was in the range 120 to
180 K. Observations were performed under good weather conditions
with 2 mm water vapor and a zenith sky opacity at 230 GHz
arcsec2region centred on HD 34078's position. The single side-band
receiver temperature was in the range 120 to
180 K. Observations were performed under good weather conditions
with 2 mm water vapor and a zenith sky opacity at 230 GHz
![]() ,
resulting in system temperatures in the
range 250-350 K. Chopper-wheel calibration was done every
10-15 min. Pointing was checked frequently, ensuring an
accuracy of 2
,
resulting in system temperatures in the
range 250-350 K. Chopper-wheel calibration was done every
10-15 min. Pointing was checked frequently, ensuring an
accuracy of 2
![]() .
We used the VESPA autocorrelator as a
spectrometer covering 160 km s-1 with a resolution power of
.
We used the VESPA autocorrelator as a
spectrometer covering 160 km s-1 with a resolution power of
![]() or
or
![]() km s-1 (
km s-1 (
![]() MHz; see Table 1 for CO observation parameter values).
Observations were performed in raster mode to allow deep
integration of about 40 min to ensure a rms of 15 mK
(antenna temperature scale) in each velocity channel. The map
consists of a regular grid of
MHz; see Table 1 for CO observation parameter values).
Observations were performed in raster mode to allow deep
integration of about 40 min to ensure a rms of 15 mK
(antenna temperature scale) in each velocity channel. The map
consists of a regular grid of
![]() positions
observed with a sampling of 6
positions
observed with a sampling of 6
![]() ,
and the data are thus
only slightly undersampled (
,
and the data are thus
only slightly undersampled (
![]() at
230 GHz). A 5-point cross centred at offsets (-3,3)with 12
at
230 GHz). A 5-point cross centred at offsets (-3,3)with 12
![]() steps was observed simultaneously with the
single-pixel receivers facility,
in the 12CO(1-0) and (2-1) transitions (
steps was observed simultaneously with the
single-pixel receivers facility,
in the 12CO(1-0) and (2-1) transitions (
![]() at 115 GHz) to derive
the excitation conditions of the gas.
at 115 GHz) to derive
the excitation conditions of the gas.
2.2 Results and analysis of the CO data
The resulting map of the 12CO(2-1) emission is shown in
Fig. 1, in which the nearly fully-sampled spectra were projected on
a 6
![]()
![]() 6
6
![]() grid centred on the (0, 0) offset.
Thermal dust emission has also been observed recently by
France et al. (2007) and their MIPS 24
grid centred on the (0, 0) offset.
Thermal dust emission has also been observed recently by
France et al. (2007) and their MIPS 24 ![]() m is overlaid by the CO
spectra.
m is overlaid by the CO
spectra.
![\begin{figure}
\par\includegraphics[angle=-90,width=9cm,clip]{0960fi1.eps}
\end{figure}](/articles/aa/full_html/2009/25/aa10960-08/img38.png) |
Figure 1:
12CO(2-1) spectra overlaid on the MIPS
24 |
| Open with DEXTER | |
![\begin{figure}
\par\includegraphics[width=9cm,clip]{0960fi2.eps}
\end{figure}](/articles/aa/full_html/2009/25/aa10960-08/img39.png) |
Figure 2:
The integrated 12CO(2-1) emission (contours) overlaid on the MIPS
24 |
| Open with DEXTER | |
![\begin{figure}
\par\includegraphics[angle=-90,width=9cm,clip]{0960fi3.eps}
\end{figure}](/articles/aa/full_html/2009/25/aa10960-08/img40.png) |
Figure 3: Channel maps of the 12CO(2-1) emission averaged over an interval of 0.41 km s-1(the value in the upper left corner is the center of the velocity interval considered). Each panel corresponds to the region shown in Fig. 1. The first contour level and spacing between successive contours is 3.5 mK. |
| Open with DEXTER | |
We also present a map of the integrated
![]() intensity superimposed
onto the MIPS 24
intensity superimposed
onto the MIPS 24 ![]() m emission (Fig. 2) as well as channel
maps (Fig. 3).
The
m emission (Fig. 2) as well as channel
maps (Fig. 3).
The
![]() integrated intensity is clearly stronger around the star
position (0, 0).
While the NE and SW region are nearly devoid of emission, the region of
enhanced
integrated intensity is clearly stronger around the star
position (0, 0).
While the NE and SW region are nearly devoid of emission, the region of
enhanced
![]() emission is resolved and displays an elongated morphology
(in the NE-SW direction) and extent which are both relatively similar to those
of the brightest part of the IR arc. The
emission is resolved and displays an elongated morphology
(in the NE-SW direction) and extent which are both relatively similar to those
of the brightest part of the IR arc. The
![]() peak is apparently offset southward by about 9
peak is apparently offset southward by about 9
![]() with
respect to the 24
with
respect to the 24 ![]() m maximum but, given i) the accuracy of absolute
positions in the IR map (
m maximum but, given i) the accuracy of absolute
positions in the IR map (![]() 1
1
![]() ;
K. France, private communication)
and
;
K. France, private communication)
and
![]() emission (
emission (![]() 2
2
![]() )
and ii) the presence of
saturation in the 24
)
and ii) the presence of
saturation in the 24 ![]() m map, it is not clear whether this
offset is really significant.
m map, it is not clear whether this
offset is really significant.
The profiles are double peaked close to
the star (in an approximate circle of diameter 20-30
![]() ;
note the blue
and red components appearing on each side of the vertical dotted line at
5.9 km s-1 plotted in Fig. 1). The spectra closest
to the star display a mirror symmetry about an axis coincident with HD
34078's path, with the blue emission line stronger to the E and the red one
stronger to the W. This is apparent in the channel maps
(Fig. 3), where the red component peaks to the W while the
blue one peaks to the NE. The symmetry quickly disappears as the profiles
become single
peaked further away. Averaging spectra in the NW or SE areas clearly shows
that weak wings are present there over the entire velocity range (
;
note the blue
and red components appearing on each side of the vertical dotted line at
5.9 km s-1 plotted in Fig. 1). The spectra closest
to the star display a mirror symmetry about an axis coincident with HD
34078's path, with the blue emission line stronger to the E and the red one
stronger to the W. This is apparent in the channel maps
(Fig. 3), where the red component peaks to the W while the
blue one peaks to the NE. The symmetry quickly disappears as the profiles
become single
peaked further away. Averaging spectra in the NW or SE areas clearly shows
that weak wings are present there over the entire velocity range (
![]() = 3-10 km s-1) covered by the more intense emission seen in the central
part. The systemic velocity of the ambient molecular gas is
= 3-10 km s-1) covered by the more intense emission seen in the central
part. The systemic velocity of the ambient molecular gas is
![]()
![]() 6.5 km s-1.
6.5 km s-1.
We now consider the additional
12CO(1-0) spectra (Fig. 4) to investigate the
excitation of the CO gas at the (-3, 3) position (at other positions, the
12CO(1-0) spectra are of lower S/N due to a shorter integration
time and are less appropriate to measure the excitation ratio).
For this purpose, 12CO(1-0) and
![]() spectra are brought into the
main beam temperature scale; the forward and beam efficiencies are given in
Table 1.
We next synthetize the
spectra are brought into the
main beam temperature scale; the forward and beam efficiencies are given in
Table 1.
We next synthetize the
![]() emission over the (1-0) beam using the
spectra obtained at
adjacent positions [(-9, 3), (-3, 9), (3, 3), (-3, -3)] with the appropriate
weighting. The resulting (2-1)/(1-0) integrated intensity ratio
appears to be around 1.5, a large value compared to that
(
emission over the (1-0) beam using the
spectra obtained at
adjacent positions [(-9, 3), (-3, 9), (3, 3), (-3, -3)] with the appropriate
weighting. The resulting (2-1)/(1-0) integrated intensity ratio
appears to be around 1.5, a large value compared to that
(![]() 0.7) commonly observed towards diffuse clouds
(Pety et al. 2008; Falgarone et al. 1998; Liszt & Lucas 1998).
Moreover, the (2-1)/(1-0) ratio is significantly different for the two main
components around
0.7) commonly observed towards diffuse clouds
(Pety et al. 2008; Falgarone et al. 1998; Liszt & Lucas 1998).
Moreover, the (2-1)/(1-0) ratio is significantly different for the two main
components around
![]()
![]() 5 and 7 km s-1 for which we obtain values of
about 1.8 and 1.3, respectively.
5 and 7 km s-1 for which we obtain values of
about 1.8 and 1.3, respectively.
![\begin{figure}
\par\includegraphics[angle=-90,width=9cm,clip]{0960fi4.eps}
\end{figure}](/articles/aa/full_html/2009/25/aa10960-08/img43.png) |
Figure 4:
Emission spectra of 12CO(1-0) (grey scale histogram) and
|
| Open with DEXTER | |
The above results on the (-3, 3) position can be used to set constraints
on the physical conditions
prevailing in the gas. With the help of a large velocity gradient
model (Hily-Blant & Falgarone 2007), we find that acceptable solutions can be
obtained for T > 12 K
and that above T = 20 K, the gas density is well constrained and must lie
in the range n = 103-104 cm-3 (n is the ambient H number
density). All solutions obtained correspond to optically thin
emission.
For instance, at T = 80 K, a value close to
the temperature estimated for the dust by France et al. (2007),
we get
![]() cm-3 and
cm-3 and
![]() cm-2
at
cm-2
at
![]() = 5 km s-1 and
= 5 km s-1 and
![]() cm-3 and
cm-3 and
![]() cm-2
for the
cm-2
for the
![]() = 7 km s-1 component. Note that the above CO column densities are
comparable to the value
= 7 km s-1 component. Note that the above CO column densities are
comparable to the value
![]() cm-2 inferred
either from IUE data by McLachlan & Nandy (1984) or from FUSE
by Sheffer et al. (2008) for the gas in front of
HD 34078.
cm-2 inferred
either from IUE data by McLachlan & Nandy (1984) or from FUSE
by Sheffer et al. (2008) for the gas in front of
HD 34078.
We end this section by concluding that our CO observations allow us to unambiguously answer the question which motivated this study: HD 34078 is indeed closely associated with molecular gas located in its immediate vicinity (which was previously assigned to a foreground quiescent cloud by B05). Moreover, the anomalous CO excitation observed, the large inferred gas density and peculiar velocity field very likely result from the interaction between the stellar wind/radiation and the ambient molecular material (in Sect. 6, we discuss in more detail the implications of the CO observations).
3 Variation of CH and CH+ absorption lines
3.1 Description of optical observations
In the visible, we add 26 spectra to the data considered in R03. Twelve spectra were taken at OHP, eight at McDonald Observatory (hereafter McD) while three spectra were obtained at the Boyunsan Optical Astronomy Observatory (BOAO, South Korea), two at the Terskol Observatory and one at Calar Alto. Altogether, these observations probe the evolution of CH and CH+ abundances between 1989 and 2008, with good sampling since 2000. In particular, our recent data well cover the period during which the eight FUSE spectra were obtained. The date of each observation and spectral resolution are given in Table 2.
To check in a direct way the consistency of measurements performed
at different telescopes, in 2003 we started parallel observations of
the bright star
![]() .
The latter has been observed in nearly all
OHP and McD runs, in addition to HD 34078 (cf. Table 2).
This nearby reddened star [d = 400 pc,
E(B-V) = 0.33] has a
small proper motion of 10.2 mas yr-1, corresponding to a transverse
velocity of 4.1 AU yr-1, much smaller than the value for
HD 34078 (22 AU yr-1).
Thus, in principle we expect much less variation due to structure in the
foreground IS gas towards
.
The latter has been observed in nearly all
OHP and McD runs, in addition to HD 34078 (cf. Table 2).
This nearby reddened star [d = 400 pc,
E(B-V) = 0.33] has a
small proper motion of 10.2 mas yr-1, corresponding to a transverse
velocity of 4.1 AU yr-1, much smaller than the value for
HD 34078 (22 AU yr-1).
Thus, in principle we expect much less variation due to structure in the
foreground IS gas towards
![]() and absorption lines seen in the spectra
of that star should be a good indication of the instrumental stability and
homogeneity of our measurements. Data from the literature
(Allen 1994; Crane et al. 1995) do show that
and absorption lines seen in the spectra
of that star should be a good indication of the instrumental stability and
homogeneity of our measurements. Data from the literature
(Allen 1994; Crane et al. 1995) do show that
![]() values for CH, CH+, CN,
Ca I, and Ca II are constant within errors for
values for CH, CH+, CN,
Ca I, and Ca II are constant within errors for
![]() .
.
Table 2: List of observations and measured CH and CH+ equivalent widths (in mÅ; uncertainties as estimated in Sect. 3.2.1 are given in upper index).
OHP observations were made in service mode using the ELODIE spectrograph
(Baranne et al. 1996),
as in R03, except for the four latest runs which were performed with
SOPHIE, the new spectrograph that now supersedes ELODIE at the 1.93 m
telescope (Bouchy & The Sophie Team 2006). SOPHIE provides an improved spectral
resolution (R = 75 000)
and sensitivity, as well as an extended wavelength range
(including CH ![]() 3886,
CH
3886,
CH ![]() 3890, and CH+
3890, and CH+ ![]() 3957; as the blue CN lines are close to the blue edge of the
spectra the S/N is too low for these features to be usable). Since SOPHIE has
been optimized for the detection of extrasolar planets by radial velocity
measurements, it provides an accurate wavelength scale (better than 0.01 km s-1; this scale is relative to the barycentre of the solar system).
Each observation
consisted of 4 to 8 individual exposures totalling about 1 h
for HD 34078 and 10
3957; as the blue CN lines are close to the blue edge of the
spectra the S/N is too low for these features to be usable). Since SOPHIE has
been optimized for the detection of extrasolar planets by radial velocity
measurements, it provides an accurate wavelength scale (better than 0.01 km s-1; this scale is relative to the barycentre of the solar system).
Each observation
consisted of 4 to 8 individual exposures totalling about 1 h
for HD 34078 and 10![]() for
for
![]() ;
these two targets were generally
observed consecutively or, occasionally, during two successive nights.
Spectra were extracted using the pipeline data reduction software.
The latter
were designed specifically for these spectrographs
(Baranne et al. 1996; Bouchy & The Sophie Team 2006) and include all required
steps (in particular bias and flat field corrections, using appropriate
exposures). For observations of bright stars such as
;
these two targets were generally
observed consecutively or, occasionally, during two successive nights.
Spectra were extracted using the pipeline data reduction software.
The latter
were designed specifically for these spectrographs
(Baranne et al. 1996; Bouchy & The Sophie Team 2006) and include all required
steps (in particular bias and flat field corrections, using appropriate
exposures). For observations of bright stars such as
![]() and HD 34078,
this procedure has been shown to work efficiently, which we checked whenever
it was possible, e.g. by comparing independent spectra taken at short time
intervals before merging them, or by comparing W values for those lines
seen twice, on two consecutive orders.
and HD 34078,
this procedure has been shown to work efficiently, which we checked whenever
it was possible, e.g. by comparing independent spectra taken at short time
intervals before merging them, or by comparing W values for those lines
seen twice, on two consecutive orders.
At McDonald Observatory echelle spectra of HD 34078 were
obtained with the Harlan J. Smith 2.7 m telescope. The strongest molecular
features from CN, CH+, and CH are detected, as are the K line of
Ca II and Ca I ![]() 4226, although the latter falls next
to a CCD glitch and thus cannot be reliably extracted. The data were
reduced in the same fashion as before (cf. R03). A global multi-order fit of the
entire CCD chip was performed for each Th-Ar spectrum, yielding residuals
below 0.001 Å (or 0.08 km s-1). Measured radial velocities of (non-variable)
absorption lines towards the comparison star
4226, although the latter falls next
to a CCD glitch and thus cannot be reliably extracted. The data were
reduced in the same fashion as before (cf. R03). A global multi-order fit of the
entire CCD chip was performed for each Th-Ar spectrum, yielding residuals
below 0.001 Å (or 0.08 km s-1). Measured radial velocities of (non-variable)
absorption lines towards the comparison star
![]() show a scatter that is
consistent with the residuals from the wavelength calibration.
From the Th-Ar data we measured the instrumental resolution of our spectra,
which turned out to be R = 170 000. Stellar exposures were 30
show a scatter that is
consistent with the residuals from the wavelength calibration.
From the Th-Ar data we measured the instrumental resolution of our spectra,
which turned out to be R = 170 000. Stellar exposures were 30![]() long for
HD 34078, and typically 5
long for
HD 34078, and typically 5![]() for
for
![]() .
.
A few observations of HD 34078 were also performed at other telescopes. Two
spectra were obtained using the MAESTRO spectrograph, fed by the 2-m
telescope at the Terskol Observatory (TE) in Northern
Caucasus (the resolution was 120 000). Three more spectra were obtained using the
fiber-fed echelle spectrograph installed at the 1.8-m telescope
of the Bohyunsan Optical Astronomy Observatory (BOAO) in
South Korea (a description can be found in Galazutdinov et al. 2005).
Modes providing resolutions, R = 30 000 or 45 000, were employed (Table 2).
Finally, a spectrum was taken in service mode at the
Calar Alto observatory with the FOCES spectrograph (
R = 40 000, Pfeiffer et al. 1998).
For these additional runs,
![]() was not observed; we are
nevertheless confident that these data are homogeneous with respect to
the other spectra obtained.
was not observed; we are
nevertheless confident that these data are homogeneous with respect to
the other spectra obtained.
3.2 Equivalent widths and column densities
3.2.1 Equivalent width estimates
![\begin{figure}
\par\includegraphics[width=9cm,clip]{0960fi5.ps}
\end{figure}](/articles/aa/full_html/2009/25/aa10960-08/img51.png) |
Figure 5:
Equivalent widths of CH |
| Open with DEXTER | |
![\begin{figure}
\par\includegraphics[width=9cm,clip]{0960fi6.ps}
\end{figure}](/articles/aa/full_html/2009/25/aa10960-08/img52.png) |
Figure 6:
Same as in Fig. 5 but for the equivalent widths of CH+ |
| Open with DEXTER | |
Equivalent width measurements were performed in a similar way as in R03
for CH ![]() 4300. Regarding W4232(CH+), the accuracy is limited by the poor
definition of the continuum due to blending with a stellar line (cf.
Fig. 7 in R03).
Then, to avoid possible resolution-dependent effects on the estimate of W
values and to improve the homogeneity and accuracy of our measurements,
we fitted this stellar line with a Gaussian. Its position
(
4300. Regarding W4232(CH+), the accuracy is limited by the poor
definition of the continuum due to blending with a stellar line (cf.
Fig. 7 in R03).
Then, to avoid possible resolution-dependent effects on the estimate of W
values and to improve the homogeneity and accuracy of our measurements,
we fitted this stellar line with a Gaussian. Its position
(
![]() Å with respect to the CH+ absorption) and
FWHM (0.46 Å) were fixed while the depth was varied so as
to match the continuum blueward of the CH+ absorption as well as
possible (a typical value for
the depth is 3% of the continuum). Once the spectra have been
normalised in this way, we measure W and its uncertainty as done for
CH
Å with respect to the CH+ absorption) and
FWHM (0.46 Å) were fixed while the depth was varied so as
to match the continuum blueward of the CH+ absorption as well as
possible (a typical value for
the depth is 3% of the continuum). Once the spectra have been
normalised in this way, we measure W and its uncertainty as done for
CH ![]() 4300. This procedure was applied to all spectra, including those
obtained prior to 2003; for the latter, this results in W values which
differ slightly from those given in R03.
4300. This procedure was applied to all spectra, including those
obtained prior to 2003; for the latter, this results in W values which
differ slightly from those given in R03.
Some observations of HD 34078 were spread over 2 or 3 consecutive nights (in particular the recent, high S/N, McD and OHP/SOPHIE spectra), which allowed us to check that no significant day-to-day variations are present; we then measured W on the co-added spectrum. For the same reason, one BOAO and one TE measurement obtained two days apart in March 2004 were combined (thus Table 2 contains 25 entries).
Uncertainties were estimated in a conservative way, including the error due
to finite pixel-to-pixel S/N ratio and the one in continuum placement; we
assume as in R03 that the two sources of errors combine quadratically.
W estimates for HD 34078 and their associated errors are given
in Table 2 for HD 34078 (CH ![]() 4300 and CH+
4300 and CH+ ![]() 4232) and
4232) and
![]() (CH
(CH ![]() 4300); note that
concerning OHP/ELODIE spectra, values corrected as explained below are
given for both HD 34078 and
4300); note that
concerning OHP/ELODIE spectra, values corrected as explained below are
given for both HD 34078 and
![]() .
.
3.2.2 Consistency of all measurements
In Fig. 5 (upper panel), we show results from the CH ![]() 4300
4300
![]() observations performed between 2003 and 2007, to which we add
older measurements from Crane et al. (1995) and Allen (1994).
These are consistent with a constant value of W4300(CH). However,
careful examination reveals
a small offset of about -6% for the OHP/ELODIE values with respect to the
other measurements. Since the same offset appears to be present in the
HD 34078 W4300(CH) values (lower panel, empty triangles), this effect
is very likely due to scattered light in the ELODIE spectrograph
(Ilovaisky and Prugnel, personal communication). Thus, we applied
a +6% correction (scattered light from the target does lead to a
multiplicative correction on W values) to all OHP ELODIE CH
observations performed between 2003 and 2007, to which we add
older measurements from Crane et al. (1995) and Allen (1994).
These are consistent with a constant value of W4300(CH). However,
careful examination reveals
a small offset of about -6% for the OHP/ELODIE values with respect to the
other measurements. Since the same offset appears to be present in the
HD 34078 W4300(CH) values (lower panel, empty triangles), this effect
is very likely due to scattered light in the ELODIE spectrograph
(Ilovaisky and Prugnel, personal communication). Thus, we applied
a +6% correction (scattered light from the target does lead to a
multiplicative correction on W values) to all OHP ELODIE CH ![]() 4300 values
(filled triangles), including those presented in R03.
4300 values
(filled triangles), including those presented in R03.
Unfortunately, the CH+ ![]() 4232 line towards
4232 line towards
![]() is too faint
(
is too faint
(
![]() mÅ) to assess whether OHP/ELODIE measurements of
this transition are also affected by scattered light. Then, to
determine the correction for CH+
mÅ) to assess whether OHP/ELODIE measurements of
this transition are also affected by scattered light. Then, to
determine the correction for CH+ ![]() 4232 (which may be different
from that for CH
4232 (which may be different
from that for CH ![]() 4300), we have to rely on the HD 34078 data
themselves (Fig. 6). By comparing the sets of OHP and
McD values, we find that an offset of about +8% needs to
be applied to the OHP/ELODIE values to bring both sets of points
to good mutual agreement (filled triangles in Fig. 6).
After correcting the OHP/ELODIE W values in this way, it is apparent in
Figs. 5 and 6 that nearly simultaneous
measurements performed at different telescopes yield consistent values,
within errors. This is a direct indication that uncertainties are not
underestimated and that, after correction of the OHP/ELODIE W values,
the whole set of data is homogeneous.
4300), we have to rely on the HD 34078 data
themselves (Fig. 6). By comparing the sets of OHP and
McD values, we find that an offset of about +8% needs to
be applied to the OHP/ELODIE values to bring both sets of points
to good mutual agreement (filled triangles in Fig. 6).
After correcting the OHP/ELODIE W values in this way, it is apparent in
Figs. 5 and 6 that nearly simultaneous
measurements performed at different telescopes yield consistent values,
within errors. This is a direct indication that uncertainties are not
underestimated and that, after correction of the OHP/ELODIE W values,
the whole set of data is homogeneous.
The OHP/ELODIE W measurements of CH+ ![]() 3957 are not accurate enough in
comparison to those for CH
3957 are not accurate enough in
comparison to those for CH ![]() 4300 or CH+
4300 or CH+ ![]() 4232 to be really useful (further,
they are affected by scattered light in an unknown way). In contrast,
the recent OHP/SOPHIE spectra provide good S/N values
for W3957(CH+). In Fig. 7 (panels c and d) we show
the variation of W versus time for both CH+ transitions since
September 2006; as can be seen, the two sets of measurements are very
consistent. We also display for the same epochs the behavior of
W4300(CH) for both HD 34078 (panel a) and
4232 to be really useful (further,
they are affected by scattered light in an unknown way). In contrast,
the recent OHP/SOPHIE spectra provide good S/N values
for W3957(CH+). In Fig. 7 (panels c and d) we show
the variation of W versus time for both CH+ transitions since
September 2006; as can be seen, the two sets of measurements are very
consistent. We also display for the same epochs the behavior of
W4300(CH) for both HD 34078 (panel a) and
![]() (b); the latter values
remained constant while the variations seen for CH in HD 34078
are qualitatively similar to those observed for CH+. The
whole set of values for W4232(CH+) and W4300(CH) shows a fairly
smooth variation, with apparently little or no variations with timescales
smaller than a few months.
(b); the latter values
remained constant while the variations seen for CH in HD 34078
are qualitatively similar to those observed for CH+. The
whole set of values for W4232(CH+) and W4300(CH) shows a fairly
smooth variation, with apparently little or no variations with timescales
smaller than a few months.
![\begin{figure}
\par\includegraphics[width=9cm,clip]{0960fi7.ps}
\end{figure}](/articles/aa/full_html/2009/25/aa10960-08/img55.png) |
Figure 7:
Equivalent width of CH |
| Open with DEXTER | |
Figures 5-7
strongly suggest
that the equivalent widths varied for HD 34078 while W4300(CH) remained
constant for
![]() .
Let us now assess in a quantitative way the statistical significance of
time changes in the observed W values.
To this end, we perform a
.
Let us now assess in a quantitative way the statistical significance of
time changes in the observed W values.
To this end, we perform a ![]() test on W4300(CH) values for
both the
test on W4300(CH) values for
both the
![]() and HD 34078 sets of measurements, in order to check whether
the assumption of a constant W can be accepted or rejected. Using the
whole data set, we find that the
and HD 34078 sets of measurements, in order to check whether
the assumption of a constant W can be accepted or rejected. Using the
whole data set, we find that the
![]() data are consistent with a
constant value, W4300(CH) = 15.93 mÅ, while the assumption of a constant
W value can be rejected at the 5.2
data are consistent with a
constant value, W4300(CH) = 15.93 mÅ, while the assumption of a constant
W value can be rejected at the 5.2![]() level for
HD 34078 (the W value which minimizes
level for
HD 34078 (the W value which minimizes ![]() is 52.3 mÅ).
Note that these conclusions are unchanged if the OHP/ELODIE data are removed.
Equivalently, if the distribution of
is 52.3 mÅ).
Note that these conclusions are unchanged if the OHP/ELODIE data are removed.
Equivalently, if the distribution of
![]() values is
compared to a Gaussian with
values is
compared to a Gaussian with
![]() ,
one finds that it is
consistent for
,
one finds that it is
consistent for
![]() values and inconsistent for HD 34078 (the
values and inconsistent for HD 34078 (the ![]() test described above is just a way to quantify these statements).
We can therefore conclude that real time variations of W4300(CH)
occurred during the 2003-2008 period for HD 34078 (for CH+ towards
HD 34078, the assumption of a constant W is rejected at the 3.2
test described above is just a way to quantify these statements).
We can therefore conclude that real time variations of W4300(CH)
occurred during the 2003-2008 period for HD 34078 (for CH+ towards
HD 34078, the assumption of a constant W is rejected at the 3.2![]() level).
level).
3.2.3 From equivalent widths to column densities
Since the absorption lines considered here are not completely optically thin,
we cannot infer N values directly from W ones. We will then rely on the
highest resolution data, from McD observations.
In the latter, the CH+ ![]() 4232 profiles are
fully resolved; one can thus derive the true optical depth and get
N(CH+) by direct integration.
Regarding CH, the determination of N and of the
velocity profile is complicated by the
structure of the ground level, due to
4232 profiles are
fully resolved; one can thus derive the true optical depth and get
N(CH+) by direct integration.
Regarding CH, the determination of N and of the
velocity profile is complicated by the
structure of the ground level, due to ![]() doubling. As shown by
Lien (1984), neglecting this effect may cause an underestimate
in N(CH) and a broadening of the profile, when the intrinsic
width is small enough (i.e. comparable to or smaller than the splitting of
the ground level, which corresponds to 1.43 km s-1).
doubling. As shown by
Lien (1984), neglecting this effect may cause an underestimate
in N(CH) and a broadening of the profile, when the intrinsic
width is small enough (i.e. comparable to or smaller than the splitting of
the ground level, which corresponds to 1.43 km s-1).
CH profiles include at least two components (a strong asymmetric and
narrow one superimposed on weak shallow absorption) and fitting with
Voigt profiles remains somewhat arbitrary (Figs. 5 and 7 in R03). Thus, to get the intrinsic CH pixel optical depth
profile without any a
priori decomposition and perform the detailed comparison with the
CH+ profile allowed by the quality of the McD data,
we use a Bayesian inversion procedure as done by Pichon et al. (2001)
in the context of Ly![]() absorption in QSO spectra.
Equally populated sublevels are assumed (we checked that the
relative strength of the CH
absorption in QSO spectra.
Equally populated sublevels are assumed (we checked that the
relative strength of the CH ![]() 3886 and CH
3886 and CH ![]() 3890 lines in
the OHP/SOPHIE spectra is consistent with this hypothesis;
see also Lien 1984, for other lines of sight).
We find in the end that taking into account
3890 lines in
the OHP/SOPHIE spectra is consistent with this hypothesis;
see also Lien 1984, for other lines of sight).
We find in the end that taking into account ![]() doubling induces
corrections on N(CH) which are no larger than 1.3%.
doubling induces
corrections on N(CH) which are no larger than 1.3%.
Significant changes in the CH and CH+ profiles are seen (see Sect. 3.3)
but these remain relatively small and further, the optical thickness of
either CH ![]() 4300 or
CH+
4300 or
CH+ ![]() 4232 does not exceed 1. One can therefore expect a simple
empirical relation to hold between W and N, allowing us to
infer N values from
W measurements performed from lower resolution data.
In Fig. 8, we show
W/
4232 does not exceed 1. One can therefore expect a simple
empirical relation to hold between W and N, allowing us to
infer N values from
W measurements performed from lower resolution data.
In Fig. 8, we show
W/![]() versus
versus ![]() for both CH
for both CH ![]() 4300 and CH+
4300 and CH+ ![]() 4232 from McD spectra.
As can be seen, both sets
of points are well fitted by a single straight line (dotted line), as a result
of the similarity of CH and CH+ velocity profiles (cf. R03 and
Sect. 3.3). This fit corresponds to the following relations,
4232 from McD spectra.
As can be seen, both sets
of points are well fitted by a single straight line (dotted line), as a result
of the similarity of CH and CH+ velocity profiles (cf. R03 and
Sect. 3.3). This fit corresponds to the following relations,
and
for CH
![\begin{figure}
\par\includegraphics[width=8.2cm,clip]{0960fi8.ps} %
\end{figure}](/articles/aa/full_html/2009/25/aa10960-08/img64.png) |
Figure 8: Equivalent width versus column density for high resolution observations (McDonald). CH (filled squares) and CH+ (empty squares) absorption lines span different ranges in opacity which helps to constrain the best linear fit (dotted line: y = -15.232 + 0.676 x). A curve of growth with b=3.2 km s-1 also provides a good fit to the data (plain line; the two additional lines correspond to b=2.8 and b=3.5 km s-1 and bracket the data points well). The large b curve (i.e. optically thin limit) is shown (dashed line). |
| Open with DEXTER | |
3.2.4 CH and CH+ column density variations
![\begin{figure}
\par\includegraphics[width=9cm,clip]{0960fi9.ps}
\end{figure}](/articles/aa/full_html/2009/25/aa10960-08/img65.png) |
Figure 9:
Evolution of the CH and CH+ column densities
with time. The solid thick lines show the long-term evolution obtained after
smoothing using a Gaussian window with a FWHM of one year (dashed
lines indicate
|
| Open with DEXTER | |
Figure 9 shows the variation of N(CH) and N(CH+) observed between
1998 and 2007. In R03 we found that W4300(CH) increased from
1990 to 2002; the +6% applied to the OHP/ELODIE data results in a
larger amplitude for this variation (21% instead of 14%).
It now appears that N(CH) reached a maximum during the 2000-2002 interval,
and has been decreasing since then to reach in 2006 a value similar to those
observed before 1998. To better characterise the long-term variation,
we smoothed the data using a Gaussian window with a FWHM of one year.
In the averaging, each N value is weighted
according to 1/
![]() where
where ![]() is the uncertainty; the
resulting curve (together with
is the uncertainty; the
resulting curve (together with
![]() bounds) is shown in
Fig. 9. The typical timescale for these variations,
bounds) is shown in
Fig. 9. The typical timescale for these variations, ![]() ,
defined as the time needed for N to change by 10% (i.e.
,
defined as the time needed for N to change by 10% (i.e.
![]() )
is about 1.5-2 yr.
)
is about 1.5-2 yr.
The new data clearly indicate that additional variations,
with shorter timescales, are also present as was suspected from
earlier data (R03).
This is especially clear in the most recent 2006-2008
results: N(CH) decreased by -10% between September 2006 and February 2007,
(
![]() 0.5 yr) and then increased by 9% to reach the last
February 2008 value (see Fig. 7 for a zoom on the recent
W data).
0.5 yr) and then increased by 9% to reach the last
February 2008 value (see Fig. 7 for a zoom on the recent
W data).
We now consider the CH+ measurements shown as empty squares in Fig. 9. The +8% correction applied to the OHP/ELODIE data somewhat affects the previous conclusion of R03 of a possible decrease of N(CH+) between 1990 and 2002: N(CH+) now looks essentially constant over the long term, with no large amplitude variations such as those seen for CH. Beyond 2000, the general pattern is relatively similar for both species. However, although the long-term variations in CH and CH+ seem to be loosely correlated, there is a good correspondence between the short-term ones; this is especially clear in Fig. 7 (note in particular the coincidence of the local minima in February 2007 for both species). Although the variation patterns are qualitatively similar, the amplitudes are significantly different. For instance, the increase of N(CH+) between February 2007 and 2008 (+26%) is notably larger than that of N(CH) (+9%).
We shall now focus on the high resolution spectra of the CH ![]() 4300 and CH+
4300 and CH+ ![]() 4232 absorption lines in order to investigate whether the observed long and
short-term variations in W are accompanied by detectable changes in line
profiles. Profile variations might also be present which are not necessarily
reflected in appreciable W changes.
4232 absorption lines in order to investigate whether the observed long and
short-term variations in W are accompanied by detectable changes in line
profiles. Profile variations might also be present which are not necessarily
reflected in appreciable W changes.
3.3 High resolution CH and CH+ line profiles and their variations
The high resolution profiles obtained at McDonald Observatory have all been
corrected for the Doppler shift due to the Earth velocity and have been
brought in the LSR system. Yet, after correction, the
wavelength of the
![]() CN and CH lines still show slight fluctuations
in position (of at most a few mÅ) from one epoch to another (given the
excellent S/N and the sharp line profiles, misalignments by only a few
mÅ are sufficient to induce significant profile differences). These
fluctuations are identical for both CN and CH lines to within 1 mÅ
and show a good correlation with those of the HD 34078 lines.
They must then be due to some inaccuracy in the LSR correction from one
epoch to another. To improve the accuracy in the alignment of the
HD 34078 absorption lines, we assume that
CN and CH lines still show slight fluctuations
in position (of at most a few mÅ) from one epoch to another (given the
excellent S/N and the sharp line profiles, misalignments by only a few
mÅ are sufficient to induce significant profile differences). These
fluctuations are identical for both CN and CH lines to within 1 mÅ
and show a good correlation with those of the HD 34078 lines.
They must then be due to some inaccuracy in the LSR correction from one
epoch to another. To improve the accuracy in the alignment of the
HD 34078 absorption lines, we assume that
![]() lines have been stable
in position (this is confirmed by SOPHIE spectra whose wavelength scale
is accurately defined) and infer the value of the relative shifts for
each epoch. These are used to slightly adjust the position of
HD 34078 lines.
lines have been stable
in position (this is confirmed by SOPHIE spectra whose wavelength scale
is accurately defined) and infer the value of the relative shifts for
each epoch. These are used to slightly adjust the position of
HD 34078 lines.
The CH and CH+ line profiles are quite similar (Fig. 10): both
include a narrow component with a full width at half maximum of about 5.5 km s-1
(corresponding
to a b parameter of 3.3 km s-1) and shallow absorption extending
from -4 up to 17 km s-1.
The CH and CH+ narrow components cover the same velocity range
(![]() 2-11 km s-1)
but their shapes are significantly different: CH displays a steeper blue
edge, while the opposite holds for CH+. This results in a shift of
about +1.6 km s-1 for the CH+ line centre with respect to that of CH.
It is noteworthy that the velocity range covered by the narrow CH or CH+ absorption coincides quite well with the range over which CO emission
is observed.
2-11 km s-1)
but their shapes are significantly different: CH displays a steeper blue
edge, while the opposite holds for CH+. This results in a shift of
about +1.6 km s-1 for the CH+ line centre with respect to that of CH.
It is noteworthy that the velocity range covered by the narrow CH or CH+ absorption coincides quite well with the range over which CO emission
is observed.
Since we are likely probing molecular gas closely associated with
HD 34078 (i.e. with peculiar physical conditions), one may wonder
whether the CH and CH+ profiles show significant differences to
those seen on other lines of sight.
We note that the presence of a weak broad component is rare
(Crawford 1995; Crane et al. 1995) but such shallow absorption would
be difficult to detect in most spectra; one of very low amplitude
(![]() 1% instead of
1% instead of ![]() 5% in our spectra) is however present
in the very high S/N spectrum of
5% in our spectra) is however present
in the very high S/N spectrum of ![]() Oph presented by Crane et al. (1991).
Oph presented by Crane et al. (1991).
![\begin{figure}
\par\includegraphics[angle=-90,width=9cm,clip]{0960fi10.ps}
\end{figure}](/articles/aa/full_html/2009/25/aa10960-08/img71.png) |
Figure 10:
Comparison of McD CH |
| Open with DEXTER | |
![\begin{figure}
\par\includegraphics[height=9cm,width=12.75cm,angle=-90,clip]{0960fi11.ps}
\end{figure}](/articles/aa/full_html/2009/25/aa10960-08/img72.png) |
Figure 11:
Comparison of the HD 34078 OHP spectra obtained in February
2007 (thick line) and February 2008 (thin line) for the CH |
| Open with DEXTER | |
By comparing successive spectra, we find that fluctuations in W are
most often associated
with changes in the blue and central part of the profiles, the red side
suffering very little
variation. This is apparent in Fig. 10 (left panels)
in which we display
CH McD profiles for the January 2003 and October 2005 epochs. During
this 2.8 yr time interval W4300(CH) decreased
by 12% and the FWHM of the narrow component decreased by 5%.
W4232(CH+) remained nearly constant over the same period but
significant profiles changes are nevertheless clearly present; the line
is slightly deeper, which compensates for a decrease in FWHM
comparable to that seen for CH. Another example is shown in
Fig. 10 (right panels), where we compare OHP/SOPHIE CH and CH+ profiles
taken over a much shorter interval (0.43 yr from September 2006 to
February 2007).
In this case, W4300(CH) and W4232(CH+) have decreased by a comparable
amount (![]() 7%) while both profiles became slightly narrower.
Thus correlated W variations appear to be associated with similar
profile changes. Since 2003, W values show no systematic trend but
rather erratic fluctuations; the same is true for profiles and
generally, for two epochs with comparable W values, the profiles are
quite similar (the CH+
7%) while both profiles became slightly narrower.
Thus correlated W variations appear to be associated with similar
profile changes. Since 2003, W values show no systematic trend but
rather erratic fluctuations; the same is true for profiles and
generally, for two epochs with comparable W values, the profiles are
quite similar (the CH+ ![]() 4232 January 2003 and October 2005 profiles being an
exception). In Fig. 11 we display the recent February 2007 and
2008 CH and CH+ profiles; the latter show a marked increase in W (cf.
Fig. 7), corresponding to +26% for N(CH+) (note that
during the same interval, the CH
4232 January 2003 and October 2005 profiles being an
exception). In Fig. 11 we display the recent February 2007 and
2008 CH and CH+ profiles; the latter show a marked increase in W (cf.
Fig. 7), corresponding to +26% for N(CH+) (note that
during the same interval, the CH ![]() 4300
4300
![]() profile remained stable). We
do not see appreciable variations of the broad shallow
component, but given its weakness, the significance of this result is
limited.
profile remained stable). We
do not see appreciable variations of the broad shallow
component, but given its weakness, the significance of this result is
limited.
Unfortunately, the S/N ratio for the CN line profiles of HD 34078 is not sufficient to allow a search for variations with a sensitivity comparable to the one attained for CH and CH+. Further, the strongest CN line is clearly affected by variations of blended stellar (C IV) absorption. Thus we shall not discuss variations of CN features.
4 Variations in the H column density
Boissé et al. (2005) analyzed the first 5 FUSE spectra taken since 2000
and detected no variation for the H2 column density with an upper limit of
5% at a 3![]() confidence level. Three additional spectra were
obtained by FUSE in September 2003, February 2004
and October 2004 which allow us to follow the time behavior of H2 absorption during the nearly five years since January 2000 and then
probe the spatial distribution of the gas over scales up to 104 AU.
confidence level. Three additional spectra were
obtained by FUSE in September 2003, February 2004
and October 2004 which allow us to follow the time behavior of H2 absorption during the nearly five years since January 2000 and then
probe the spatial distribution of the gas over scales up to 104 AU.
![\begin{figure}
\par\includegraphics[angle=-90,width=9cm,clip]{0960fi12.ps}
\end{figure}](/articles/aa/full_html/2009/25/aa10960-08/img73.png) |
Figure 12: Comparison of the FUSE spectra obtained in January 2000 (LWRS, thick line) and October 2004 (MDRS, thin line) in the region around 1050 Å (v and J values for the lower level of each H2 transition are indicated; the HD line is from J=0). In the MDRS spectrum, narrow lines tend to appear deeper and the damped (0, 0) and (0, 1) features slightly broader. |
| Open with DEXTER | |
4.1 Contamination of HD 34078 spectra by nebular emission
Comparing the October 2004 (8th) spectrum to the
previous ones, we find that it shows noticeable differences
(Fig. 12): narrow lines are deeper and damped H2 lines are slightly broader
[as if N(H2) had increased]. This brought to our attention a potential
difficulty that had not been considered in B05: contamination of the
HD 34078 spectrum by diffuse emission from the IC 405 nebula.
Indeed, the 8![]() spectrum was obtained with the MDRS
aperture while all others were taken using the larger LWRS aperture.
Given the difference in size (MDRS:
spectrum was obtained with the MDRS
aperture while all others were taken using the larger LWRS aperture.
Given the difference in size (MDRS:
![]() arcsec2; LWRS:
arcsec2; LWRS:
![]() arcsec2) and the intense diffuse emission detected
close to the HD 34078 line of sight by France et al. (2004),
the peculiarities of the 8th spectrum might just be due to a
lower level of contamination of the spectrum by
diffuse emission.
In Appendix A, we estimate the nebular contribution to LWRS spectra and
conclude that it can explain the difference between FUSE
spectra 1 to 7 and the 8th MDRS one. Thus only spectra 1
to 7 will be considered below in our search for variations in H2 lines.
arcsec2) and the intense diffuse emission detected
close to the HD 34078 line of sight by France et al. (2004),
the peculiarities of the 8th spectrum might just be due to a
lower level of contamination of the spectrum by
diffuse emission.
In Appendix A, we estimate the nebular contribution to LWRS spectra and
conclude that it can explain the difference between FUSE
spectra 1 to 7 and the 8th MDRS one. Thus only spectra 1
to 7 will be considered below in our search for variations in H2 lines.
![\begin{figure}
\par\includegraphics[angle=-90,width=9cm,clip]{0960fi13.ps}
\end{figure}](/articles/aa/full_html/2009/25/aa10960-08/img77.png) |
Figure 13:
FUSE LWRS HD 34078 spectra near the 1050 Å broad (4-0) H2
Lyman band.
Upper panel: all epochs, after flux intercalibration and
alignment (see text). The mean spectrum is shown (thick line); tick
marks indicate the features shown in Fig. 12 (two are from H2, the
third is from Ar I).
Lower panel: difference between the spectrum for each epoch
and the mean spectrum
(epochs 1 to 7, shifted from top to bottom for clarity; same scale as
in the upper panel).
The dashed line shows the 3 |
| Open with DEXTER | |
The importance of diffuse emission contamination in LWRS spectra also
implies some limitation in our search for variations: the aperture may
not be located exactly at the same position on the sky at all epochs
resulting in a slightly variable contribution from diffuse emission if gradients
are present. Note that since the diffuse to stellar flux
ratio decreases with wavelength towards HD 34078 (France et al. 2004),
H2 systems at longer
wavelengths are best suited to minimize the contamination by diffuse emission.
Regarding the study of the gas properties towards HD34078, the
8th spectrum is clearly to be preferred for two reasons: i) it
should be
much less affected by diffuse emission and ii) the S/N ratio is significantly
higher than for previous spectra due to an integration time (22 500 s) about
four times longer than at epochs 1 to 7 (![]() 6000 s).
A redetermination of the gas properties based
on the 8th spectrum (H2 excitation diagram in particular)
will be presented
elsewhere; we simply note here that the detection of absorption lines
from all excited H2 levels quoted in B05 is confirmed.
6000 s).
A redetermination of the gas properties based
on the 8th spectrum (H2 excitation diagram in particular)
will be presented
elsewhere; we simply note here that the detection of absorption lines
from all excited H2 levels quoted in B05 is confirmed.
4.2 Variations in N(H,
J = 0)
As in B05, we perform a direct comparison of the LWRS spectra, after relative flux intercalibration and adjusment of the wavelength scale. This procedure is applied independently to three portions of the spectra located at about 1050, 1063 and 1078 Å, corresponding to the (4-0), (3-0), (2-0) H2 Lyman bands respectively. Each of these broad features is a blend of four H2 lines arising from the J=0, 1 and 2 levels. A good relative flux calibration is easily obtained (as for spectra 1 to 5), indicating that the shape of the stellar spectrum does not vary (known stellar lines for such O9 stars are indeed weak and rare in these regions: Pellerin et al. 2002). Using narrow high J H2 lines adjacent to the broad H2 absorptions of interest, we get an accuracy in the wavelength alignment of about 0.01 Å for the 1050, 1063 and 1078 Å absorption systems.
We now focus on the blue edge of each broad H2 system
which presents good sensitivity to changes in N(H2, J=0). A zoom
of this region for the 1050 Å system is shown
in Fig. 13 (upper panel). All spectra, corrected in flux and
wavelength as described above, are superimposed. They are all
similar and an average spectrum can therefore be computed
(thick line). The difference (
![]() )
between one individual
spectrum, i, and the mean is displayed in the lower panel
for each epoch (
i=1, ..., 7 from top to bottom).
The 3
)
between one individual
spectrum, i, and the mean is displayed in the lower panel
for each epoch (
i=1, ..., 7 from top to bottom).
The 3![]() dispersion on
dispersion on
![]() among the seven epochs is indicated as a function
of wavelength (dashed lines). Away from the J=0 line, the
among the seven epochs is indicated as a function
of wavelength (dashed lines). Away from the J=0 line, the
![]() profile is consistent with no variation. In the region
close to the J=0 line (displayed in red) where variations in
N(J=0) would induce changes in the profiles, spectra 1 to 7
are also consistent with the mean spectrum.
Similarly, B05 have adjusted the first spectra
using
profile is consistent with no variation. In the region
close to the J=0 line (displayed in red) where variations in
N(J=0) would induce changes in the profiles, spectra 1 to 7
are also consistent with the mean spectrum.
Similarly, B05 have adjusted the first spectra
using
![]() and concluded that the variation
among the five first spectra was lower than 5%. Indeed,
an increase (decrease) of this amplitude roughly corresponds to
a difference that follows the lower (upper) 3
and concluded that the variation
among the five first spectra was lower than 5%. Indeed,
an increase (decrease) of this amplitude roughly corresponds to
a difference that follows the lower (upper) 3![]() profile
in Fig. 10. We conclude from our analysis that N(H2) changed
by less than 5% at the 3
profile
in Fig. 10. We conclude from our analysis that N(H2) changed
by less than 5% at the 3![]() level between January 2000 and
February 2004 while N(CH) has undergone variations as large as
20% over the same time interval (cf. Fig. 6).
level between January 2000 and
February 2004 while N(CH) has undergone variations as large as
20% over the same time interval (cf. Fig. 6).
5 Observations summary
5.1 The stability of  Per CH absorption
As mentioned above,
![]() was observed primarily to test the
homogeneity of our
measurements. After correction of the small offset found in the
OHP/ELODIE
data, the whole set of W values appears remarkably consistent. The
latter, and
the most recent (2006-2008) data in particular, lead us to a
strong twofold conclusion: i) W4300(CH) remains
constant towards
was observed primarily to test the
homogeneity of our
measurements. After correction of the small offset found in the
OHP/ELODIE
data, the whole set of W values appears remarkably consistent. The
latter, and
the most recent (2006-2008) data in particular, lead us to a
strong twofold conclusion: i) W4300(CH) remains
constant towards
![]() and ii) N(CH) and N(CH+) do vary
towards HD 34078. Indeed, if variations of instrumental
origin were responsible for changes in HD 34078 values, one should
invoke a very unlikely ``conspiracy'' to explain the stability of
and ii) N(CH) and N(CH+) do vary
towards HD 34078. Indeed, if variations of instrumental
origin were responsible for changes in HD 34078 values, one should
invoke a very unlikely ``conspiracy'' to explain the stability of
![]() lines.
The fact that the same behavior is observed for distinct CH+ lines
is a strong additional proof of the reality of HD 34078's variations.
lines.
The fact that the same behavior is observed for distinct CH+ lines
is a strong additional proof of the reality of HD 34078's variations.
![]() was observed for 5 years and over this time interval, the
drift of the line of sight
through the foreground cloud has been significant. The distance
to the cloud is thought to be 350 pc (Hilton & Lahulla 1995) and thus the
drift of the line of sight amounts to 17.8 AU.
The constancy of N(CH) then shows that over this
scale and below, there is no marked structure in the cloud. The
3
was observed for 5 years and over this time interval, the
drift of the line of sight
through the foreground cloud has been significant. The distance
to the cloud is thought to be 350 pc (Hilton & Lahulla 1995) and thus the
drift of the line of sight amounts to 17.8 AU.
The constancy of N(CH) then shows that over this
scale and below, there is no marked structure in the cloud. The
3![]() upper limit on relative variations of N(CH) is about 6%. We
derive this value simply from the raw average and rms scatter of McD
and OHP/SOPHIE measurements, assuming the CH
upper limit on relative variations of N(CH) is about 6%. We
derive this value simply from the raw average and rms scatter of McD
and OHP/SOPHIE measurements, assuming the CH ![]() 4300 line is optically thin;
a more detailed analysis of the
4300 line is optically thin;
a more detailed analysis of the
![]() data, including
CN and CH+ lines, will be presented elsewhere.
data, including
CN and CH+ lines, will be presented elsewhere.
5.2 Main observational results on HD 34078
From multiwavelength observations of the gas towards HD 34078 and in its close environment, we obtain the following results:
- the 12CO(2-1) emission map of the HD 34078 field
shows a pronounced peak coincident with the star's position, clearly indicating
that molecular gas seen in absorption is closely associated with HD 34078.
The extent and morphology of the CO emission correlates well with the
24
 m dust emission arc of France et al. (2007). Presumably as a
result of the interaction between HD 34078 and the ambient cloud, the
CO(2-1)/CO(1-0) ratio is anomalously large, pointing towards dense (103-104 cm-3) and warm (T > 12 K) emitting gas and further, a
remarkable kinematical
pattern with doubled-peaked profiles is observed;
m dust emission arc of France et al. (2007). Presumably as a
result of the interaction between HD 34078 and the ambient cloud, the
CO(2-1)/CO(1-0) ratio is anomalously large, pointing towards dense (103-104 cm-3) and warm (T > 12 K) emitting gas and further, a
remarkable kinematical
pattern with doubled-peaked profiles is observed;
- we confirm the reality of rapid, large amplitude (typically
10% yr-1) and correlated variations of N(CH) and N(CH+)
towards HD 34078.
The velocity ranges covered by CH and CH+ narrow absorption coincide
well with that of CO emission. Variations in CH and CH+ line
profiles are unambiguously detected; these occur mainly in the blue
part of the narrow absorption. A broad shallow and relatively stable
component is seen for both CH and CH+ in the interval [-4, 17 km s-1];
- comparison of LWRS and MDRS FUSE spectra reveals that the 7 LWRS
spectra available are significantly contaminated by diffuse light
from IC 405. The absence of variations in the LWRS profiles of H2 J=0 lines
yields a 3
 upper limit of 5% on N values, extending the
result of B05 over nearly four years (or 90 AU).
upper limit of 5% on N values, extending the
result of B05 over nearly four years (or 90 AU).
6 Discussion
Given the marked contrast between the stability of
![]() CH lines and
the rapid, large amplitude variations seen for CH and CH+ towards
HD 34078, we shall
assume in the following discussion that these variations can be
attributed entirely
to phenomena associated with the star/cloud interaction and not to small
scale structure in cold gas.
CH lines and
the rapid, large amplitude variations seen for CH and CH+ towards
HD 34078, we shall
assume in the following discussion that these variations can be
attributed entirely
to phenomena associated with the star/cloud interaction and not to small
scale structure in cold gas.
6.1 Towards a coherent picture of the close environment of HD 34078
From the broad set of observations available, a coherent scenario
emerges which can be summarized as follows. HD 34078 recently
encountered a molecular cloud, as originally suggested by
Herbig (1958). The stellar wind impacts the ambient material resulting
in a shell of compressed, highly excited gas. Modelling of both
the H2 excitation (B05) and CO emission (Sect. 2.2) provides
consistent estimates for the density in the shell,
![]() .
Dust grains located in this region are
directly exposed to the intense UV flux from the O star and strongly emit at
infrared wavelengths. Thus, both the mid-IR emission detected by
France et al. (2007) and the CO emission probably delineate the part of
the shell seen edge-on by the observer, accounting for the good
correlation between the
Spitzer 8 or 24
.
Dust grains located in this region are
directly exposed to the intense UV flux from the O star and strongly emit at
infrared wavelengths. Thus, both the mid-IR emission detected by
France et al. (2007) and the CO emission probably delineate the part of
the shell seen edge-on by the observer, accounting for the good
correlation between the
Spitzer 8 or 24 ![]() m arc and the CO map (Fig. 1).
m arc and the CO map (Fig. 1).
B05 favored a two-cloud model on the basis of the dichotomy in the
physical conditions derived for the highly excited H2 on the one hand and for all other molecular absorption on the other
hand. They discarded a single cloud model (although it would have
naturally explained the similar velocity for all absorption lines and the
presence of preexisting diffuse H2 near HD 34078 ...)
because they implicitly assumed that molecules
should be photodissociated at the very small distance (a few 0.01 pc)
implied by
the modelling of the H2 excitation. In fact, this argument is valid
only in a model that is stationary regarding the formation/destruction of
molecules. Given the large space velocity (![]() )
of
HD 34078, its arrival is so recent that probably no such steady-state
equilibrium could be established. Rather, as the O star is approaching the
cloud, a photoionisation and photodissociation front develops, moving at
velocities of the order of a few km s-1 only (Bertoldi & Draine 1996),
i.e. well below the star velocity. The distance between HD 34078 and
these fronts then gradually decreases and the velocity of the latter
becomes higher (the front velocities increase with stellar flux),
up to a point where the star and front velocities equate.
)
of
HD 34078, its arrival is so recent that probably no such steady-state
equilibrium could be established. Rather, as the O star is approaching the
cloud, a photoionisation and photodissociation front develops, moving at
velocities of the order of a few km s-1 only (Bertoldi & Draine 1996),
i.e. well below the star velocity. The distance between HD 34078 and
these fronts then gradually decreases and the velocity of the latter
becomes higher (the front velocities increase with stellar flux),
up to a point where the star and front velocities equate.
Moreover, the stellar wind has a strong mechanical impact on the surrounding gas and the latter is gradually set into motion as a result of momentum flux. When the star is close enough to the cloud, a stationary bow shock is established at a position nearly coincident with that of the photodissociation front. At this stage, the distance (R0 = AS, see Fig. 14) between the star and the apex of the shock is well defined and remains constant as long as the density of the ambient cloud and the wind properties (mass loss rate and terminal velocity) do not change. In this picture (Fig. 14), whether the dynamical steady-state regime is established or not, the molecular material located beyond the front/shock surface should be little affected by the presence of the closeby star, thereby accounting for the characteristics of the molecular components that B05 assigned to the ``translucent'' component.
| |
Figure 14:
Geometrical parameters associated with the
bow shock around HD 34078 (h is the apparent standoff distance;
|
| Open with DEXTER | |
We conclude that a model involving a single cloud located very close to
HD 34078 may, in fact, be consistent with all observations. A key issue
remains open however: at what stage of the
star-cloud interaction have we captured HD 34078 and its close environment?
A stationary dynamical regime is expected to be established
ultimately and in the
thin-shell limit, detailed models describing the
geometry and velocity structure of steady-state bow shocks are available
(e.g. Mac Low et al. 1991; van Buren et al. 1990; Wilkin 1996). We thus performed
a detailed comparison between the predictions of these models and
observations (Appendix B). From this analysis, we
conclude that the IR/CO arc does not display the properties expected for
a stationary bow shock and that we are possibly observing a ``nascent
bow shock'', i.e. the wind/cloud interaction at an early evolutionary
stage, well before the formation of a steady-state flow around the
star. We also find that the geometrical constraints provided by the IR
data,
![]() pc, are roughly consistent with the radiation
field implied by the modelling of H2 excitation (B05).
pc, are roughly consistent with the radiation
field implied by the modelling of H2 excitation (B05).
A variant of the above scenario is suggested by France et al. (2004), who
proposed that differential extinction is present
between HD 34078 and the surrounding diffuse emission,
in order to explain the increase of the diffuse to stellar ratio
at far-UV wavelengths.
More specifically, France et al. (2004) propose that a small clump lies in front of
HD 34078 (Fig. 15).
With an extent no larger that about 20
![]() ,
the latter could
induce the observed HD 34078 extinction without affecting the
surrounding nebular emission.
,
the latter could
induce the observed HD 34078 extinction without affecting the
surrounding nebular emission.
Such a picture is attractive in our context
because 20
![]() is approximately the size of the area over which
a ``dip'' is seen in the CO profiles, suggesting that the
double-peaked line shapes might be due to narrow absorption rather than
to velocity structure in the emitting gas. In this scenario,
CO emission could originate from the ambient cloud background to HD 34078
- especially its outer boundary, compressed by the wind - accounting for
the widespread emission seen over most of the field (Fig. 15).
Additional emission
could come from the clump itself, in particular from the region located
immediately beyond the hot PDR facing the star, explaining the enhanced
emission close to HD 34078 and the high excitation of the emitting material.
Gas located on the cold side of the clump facing the observer
should be little affected by the
interaction, as in the bow-shock scenario. This region corresponds to
the translucent component in B05's model; with a small CO excitation
temperature and low velocity dispersion, this gas could induce narrow
absorption in the background CO emission. The close similarity of the CO dip
velocity at the star position,
is approximately the size of the area over which
a ``dip'' is seen in the CO profiles, suggesting that the
double-peaked line shapes might be due to narrow absorption rather than
to velocity structure in the emitting gas. In this scenario,
CO emission could originate from the ambient cloud background to HD 34078
- especially its outer boundary, compressed by the wind - accounting for
the widespread emission seen over most of the field (Fig. 15).
Additional emission
could come from the clump itself, in particular from the region located
immediately beyond the hot PDR facing the star, explaining the enhanced
emission close to HD 34078 and the high excitation of the emitting material.
Gas located on the cold side of the clump facing the observer
should be little affected by the
interaction, as in the bow-shock scenario. This region corresponds to
the translucent component in B05's model; with a small CO excitation
temperature and low velocity dispersion, this gas could induce narrow
absorption in the background CO emission. The close similarity of the CO dip
velocity at the star position,
![]() (this value is
stable to within 0.2 km s-1 among spectra displaying the dip), and the
velocity of maximum narrow CH and CH+ absorption (see Fig. 10)
is consistent with absorption being responsible for the dip in CO
profiles. The clump should be located at a distance from the star of about
0.1 pc (comparable to that of point L2 in the bow-shock picture)
so that the hot PDR facing the star is exposed to a radiation field
large enough to account for the H2 excitation (Appendix B, B05). In
fact, the bow-shock and clump scenario are more or less equivalent, both
of them involving the presence along the line of sight of a shell of
dense gas illuminated by intense UV radiation; the main
difference is that in the clump picture, the ambient material is not
distributed in a continuous manner around HD 34078.
(this value is
stable to within 0.2 km s-1 among spectra displaying the dip), and the
velocity of maximum narrow CH and CH+ absorption (see Fig. 10)
is consistent with absorption being responsible for the dip in CO
profiles. The clump should be located at a distance from the star of about
0.1 pc (comparable to that of point L2 in the bow-shock picture)
so that the hot PDR facing the star is exposed to a radiation field
large enough to account for the H2 excitation (Appendix B, B05). In
fact, the bow-shock and clump scenario are more or less equivalent, both
of them involving the presence along the line of sight of a shell of
dense gas illuminated by intense UV radiation; the main
difference is that in the clump picture, the ambient material is not
distributed in a continuous manner around HD 34078.
![\begin{figure}
\par\includegraphics[width=9cm,clip]{0960fi15.ps}
\end{figure}](/articles/aa/full_html/2009/25/aa10960-08/img86.png) |
Figure 15:
Alternative scenario to the one presented in
Fig. 14. Here, HD 34078's wind slightly modifies
the shape of the ambient cloud boundary, giving rise to the IR arc.
The clump reddens the star but not the surrounding nebular emission;
further, gas located on its cold side (facing the observer) induces
narrow absorption in the
|
| Open with DEXTER | |
6.2 CH and CH+ abundance and time variations
In the picture described above (Fig. 14), the dense shell at the wind/cloud
interface is nearly static in the ambient cloud's frame and as
time elapses, the point (L2) at which the line of sight intersects
the shell drifts over the latter towards the apex (A) at a velocity
![]() ,
where
,
where ![]() is the transverse
velocity and
is the transverse
velocity and ![]() is the inclination of the
shell at L2. Similarly, in the clump scenario (Fig. 15), the line
of sight
drifts over the wind/clump interface. The rapid CH and CH+
variations observed imply that a significant fraction of these species
is enclosed in a very localised region (with a size of about 10 AU,
corresponding to a time interval of 6 months) and in our context, it is natural to assume
that time variations arise from structure over the shell of compressed
gas intersected by the line of sight. Further, as
already outlined by B05, the CH/H2 ratio towards HD 34078 is
anomalously large: for N(CH)
is the inclination of the
shell at L2. Similarly, in the clump scenario (Fig. 15), the line
of sight
drifts over the wind/clump interface. The rapid CH and CH+
variations observed imply that a significant fraction of these species
is enclosed in a very localised region (with a size of about 10 AU,
corresponding to a time interval of 6 months) and in our context, it is natural to assume
that time variations arise from structure over the shell of compressed
gas intersected by the line of sight. Further, as
already outlined by B05, the CH/H2 ratio towards HD 34078 is
anomalously large: for N(CH)
![]() (the largest values
reached, in 2000-2003) we get a ratio of
(the largest values
reached, in 2000-2003) we get a ratio of
![]() ,
which appears to be 3.7 times larger than the value inferred from the
best fit given by Sheffer et al. (2008) (a similar result is obtained by comparing HD 34078 values to those compiled by Welty et al. 2006).
Since the CH-H2 correlation is quite good, such a
deviation is very significant and indeed, in Fig. 8 presented by
Sheffer et al. (2008), HD 34078 is clearly an outlier (note that
surprisingly, HD 37903, the other star showing highly excited H2, has
an anomalously low CH/H2 ratio). The CH+/H2 ratio displays
much more scatter among all sightlines, but nevertheless, N(CH+)
towards HD 34078 is among the largest values for N(H2)
,
which appears to be 3.7 times larger than the value inferred from the
best fit given by Sheffer et al. (2008) (a similar result is obtained by comparing HD 34078 values to those compiled by Welty et al. 2006).
Since the CH-H2 correlation is quite good, such a
deviation is very significant and indeed, in Fig. 8 presented by
Sheffer et al. (2008), HD 34078 is clearly an outlier (note that
surprisingly, HD 37903, the other star showing highly excited H2, has
an anomalously low CH/H2 ratio). The CH+/H2 ratio displays
much more scatter among all sightlines, but nevertheless, N(CH+)
towards HD 34078 is among the largest values for N(H2)
![]() (Fig. 10 in Sheffer et al. 2008). In the end, the CH/CH+
ratio in HD 34078 is well within the range
observed towards other stars (cf. Fig. 10 in Welty et al. 2006). We
thus apparently have a comparable relative excess of both CH and CH+,
and again, it is natural
to assume that the overproduction of these species occurs in the
compressed shell. To induce such a large deviation in the CH/H2 ratio,
the overproduction of CH must be quite large since molecular
gas located beyond the shell probably displays a more standard ratio.
Similarly, the spatial
distribution of CH and CH+ over the shell must be very inhomogeneous
at scales of about 10 AU to induce the observed variations. Since the
CH and CH+ variations are strongly correlated, a single mechanism must
be at work to explain the overproduction of both species.
(Fig. 10 in Sheffer et al. 2008). In the end, the CH/CH+
ratio in HD 34078 is well within the range
observed towards other stars (cf. Fig. 10 in Welty et al. 2006). We
thus apparently have a comparable relative excess of both CH and CH+,
and again, it is natural
to assume that the overproduction of these species occurs in the
compressed shell. To induce such a large deviation in the CH/H2 ratio,
the overproduction of CH must be quite large since molecular
gas located beyond the shell probably displays a more standard ratio.
Similarly, the spatial
distribution of CH and CH+ over the shell must be very inhomogeneous
at scales of about 10 AU to induce the observed variations. Since the
CH and CH+ variations are strongly correlated, a single mechanism must
be at work to explain the overproduction of both species.
Clearly, the CH and CH+ time variations cannot be attributed
to pure density structure. Indeed, no corresponding changes have been
seen for N(H2) and further, explaining CH or CH+ variations by
more or less spherical clumps with a size of about 10 AU would require
very high volumic densities, n(H2)
![]() cm-3, as
argued by R03. In such
gas, CH+ would be rapidly destroyed by reactions with H2. Then, the
structure is likely to be more chemical in nature.
cm-3, as
argued by R03. In such
gas, CH+ would be rapidly destroyed by reactions with H2. Then, the
structure is likely to be more chemical in nature.
The production of CH+, which is not expected at
thermal equilibrium, together with the correlated variations of CH and
CH+, suggest that both molecules are mainly formed in the dense shell,
through a MHD shock where the drift velocity between ions and neutrals
triggers the formation
of both CH+ and CH (Pineau des Forêts et al. 1986; Flower & Pineau des Forêts 1998).
CH+ could also be overproduced at the interface between the ambient cloud and
warmer gas, as suggested by Duley et al. (1992), Crawford (1995) and more
recently by Lesaffre et al. (2007).
In the specific conditions prevailing around HD 34078, one may
imagine that Rayleigh-Taylor instabilities develop efficiently (e.g. as
a result of fluctuations in the wind properties or in the ambient
cloud), leading to the formation of a turbulent mixing layer with
pronounced small-scale structure. HD 34078 being variable
(Marchenko et al. 1998), stellar flux variations can also trigger or
amplify the formation of small-scale structure at the interface and in
the PDR. In regions hot enough to form significant amounts
of CH+ via the endoenergetic C+ + H2 reaction
(whatever the heating mechanism, shocks or turbulent dissipation),
small spatial temperature fluctuations will result in appreciable
variations in the CH+ formation rate and then in the relative
abundance of CH+ and CH (recall that CH is easily formed from
CH+ once the latter species is present).
One can indeed estimate that since the CH+ formation rate
scales as
![]() ,
a local variation as small as
22 K around
,
a local variation as small as
22 K around
![]() K is sufficient to induce a
fluctuation of 10% in the local abundance.
The broad, shallow CH and CH+ absorption components
(Fig. 10) could be a signature of the highly
turbulent velocity field at the
interface (note the excellent agreement in
the velocity intervals [-4 to 17 km s-1] covered by the CH and CH+ broad
components, indicating that the species responsible for that component
are cospatial).
K is sufficient to induce a
fluctuation of 10% in the local abundance.
The broad, shallow CH and CH+ absorption components
(Fig. 10) could be a signature of the highly
turbulent velocity field at the
interface (note the excellent agreement in
the velocity intervals [-4 to 17 km s-1] covered by the CH and CH+ broad
components, indicating that the species responsible for that component
are cospatial).
CH and CH+ line profiles vary mainly on their blue
side, at
![]()
![]() -5 km s-1(Fig. 10),
suggesting this velocity for
the gas lying at the interface near L2. This material is therefore
blue-shifted with respect to the ambient cloud (at
-5 km s-1(Fig. 10),
suggesting this velocity for
the gas lying at the interface near L2. This material is therefore
blue-shifted with respect to the ambient cloud (at
![]()
![]() km s-1); this is consistent with the stellar wind pushing
ambient molecular gas towards the observer. The higher excitation
derived for the CO component at
km s-1); this is consistent with the stellar wind pushing
ambient molecular gas towards the observer. The higher excitation
derived for the CO component at
![]()
![]() km s-1 also nicely fits
this view. Thus, the scenario described above might, at the same
time, explain in a coherent way the high abundances of CH and CH+
as well as their time variations.
km s-1 also nicely fits
this view. Thus, the scenario described above might, at the same
time, explain in a coherent way the high abundances of CH and CH+
as well as their time variations.
The amounts of excited H2 (J=3 to 5) and CH+ are known to correlate (Lambert & Danks 1986) and is taken as an indication that the same mechanism is responsible for these species, the production of which requires an input of additional energy of yet unknown nature. Towards HD 34078, a marked excess of both excited H2 and CH+ is observed, in agreement with the correlation seen among more standard lines of sight. We note that in our scenario, the large amount of excited H2 and CH+ is a direct consequence of the proximity of HD 34078, through its wind and UV flux.
6.3 Small scale structure in quiescent H
gas
In the picture that we propose, H2 gas located beyond the photodissociation front and shocked region is essentially unaffected by the presence of the star (dust grains should be somewhat warmer due to the proximity of the star, but at densities of a few 102 cm-3, this has little impact on the gas temperature). This part of the cloud gives by far the dominant contribution to the H2 column density in the J=0 level (in B05's model, the hot PDR represents less than 1% of the total Nvalue); it should also contain a significant fraction of the CO responsible for the UV absorption, about 1/4 of CH molecules (cf above) and most of the CN. Thus, the lack of variation in N(H2, J=0) at a level better than 5% implies that no marked small-scale density structure is present within the fraction of the ambient cloud probed by the drift of the line of sight between 2000 and 2004. If this region is representative of quiescent diffuse molecular material in general, the structure seen elsewhere for other tracers like H2CO, HCO+, and OH would be mainly ``chemical'' structure, possibly reflecting the specific formation/destruction processes relevant to these species.
We further note that the lack of structure in quiescent H2 gas is
consistent with the stability of CH absorption lines towards
![]() ,
provided the CH/H2 abundance ratio is uniform at scales of about 10 AU within this quiescent cloud.
,
provided the CH/H2 abundance ratio is uniform at scales of about 10 AU within this quiescent cloud.
7 Conclusions and prospects

- By mapping
 emission around HD 34078, we have unambiguously
shown that the molecular material seen in the foreground is closely
associated with the star, supporting the
suggestion by Herbig (1958) that HD 34078 is currently encountering
a molecular cloud. Repeated CH and CH+ observations, performed using the star
emission around HD 34078, we have unambiguously
shown that the molecular material seen in the foreground is closely
associated with the star, supporting the
suggestion by Herbig (1958) that HD 34078 is currently encountering
a molecular cloud. Repeated CH and CH+ observations, performed using the star
 as reference, confirm the reality of rapid and
large amplitude variations of N(CH) and N(CH+) along the line of sight.
as reference, confirm the reality of rapid and
large amplitude variations of N(CH) and N(CH+) along the line of sight.
-
- The results altogether strongly suggest that the recent arrival of
HD 34078 near the southern edge of a molecular cloud has given rise
to a shell of dense gas at the interface between the stellar wind and
H2 gas, the latter material belonging either to the distorted boundary
of the ambient cloud or to a small foreground clump, as suggested by
France et al. (2004). The location of this shell relative to the star is
consistent
with constraints derived from earlier modelling of H2 excitation. By
comparing the geometrical characteristics of the IR arc detected
by France et al. (2007) and the velocity field inferred from our CO
or optical observations to predictions of steady-state bow shock models,
we find that the latter are inconsistent with the observed
properties. Therefore, we may be seeing this region at an early phase
of the wind/cloud interaction, with a dense layer formed at the interface
but no stationary flow yet established.
-
- We propose that the large relative CH and CH+ abundances
originate from significant overproduction of CH+ in the dense shell, due to
the presence of a strong C-shock and/or of mixing of warm
ionised gas and highly excited molecular material at the wind/cloud
interface. The pronounced,
correlated CH and CH+ variations would then reflect marked chemical
structure in the dense shell, possibly resulting from instabilities
occuring at the interface.
-
- No variations of N(H2, J=0) have been found at a level of
5% (3
limit), extending the result obtained in B05 to a time
interval of 4 years, or 110 AU. In the scenario that we propose, J=0
H2 molecules are mainly located beyond the dense shell. This indicates that
beyond the photodissociation and photoionisation fronts, where the molecular
material is not yet affected by the interaction with HD 34078, no marked
small-scale scale structure is present and that the bulk of the mass is
distributed relatively uniformly within the cloud.
However, during its evolution towards a stationary dynamical regime, the velocity field must undergo a drastic variation to reach the steady-state solution. CO mm observations, which provide excellent spectral resolution, might thus reveal significant velocity changes. A higher spatial resolution map of CO emission would be useful in this regard and of great help to better understand the kinematics underlying the remarkable pattern observed for line profiles in Fig. 1. In the next decade, ALMA will offer excellent opportunities for such observations. Numerical simulations of the time evolution of the wind/cloud interface (which, to our knowledge are not available) would also be very useful to indicate how the evolution of the velocity field will proceed in the early phase.
In the above reasoning, we implicitly assumed that the dense shell will smoothly evolve towards the steady-state solution but this is in no way evident. If indeed instabilities develop efficiently at the interface (as suggested by CH and CH+ variations), the cloud may simply be gradually destroyed as the star moves. Such a picture would be consistent with the suggestion by Herbig (1958) that the absence of IS material south of the star is due to ``clearing'' along the path followed by HD 34078 in the past (the clump involved in the second scenario might then simply be a fragment of the initial cloud in the process of photoevaporation).
Focusing now on the present state of HD 34078's environment, we note that it represents a remarkable PDR and shock for which many observational constraints are or might be available, thanks to the presence of a background UV-bright star. Geometrical parameters are now well determined and physical conditions in the ambient cloud relatively well constrained (sensitive CO emission observations further away from HD 34078 would allow us to better characterize them and verify that the peculiar excitation conditions determined in Sect. 2.2 are specific to the immediate vicinity of the star). Then, the HD 34078 PDR may be used as a reference to test our understanding of various physical and chemical processes occuring elsewhere at cloud interfaces subject to less extreme conditions.
Acknowledgements
We warmly thank observers at OHP and S. Ilovaisky in particular for spectra taken there with ELODIE and SOPHIE as well as J. Krelowski, G. Galazutdinov, F. Musaev and A. Bondar for collecting the Terskol, BOAO and Calar Alto spectra. We are also indebted to M. Gerin and L. Pagani for their assistance in the preparation of IRAM observations, to J. M. Désert for help in the FUSE data reduction, and to K. France for providing the Spitzer 24
Appendix A: The contribution of the IC 405 nebula to HD 34078 spectra
France et al. (2004) observed the diffuse emission from IC 405 at four
positions (their Pos1 to Pos4), two of which (Pos1 and Pos2)
are located close to the HD 34078 position
(75
![]() offset, E and W respectively).
Thus, diffuse emission is certainly present towards
HD 34078 itself and may contribute significantly to the flux collected
in the FUSE apertures. To estimate this contribution, we retrieved from the
FUSE database the spectra obtained at Pos1 to Pos4 (cf. Fig. 1
from France et al. 2004). Pos2 is the brightest region; around 1050 Å, the
surface brightness is about 30% larger than at Pos1, indicating
spatial variations of this emission. Since Pos1 and Pos2 are
symetrically located
with respect to HD 34078, a first order estimate of the diffuse flux
towards the star is the average of Pos1 and
Pos2 spectra. We thus estimate that the diffuse flux received in the
LWRS aperture is about 7% of the HD 34078 flux around
offset, E and W respectively).
Thus, diffuse emission is certainly present towards
HD 34078 itself and may contribute significantly to the flux collected
in the FUSE apertures. To estimate this contribution, we retrieved from the
FUSE database the spectra obtained at Pos1 to Pos4 (cf. Fig. 1
from France et al. 2004). Pos2 is the brightest region; around 1050 Å, the
surface brightness is about 30% larger than at Pos1, indicating
spatial variations of this emission. Since Pos1 and Pos2 are
symetrically located
with respect to HD 34078, a first order estimate of the diffuse flux
towards the star is the average of Pos1 and
Pos2 spectra. We thus estimate that the diffuse flux received in the
LWRS aperture is about 7% of the HD 34078 flux around
![]() Å (this fraction decreases with wavelength since the diffuse to
stellar flux ratio gets lower at longer wavelengths, as discussed by France et al. 2004).
If the surface brightness is locally uniform over the LWRS
aperture centred on HD 34078's position, the contribution of diffuse
emission scales linearly with aperture size and should be about 11 times
lower in MDRS spectra. Thus, while LWRS spectra of HD 34078 are
significantly affected by diffuse emission, the MDRS spectrum should be
essentially free of such ``pollution'', except possibly at the shortest wavelengths.
Å (this fraction decreases with wavelength since the diffuse to
stellar flux ratio gets lower at longer wavelengths, as discussed by France et al. 2004).
If the surface brightness is locally uniform over the LWRS
aperture centred on HD 34078's position, the contribution of diffuse
emission scales linearly with aperture size and should be about 11 times
lower in MDRS spectra. Thus, while LWRS spectra of HD 34078 are
significantly affected by diffuse emission, the MDRS spectrum should be
essentially free of such ``pollution'', except possibly at the shortest wavelengths.
To estimate the impact on HD 34078's LWRS spectra of the contamination by diffuse emission, one needs to examine the spectrum of the latter (the Pos1 spectrum is displayed in Fig. 7 from France et al. 2004). Although its S/N ratio is limited, it is clear that it differs from that of HD 34078 in two respects. First, narrow lines appear to be fainter and shallower (only the strongest lines are detected); this is due, at least in part, to the lower effective resolution implied by the extented nature of the source. Second, broad H2 lines are narrower, indicating that the average pathlength of scattered photons through the molecular gas is shorter than that followed by direct HD 34078 photons. These two properties of diffuse emission qualitatively explain the peculiarities of the 8th spectrum and indeed, one finds that by combining it and our estimate of the diffuse emission spectrum towards HD 34078, it is possible to reproduce spectra 1 to 7 fairly well. We conclude that the apparent changes in the 8th spectrum can be attributed mainly to a smaller contribution of diffuse emission due to the use of MRDS instead of LWRS in the earlier spectra.
Appendix B: The steady-state bow shock model compared to observations
Extensive work has been performed to describe the geometry and velocity structure of steady-state bow shocks (e.g. Mac Low et al. 1991; van Buren et al. 1990; Wilkin 1996) and in the thin-shell limit, there are simple analytical predictions that can be directly compared to observations.
B.1 Shape and radius of the shell
Assuming that the IR arc detected by France et al. (2007) corresponds
to a steady-state bow shock viewed in projection onto the sky, we can
first check whether the apparent geometrical properties are consistent
with the predicted ones.
At first sight, the distance between the star and the apex of the bow
shock looks too small compared to its radius of curvature on the
Spitzer image but we have to
account for projection effects which somewhat influence the appearence
of the arc. HD 34078's tangential and
radial components (![]() and
and ![]() respectively) are well constrained
by observations; we adopt
respectively) are well constrained
by observations; we adopt
![]() and
and
![]() (in the LSR system; we remeasured the latter value from our
own visible spectra). The velocity vector is then inclined by an angle
(in the LSR system; we remeasured the latter value from our
own visible spectra). The velocity vector is then inclined by an angle
![]() with respect to the plane of the sky (Fig. 14).
with respect to the plane of the sky (Fig. 14).
To estimate the impact of projection effects on the
![]() ratio, where h is the apparent standoff distance (
ratio, where h is the apparent standoff distance (
![]() -20
-20
![]() after France et al. 2007, we adopt h/D=15
after France et al. 2007, we adopt h/D=15
![]() with D = 530 pc, the distance to HD 34078) and
with D = 530 pc, the distance to HD 34078) and
![]() is the radius of curvature of the arc as seen in projection on the sky (
is the radius of curvature of the arc as seen in projection on the sky (
![]() 37
37
![]() ), we approximate the bow shock geometry by a paraboloid (van Buren et al. 1990; Wilkin 1996) and find after some algebra that
), we approximate the bow shock geometry by a paraboloid (van Buren et al. 1990; Wilkin 1996) and find after some algebra that
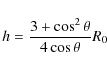 |
(B.1) |
and
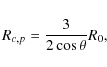 |
(B.2) |
where R0 is the distance between the star (S) and the apex (A) of the shock. With
Although the observed arc shape is not well fitted by the model
prediction, the IR data can nevertheless be used to get a rough estimate
of the distance between the star and the point where
the line of sight intersects the shell (L2 in Fig. 14),
by making the reasonable
assumption that the latter is axially symmetric. From the 24 ![]() m
map, we estimate that
m
map, we estimate that
![]()
![]() ,
implying d
=0.10 pc. Is this value compatible with the UV flux necessary to explain
the amount of highly excited H2? B05 found that a radiation
field about 104 larger than that in the local ISM is required, which
is obtained at 0.2 pc from the
HD 34078, a value in reasonable agreement with our estimate for
d(S,L2).
,
implying d
=0.10 pc. Is this value compatible with the UV flux necessary to explain
the amount of highly excited H2? B05 found that a radiation
field about 104 larger than that in the local ISM is required, which
is obtained at 0.2 pc from the
HD 34078, a value in reasonable agreement with our estimate for
d(S,L2).
B.2 Momentum balance and ambient density
In steady-state, the standoff distance, R0, is set by a momentum balance
equation (Eq. (2) in van Buren et al. 1990; Eq. (1) in Wilkin 1996) which is
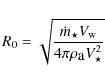 |
(B.3) |
where
Since
![]() scales linearly with
scales linearly with
![]() ,
one
may wonder whether the mass loss rate has been underestimated. Prior to
the study by Martins et al. (2005), the adopted value for HD 34078 was
10-6.6
,
one
may wonder whether the mass loss rate has been underestimated. Prior to
the study by Martins et al. (2005), the adopted value for HD 34078 was
10-6.6 ![]() yr-1 (i.e. larger by a factor of 800 than the present estimate)
and even with this much higher rate, the required ambient density would
amount only to
yr-1 (i.e. larger by a factor of 800 than the present estimate)
and even with this much higher rate, the required ambient density would
amount only to
![]() .
The much lower recent mass loss
estimate is based on the availability of UV lines (C IV
.
The much lower recent mass loss
estimate is based on the availability of UV lines (C IV ![]() 1550
mainly) which better probe
weak winds; the uncertainty on the revised value is estimated to be of
a factor of about 3 (F. Martins; private communication). Then,
1550
mainly) which better probe
weak winds; the uncertainty on the revised value is estimated to be of
a factor of about 3 (F. Martins; private communication). Then,
![]() cannot have been underestimated by a factor large enough
to explain the discrepancy between the observed and theoretical
steady-state R0 values.
cannot have been underestimated by a factor large enough
to explain the discrepancy between the observed and theoretical
steady-state R0 values.
Stationary bow shock models also provide specific predictions for the mass
surface density or equivalently the column density
![]() of swept-up
material trapped in the bow shock (cf. Eq. (7) from van Buren et al.
1990; or Eq. (12) from Wilkin 1996).
of swept-up
material trapped in the bow shock (cf. Eq. (7) from van Buren et al.
1990; or Eq. (12) from Wilkin 1996).
![]() scales as
scales as
![]() and with the values quoted above, we get
and with the values quoted above, we get
![]() .
This prediction is to be compared to
the H column density in the hot PDR component of B05:
.
This prediction is to be compared to
the H column density in the hot PDR component of B05:
![]() ,
including H2 only (their Table 4). Note that their
exceedingly large predicted value for the H I column density was due to the
assumption of steady-state equilibrium for the photodissociation of
H2; in our scenario, this assumption is no longer realistic.
The observed value corresponds to the dense material along the line of
sight to HD 34078 (i.e. located at L2 in Fig. 14) while the
``theoretical'' one refers to the apex position (A in Fig. 14).
This does not make a large difference however since Wilkin's results
(his Fig. 4) indicate that the surface density normal to the bow
shock varies slowly with position away from the apex. One should also
consider that in the geometry of Fig. 14, the shell is not crossed
normally by the line of sight but with an inclication angle
,
including H2 only (their Table 4). Note that their
exceedingly large predicted value for the H I column density was due to the
assumption of steady-state equilibrium for the photodissociation of
H2; in our scenario, this assumption is no longer realistic.
The observed value corresponds to the dense material along the line of
sight to HD 34078 (i.e. located at L2 in Fig. 14) while the
``theoretical'' one refers to the apex position (A in Fig. 14).
This does not make a large difference however since Wilkin's results
(his Fig. 4) indicate that the surface density normal to the bow
shock varies slowly with position away from the apex. One should also
consider that in the geometry of Fig. 14, the shell is not crossed
normally by the line of sight but with an inclication angle ![]() ,
but this involves a factor of at most a few. Obviously, this cannot
explain the large discrepancy between the two values above.
,
but this involves a factor of at most a few. Obviously, this cannot
explain the large discrepancy between the two values above.
In the 24 ![]() m map, the arc defines a roughly hemispherical cavity (with
a radius of about
m map, the arc defines a roughly hemispherical cavity (with
a radius of about
![]() )
and one can easily get another estimate for the
column density in the compressed shell by simply assuming that material
from the ambient cloud (i.e. with n=500 cm-3) initially filling this
cavity has been swept by the stellar wind to form the present
shell. This leads to a column density of
)
and one can easily get another estimate for the
column density in the compressed shell by simply assuming that material
from the ambient cloud (i.e. with n=500 cm-3) initially filling this
cavity has been swept by the stellar wind to form the present
shell. This leads to a column density of
![]() and
interestingly, this expression provides a value,
and
interestingly, this expression provides a value,
![]() cm-2, comparable to the
estimate of B05 for the hot PDR component.
cm-2, comparable to the
estimate of B05 for the hot PDR component.
B.3 Velocity field of the compressed gas
Another way to assess whether a steady-state bow-shock model is consistent
with our data is to compare the observed and predicted velocity fields.
Since
![]() emission traces dense gas within the shell of compressed gas,
our CO data can be used to constrain the velocity field around HD 34078.
One may wonder in particular, whether the double-peaked profiles with their
remarkable symmetry properties (Fig. 1) simply arise from the fact that the
IRAM beam intersects the paraboloidal wind/cloud interface twice. To
compute a ``synthetic''
emission traces dense gas within the shell of compressed gas,
our CO data can be used to constrain the velocity field around HD 34078.
One may wonder in particular, whether the double-peaked profiles with their
remarkable symmetry properties (Fig. 1) simply arise from the fact that the
IRAM beam intersects the paraboloidal wind/cloud interface twice. To
compute a ``synthetic''
![]() emission map, we adapted the model developed
by Pety et al. (2006) to describe the outflow around HH30. We relied on
the analytical expressions provided by Wilkin (1996) for the geometry,
velocity field and mass surface density (see also van Buren & Mac Low 1992),
with the parameter values considered above. For practical reasons, the
thickness of the boundary layer has been assumed to be R0/20 (while it
is zero in Wilkin's model) and the absolute surface mass density has been
scaled so as to reproduce the observed intensity. The underlying assumption
is that the medium is optically thin which is reasonable given the
strength of the CO emission. The resulting signal model was convolved with
the IRAM-30 m 230 GHz beam, an important step given the beam size relative
to the source extent. Finally, in order to assess whether a specific model
is acceptable or not, we compared the synthetized and observed maps of
spectra as well as position-velocity and channel maps.
emission map, we adapted the model developed
by Pety et al. (2006) to describe the outflow around HH30. We relied on
the analytical expressions provided by Wilkin (1996) for the geometry,
velocity field and mass surface density (see also van Buren & Mac Low 1992),
with the parameter values considered above. For practical reasons, the
thickness of the boundary layer has been assumed to be R0/20 (while it
is zero in Wilkin's model) and the absolute surface mass density has been
scaled so as to reproduce the observed intensity. The underlying assumption
is that the medium is optically thin which is reasonable given the
strength of the CO emission. The resulting signal model was convolved with
the IRAM-30 m 230 GHz beam, an important step given the beam size relative
to the source extent. Finally, in order to assess whether a specific model
is acceptable or not, we compared the synthetized and observed maps of
spectra as well as position-velocity and channel maps.
Several difficulties arised when comparing the model to observations.
First, the extent of the
![]() emission tends to be too limited if one
adopts R0/D = 15 arcsec. This is related to the fact that the expected
radius of curvature is too small for such a R0 value, as compared to the
observed one (cf. above). Since here we are mainly interested in the
velocity field, we simply adjusted R0 so as to match the observed extent
of the emission. Second, the velocity range over which
emission tends to be too limited if one
adopts R0/D = 15 arcsec. This is related to the fact that the expected
radius of curvature is too small for such a R0 value, as compared to the
observed one (cf. above). Since here we are mainly interested in the
velocity field, we simply adjusted R0 so as to match the observed extent
of the emission. Second, the velocity range over which
![]() emission
appears in the model is much larger than the observed one. Indeed, the
velocity field of the gas scales linearly with
emission
appears in the model is much larger than the observed one. Indeed, the
velocity field of the gas scales linearly with ![]() :
in particular, the
typical separation
:
in particular, the
typical separation ![]() between the two CO emission peaks near
HD 34078's position should be of the order of 0.7
between the two CO emission peaks near
HD 34078's position should be of the order of 0.7 ![]() while we observe
only 0.02
while we observe
only 0.02 ![]() (corresponding to about 2 km s-1). Artificially modifying the
star's velocity to the former value allows us to qualitatively reproduce the
emission properties close to the star. However, the double-peaked
character of the model profiles tend to be less pronounced that in the
observed ones. Other velocity/density distributions might be considered to get
a better fit, but clearly, only higher spatial resolution observations
would allow us to obtain unambiguous constraints on such models.
(corresponding to about 2 km s-1). Artificially modifying the
star's velocity to the former value allows us to qualitatively reproduce the
emission properties close to the star. However, the double-peaked
character of the model profiles tend to be less pronounced that in the
observed ones. Other velocity/density distributions might be considered to get
a better fit, but clearly, only higher spatial resolution observations
would allow us to obtain unambiguous constraints on such models.
Another constraint can be obtained from optical absorption lines arising towards
HD 34078. With the parameters quoted above, the expected velocity of
the gas from the shell along the sightline to HD 34078 (i.e. at L2)
is
![]() km s-1. Such a shift between highly
excited H2 lines (tracing the dense layer) and absorption from
species located beyond the shell would be easily detectable, but B05
failed to find any significant velocity difference between the two
components.
km s-1. Such a shift between highly
excited H2 lines (tracing the dense layer) and absorption from
species located beyond the shell would be easily detectable, but B05
failed to find any significant velocity difference between the two
components.
To summarize, the dense shell at the stellar wind/molecular cloud
interface (with a density of about
![]() and column density
and column density
![]() ,
thus corresponding to a thickness
of
,
thus corresponding to a thickness
of ![]() 10-3 pc) is located at a distance of the star that is consistent
with the excitation of H2 but it does not display the properties
expected for a steady-state bow shock:
i) the arc is not curved enough; ii) the shell is too far from the star
for the momentum balance to be satisfied; iii) the amount of material
swept up by the wind is too large
and iv) the velocity field shows
very little deviation from the ambient value. The limited extent and
somewhat irregular geometry of the arc are additional indications against a
steady-state bow shock.
10-3 pc) is located at a distance of the star that is consistent
with the excitation of H2 but it does not display the properties
expected for a steady-state bow shock:
i) the arc is not curved enough; ii) the shell is too far from the star
for the momentum balance to be satisfied; iii) the amount of material
swept up by the wind is too large
and iv) the velocity field shows
very little deviation from the ambient value. The limited extent and
somewhat irregular geometry of the arc are additional indications against a
steady-state bow shock.
References
- Allen, M. M. 1994, ApJ, 424, 754 [NASA ADS] [CrossRef]
- Baranne, A., Queloz, D., Mayor, M., et al. 1996, A&AS, 119, 373 [NASA ADS] [CrossRef] [EDP Sciences] (In the text)
- Bertoldi, F., & Draine, B. T. 1996, ApJ, 458, 222 [NASA ADS] [CrossRef] (In the text)
- Boissé, P., Le Petit, F., Rollinde, E., et al. 2005, A&A, 429, 509 [NASA ADS] [CrossRef] [EDP Sciences] (BO5) (In the text)
- Bouchy, F., & The Sophie Team. 2006, in Tenth Anniversary of 51 Peg-b: Status of and prospects for hot Jupiter studies, ed. L. Arnold, F. Bouchy, & C. Moutou, 319 (In the text)
- Crane, P., Hegyi, D. J., & Lambert, D. L. 1991, ApJ, 378, 181 [NASA ADS] [CrossRef] (In the text)
- Crane, P., Lambert, D. L., & Sheffer, Y. 1995, ApJS, 99, 107 [NASA ADS] [CrossRef]
- Crawford, I. A. 1995, MNRAS, 277, 458 [NASA ADS]
- Crawford, I. A. 2003, Ap&SS, 285, 661 [NASA ADS] [CrossRef]
- Deshpande, A. A. 2007, in SINS - Small Ionized and Neutral Structures in the Diffuse Interstellar Medium, ed. M. Haverkorn & W. M. Goss, ASP Conf. Ser., 365, 105
- Duley, W. W., Hartquist, T. W., Sternberg, A., Wagenblast, R., & Williams, D. A. 1992, MNRAS, 255, 463 [NASA ADS] (In the text)
- Falgarone, E., Panis, J.-F., Heithausen, A., et al. 1998, A&A, 331, 669 [NASA ADS]
- Federman, S. R., Strom, C. J., Lambert, D. L., et al. 1994, ApJ, 424, 772 [NASA ADS] [CrossRef] (In the text)
- Flower, D. R., & Pineau des Forêts, G. 1998, MNRAS, 297, 1182 [NASA ADS] [CrossRef]
- Frail, D. A., Weisberg, J. M., Cordes, J. M., & Mathers, C. 1994, ApJ, 436, 144 [NASA ADS] [CrossRef]
- France, K., McCandliss, S. R., Burgh, E. B., & Feldman, P. D. 2004, ApJ, 616, 257 [NASA ADS] [CrossRef] (In the text)
- France, K., McCandliss, S. R., & Lupu, R. E. 2007, ApJ, 655, 920 [NASA ADS] [CrossRef] (In the text)
- Galazutdinov, G. A., Han, I., & Kreowski, J. 2005, ApJ, 629, 299 [NASA ADS] [CrossRef] (In the text)
- Heiles, C. 1997, ApJ, 481, 193 [NASA ADS] [CrossRef]
- Herbig, G. H. 1958, PASP, 70, 468 [NASA ADS] [CrossRef] (In the text)
- Hilton, J., & Lahulla, J. F. 1995, A&AS, 113, 325 [NASA ADS] (In the text)
- Hily-Blant, P., & Falgarone, E. 2007, A&A, 469, 173 [NASA ADS] [CrossRef] [EDP Sciences] (In the text)
- Hoogerwerf, R., de Bruijne, J. H. J., & de Zeeuw, P. T. 2001, A&A, 365, 49 [NASA ADS] [CrossRef] [EDP Sciences] (In the text)
- Lambert, D. L., & Danks, A. C. 1986, ApJ, 303, 401 [NASA ADS] [CrossRef] (In the text)
- Lauroesch, J. T. 2007, in SINS - Small Ionized and Neutral Structures in the Diffuse Interstellar Medium, ed. M. Haverkorn & W. M. Goss, ASP Conf. Ser., 365, 40
- Lesaffre, P., Gerin, M., & Hennebelle, P. 2007, A&A, 469, 949 [NASA ADS] [CrossRef] [EDP Sciences] (In the text)
- Lien, D. J. 1984, ApJ, 284, 578 [NASA ADS] [CrossRef] (In the text)
- Liszt, H., & Lucas, R. 2000, A&A, 355, 333 [NASA ADS]
- Liszt, H. S., & Lucas, R. 1998, A&A, 339, 561 [NASA ADS]
- Mac Low, M.-M., van Buren, D., Wood, D. O. S., & Churchwell, E. 1991, ApJ, 369, 395 [NASA ADS] [CrossRef]
- Marchenko, S. V., Moffat, A. F. J., van der Hucht, K. A., et al. 1998, A&A, 331, 1022 [NASA ADS] (In the text)
- Martins, F., Schaerer, D., Hillier, D. J., et al. 2005, A&A, 441, 735 [NASA ADS] [CrossRef] [EDP Sciences] (In the text)
- McLachlan, A., & Nandy, K. 1984, MNRAS, 207, 355 [NASA ADS] (In the text)
- Meyer, D. M., Lauroesch, J. T., Sofia, U. J., Draine, B. T., & Bertoldi, F. 2001, ApJ, 553, L59 [NASA ADS] [CrossRef] (In the text)
- Moore, E. M., & Marscher, A. P. 1995, ApJ, 452, 671 [NASA ADS] [CrossRef]
- Pellerin, A., Fullerton, A. W., Robert, C., et al. 2002, ApJS, 143, 159 [NASA ADS] [CrossRef] (In the text)
- Pety, J., Gueth, F., Guilloteau, S., & Dutrey, A. 2006, A&A, 458, 841 [NASA ADS] [CrossRef] [EDP Sciences] (In the text)
- Pety, J., Lucas, R., & Liszt, H. S. 2008, ArXiv e-prints, 808
- Pfeiffer, M. J., Frank, C., Baumueller, D., Fuhrmann, K., & Gehren, T. 1998, A&AS, 130, 381 [NASA ADS] [CrossRef] [EDP Sciences] (In the text)
- Pichon, C., Vergely, J. L., Rollinde, E., Colombi, S., & Petitjean, P. 2001, MNRAS, 326, 597 [NASA ADS] [CrossRef] (In the text)
- Pineau des Forêts, G., Flower, D. R., Hartquist, T. W., & Dalgarno, A. 1986, MNRAS, 220, 801 [NASA ADS]
- Rollinde, E., Boissé, P., Federman, S. R., & Pan, K. 2003, A&A, 401, 215 [NASA ADS] [CrossRef] [EDP Sciences] (R03) (In the text)
- Schuster, K.-F., Boucher, C., Brunswig, W., et al. 2004, A&A, 423, 1171 [NASA ADS] [CrossRef] [EDP Sciences] (In the text)
- Sheffer, Y., Rogers, M., Federman, S. R., et al. 2008, ArXiv e-prints, 807 (In the text)
- van Buren, D., & Mac Low, M.-M. 1992, ApJ, 394, 534 [NASA ADS] [CrossRef] (In the text)
- van Buren, D., Mac Low, M.-M., Wood, D. O. S., & Churchwell, E. 1990, ApJ, 353, 570 [NASA ADS] [CrossRef]
- van Buren, D., Noriega-Crespo, A., & Dgani, R. 1995, AJ, 110, 2914 [NASA ADS] [CrossRef] (In the text)
- Weisberg, J. M., & Stanimirovic, S. 2007, in SINS - Small Ionized and Neutral Structures in the Diffuse Interstellar Medium, ed. M. Haverkorn & W. M. Goss, ASP Conf. Ser., 365, 28
- Welty, D. E. 2007, ApJ, 668, 1012 [NASA ADS] [CrossRef]
- Welty, D. E., Federman, S. R., Gredel, R., Thorburn, J. A., & Lambert, D. L. 2006, ApJS, 165, 138 [NASA ADS] [CrossRef] (In the text)
- Welty, D. E., Simon, T., & Hobbs, L. M. 2008, MNRAS, 388, 323 [NASA ADS] [CrossRef]
- Wilkin, F. P. 1996, ApJ, 459, L31 [NASA ADS] [CrossRef]
Footnotes
- ... shock?
- Based on observations made mainly at IRAM, Observatoire de Haute Provence (France), McDonald Observatory (USA) and with FUSE.
All Tables
Table 1:
Observation parameters. The projection center of all the data
is:
![]() ,
,
![]() .
.
Table 2: List of observations and measured CH and CH+ equivalent widths (in mÅ; uncertainties as estimated in Sect. 3.2.1 are given in upper index).
All Figures
| |
Figure 1:
12CO(2-1) spectra overlaid on the MIPS
24 |
| Open with DEXTER | |
| In the text | |
| |
Figure 2:
The integrated 12CO(2-1) emission (contours) overlaid on the MIPS
24 |
| Open with DEXTER | |
| In the text | |
| |
Figure 3: Channel maps of the 12CO(2-1) emission averaged over an interval of 0.41 km s-1(the value in the upper left corner is the center of the velocity interval considered). Each panel corresponds to the region shown in Fig. 1. The first contour level and spacing between successive contours is 3.5 mK. |
| Open with DEXTER | |
| In the text | |
| |
Figure 4:
Emission spectra of 12CO(1-0) (grey scale histogram) and
|
| Open with DEXTER | |
| In the text | |
| |
Figure 5:
Equivalent widths of CH |
| Open with DEXTER | |
| In the text | |
| |
Figure 6:
Same as in Fig. 5 but for the equivalent widths of CH+ |
| Open with DEXTER | |
| In the text | |
| |
Figure 7:
Equivalent width of CH |
| Open with DEXTER | |
| In the text | |
| |
Figure 8: Equivalent width versus column density for high resolution observations (McDonald). CH (filled squares) and CH+ (empty squares) absorption lines span different ranges in opacity which helps to constrain the best linear fit (dotted line: y = -15.232 + 0.676 x). A curve of growth with b=3.2 km s-1 also provides a good fit to the data (plain line; the two additional lines correspond to b=2.8 and b=3.5 km s-1 and bracket the data points well). The large b curve (i.e. optically thin limit) is shown (dashed line). |
| Open with DEXTER | |
| In the text | |
| |
Figure 9:
Evolution of the CH and CH+ column densities
with time. The solid thick lines show the long-term evolution obtained after
smoothing using a Gaussian window with a FWHM of one year (dashed
lines indicate
|
| Open with DEXTER | |
| In the text | |
| |
Figure 10:
Comparison of McD CH |
| Open with DEXTER | |
| In the text | |
| |
Figure 11:
Comparison of the HD 34078 OHP spectra obtained in February
2007 (thick line) and February 2008 (thin line) for the CH |
| Open with DEXTER | |
| In the text | |
| |
Figure 12: Comparison of the FUSE spectra obtained in January 2000 (LWRS, thick line) and October 2004 (MDRS, thin line) in the region around 1050 Å (v and J values for the lower level of each H2 transition are indicated; the HD line is from J=0). In the MDRS spectrum, narrow lines tend to appear deeper and the damped (0, 0) and (0, 1) features slightly broader. |
| Open with DEXTER | |
| In the text | |
| |
Figure 13:
FUSE LWRS HD 34078 spectra near the 1050 Å broad (4-0) H2
Lyman band.
Upper panel: all epochs, after flux intercalibration and
alignment (see text). The mean spectrum is shown (thick line); tick
marks indicate the features shown in Fig. 12 (two are from H2, the
third is from Ar I).
Lower panel: difference between the spectrum for each epoch
and the mean spectrum
(epochs 1 to 7, shifted from top to bottom for clarity; same scale as
in the upper panel).
The dashed line shows the 3 |
| Open with DEXTER | |
| In the text | |
| |
Figure 14:
Geometrical parameters associated with the
bow shock around HD 34078 (h is the apparent standoff distance;
|
| Open with DEXTER | |
| In the text | |
| |
Figure 15:
Alternative scenario to the one presented in
Fig. 14. Here, HD 34078's wind slightly modifies
the shape of the ambient cloud boundary, giving rise to the IR arc.
The clump reddens the star but not the surrounding nebular emission;
further, gas located on its cold side (facing the observer) induces
narrow absorption in the
|
| Open with DEXTER | |
| In the text | |
Copyright ESO 2009
Current usage metrics show cumulative count of Article Views (full-text article views including HTML views, PDF and ePub downloads, according to the available data) and Abstracts Views on Vision4Press platform.
Data correspond to usage on the plateform after 2015. The current usage metrics is available 48-96 hours after online publication and is updated daily on week days.
Initial download of the metrics may take a while.