| Issue |
A&A
Volume 500, Number 3, June IV 2009
|
|
|---|---|---|
| Page(s) | 1119 - 1129 | |
| Section | Interstellar and circumstellar matter | |
| DOI | https://doi.org/10.1051/0004-6361/200811065 | |
| Published online | 16 April 2009 | |
Millimeter-wave survey of molecular clouds around the W5-East triggered star-forming region
T. Niwa1,![]() - K. Tachihara2 - Y. Itoh1 - Y. Oasa1 - K. Sunada3 - K. Sugitani4 - T. Mukai1
- K. Tachihara2 - Y. Itoh1 - Y. Oasa1 - K. Sunada3 - K. Sugitani4 - T. Mukai1
1 - Graduate School of Science and Technology, Kobe University,
1-1, Rokkodai, Nada, Kobe, Hyogo 657-8501, Japan
2 - National Astronomical Observatory of Japan,
2-21-1, Osawa, Mitaka, Tokyo 181-8588, Japan
3 - Mizusawa VERA Observatory, National Astronomical Observatory of Japan,
2-12, Hoshi-ga-oka, Mizusawa-ku, Oshu-shi, Iwate 023-0861, Japan
4 - Graduate School of Natural Sciences, Nagoya City University,
Mizuho, Mizuho, Nagoya, Aichi 467-8501, Japan
Received 1 October 2008 / Accepted 16 March 2009
Abstract
Aims. We examined the physical properties of molecular clouds (morphology, column density, number density, mass) to investigate the mechanism of triggered star formation by UV radiation from a massive star.
Methods. We made extensive, high-resolution maps of molecular clouds associated and interacting with the W5-East H II region using the 45-m telescope at the Nobeyama Radio Observatory (
![]() )
in 13CO (J=1-0) and C 18O (J=1-0) to reveal details in the high-density regions of the molecular clouds. In addition, to investigate the spatial distributions of young stellar objects (YSOs) in the W5-East H II region, we mapped the spatial distributions of Class I and II candidates.
)
in 13CO (J=1-0) and C 18O (J=1-0) to reveal details in the high-density regions of the molecular clouds. In addition, to investigate the spatial distributions of young stellar objects (YSOs) in the W5-East H II region, we mapped the spatial distributions of Class I and II candidates.
Results. We identified eight 13CO molecular clouds (three of them are known bright-rimmed clouds) and nine C 18O clumps. The masses of the clouds and clumps range from 460 to 36 000 ![]() and from 55 to 740
and from 55 to 740 ![]() ,
respectively. The peak 13CO column densities of the clouds facing the H II region are twice as large as the others. They have steep density gradients toward the H II region, indicating interactions with the H II region. We selected 55 Class I candidates and 778 Class II candidates associated with the W5-East H II region from the previous Spitzer IRAC/MIPS survey. Most Class I candidates are located around integrated intensity peaks of 13CO, whereas most Class II candidates are distributed along the front sides of the BRC arcs close to the exciting star.
,
respectively. The peak 13CO column densities of the clouds facing the H II region are twice as large as the others. They have steep density gradients toward the H II region, indicating interactions with the H II region. We selected 55 Class I candidates and 778 Class II candidates associated with the W5-East H II region from the previous Spitzer IRAC/MIPS survey. Most Class I candidates are located around integrated intensity peaks of 13CO, whereas most Class II candidates are distributed along the front sides of the BRC arcs close to the exciting star.
Conclusions. The alignments of the YSO candidates and the molecular clouds in order of age indicate that triggered star formation occurs in the W5-East H II region as a result of gas compression by strong UV radiation. Based on the column densities of 13CO and the spatial distribution of YSO candidates, we identified a new bright-rimmed cloud candidate on the west side of the W5-East H II region.
Key words: ISM: clouds - ISM: H II regions - stars: evolution - stars: formation - radio lines: ISM
1 Introduction
1.1 Triggered star formation
Star formation, which occurs as a result of the condensation and gravitational collapse of molecular clouds (e.g., Shu 1977), has two major modes: spontaneous and triggered star formation. Spontaneous star formation occurs in molecular clouds in a quiescent environment, i.e., an environment with no external disturbances. In triggered star formation, molecular clouds are compressed from the outside by, for example, shock waves of supernova explosions, stellar winds, and ultraviolet radiation from OB stars.The Taurus molecular cloud is a representative example of a spontaneous star-forming region. Numerous observational results demonstrate that this cloud is the site of low-mass star formation. The Orion molecular cloud is a representative triggered star-forming region. OB associations are distributed across 150 square degrees. The age distribution shows that young stars tend to be located close to the Orion molecular cloud (e.g., Warren & Hesser 1978). Okumura et al. (2000) observed the W51 H II region in the near-infrared to search for young stellar objects (YSOs) and confirmed the age alignment of the YSOs with an age distribution of 1-2 Myr.
Previous studies confirmed that molecular clouds around the H II region form stars with a wide mass range.
For example, Yamaguchi et al. (1999) surveyed molecular clouds around 23 H II regions in the southern hemisphere using 13CO molecular line emission.
They compared the luminosity-mass ratio of 204 IRAS point sources with their associated molecular masses.
They discovered that the ratios for objects located on the side of the clouds near the interacting H II regions were an order of magnitude larger than in molecular clouds located at the far side of the H II region.
This strongly indicates that molecular clouds facing an H II region tend to be massive star-forming regions.
Deharveng et al. (2005) selected high-mass star-forming regions around Galactic H II region candidates in the Galactic H II regions.
They pointed out that the ring-like structures in the Midcource Space eXperiment (MSX) A-band (![]() m) suggest compressed layers of molecular clouds.
Some H II regions that have ring-like structures in the MSX A-band (e.g., Deharveng et al. 2006) were found to be high-mass star-forming regions.
Turning to low-mass star formation, some previous studies confirmed sequential alignments of low-mass YSOs and molecular clouds in order of age (e.g., Sugitani et al. 1995).
These observations indicate evidence of triggered star formation of low-mass stars, summarized as Small-Scale Sequential Star Formation (reviewed by Ogura 2006).
In addition, as a theoretical approach, Whitworth & Zinnecker (2004) suggested that the UV destruction of molecular clouds is a possible formation mechanism of brown dwarfs and free-floating planetary-mass objects, many of which were discovered in H II regions (e.g., Sh-2 106, Oasa et al. 2006).
m) suggest compressed layers of molecular clouds.
Some H II regions that have ring-like structures in the MSX A-band (e.g., Deharveng et al. 2006) were found to be high-mass star-forming regions.
Turning to low-mass star formation, some previous studies confirmed sequential alignments of low-mass YSOs and molecular clouds in order of age (e.g., Sugitani et al. 1995).
These observations indicate evidence of triggered star formation of low-mass stars, summarized as Small-Scale Sequential Star Formation (reviewed by Ogura 2006).
In addition, as a theoretical approach, Whitworth & Zinnecker (2004) suggested that the UV destruction of molecular clouds is a possible formation mechanism of brown dwarfs and free-floating planetary-mass objects, many of which were discovered in H II regions (e.g., Sh-2 106, Oasa et al. 2006).
In many cases, triggered star-forming regions are associated with clusters (e.g., Elmegreen & Lada 1977). As most field stars are believed to form as stellar cluster members (e.g., Lada & Lada 2003), the triggered star formation process is an important mechanism for understanding the evolution of stars in the Galaxy.
1.2 Bright rimmed clouds
Bright-rimmed clouds (BRCs) are considered triggered star forming regions (Sugitani et al. 1991; Sugitani & Ogura 1994). According to Sugitani et al. (1991), BRCs' selection criteria are as follows: (1) the H II region is 60
1.3 W5-East
The W5 H II region is part of the W3/W4/W5 cloud complex (Carpenter et al. 2000) located at 2 kpc (Georgelin & Georgelin 1976). The W5-East H II region (hereafter W5-East) is the eastern part of the W5 H II region, and is excited mainly by BD+590578 (O7V). The molecular clouds around the H II region are assumed to be at the same distance as BD+590578. This is a well studied region to investigate triggered star formation caused by UV radiation because it has such a simple structure: all molecular clouds in the H II region are the same distance from the exciting star. This indicates that the molecular clouds have the same ionizing conditions (i.e., radiation field, excitation temperature, etc.).
Previous studies include observations of the W5-East region in the millimeter-wave band.
Wilking et al. (1984) carried out a molecular cloud survey toward the dark clouds W5NE and W5NW.
They observed 12CO (J=1-0) and 13CO (J=2-1) with the Millimeter Wave Observatory 4.9-m telescope (
![]() ).
They revealed molecular cloud distributions and showed that W5NE is excited by a zero-age main-sequence star (ZAMS) inside the molecular cloud.
W5 was also observed in 12CO (J=1-0) by the FCRAO 14-m telescope with a spatial resolution of 50
).
They revealed molecular cloud distributions and showed that W5NE is excited by a zero-age main-sequence star (ZAMS) inside the molecular cloud.
W5 was also observed in 12CO (J=1-0) by the FCRAO 14-m telescope with a spatial resolution of 50
![]() ,
as part of the Canadian Galactic Plane Survey (CGPS, Heyer et al. 1998).
This unbiased survey revealed the distribution of low-density gas in W5-East.
Carpenter et al. (2000) carried out observations in the near-infrared K-band and 13CO (J=1-0) around 32 IRAS point sources in the W3/W4/W5 cloud complex.
About 1600 stars were identified from the K-band observations, half of which are associated with five IRAS point sources and form rich clusters.
In addition, 39% of the cluster members are associated with the molecular clouds, with about
,
as part of the Canadian Galactic Plane Survey (CGPS, Heyer et al. 1998).
This unbiased survey revealed the distribution of low-density gas in W5-East.
Carpenter et al. (2000) carried out observations in the near-infrared K-band and 13CO (J=1-0) around 32 IRAS point sources in the W3/W4/W5 cloud complex.
About 1600 stars were identified from the K-band observations, half of which are associated with five IRAS point sources and form rich clusters.
In addition, 39% of the cluster members are associated with the molecular clouds, with about
![]() on average.
One of these is known as the AFGL 4029 IR cluster.
Karr & Martin (2003) discussed triggered star formation in W5 using multi-wavelength archival data.
From the expansion of W5-East and the age of observed YSOs, they concluded that the timescale of interaction between the molecular clouds and the H II region was 0.5-1 Myr.
on average.
One of these is known as the AFGL 4029 IR cluster.
Karr & Martin (2003) discussed triggered star formation in W5 using multi-wavelength archival data.
From the expansion of W5-East and the age of observed YSOs, they concluded that the timescale of interaction between the molecular clouds and the H II region was 0.5-1 Myr.
Matsuyanagi et al. (2006) carried out a deep near-infrared survey of BRC 14 that identified 74 YSO candidates with a lower limit on mass detection of 0.12 ![]() .
They investigated star-formation activities using three indicators (object extinction, ratio of YSOs to detected objects, and YSO infrared excess) and found that all parameters increased away from the exciting star.
They concluded that triggered star formation of low-mass stars occurred in BRC 14.
This is the first observational evidence for triggered star formation down to sub-solar mass stars.
Recent observations with the Spitzer Space Telescope showed embedded clusters of Class I sources in the molecular cloud, whereas Class II sources are more widely distributed (Koenig et al. 2008).
They pointed out triggered star formation in BRC 13 and 14 from the Class I/II sources distributions.
.
They investigated star-formation activities using three indicators (object extinction, ratio of YSOs to detected objects, and YSO infrared excess) and found that all parameters increased away from the exciting star.
They concluded that triggered star formation of low-mass stars occurred in BRC 14.
This is the first observational evidence for triggered star formation down to sub-solar mass stars.
Recent observations with the Spitzer Space Telescope showed embedded clusters of Class I sources in the molecular cloud, whereas Class II sources are more widely distributed (Koenig et al. 2008).
They pointed out triggered star formation in BRC 13 and 14 from the Class I/II sources distributions.
In spite of these observational indications of triggered star formation, no high-resolution extensive cloud and dense-clump surveys exist to compare directly with the infrared YSOs.
The 13CO molecular cloud survey (e.g., Carpenter et al. 2000) area is limited around the IRAS point source (
![]() ), thus we cannot reveal relationships between the star formation activity and the large-scale triggering effect by W5-East. Moreover, no observation using denser gas tracers (e.g., C 18O) have been carried out in this region.
To investigate detailed cloud structures of interest interacting between clouds and H II regions and triggered star formation, we performed an unbiased, high spatial resolution survey of the entire W5-East region. Derived physical properties of clouds and clumps such as morphology, density, mass, and association with bright rims were compared in terms of star-formation activities based on the Spitzer IRAC/MIPS survey (
3.5, 5.8, 8.0, and 24.0
), thus we cannot reveal relationships between the star formation activity and the large-scale triggering effect by W5-East. Moreover, no observation using denser gas tracers (e.g., C 18O) have been carried out in this region.
To investigate detailed cloud structures of interest interacting between clouds and H II regions and triggered star formation, we performed an unbiased, high spatial resolution survey of the entire W5-East region. Derived physical properties of clouds and clumps such as morphology, density, mass, and association with bright rims were compared in terms of star-formation activities based on the Spitzer IRAC/MIPS survey (
3.5, 5.8, 8.0, and 24.0 ![]() m) by Koenig et al. (2008).
m) by Koenig et al. (2008).
2 Observations and analysis
2.1 Observations
Observations were carried out in two periods, from 13-15 January and 9-19 May 2005 (a total of 14 days), using the Nobeyama Radio Observatory 45-m telescope (
2.2 Data reduction
For data reduction, we used ``Newstar'' provided by the Nobeyama Radio Observatory. In the Newstar process, the positional distortions of the 25 beams of BEARS were corrected using scaling and regridding tasks. In addition, the baseline was subtracted from each spectrum by linear function fitting, taking
2.3 Physical parameter estimations
We calculated the column densities from the observational flux at each observed point. Each molecular cloud observed in W5-East is much larger than the beam-size of the NRO 45-m telescope (15
where
To convert from 13CO and C 18O column densities to [][2]H column density, we need to know the molecular abundance relative to ![]() .
This, however, differs from the terrestrial abundance, depending on circumstances. Thus, we formulated new column density conversion equations from
.
This, however, differs from the terrestrial abundance, depending on circumstances. Thus, we formulated new column density conversion equations from
![]() and
and
![]() to
to
![]() in this region. The conversion function is as follows:
in this region. The conversion function is as follows:
![\begin{displaymath}N(\element[][][][2]{H}) = \left[ \frac{N(\element[][13]{CO})}{2.7 \times 10^{15}} + 0.6 \right] \times 10^{21}
\end{displaymath}](/articles/aa/full_html/2009/24/aa11065-08/img54.png)
![\begin{displaymath}N(\element[][][][2]{H}) = \left[ \frac{N(\element{C}\element[][18]{O})}{1.7 \times 10^{14}} - 0.8 \right] \times 10^{21}
\end{displaymath}](/articles/aa/full_html/2009/24/aa11065-08/img55.png)
(see Appendix). The projected area (A) is obtained by counting the spatial elements of observed points where the integrated intensity satisfied our criteria as a molecular cloud (For example, in the case of 13CO, molecular clouds with boundaries of 5
where the mass of atomic hydrogen

3 Results
3.1 13CO (J=1-0) and molecular clouds
Figure 1 is the integrated intensity map of 13CO (J=1-0).
The orange contours illustrate 13CO (J=1-0) line integrated intensity superposed on the Digitized Sky Survey (DSS) R-band image around W5-East in galactic coordinates.
The integrated velocity ranges run from
![]() to
to
![]() .
The 13CO emissions are distributed around the H II region formed mainly by BD+590578.
.
The 13CO emissions are distributed around the H II region formed mainly by BD+590578.
We identified eight 13CO molecular clouds with boundaries of 5![]() integrated intensity, corresponding to
integrated intensity, corresponding to
![]() (
(
![]() ,
Bohlin et al. 1978).
They are enumerated as shown in Fig. 1.
The masses of the clouds are 460-36 000
,
Bohlin et al. 1978).
They are enumerated as shown in Fig. 1.
The masses of the clouds are 460-36 000 ![]() ,
with a total of 81 000
,
with a total of 81 000 ![]() .
The physical properties of each cloud, derived according to the procedure described in the previous sections are summarized in Table 1.
.
The physical properties of each cloud, derived according to the procedure described in the previous sections are summarized in Table 1.
![\begin{figure}
\par\includegraphics[width=15.5cm,clip]{1065fig1.eps}
\end{figure}](/articles/aa/full_html/2009/24/aa11065-08/img67.png) |
Figure 1:
13CO (J=1-0) line integrated intensity (orange contour) superposed on the DSS optical image around the W5-East H II region in the galactic coordinates. The dashed contour is 1.725 K
|
| Open with DEXTER | |
In general, the distributions of molecular clouds and dark clouds in the DSS image coincide well. They are concentrated only on the north side of W5-East, forming a semi-arc. In contrast, on the south side of this region, no molecular clouds have been identified. The 12CO-emitting clouds (CGPS, Heyer et al. 1998; Wilking et al. 1984) are more extended than the 13CO clouds. For example, the W5NE cloud ( l=137.9, b=1.7) observed in 12CO with the MWO 4.9-m telescope (Wilking et al. 1984) consists of five discrete 13CO clouds (clouds 1-5), but little 13CO emission there.
Three molecular clouds associated with BRCs (BRC 12-14) have visible arc-like structures on their edges.
The cloud 6 has a simple cometary structure pointing to the exciting star.
Its shape appears similar to the morphology predicted by the RDI model (Lefloch & Lazareff 1994) at
![]() years after the beginning of UV radiation.
years after the beginning of UV radiation.
The cloud 7 has a head-tail structure like a comet, whereas another small H II region, Sh 2-201, is located in the tail.
Sh2-201 did not seem to form as a result of triggering by BD+590578 because it is separated from the visible shock front as the bright rim.
Therefore it is suggested that a pre-exciting filamentary cloud spontaneously formed Sh2-201 in the middle, and the west edge of cloud 7 has a dense and massive head delineated by the bright rim.
These facts suggest that these molecular clouds are compressed, most likely by UV radiation or stellar winds from BD+590578.
Cloud 1 is associated with BRC 12, whose shape is almost spherical.
However, BRC 12 is pointing in the direction of the closest early-type star, BD+600586 (O8III).
This suggests that cloud 1 is not excited by BD+590578 from outside the main W5-East shell.
Cloud 4 is the largest molecular cloud in this region; its intensity peak juts into the W5-East region.
Arc-like structures similar to BRCs are visible in this part of the cloud.
Hereafter, we treat cloud 4 as a molecular cloud surrounded by a bright rim (see also Sect. 4.3).
This cloud was not identified as a BRC in previous studies (e.g., Sugitani et al. 1991, see discussions).
Four clouds (clouds 2, 3, 5, and 8) without bright rims have almost spherical structures.
Note however that, in the Spitzer GLIMPSE ![]() m, which is more sensitive to ionization fronts, the surface of cloud 8 has a bright rim-like structure.
This is not visible in the DSS2 red image.
In this paper, cloud 8 is treated as a cloud without a bright rim. It seems to be less affected by UV radiation than the other BRCs.
These do not have visible arc-like structures between the molecular cloud and the H II region.
This suggests that UV radiation from BD+590578 has little influence on these clouds.
m, which is more sensitive to ionization fronts, the surface of cloud 8 has a bright rim-like structure.
This is not visible in the DSS2 red image.
In this paper, cloud 8 is treated as a cloud without a bright rim. It seems to be less affected by UV radiation than the other BRCs.
These do not have visible arc-like structures between the molecular cloud and the H II region.
This suggests that UV radiation from BD+590578 has little influence on these clouds.
In the previously published 12CO maps, we can find a ridge-like structure in the north of W5-East (e.g., Karr & Martin 2003).
However, we find no 13CO emission in this structure despite the fact that other dark clouds in the visible are well traced by 13CO.
The sensitivity (![]() )
of our 13CO observation is
)
of our 13CO observation is
![]() which corresponds to about
which corresponds to about
![]() .
The reason for non-detection in the visible northern ridge structure may be that the shorter distance to BD+590578 (compared to the other dark clouds) result in stronger UV irradiation on the cloud.
Thus, the disappearance of 13CO may indicate that 13CO is dissociated from BD+590578 by UV radiation.
.
The reason for non-detection in the visible northern ridge structure may be that the shorter distance to BD+590578 (compared to the other dark clouds) result in stronger UV irradiation on the cloud.
Thus, the disappearance of 13CO may indicate that 13CO is dissociated from BD+590578 by UV radiation.
Table 1:
Physical parameters at peak
![]() position for each 13CO molecular cloud.
position for each 13CO molecular cloud.
![\begin{figure}
\par\includegraphics[width=16cm,clip]{f2.eps}
\end{figure}](/articles/aa/full_html/2009/24/aa11065-08/img81.png) |
Figure 2:
C 18O (J=1-0) line integrated intensity map shown by pseudo-color superposed on the 13CO contour map. The lowest contour is 0.66 K
|
| Open with DEXTER | |
3.2 C 18O (J=1-0) and clumps
The pseudo color image in Fig. 2 represents the distribution of the C 18O (J=1-0) line integrated intensity superposed on the 13CO (J=1-0) map in galactic coordinates. This shows that the C 18O distribution includes clumpy structures embedded in the 13CO clouds near the intensity peaks. We identified C 18O clumps using the following procedure:
- 1.
- search for the peak position of C 18O emission in the integrated intensity map;
- 2.
- if the peak integrated intensity is less than
 ,
stop this procedure;
,
stop this procedure;
- 3.
- define the extent of the clump by the closed contour of the half-maximum integrated intensity;
- 4.
- search for the next-strongest local peak emission outside previously defined clumps;
- 5.
- repeat this procedure from (2).
![\begin{figure}
\par\includegraphics[width=14.3cm,clip]{f3.eps}
\end{figure}](/articles/aa/full_html/2009/24/aa11065-08/img85.png) |
Figure 3:
Spatial distributions of the YSO candidates.
The pink circles and blue plus symbols indicate the approximate extent of the H II region seen in the DSS image and the exciting star BD+590578, respectively.
The orange crosses and red plus symbols correspond to Class II and Class I candidates, respectively, identified by Koenig et al. (2008) from Spitzer IRAC/MIPS observations, respectively.
The black contours represent 13CO molecular clouds from |
| Open with DEXTER | |
Table 2:
Physical parameters of
![]() clumps.
clumps.
The distributions of 13CO and C 18O have a hierarchical density structures; i.e., the C 18O clumps are embedded in the 13CO clouds, particularly in the region with strong 13CO intensity above ![]() (corresponding to
(corresponding to
![]() in
in
![]() ).
In clouds 1, 4, 6, and 7, C 18O emissions are mostly distributed near the edge of the 13CO molecular cloud.
The clouds 2, 3, 5, and 8 do not display C 18O emission.
Some of the clumps (clumps 2, 4, 7) have cometary head-tail structures.
These clumps have large axial ratios and increased density in the direction of the H II region from inside the 13CO molecular cloud, compared to the other clumps.
).
In clouds 1, 4, 6, and 7, C 18O emissions are mostly distributed near the edge of the 13CO molecular cloud.
The clouds 2, 3, 5, and 8 do not display C 18O emission.
Some of the clumps (clumps 2, 4, 7) have cometary head-tail structures.
These clumps have large axial ratios and increased density in the direction of the H II region from inside the 13CO molecular cloud, compared to the other clumps.
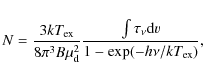
We investigated gravitational bounding of C 18O clumps quantitatively from
![]() .
The
.
The
![]() ratio of clumps 2, 5, 6, 7, and 8 are larger than 1; thus, these clumps are gravitationally bound.
In particular, we found that all three clumps facing the H II region (clumps 5, 6, and 7) are gravitationally bounded.
ratio of clumps 2, 5, 6, 7, and 8 are larger than 1; thus, these clumps are gravitationally bound.
In particular, we found that all three clumps facing the H II region (clumps 5, 6, and 7) are gravitationally bounded.
The C 18O emission in cloud 4 is distributed on each 13CO local peak.
On the north side of cloud 4 (around clumps 4 and 5), we found four C 18O-emitting regions, two of which do not satisfy our criteria of (2).
In addition, the
![]() of these clumps are almost the same compared to the 13CO molecular cloud (cloud 4).
Therefore, projection effects along the line of sight can be excluded in our study.
Three ZAMS were reported by Wilking et al. (1984) in cloud 4, one of them located between clumps 4 and 5.
In addition, clump 4 shows a head-tail structure.
This suggests that the ZAMS may affect cloud fragmentation, as will be discussed in Sect. 4.4.
Clump 7 in cloud 7 shows a simple head-tail structure.
This suggests that clump 7 is not fragmented, even if protostellar objects exist in clump 7.
Based on these facts, the compression and evolution processes of clumps seem to vary from cloud to cloud.
of these clumps are almost the same compared to the 13CO molecular cloud (cloud 4).
Therefore, projection effects along the line of sight can be excluded in our study.
Three ZAMS were reported by Wilking et al. (1984) in cloud 4, one of them located between clumps 4 and 5.
In addition, clump 4 shows a head-tail structure.
This suggests that the ZAMS may affect cloud fragmentation, as will be discussed in Sect. 4.4.
Clump 7 in cloud 7 shows a simple head-tail structure.
This suggests that clump 7 is not fragmented, even if protostellar objects exist in clump 7.
Based on these facts, the compression and evolution processes of clumps seem to vary from cloud to cloud.
3.3 Spatial distribution of YSO candidates
To investigate star-formation activities in W5-East through the spatial distribution of molecular clouds and YSO candidates, we used the YSO candidate catalog provided by Koenig et al. (2008). They observed the entire W5 region with the Spitzer IRAC/MIPS and identified 176 Class I candidates and 1806 Class II candidates from the infrared excess of the detected sources based on the slope of the SED:Using this criterion, we identified 778 Class II candidates associated with our observed 13CO region. Of the 778 Class II candidates, 115 are associated with the 13CO clouds. The YSO candidates in the entire W5-East are not distributed uniformly but rather form loose clusters. W5-East contains 55 Class I candidates. The Class I candidate distributions are even more clustered. Almost all (40 of 55) objects are concentrated inside the 13CO clouds, especially around the peak positions of integrated intensity. These concentrations (or clusters) will be discussed in Sect. 4.2.
4 Discussion
4.1 Physical conditions of W5-East
As shown by our survey, the column density distributions of molecular clouds have steep gradients on the side facing the H II region.
This suggests interaction between the H II region and the molecular clouds.
Figure 4 shows the column densities of molecular cloud peak positions, assuming an excitation temperature of 30 K.
The hatched and open bars show those with and without bright rims.
The error bars represent the variations in excitation temperature ![]() 5 K.
The column densities of 13CO show characteristic differences between the molecular clouds with and without rims.
The minimum column density of the cloud with a rim (cloud 1) is 20 percent larger than the maximum column density of the cloud without a rim (cloud 5), and twice as large as the average of clouds 2, 3, 5, and 8.
If the excitation temperature variation is less than 10 K, these differences are significant.
Together with the facts that the 13CO clouds with rims show steep intensity gradients toward the H II region, and that the C 18O clumps are distributed near the head of the cometary cloud structures, the molecular clouds are likely to be compressed by the H II region.
Moreover, cloud 4 also has a high column density.
This cloud has a visible arc-like structure facing the H II region, similar to the BRCs.
5 K.
The column densities of 13CO show characteristic differences between the molecular clouds with and without rims.
The minimum column density of the cloud with a rim (cloud 1) is 20 percent larger than the maximum column density of the cloud without a rim (cloud 5), and twice as large as the average of clouds 2, 3, 5, and 8.
If the excitation temperature variation is less than 10 K, these differences are significant.
Together with the facts that the 13CO clouds with rims show steep intensity gradients toward the H II region, and that the C 18O clumps are distributed near the head of the cometary cloud structures, the molecular clouds are likely to be compressed by the H II region.
Moreover, cloud 4 also has a high column density.
This cloud has a visible arc-like structure facing the H II region, similar to the BRCs.
![\begin{figure}
\par\includegraphics[width=8.4cm,clip]{f4.eps}
\end{figure}](/articles/aa/full_html/2009/24/aa11065-08/img97.png) |
Figure 4:
Comparison of the 13CO peak column densities.
The hatched and open bars indicate molecular clouds with and without bright rims, respectively.
We assume a uniform excitation temperature of 30 K with |
| Open with DEXTER | |
4.2 Star-formation activities
In the previous section, we demonstrated a non-uniform distribution of YSOs. To investigate the distributions of YSO candidates quantitatively, we calculated the surface density of the Class II candidates. ![\begin{figure}
\par\includegraphics[width=15.5cm,clip]{f5.eps}
\end{figure}](/articles/aa/full_html/2009/24/aa11065-08/img102.png) |
Figure 5:
The orange contours indicate the surface density of the Class II candidates identified by Koenig et al. (2008) with
|
| Open with DEXTER | |
The surface density of the Class II candidates in cloud 1 is lower than the other BRCs, despite the visible rim structure of BRC 12.
Cloud 1 is headed toward the closest early-type star, BD+600586 (O8III), rather than BD+590578.
Thus, we do not treat cloud 1 in the same manner as the other BRCs when comparing star-formation activities because cloud 1 is probably excited by BD+600586.
The east part of BRC 14 is known as a small H II region, Sh 2-201.
This region has a Class II cluster that is independent of the cluster in front of cloud 7.
This indicates that Sh 2-201 is another cluster-forming region in the middle of the elongated cloud.
In addition, another high surface-density cluster appears in the central region of W5-East (around BD+590578).
Its peak surface density is
![]() ,
comparable to BRC 14 and cloud 4, but the extent of the cluster is larger.
This cluster has only one Class I candidate and no 13CO emission.
According to Nakano et al. (2008), the age of these sources is about 4 Myr, older than those on the front side of cloud 7 (1 Myr).
Therefore, they concluded that these sources are possibly the ``first generation cluster'', formed together with BD+590578.
,
comparable to BRC 14 and cloud 4, but the extent of the cluster is larger.
This cluster has only one Class I candidate and no 13CO emission.
According to Nakano et al. (2008), the age of these sources is about 4 Myr, older than those on the front side of cloud 7 (1 Myr).
Therefore, they concluded that these sources are possibly the ``first generation cluster'', formed together with BD+590578.
The Class I candidates for the cluster-forming clouds are located around the 13CO intensity peaks, indicating ongoing star formation. In contrast, Class II candidates are distributed on the front sides of the BRC arcs close to the exciting star. These distributions indicate that these YSO candidates are aligned by age towards the exciting star from molecular clouds. Koenig et al. (2008) observed the W5 H II region using Spitzer IRAC/MIPS and demonstrated the spatial distribution of Class I, II, and III sources. They also pointed out that the ratio of Class II sources to Class I sources in 12CO molecular clouds is about 7 times higher than the ratio of those H II regions in the entire W5. In this section, we attempt to combine our observational results and their results. Most Class I candidates are associated with 13CO intensity peaks, whereas the majority of Class II candidates form clusters around the visible arc-like structure. These indicate YSO age alignments. Therefore, we conclude that this is additional evidence of triggered star formation and our conclusion is supported by Spitzer IRAC/MIPS observations of W5-East.
We also scrutinized the 2MASS/IRAS archive data to identify the spatial distributions of YSOs in W5-East. We identified 18 protostellar IRAS sources and 176 2MASS sources with IR excess as YSO candidates using the color-color diagram for mid- and near-infrared wavelength, respectively (for moredetails on the selection rule, see Beichman et al. 1986; Oasa et al. 1999). From these spatial distributions, we found that seven IRAS point sources are located at integrated intensity peaks of 13CO, whereas the majority of 2MASS sources are distributed along the front sides of BRC arcs close to the exciting star. These spatial distributions are very similar to the results of the Spitzer IRAC/MIPS survey, thus triggered star formation in W5-East is supported by both 2MASS/IRAS and IRAC/MIPS observations.
The molecular clouds not facing the H II region (clouds 2, 3, 5, and 8) do not have associated YSO candidates, indicating that no active star formation is taking place. In addition, these clouds do not have visible bright rims and have lower 13CO column densities compared to BRCs. It is possible that UV radiation from W5-East has not yet reached these molecular clouds to trigger cloud compression and star formation.
4.3 East edge of cloud 4: BRC candidate?
Even though cloud 4 is not cataloged as a BRC by Sugitani et al. (1991), it exhibits similar properties. The peak 13CO position of cloud 4 is only 1
4.4 Column density profiles as indicators of cloud compression
The cometary morphologies of BRCs in the 13CO and C 18O maps indicate that they are compressed from one side, as illustrated in numerical simulations of the RDI model (e.g., Lefloch & Lazareff 1994). To investigate cloud compression quantitatively, we drew column density profiles of clouds 7 (clump 7), 6 (clump 6) and 4 (clump 5) in Figs. 6-8, respectively. The horizontal axis is the offset distance from the bright rims visible in optical images along the lines connecting the exciting star and the peak positions of 13CO integrated intensity. The solid, dashed and dotted lines are 13CO, C 18O, and the N( 13CO)/N( C 18O) ratio, respectively. Note that the N( 13CO)/N( C 18O) ratio is calculated only for data points greater than the
The column density profile of cloud 7 with BRC 14 in Fig. 6 shows remarkable asymmetry, presenting a sharp cut-off on the side facing the exciting star (front side) and a shallower slope on the opposite side (back side) with peaks at 1
![]() 5 and 2
5 and 2![]() from the bright rim.
This trend is almost the same for both 13CO and C 18O.
The column density profiles on the back side resemble the power-law function of
from the bright rim.
This trend is almost the same for both 13CO and C 18O.
The column density profiles on the back side resemble the power-law function of
![]() for 13CO and are slightly steeper for C 18O.
These indicate that molecular gas has undergone compression on the front side due to UV radiation from BD+590578.
The N( 13CO)/N( C 18O) ratio varies independently of the distance from the shock front. Chemical effects may contribute to the variation of the 13CO/ C 18O relative abundance in a small-scale structure (see Appendix for details).
for 13CO and are slightly steeper for C 18O.
These indicate that molecular gas has undergone compression on the front side due to UV radiation from BD+590578.
The N( 13CO)/N( C 18O) ratio varies independently of the distance from the shock front. Chemical effects may contribute to the variation of the 13CO/ C 18O relative abundance in a small-scale structure (see Appendix for details).
![\begin{figure}
\par\includegraphics[width=9cm,clip]{f6.eps}
\end{figure}](/articles/aa/full_html/2009/24/aa11065-08/img114.png) |
Figure 6:
Column density profile of BRC 14 (cloud 7). The horizontal axis is offset from the bright rim in the optical image. The solid, dashed, and dotted-lines are N( 13CO), N( C 18O)
|
| Open with DEXTER | |
![\begin{figure}
\par\includegraphics[width=9cm,clip]{f7.eps}
\end{figure}](/articles/aa/full_html/2009/24/aa11065-08/img115.png) |
Figure 7: Column density profile of BRC 13 (cloud 6). |
| Open with DEXTER | |
![\begin{figure}
\par\includegraphics[width=9cm,clip]{f8.eps}
\end{figure}](/articles/aa/full_html/2009/24/aa11065-08/img116.png) |
Figure 8: Column density profile of cloud 4. |
| Open with DEXTER | |
In the case of cloud 6 (Fig. 7), although the trend is less prominent, the same asymmetric feature is seen, particularly for 13CO.
The profiles have a peak column density at about 0
![]() 5 from the bright rim, and the slopes are shallower than those of cloud 7 on both the front and back sides.
These indicate compression taking place, although the pressure may be weaker.
5 from the bright rim, and the slopes are shallower than those of cloud 7 on both the front and back sides.
These indicate compression taking place, although the pressure may be weaker.
For cloud 4, as shown in Fig. 8, clear indications of asymmetry do not appear, even though the C 18O clump is slightly offset from the rim. The C 18O intensity is relatively weak, as denoted by the high N( 13CO)/N( C 18O) ratio.
Star formation is triggered as a result of cloud compression by UV radiation and stellar winds emanating from OB stars. In the vicinity of W5-East, we found no indication of a past supernova; thus, we considered the effects of UV radiation and stellar winds from BD+590578. To investigate both effects quantitatively, we calculated kinetic energy and momentum input to nearby clouds.
We first consider UV radiation from OB stars to the molecular cloud.
Neutral gas on the cloud surface is photo-evaporated when irradiated by UV light. This ionized gas escapes from the cloud with a velocity of
![]() (Oort & Spitzer 1955) in the rocket effect.
The mass loss rate of the molecular cloud
(Oort & Spitzer 1955) in the rocket effect.
The mass loss rate of the molecular cloud
![]() is given as
is given as
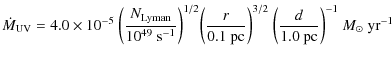 |
(7) |
(Stahler & Palla 2005), where
Stellar wind from a massive star also contributes a significant amount of kinetic energy and momentum to the cloud via high-velocity particles.
According to Abbott (1982b), the mass loss rate
![]() of a high-mass star caused by stellar wind is given as
of a high-mass star caused by stellar wind is given as
 |
(8) |
where L is the luminosity of the star. We assume that the stellar wind is uniformly driven and the energy and momentum input is proportional to the solid angle ratio
 |
(9) |
Thus, the cloud obtains kinetic energy (
BD+590578's spectral type is O7V, and the Lyman photon number and stellar luminosity are given as
![]() and
and
![]() ,
respectively (Panagia 1973).
We set a cylindrical molecular cloud with a cross section of
,
respectively (Panagia 1973).
We set a cylindrical molecular cloud with a cross section of
![]() subtending the exciting star located on the surface of the spherical H II region at a distance of
subtending the exciting star located on the surface of the spherical H II region at a distance of
![]() from the star.
These quantities correspond to those of clump 6 (BRC 13).
from the star.
These quantities correspond to those of clump 6 (BRC 13).
As indicated by the association with the Class-II candidates,
![]() is estimated to be
is estimated to be
![]() yr,
yr, ![]() 1/4 of the lifetime of an O7-type star.
Under these assumptions, we calculated the cumulative amount of energy and momentum contributed to the cloud over this timescale.
The kinetic energy of the UV radiation
1/4 of the lifetime of an O7-type star.
Under these assumptions, we calculated the cumulative amount of energy and momentum contributed to the cloud over this timescale.
The kinetic energy of the UV radiation
![]() and stellar wind
and stellar wind
![]() were calculated as
were calculated as
![]() and
and
![]() ,
respectively.
The momentum of UV radiation
,
respectively.
The momentum of UV radiation
![]() and stellar wind
and stellar wind
![]() are
are
![]() and
and
![]() ,
respectively.
These comparisons indicate that the UV-radiation contributions to kinetic energy
,
respectively.
These comparisons indicate that the UV-radiation contributions to kinetic energy
![]() and momentum
and momentum
![]() are one and three orders of magnitude larger (respectively) than those of the stellar wind
are one and three orders of magnitude larger (respectively) than those of the stellar wind
![]() and
and
![]() .
Thus, we conclude that UV radiation is the dominant source of molecular cloud compression.
Given this condition,
.
Thus, we conclude that UV radiation is the dominant source of molecular cloud compression.
Given this condition,
![]() is calculated to be
is calculated to be
![]() cloud 6 can survive more than
cloud 6 can survive more than
![]() .
For small cloud 5,
.
For small cloud 5,
![]() ;
the cloud would photo-evaporate in
;
the cloud would photo-evaporate in
![]() .
These molecular cloud ``lifetimes'' are about an order of magnitude longer than that of the exciting star, BD+590578.
This fact indicates that these molecular clouds will be exposed to the destructive shock wave of a supernova explosion at the end of the lifetime of BD+590578, dissipating all the molecular clouds.
.
These molecular cloud ``lifetimes'' are about an order of magnitude longer than that of the exciting star, BD+590578.
This fact indicates that these molecular clouds will be exposed to the destructive shock wave of a supernova explosion at the end of the lifetime of BD+590578, dissipating all the molecular clouds.
We estimated the internal kinetic energy and momentum of the molecular cloud as
![]() and
and
![]() from the cloud mass
from the cloud mass
![]() and velocity dispersion
and velocity dispersion
![]() .
For cloud 6,
.
For cloud 6,
![]() and P are estimated to be
and P are estimated to be
![]() and
and
![]() ,
respectively.
,
respectively.
![]() is comparable to
is comparable to
![]() ,
indicating that external compression can overcome internal pressure and initiate the dynamical collapse of the cloud.
Note, however, that in our estimation, we assumed that the energy conversion was 100% efficient, thus, the energy input may be over-estimated.
Additionally,
,
indicating that external compression can overcome internal pressure and initiate the dynamical collapse of the cloud.
Note, however, that in our estimation, we assumed that the energy conversion was 100% efficient, thus, the energy input may be over-estimated.
Additionally,
![]() is derived from 13CO observations and the mass of the diffuse low-density gas should be taken into account.
The internal energy of the molecular cloud is therefore underestimated.
Diffuse gas streaming motion was observed in 12CO in the nearby H II region (Tachihara et al. 2000a).
From cloud energetics calculations, they concluded that UV radiation is the main energy source, similar to the present study.
Our observations suggest that UV radiation plays an important role in molecular cloud compression on the surface as modeled by RDI.
is derived from 13CO observations and the mass of the diffuse low-density gas should be taken into account.
The internal energy of the molecular cloud is therefore underestimated.
Diffuse gas streaming motion was observed in 12CO in the nearby H II region (Tachihara et al. 2000a).
From cloud energetics calculations, they concluded that UV radiation is the main energy source, similar to the present study.
Our observations suggest that UV radiation plays an important role in molecular cloud compression on the surface as modeled by RDI.
5 Conclusions
We carried out a high spatial resolution survey of the entire W5-East H II region in 13CO (J=1-0) and C 18O (J=1-0) to investigate physical conditions and star-formation activities in the molecular clouds around the H II region. Our main conclusions are as follows.- 1.
- From the 13CO (J=1-0) survey results, eight molecular clouds were identified, three of which are associated with BRCs.
Total mass is 81 000
 .
In the C 18O (J=1-0) search, nine clumps were identified.
These average LTE masses and number densities are
.
In the C 18O (J=1-0) search, nine clumps were identified.
These average LTE masses and number densities are
 and
and
 ,
respectively.
,
respectively.
- 2.
- From molecular cloud column density comparisons, we found that molecular clouds with bright rims have column densities twice as high as others in 13CO (J=1-0). This suggests that the molecular clouds are compressed by the H II region.
- 3.
- To investigate star-formation activities, we selected the Class I and Class II candidates from previous Spitzer IRAC/MIPS observational results. Forty Class I candidates are located around 13CO cloud integrated intensity peaks, whereas the majority of the Class II candidates form clusters that are distributed on the front sides of the BRC arcs close to the exciting star. This suggests sequential alignment of YSO candidates and molecular clouds in order of age. Thus, our observational results support the idea of triggered star formation in the W5-East H II region.
- 4.
- The intensity peak of the cloud 4 (clump 5) juts into W5-East and exhibits properties similar to the BRCs. Thus, we identified cloud 4 as a BRC candidate for this region.
- 5.
- To discuss the dominant triggering factor, we quantitatively considered the effects of UV radiation and stellar winds from BD+590578. UV radiation contributions to kinetic energy and momentum are one and three orders of magnitude larger than those from the stellar wind. Therefore, we concluded that the dominant factor in triggering in the W5-East region was UV radiation.
- 6.
- The cometary shapes of BRCs were investigated in terms of column density profiles. They exhibit sharp edges on the side facing the H II region, and the backs have a density gradient resembling material compressed by UV radiation (e.g., Lefloch & Lazareff 1994).
Acknowledgements
These observations were carried out as part of the ``Education Program for Graduate Students'' organized by the Nobeyama Radio Observatory (NRO). The NRO is a branch of the National Astronomical Observatory of Japan, National Institutes of Natural Sciences. We thank the NRO staff for supporting our observations. This work was supported by the ``21st Century COE Program: The Origin and Evolution of Planetary Systems'' of the Ministry of Education, Culture, Sports, Science, and Technology (MEXT), Japan. We are grateful to Xavier Koenig and Lori Allen for providing the source catalog for the Spitzer Space Telescope. The provided Spitzer Space Telescope data set greatly improved the precision and clarity of our discussion. We also thank Yuri Aikawa and Makoto Nakano for fruitful discussions.
Appendix A: Conversion functions from N( 13CO) and N( C 18O)
into N(H )
)
To estimate the column densities of [][2]H, we need to know the abundance ratio of 13CO and C 18O versus [][2]H.
First, to investigate the relationships between 13CO and C 18O, we selected observed points with a 13CO and C 18O separation of less than 5
![]() .
Figure A.1 is the correlation diagram of the column densities of 13CO and C 18O, showing a poor correlation between them.
This implies that the relative abundance of 13CO and C 18O changes with location.
The maximum abundance ratio
.
Figure A.1 is the correlation diagram of the column densities of 13CO and C 18O, showing a poor correlation between them.
This implies that the relative abundance of 13CO and C 18O changes with location.
The maximum abundance ratio
![]() is about 20, much larger than the terrestrial abundance ratio (5.5).
This cannot be explained on the basis of simple optical depth arguments, but must include chemical effects, such as selective destruction by UV radiation, molecular depletion, and ion-exchange reactions (e.g. Frerking et al. 1982; Glassgold et al. 1985).
We cannot, however, see any characteristic spatial distribution in abundance variation, i.e., there is no abundance anomaly distributed only on the molecular cloud close to the H II region.
The column density profile of 13CO and C 18O (see Sect. 4.5) indicates this.
In addition, we cannot see component abundance variation in our line of sight.
Therefore, to estimate the column density of [][2]H, we did not consider the abundance variation with location.
We used uniform relationships between 13CO and C 18O.
To obtain the relationships, we derived a correlation between the
is about 20, much larger than the terrestrial abundance ratio (5.5).
This cannot be explained on the basis of simple optical depth arguments, but must include chemical effects, such as selective destruction by UV radiation, molecular depletion, and ion-exchange reactions (e.g. Frerking et al. 1982; Glassgold et al. 1985).
We cannot, however, see any characteristic spatial distribution in abundance variation, i.e., there is no abundance anomaly distributed only on the molecular cloud close to the H II region.
The column density profile of 13CO and C 18O (see Sect. 4.5) indicates this.
In addition, we cannot see component abundance variation in our line of sight.
Therefore, to estimate the column density of [][2]H, we did not consider the abundance variation with location.
We used uniform relationships between 13CO and C 18O.
To obtain the relationships, we derived a correlation between the
![]() and
and
![]() by least-square fitting.
The column density relationships are formulated by the following equation:
by least-square fitting.
The column density relationships are formulated by the following equation:
![\begin{displaymath}N(\element[][13]{CO}) = 15.7 \times N(\element{C}\element[][18]{O}) -3.7 \times 10^{15}.
\end{displaymath}](/articles/aa/full_html/2009/24/aa11065-08/img165.png)
Comparing this relation with that of other regions (Fig. A.1), our result approximates that of Ophiuchus North derived by Tachihara et al. (2000b). Thus we adopt the 13CO to [][2]H conversion function derived in Ophiuchus North by Nozawa et al. (1991) as follows:
![\begin{displaymath}N(\element[][][][2]{H}) = \left[ \frac{N(\element[][13]{CO})}{2.7 \times 10^{15}} + 0.6 \right] \times 10^{21}.
\end{displaymath}](/articles/aa/full_html/2009/24/aa11065-08/img166.png)
Therefore, for C 18O, we adopted Eq. (A.1) to Eq. (A.2) and derived a new conversion function in W5-East:
![\begin{displaymath}N(\element[][][][2]{H}) = \left[ \frac{N(\element{C}\element[][18]{O})}{1.7 \times 10^{14}} - 0.8 \right] \times 10^{21}.
\end{displaymath}](/articles/aa/full_html/2009/24/aa11065-08/img167.png)
We used these conversion functions to estimate the physical parameters of the molecular clouds and cloud clumps in this paper.
![\begin{figure}
\par\includegraphics[width=9cm,clip]{fA.1.eps}
\end{figure}](/articles/aa/full_html/2009/24/aa11065-08/img168.png) |
Figure A.1:
Comparison of detected 13CO and C 18O column densities (crosses).
The solid line and other lines represent the best-fit function by least-square fitting in this work and previous studies, respectively.
The results of |
| Open with DEXTER | |
References
- Abbott, D. C. 1982a, ApJ, 263, 723 [NASA ADS] [CrossRef] (In the text)
- Abbott, D. C. 1982b, ApJ, 259, 282 [NASA ADS] [CrossRef] (In the text)
- Beichman, C. A., Myers, P. C., Emerson, J. P., et al. 1986, ApJ, 307, 337 [NASA ADS] [CrossRef]
- Bohlin, R. C., Savage, B. D., & Drake, J. F. 1978, ApJ, 224, 132 [NASA ADS] [CrossRef] (In the text)
- Carpenter, J. M., Heyer, M. H., & Snell, R. L. 2000, ApJS, 130, 381 [NASA ADS] [CrossRef] (In the text)
- Deharveng, L., Lefloch, B., Massi, F., et al. 2006, A&A, 458, 191 [NASA ADS] [CrossRef] [EDP Sciences] (In the text)
- Deharveng, L., & Zavagno, A. 2008, in Massive Star Formation: Observations Confront Theory, ed. H. Beuther, H. Linz, & T. Henning, ASP Conf. Ser., 387, 338 (In the text)
- Deharveng, L., Zavagno, A., & Caplan, J. 2005, A&A, 433, 565 [NASA ADS] [CrossRef] [EDP Sciences] (In the text)
- Elmegreen, B. G., & Lada, C. J. 1977, ApJ, 214, 725 [NASA ADS] [CrossRef] (In the text)
- Frerking, M. A., Langer, W. D., & Wilson, R. W. 1982, ApJ, 262, 590 [NASA ADS] [CrossRef]
- Georgelin, Y. M., & Georgelin, Y. P. 1976, A&A, 49, 57 [NASA ADS] (In the text)
- Glassgold, A. E., Huggins, P. J., & Langer, W. D. 1985, ApJ, 290, 615 [NASA ADS] [CrossRef]
- Hayakawa, T., Mizuno, A., Onishi, T., et al. 1999, PASJ, 51, 919 [NASA ADS] (In the text)
- Heyer, M. H., Brunt, C., Snell, R. L., et al. 1998, ApJS, 115, 241 [NASA ADS] [CrossRef] (In the text)
- Karr, J. L., & Martin, P. G. 2003, ApJ, 595, 900 [NASA ADS] [CrossRef] (In the text)
- Koenig, X. P., Allen, L. E., Gutermuth, R. A., et al. 2008, ApJ, 688, 1142 [NASA ADS] [CrossRef] (In the text)
- Kurtz, S., Churchwell, E., & Wood, D. O. S. 1994, ApJS, 91, 659 [NASA ADS] [CrossRef] (In the text)
- Lada, C. J., & Lada, E. A. 2003, ARA&A, 41, 57 [NASA ADS] [CrossRef] (In the text)
- Lefloch, B., & Lazareff, B. 1994, A&A, 289, 559 [NASA ADS] (In the text)
- Matsuyanagi, I., Itoh, Y., Sugitani, K., et al. 2006, PASJ, 58, L29 [NASA ADS] (In the text)
- Morgan, L. K., Thompson, M. A., Urquhart, J. S., & White, G. J. 2008, A&A, 477, 557 [NASA ADS] [CrossRef] [EDP Sciences] (In the text)
- Nakano, M., Sugitani, K., Niwa, T., Itoh, Y., & Watanabe, M. 2008, PASJ, 60 (In the text)
- Nozawa, S., Mizuno, A., Teshima, Y., Ogawa, H., & Fukui, Y. 1991, ApJS, 77, 647 [NASA ADS] [CrossRef] (In the text)
- Oasa, Y., Tamura, M., & Sugitani, K. 1999, ApJ, 526, 336 [NASA ADS] [CrossRef]
- Oasa, Y., Tamura, M., Nakajima, Y., et al. 2006, AJ, 131, 1608 [NASA ADS] [CrossRef] (In the text)
- Ogura, K. 2006, Bull. Astron. Soc. India, 34, 111 [NASA ADS] (In the text)
- Okumura, S.-I., Mori, A., Nishihara, E., Watanabe, E., & Yamashita, T. 2000, ApJ, 543, 799 [NASA ADS] [CrossRef] (In the text)
- Oort, J. H., & Spitzer, L. J. 1955, ApJ, 121, 6 [NASA ADS] [CrossRef] (In the text)
- Panagia, N. 1973, AJ, 78, 929 [NASA ADS] [CrossRef] (In the text)
- Shu, F. H. 1977, ApJ, 214, 488 [NASA ADS] [CrossRef] (In the text)
- Stahler, S. W., & Palla, F. 2005, The Formation of Stars, ed. S. W. Stahler, & F. Palla, ISBN 3-527-40559-3 (Wiley-VCH), 865 (In the text)
- Sugitani, K., Fukui, Y., & Ogura, K. 1991, ApJS, 77, 59 [NASA ADS] [CrossRef]
- Sugitani, K., Matsuo, H., Nakano, M., Tamura, M., & Ogura, K. 2000, AJ, 119, 323 [NASA ADS] [CrossRef] (In the text)
- Sugitani, K., & Ogura, K. 1994, ApJS, 92, 163 [NASA ADS] [CrossRef]
- Sugitani, K., Tamura, M., & Ogura, K. 1995, ApJ, 455, L39 [NASA ADS] [CrossRef] (In the text)
- Sunada, K., Yamaguchi, C., Nakai, N., et al. 2000, in Radio Telescopes, ed. H. R. Butcher, Proc. SPIE, 4015, 237 (In the text)
- Tachihara, K., Abe, R., Onishi, T., Mizuno, A., & Fukui, Y. 2000a, PASJ, 52, 1147 [NASA ADS] (In the text)
- Tachihara, K., Mizuno, A., & Fukui, Y. 2000b, ApJ, 528, 817 [NASA ADS] [CrossRef] (In the text)
- Urquhart, J. S., Thompson, M. A., Morgan, L. K., et al. 2007, A&A, 467, 1125 [NASA ADS] [CrossRef] [EDP Sciences] (In the text)
- Warren, Jr., W. H., & Hesser, J. E. 1978, ApJS, 36, 497 [NASA ADS] [CrossRef] (In the text)
- Whitworth, A. P., & Zinnecker, H. 2004, A&A, 427, 299 [NASA ADS] [CrossRef] [EDP Sciences] (In the text)
- Wilking, B. A., Doering, C. R., Harvey, P. M., Lada, C. J., & Joy, M. 1984, ApJ, 279, 291 [NASA ADS] [CrossRef] (In the text)
- Yamaguchi, R., Saito, H., Mizuno, N., et al. 1999, PASJ, 51, 791 [NASA ADS] (In the text)
- Zapata, L. A., Rodríguez, L. F., & Kurtz, S. E. 2001, Rev. Mex. Astron. Astrofis., 37, 83 [NASA ADS] (In the text)
Footnotes
- ...1,
![[*]](/icons/foot_motif.png)
- Present address: Nishi-Harima Astronomical Observatory, Sayo-cho, Hyogo, 679-5313, Japan.
All Tables
Table 1:
Physical parameters at peak
![]() position for each 13CO molecular cloud.
position for each 13CO molecular cloud.
Table 2:
Physical parameters of
![]() clumps.
clumps.
All Figures
| |
Figure 1:
13CO (J=1-0) line integrated intensity (orange contour) superposed on the DSS optical image around the W5-East H II region in the galactic coordinates. The dashed contour is 1.725 K
|
| Open with DEXTER | |
| In the text | |
| |
Figure 2:
C 18O (J=1-0) line integrated intensity map shown by pseudo-color superposed on the 13CO contour map. The lowest contour is 0.66 K
|
| Open with DEXTER | |
| In the text | |
| |
Figure 3:
Spatial distributions of the YSO candidates.
The pink circles and blue plus symbols indicate the approximate extent of the H II region seen in the DSS image and the exciting star BD+590578, respectively.
The orange crosses and red plus symbols correspond to Class II and Class I candidates, respectively, identified by Koenig et al. (2008) from Spitzer IRAC/MIPS observations, respectively.
The black contours represent 13CO molecular clouds from |
| Open with DEXTER | |
| In the text | |
| |
Figure 4:
Comparison of the 13CO peak column densities.
The hatched and open bars indicate molecular clouds with and without bright rims, respectively.
We assume a uniform excitation temperature of 30 K with |
| Open with DEXTER | |
| In the text | |
| |
Figure 5:
The orange contours indicate the surface density of the Class II candidates identified by Koenig et al. (2008) with
|
| Open with DEXTER | |
| In the text | |
| |
Figure 6:
Column density profile of BRC 14 (cloud 7). The horizontal axis is offset from the bright rim in the optical image. The solid, dashed, and dotted-lines are N( 13CO), N( C 18O)
|
| Open with DEXTER | |
| In the text | |
| |
Figure 7: Column density profile of BRC 13 (cloud 6). |
| Open with DEXTER | |
| In the text | |
| |
Figure 8: Column density profile of cloud 4. |
| Open with DEXTER | |
| In the text | |
| |
Figure A.1:
Comparison of detected 13CO and C 18O column densities (crosses).
The solid line and other lines represent the best-fit function by least-square fitting in this work and previous studies, respectively.
The results of |
| Open with DEXTER | |
| In the text | |
Copyright ESO 2009
Current usage metrics show cumulative count of Article Views (full-text article views including HTML views, PDF and ePub downloads, according to the available data) and Abstracts Views on Vision4Press platform.
Data correspond to usage on the plateform after 2015. The current usage metrics is available 48-96 hours after online publication and is updated daily on week days.
Initial download of the metrics may take a while.