| Issue |
A&A
Volume 500, Number 2, June III 2009
|
|
|---|---|---|
| Page(s) | 861 - 865 | |
| Section | Stellar structure and evolution | |
| DOI | https://doi.org/10.1051/0004-6361/200911648 | |
| Published online | 29 April 2009 | |
The emission polarization of RX J1856.5-3754
N. Chkheidze
Tbilisi State University, Chavchavadze Avenue 3, 0128, Tbilisi, Georgia
Received 12 January 2009 / Accepted 18 March 2009
Abstract
The polarization properties of RX J1856.5-3754 are
investigated, based on the plasma emission model presented in
previous works. It is shown that if the emission of this source is
generated by the synchrotron mechanism, then the X-ray and the
optical emission should be linearly polarized and the corresponding
degrees of linear polarization are calculated. The change of the
position angle through the observable period is investigated.
According to the model, the position angle should undergo a
full-circle rotation more than once within this period. This unusual
behaviour of the position angle is a prediction of the model and its
detection would be a strong argument in favour of it. The
measurement of the polarization patterns of this source appears to
be the most reliable way to make clear its real emission nature.
Key words: stars: pulsars: individual: RX J1856.5-3754 - radiation mechanisms: non-thermal - polarization
1 Introduction
RX J1856.5-3754 (or RXJ1856, hereafter) is one of the brightest
nearby isolated neutron stars discovered by ROSAT (Walter et al. 1996) as
an X-ray source and a large number of papers have been devoted to
explaining its nature. Its soft X-ray spectrum can be well fit by
the Planckian spectrum with a temperature
![]() eV (Burwitz et al. 2003). Thus it is supposed that the emission of this source has a thermal nature. However, the existing models based on this original assumption face problems.
eV (Burwitz et al. 2003). Thus it is supposed that the emission of this source has a thermal nature. However, the existing models based on this original assumption face problems.
The lack of any significant spectral lines in the X-ray spectrum of RXJ1856 argues against heavy element atmosphere models (Burwitz et al. 2001,2003), whereas single temperature hydrogen atmosphere fits over-predict the optical flux by a large factor (Pavlov et al. 1996; Pons et al. 2002; Burwitz et al. 2003). As none of the classic models of neutron star atmospheres are able to explain the observed X-ray spectrum, which is well fitted by a simple blackbody model (Burwitz et al. 2003), it has been proposed that the star has no atmosphere but rather has a condensed matter surface (Burwitz et al. 2001; Turolla et al. 2004). This surface might emit a virtually featureless blackbody-like spectrum (as originally proposed by Pavlov 2000). Since the broadband spectra of this source cannot be fitted by a single Planckian spectrum, it is often described by two-temperature blackbody models (Pons et al. 2002; Pavlov et al. 2002; Burwitz et al. 2003). However, condensation of surface matter requires very specific conditions to be fulfilled (Lai & Salpeter 1997; Lai 2001). Even if these conditions are satisfied, the formation of a non-uniform distribution of the surface temperature (two-temperature blackbody models) still remains unclear. The most adequate fits of the spectra give models which assume that the star has a thin hydrogen atmosphere superposed on a condensed matter surface (Motch et al. 2003; Ho et al. 2007). However, the origin of such thin hydrogen layers fitting the data is a problematic issue.
Alternatively, the observational properties of RXJ1856 can be
explained in the framework of the plasma emission model presented in
Chkheidze & Machabeli (2007) and Chkheidze & Lomiashvili (2008), which are based on well-developed theory of
pulsars. This model suggests that the emission from this object is
generated by a synchrotron mechanism, switched on as the result of
acquirement of pitch angles by relativistic electrons during the
quasi-linear stage of the cyclotron instability. The model gives
successful fits for broadband spectra, without facing problems
typical of the thermal radiation models. Considering the case of a
nearly aligned rotator (see Fig. 3), it was predicted that
the source should have pulsated with a period ![]() s
(Chkheidze & Machabeli 2007). However, subsequent XMM-Newton observations of RXJ1856
discovered that its X-ray emission pulsates with a period
s
(Chkheidze & Machabeli 2007). However, subsequent XMM-Newton observations of RXJ1856
discovered that its X-ray emission pulsates with a period
![]() s (Tiengo & Mereghetti 2007). This has been explained in the
framework of the drift wave driven model (Chkheidze & Lomiashvili 2008). In
particular, the real spin period of the pulsar might differ from the
observable one, as a consequence of the existence of very low
frequency drift waves in the region of generation of the pulsar
emission. These waves are not directly observable but result in a
periodic change of curvature of the magnetic field lines and, hence,
a periodic change of the emission direction with a period of the
drift waves assumed to be equal to the observable period
(Lomiashvili et al. 2006).
s (Tiengo & Mereghetti 2007). This has been explained in the
framework of the drift wave driven model (Chkheidze & Lomiashvili 2008). In
particular, the real spin period of the pulsar might differ from the
observable one, as a consequence of the existence of very low
frequency drift waves in the region of generation of the pulsar
emission. These waves are not directly observable but result in a
periodic change of curvature of the magnetic field lines and, hence,
a periodic change of the emission direction with a period of the
drift waves assumed to be equal to the observable period
(Lomiashvili et al. 2006).
We suppose that the most reliable argument revealing the real emission nature of this source will be its study with polarization instruments. Therefore in the present paper the polarization properties of RXJ1856 are investigated, in the framework of the plasma emission model developed in previous works (Chkheidze & Lomiashvili 2008; Chkheidze & Machabeli 2007). Here we describe the emission model in Sect. 2, investigate the emission polarization in Sect. 3, re-estimate the angular parameters provoked by recently obtained results in Sect. 4, show the behaviour of the position angle using the new values for the angular parameters in Sect. 5 and discuss our results in Sect. 6.
2 Emission mechanism
It is well known that the distribution function of relativistic
particles is one dimensional at the pulsar surface, because any
transverse momenta (![]() )
of relativistic electrons are
lost in a very short time (
)
of relativistic electrons are
lost in a very short time (![]() 10-20 s) via synchrotron
emission in very strong
10-20 s) via synchrotron
emission in very strong
![]() G magnetic fields. For
typical pulsars, the plasma consists of the following components:
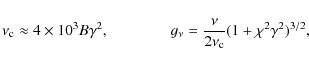
the bulk of the plasma with an average Lorentz-factor
G magnetic fields. For
typical pulsars, the plasma consists of the following components:
the bulk of the plasma with an average Lorentz-factor
![]() ;
the tail of the distribution function with
;
the tail of the distribution function with
![]() and the primary beam with
and the primary beam with
![]() (see Fig. 1 from Arons 1981). The
generation of waves is possible during the further motion of the
relativistic particles along the dipolar magnetic field lines if the
condition of cyclotron resonance is fulfilled (Kazbegi et al. 1991):
(see Fig. 1 from Arons 1981). The
generation of waves is possible during the further motion of the
relativistic particles along the dipolar magnetic field lines if the
condition of cyclotron resonance is fulfilled (Kazbegi et al. 1991):
| (1) |
where
In Chkheidze & Machabeli (2007), it has been assumed that the emission of RXJ1856 is
generated by the synchrotron mechanism, which is switched on during
the quasi-linear stage of the cyclotron instability (developed at
distances
![]() cm). The observed X-ray spectrum is the
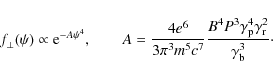
result of synchrotron radiation of the primary-beam electrons.
Particularly, the synchrotron spectrum of the beam electrons with
the initial distribution function:
cm). The observed X-ray spectrum is the
result of synchrotron radiation of the primary-beam electrons.
Particularly, the synchrotron spectrum of the beam electrons with
the initial distribution function:
![\begin{displaymath}
\textit{f} _{\parallel \rm b}=\frac{n_{\rm b}}{\sqrt{\pi}\g...
...{\rm r}-\gamma_{\rm b}\right)^{2}}{\gamma_{\rm T}^{2}}\right],
\end{displaymath}](/articles/aa/full_html/2009/23/aa11648-09/img32.png)
matches well the measured X-ray spectrum in the energy interval (0.26-0.9) keV (here
 |
(3) |
But at the same time, the radiation density appears to be sufficiently high and the self-absorption effects begin to play a main role. The synchrotron self-absorption redistributes the emission spectrum in the energy domain of relatively low frequencies and the X-ray emission spectrum corresponding to the energy interval (0.15-0.26) keV has the form of
 |
(4) |
The resulting theoretical spectrum of the synchrotron emission of the tail electrons with the distribution function (4) matches the measured one closely.
3 Emission polarization
| |
Figure 1: k is the emission direction, B the magnetic field line, v, v' and v'' are the electron velocity vectors. |
| Open with DEXTER | |
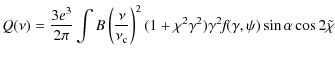
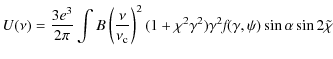
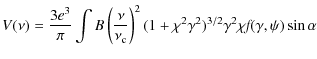
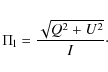
Now let us consider the polarization properties of RXJ1856. For this
reason, we have to find the Stokes parameters, which, in our case,
are defined as follows (Ginzburg 1981):
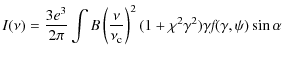
 |
|||
| (6) |
 |
|||
| (7) |
 |
|||
| (8) |
where
 |
(9) |
| (10) |
Here
The expression for the distribution function of the emitting
electrons by their perpendicular momenta depends on the value of the
following quantity
![]() (where
(where ![]() is the
mean value of the pitch angle). In our case, according to
Chkheidze & Machabeli (2007) the condition
is the
mean value of the pitch angle). In our case, according to
Chkheidze & Machabeli (2007) the condition
![]() is fulfilled for
the resonant particles. Then, the emitting particles' distribution
function from their pitch angles has the following form
(Malov & Machabeli 2002):
is fulfilled for
the resonant particles. Then, the emitting particles' distribution
function from their pitch angles has the following form
(Malov & Machabeli 2002):
 |
(11) |
Synchrotron emission of a single electron is strongly beamed along the direction of motion in a cone of approximate opening half-angle
| |
Figure 2: Point B corresponds to the magnetic field line and point A to the observer's line of sight. |
| Open with DEXTER | |
Now we can calculate the degree of linear polarization for the X-ray
and optical emission, which is defined as (Ginzburg 1981)
 |
(12) |
The degree of linear polarization of the X-ray spectrum, correspondent to the energy interval ( 0.26-0.9) keV can be calculated from Eqs. (2), (5), (6), (7) and (11), which give
 |
(13) |
where d=4, in our case. The calculation gives
The observed optical spectrum is the result of the synchrotron
emission of tail electrons with the distribution function (4). The
expression (12) yields in this case
![]() .
.
4 Estimation of the angular parameters
![\begin{figure}
\par\includegraphics[width=5cm,clip]{1648fig3.eps}
\end{figure}](/articles/aa/full_html/2009/23/aa11648-09/img81.png) |
Figure 3:
|
| Open with DEXTER | |
In previous work (Chkheidze & Lomiashvili 2008), the values of angular parameters for RXJ1856 have been estimated by fitting the simulated X-ray emission light curve with the observational data (see Fig. 2 from Chkheidze & Lomiashvili 2008). In this section more accurate fitting is done, taking into account the recently obtained results. This allows us to estimate the angular parameters more exactly.
The observations detect continuous radiation, meaning that the condition
![]() is fulfilled at any moment of time (where
is fulfilled at any moment of time (where ![]() is the opening half-angle of the X-ray emission cone). To estimate the value of
is the opening half-angle of the X-ray emission cone). To estimate the value of ![]() we use the emitting particles distribution function by their pitch angles. According to Eq. (11), the greatest possible value of the pitch angle, acquired by the beam electron at the quasi-linear stage of the cyclotron instability is of the order of
we use the emitting particles distribution function by their pitch angles. According to Eq. (11), the greatest possible value of the pitch angle, acquired by the beam electron at the quasi-linear stage of the cyclotron instability is of the order of ![]() (
(
![]() for the primary-beam electrons, Chkheidze & Machabeli 2007). The electron emits along the direction of motion through the cone with the opening angle
for the primary-beam electrons, Chkheidze & Machabeli 2007). The electron emits along the direction of motion through the cone with the opening angle ![]() ,
which for the primary-beam electrons is equal to 10-6. The magnetic field lines are nearly parallel and straight in the emitting region (as their curvature
,
which for the primary-beam electrons is equal to 10-6. The magnetic field lines are nearly parallel and straight in the emitting region (as their curvature
![]() cm). Thus, we can conclude that the angular size of the emission cone is equal to the maximal possible value of the pitch angle of the emitting electrons, meaning that the opening angle of the X-ray emission cone
cm). Thus, we can conclude that the angular size of the emission cone is equal to the maximal possible value of the pitch angle of the emitting electrons, meaning that the opening angle of the X-ray emission cone
![]() .
.
The emission intensity of the set of electrons in the given direction is defined by Eq. (5). Its time dependence can be approximately expressed in the following form:
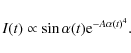
Here the angle
Here
Accordingly, for the angle
| (17) |
If
![\begin{figure}
\par\includegraphics[width=7cm,clip]{1648fig4.eps}
\end{figure}](/articles/aa/full_html/2009/23/aa11648-09/img104.png) |
Figure 4:
The simulated light curves of RX J1856.5-3754 fitted with PN and MOS observations. The solid and dotted lines correspond to
|
| Open with DEXTER | |
The fitting is done using the time dependence of the emission
intensity obtained in the framework of the model. Two simulated
light curves are plotted in Fig. 4 with different values
for the angle ![]() .
As we can see, the change of
.
As we can see, the change of ![]() causes
the appearance of additional peaks, corresponding to pulsations with
a real spin period, which is approximately equal to 1 s. Therefore,
we expect that the detection of the ``real'' spin period of RXJ1856
can be achieved with observations of higher resolution. The new
values of the angular parameters (see Table 1) give the fulfillment
of the condition
causes
the appearance of additional peaks, corresponding to pulsations with
a real spin period, which is approximately equal to 1 s. Therefore,
we expect that the detection of the ``real'' spin period of RXJ1856
can be achieved with observations of higher resolution. The new
values of the angular parameters (see Table 1) give the fulfillment
of the condition
![]() at any moment of time.
at any moment of time.
![\begin{figure}
\par\includegraphics[width=9cm,clip]{1648fig5.eps}
\end{figure}](/articles/aa/full_html/2009/23/aa11648-09/img106.png) |
Figure 5: The behaviour of the position angle of linearly polarized X-ray emission within one observable pulse. |
| Open with DEXTER | |
Table 1: The values of angular parameters for RX J1856.5-3754.
5 Position angle
It is very important to know the behaviour of the position angle of
linear polarization of the X-ray emission through the observable
pulse. If we use the spherical coordinate system
![]() (see Fig. 3), then we can write:
(see Fig. 3), then we can write:
| (18) |
| (19) |
| (20) |
The position angle is the angle between the electric field vector of the radiation and the projected spin axis on the plane of sky. From Fig. 3, it is easy to find the expression for PA
 |
(21) |
If we assume that the real spin period of RXJ1856 P=1.5 s, then in 7.055 s the star should make a full-circle rotation more than once. Consequently, the position angle should also rotate by
6 Discussion
In previous works (Chkheidze & Lomiashvili 2008; Chkheidze & Machabeli 2007) the plasma emission model of
RXJ1856 was presented. It is supposed that the emission of this
source is generated by the synchrotron mechanism. The distribution
function of relativistic particles is one dimensional at the pulsar
surface, but plasma with an anisotropic distribution function is
unstable which can lead to wave excitation. The main mechanism of
wave generation in plasmas of the pulsar magnetosphere is the
cyclotron instability. During the quasi-linear stage of the
instability, a diffusion of particles arises along and across the
magnetic field lines. Therefore, plasma particles acquire transverse
momenta and, as a result, the synchrotron mechanism is switched on.
The measured X-ray and optical spectra are the results of
synchrotron emission of primary-beam and tail electrons,
respectively. The predictable characteristic frequencies
![]() Hz and
Hz and
![]() Hz (where
Hz (where
![]() is the
frequency of the maximum in the synchrotron spectrum) lie in the
same domains as the measured spectra.
is the
frequency of the maximum in the synchrotron spectrum) lie in the
same domains as the measured spectra.
The original waves, excited during cyclotron resonance, lie in the
radio domain, but radio emission is not observed from RXJ1856. One
of the possible explanations as to why the radio emission is not
detected from this object is that the emission traverses a large
distance in the pulsar magnetosphere (since the model of a nearly
aligned rotator is used). So there is a high probability that the
excited waves are in the cyclotron damping range:
![]() (Khechinashvili & Melikidze 1997). In this case, the radio emission will not reach the
observer. Nevertheless, the detection of radio emission from RXJ1856
would be a strong argument in favour of the model.
(Khechinashvili & Melikidze 1997). In this case, the radio emission will not reach the
observer. Nevertheless, the detection of radio emission from RXJ1856
would be a strong argument in favour of the model.
The effectiveness of the cyclotron mechanism has been estimated and
it appears to be quite efficient (Chkheidze & Machabeli 2007). For effective
generation of waves it is essential that the time during which the
particles give energy to waves should be more than ![]() (where
(where
![]() is the growth rate of instability). The radio waves
propagate practically in straight lines, whereas the dipolar
magnetic field lines deviate from their initial direction, and the
angle
is the growth rate of instability). The radio waves
propagate practically in straight lines, whereas the dipolar
magnetic field lines deviate from their initial direction, and the
angle
![]() grows.
grows. ![]() is the
angle between the wave line and the line of the dipole magnetic
field. On the other hand, the resonance condition (1) imposes
limitations on
is the
angle between the wave line and the line of the dipole magnetic
field. On the other hand, the resonance condition (1) imposes
limitations on ![]() i.e. particles can resonate with the waves
propagating in a limited range of angles. The estimations show that
in our case, the fulfillment of
i.e. particles can resonate with the waves
propagating in a limited range of angles. The estimations show that
in our case, the fulfillment of
![]() cm implies
an effectiveness of the cyclotron mechanism. As the instability
develops at distances
cm implies
an effectiveness of the cyclotron mechanism. As the instability
develops at distances
![]() cm, it follows that the excited
waves lie in the resonant region long enough for particles to
acquire pitch angles and to generate the observed radiation.
cm, it follows that the excited
waves lie in the resonant region long enough for particles to
acquire pitch angles and to generate the observed radiation.
The total energy available for conversion into pulsar emission has
been estimated as
![]() .
Here,
.
Here,
![]() is the
Goldreich-Julian density at the pulsar surface and
is the
Goldreich-Julian density at the pulsar surface and
![]() is the
radius of the polar cap. The estimations show
is the
radius of the polar cap. The estimations show
![]() erg/s, which can explain the observed
X-ray luminosity of RXJ1856.
erg/s, which can explain the observed
X-ray luminosity of RXJ1856.
The recently discovered 7 s pulsations of the X-ray emission of
RXJ1856 has been explained in the framework of the drift wave driven
model. The main feature of this model is that the spin period of the
pulsar might differ from the observable period (for RXJ1856 the real
spin period is estimated to be ![]() 1 s), as a consequence of the
existence of very low frequency drift waves in the region of
generation of the pulsar emission. These particular waves are not
detected but only result in a periodic change of curvature of the
magnetic field lines, which in turn cause the change of observed
radiation with a period of the drift wave.
1 s), as a consequence of the
existence of very low frequency drift waves in the region of
generation of the pulsar emission. These particular waves are not
detected but only result in a periodic change of curvature of the
magnetic field lines, which in turn cause the change of observed
radiation with a period of the drift wave.
In the present paper the emission polarization of RXJ1856 was
investigated. It was shown that both the X-ray and the optical
emission are linearly polarized. The degree of linear polarization
for the X-ray emission is
![]() in the energy
interval
(0.15-0.26) keV and
in the energy
interval
(0.15-0.26) keV and
![]() in
the energy interval
(0.26-0.9) keV. The calculation of
polarization degree for optical emission yields
in
the energy interval
(0.26-0.9) keV. The calculation of
polarization degree for optical emission yields
![]() .
The behaviour of the position angle is
also investigated. It is shown that within 7 s it should rotate by
.
The behaviour of the position angle is
also investigated. It is shown that within 7 s it should rotate by
![]() a few times, depending on the exact value of the real
spin period. Particularly, in the present paper, the value of
P=1.5 s is taken as the real spin period of RXJ1856. In this
case the position angle makes four full rotations and a turn of
a few times, depending on the exact value of the real
spin period. Particularly, in the present paper, the value of
P=1.5 s is taken as the real spin period of RXJ1856. In this
case the position angle makes four full rotations and a turn of
![]() within the observable spin period of
within the observable spin period of
![]() s. The detection of similar behaviour of the
PA would be a strong argument in favour of the plasma emission
model.
s. The detection of similar behaviour of the
PA would be a strong argument in favour of the plasma emission
model.
We suppose that the most reliable argument revealing the real
emission nature of RXJ1856 will be the study of this object with
polarization instruments. If the emission of this source has a
thermal nature, then according to Ho (2007) (this model gives
the best match of the entire spectrum, among other thermal emission
models) the X-ray emission should be linearly polarized with the
polarization degree equal to ![]() .
The position angle should
undergo small changes for the case of
.
The position angle should
undergo small changes for the case of
![]() and
for the case of
and
for the case of
![]() it should rotate by
it should rotate by
![]() in one observable pulse (where these quantities are
the possible angles between the rotation and the magnetic pole axes
and between the rotation and the observer's axes). But if the
emission of this source is generated by the synchrotron mechanism,
it is expected that both the X-ray and the optical emissions will be
linearly polarized with the frequency dependent polarization degree,
giving the values from a few percent up to
in one observable pulse (where these quantities are
the possible angles between the rotation and the magnetic pole axes
and between the rotation and the observer's axes). But if the
emission of this source is generated by the synchrotron mechanism,
it is expected that both the X-ray and the optical emissions will be
linearly polarized with the frequency dependent polarization degree,
giving the values from a few percent up to ![]() .
The position
angle should rotate by
.
The position
angle should rotate by
![]() within one ``real'' pulse
supposed to be of the order of 1 s. It should undergo full
circular rotation several times within the observable period of
7.055 s. Also, no periodic variation of the degree of linear
polarization should be observed, since both the numerator and the
denominator of Eq. (12) have the same time dependence (see Eq. (15)).
within one ``real'' pulse
supposed to be of the order of 1 s. It should undergo full
circular rotation several times within the observable period of
7.055 s. Also, no periodic variation of the degree of linear
polarization should be observed, since both the numerator and the
denominator of Eq. (12) have the same time dependence (see Eq. (15)).
Acknowledgements
The author is grateful to George Machabeli for valuable discussions. This work was partially supported by Georgian NSF Grant ST06/4-096. N.C. thanks the Abdus Salam International Center for Theoretical Physics in Trieste, Italy.
References
- Arons, J. 1981, in Proc. Varenna Summer School and Workshop on Plasma Astrophysics, ESA, 273 (In the text)
- Burwitz, V., Zavlin, V. E., Neuhäuser, R., et al. 2001, A&A, 379, L35 [NASA ADS] [CrossRef] [EDP Sciences]
- Burwitz, V., Haberl, F., Neuhäuser, R., et al. 2003, A&A, 399, 1109 [NASA ADS] [CrossRef] [EDP Sciences] (In the text)
- Chkheidze, N., & Machabeli, G. 2007, A&A, 471, 599 [NASA ADS] [CrossRef] [EDP Sciences] (In the text)
- Chkheidze, N., & Lomiashvili, D. 2008, NewA, 13, 12 [NASA ADS] [CrossRef] (In the text)
- Drake, J. J., Marshall, H. L., Dreizler, S., et al. 2002, ApJ, 572, 996 [NASA ADS] [CrossRef]
- Ginzburg, V. L. 1981, Teoreticheskaia Fizika i Astrofizika (Moskva: Nauka) (In the text)
- Goldreich, P., & Julian, W. H. 1969, ApJ, 157, 869 [NASA ADS] [CrossRef] (In the text)
- Ho, W. C. G. 2007, MNRAS 380, 71 (In the text)
- Ho, W. C. G., Kaplan, D. L., Chang, P., Adelsberg, M., & Potekhin, A. Y. 2007, MNRAS, 375, 281 [NASA ADS] [CrossRef]
- Kazbegi A. Z., Machabeli G. Z., & Melikidze G. I. 1991, MNRAS, 253, 377 [NASA ADS] (In the text)
- Kazbegi A. Z., Machabeli G. Z., Melikidze G. I., & Shukre C. 1996, A&A, 309, 515 [NASA ADS]
- Khechinashvili, D. G., & Melikidze, G. I. 1997, A&A, 320, L45 [NASA ADS] (In the text)
- Lai, D. 2001, Rev. Mod. Phys., 73, 629 [NASA ADS] [CrossRef]
- Lai, D., & Salpeter, E. E. 1997, ApJ, 491, 270 [CrossRef]
- Lomiashvili D., Machabeli G., & Malov I. 2006, ApJ, 637, 1010 [NASA ADS] [CrossRef] (In the text)
- Malov, I, F., & Machabeli, G. Z. 2002, Astronomy Reports, 46, 684 [NASA ADS] [CrossRef] (In the text)
- Malov, I. F., & Machabeli, G. Z. 2007, Ap&SS, 29M
- Motch, C., Zavlin, V. E., & Haberl, F. 2003, A&A, 408, 323 [NASA ADS] [CrossRef] [EDP Sciences]
- Pavlov, G. G. 2000, Talk at the ITP/UCSB workshop Spin and Magnetism of Young Neutron Stars (In the text)
- Pavlov, G. G., Zavlin, V. E., Trümper, J., & Neuhäuser, R. 1996, ApJ, 472, L33 [NASA ADS] [CrossRef]
- Pavlov, G. G., Zavlin, & V. E., Sanwal, D. 2002, in Neutron Stars and Supernova Remnants, ed. W. Becher, H. Lesch, & J. Trümper, MPE Report, 278, 273
- Pons, J. A., Walter, F. M., Lattimer, J. M., et al. 2002, ApJ, 564, 981 [NASA ADS] [CrossRef]
- Ransom, S. M., Gaensler, B. M., & Slane, P. O. 2002, ApJ, 570, L75 [NASA ADS] [CrossRef]
- Sturrock P. A. 1971, ApJ, 164, 529 [NASA ADS] [CrossRef]
- Tiengo, A., & Mereghetti, S. 2007, ApJ, 657, L101 [NASA ADS] [CrossRef] (In the text)
- Treves, A., Turolla, R., Zane, S., & Colpi, M. 2000, PASP, 112, 297 [NASA ADS] [CrossRef]
- Turolla, R., Zane, S., & Drake, J. J. 2004, ApJ, 603, 265 [NASA ADS] [CrossRef]
- Walter, F. M., Wolk, S. J., & Neuhäuser, R. 1996, Nature 379, 233 (In the text)
- Zhelezniakov, V. V., 1977, Volni v Kosmicheskoi Plazme (Moskva: Nauka)
All Tables
Table 1: The values of angular parameters for RX J1856.5-3754.
All Figures
| |
Figure 1: k is the emission direction, B the magnetic field line, v, v' and v'' are the electron velocity vectors. |
| Open with DEXTER | |
| In the text | |
| |
Figure 2: Point B corresponds to the magnetic field line and point A to the observer's line of sight. |
| Open with DEXTER | |
| In the text | |
| |
Figure 3:
|
| Open with DEXTER | |
| In the text | |
| |
Figure 4:
The simulated light curves of RX J1856.5-3754 fitted with PN and MOS observations. The solid and dotted lines correspond to
|
| Open with DEXTER | |
| In the text | |
| |
Figure 5: The behaviour of the position angle of linearly polarized X-ray emission within one observable pulse. |
| Open with DEXTER | |
| In the text | |
Copyright ESO 2009
Current usage metrics show cumulative count of Article Views (full-text article views including HTML views, PDF and ePub downloads, according to the available data) and Abstracts Views on Vision4Press platform.
Data correspond to usage on the plateform after 2015. The current usage metrics is available 48-96 hours after online publication and is updated daily on week days.
Initial download of the metrics may take a while.