| Issue |
A&A
Volume 500, Number 2, June III 2009
|
|
|---|---|---|
| Page(s) | 929 - 934 | |
| Section | Astronomical instrumentation | |
| DOI | https://doi.org/10.1051/0004-6361/200811458 | |
| Published online | 29 April 2009 | |
Detecting circumstellar disks around gravitational microlenses
M. Hundertmark - F. V. Hessman - S. Dreizler
Institute for Astrophysics, University of Göttingen, Friedrich-Hund-Platz 1, 37077 Göttingen, Germany
Received 2 December 2008 / Accepted 23 March 2009
Abstract
Aims. We investigate the chance of detecting proto-planetary or debris disks in stars that induce microlensing event (lenses), and consider the modification of the light curve shapes due to occultation and extinction by the disks, as well as the gravitational deflection caused by the additional mass.
Methods. The magnification of gravitational microlensing events is calculated using the ray shooting method. The occultation is taken into account by neglecting or weighting the images on the lens plane according to a transmission map of the corresponding disk for a point source point lens (PSPL) model. The estimated frequency of events is obtained by considering the possible inclinations and optical depths of the disk.
Results. We conclude that gravitational microlensing can be used, in principle, as a tool for detecting debris disks beyond 1 kpc, but estimate that each year around 1 debris disk is expected for lens stars of F, G, or K spectral type and about 10 debris disks might have shown signatures in existing datasets.
Key words: gravitational lensing - astrometry - circumstellar matter - methods: data analysis
1 Introduction
Since the discovery of the first circumstellar dust disk around Vega by the Infrared Astronomy Satellite (Aumann et al. 1984), at least 101 circumstellar disks have been resolved around pre-main and main sequence stars out to a distance of 1 kpc![]() , including 17 so-called debris disks. Proto-planetary disks may be quite common during the pre-main sequence life of a star; but with a maximum life span of only 10 Myr, a galactic star formation rate of
, including 17 so-called debris disks. Proto-planetary disks may be quite common during the pre-main sequence life of a star; but with a maximum life span of only 10 Myr, a galactic star formation rate of
![]() ,
an upper limit of 400 billion stars in the MilkyWay (McKee & Williams 1997; Diehl et al. 2006), the chance of a random star containing a proto-planetary disk is only about 0.01%. The debris disks that remain thereafter last much longer, perhaps as long as 10 Gyr (e.g. Greaves 2005), so should be much more common.
Trilling et al. (2008) have shown that the occurrence of 70
,
an upper limit of 400 billion stars in the MilkyWay (McKee & Williams 1997; Diehl et al. 2006), the chance of a random star containing a proto-planetary disk is only about 0.01%. The debris disks that remain thereafter last much longer, perhaps as long as 10 Gyr (e.g. Greaves 2005), so should be much more common.
Trilling et al. (2008) have shown that the occurrence of 70 ![]() m excess emission in a sample of F, G, and K stars - presumedly due to dust in some form of debris disk - is
m excess emission in a sample of F, G, and K stars - presumedly due to dust in some form of debris disk - is ![]() %. In contrast, practically no main sequence M-stars show excess
%. In contrast, practically no main sequence M-stars show excess ![]() m emission: Rhee et al. (2007) have found only one disk (AU Mic) from a sample of
m emission: Rhee et al. (2007) have found only one disk (AU Mic) from a sample of ![]() 900 M-stars.
900 M-stars.
While a common phenomenon, circumstellar disks around main sequence stars can be difficult to detect using the standard methods of coronography and the detection of excess infrared emission. A third method - detecting the disks in absorption against a background source - works very well for dense proto-planetary disks seen against an emission nebula (``proplyds''; McCaughrean & O'Dell 1996), but debris disks around main sequence stars are optically thin and unlikely to be found in front of a bright background.
Gravitational lensing could provide an additional method for detecting and
characterizing circumstellar disks by creating a well-defined and bright, if temporary and geometrically complicated, background source. If the projected distance between the lens star and the background source is small enough, the source star appears to separate into two geometrically extended objects - the source of the photometric magnification in so-called microlensing, where the lensed object is not resolved. The angular scale of gravitational lensing is given by the Einstein radius
where
![\begin{figure}
\par\includegraphics[width=16cm,clip]{1458fig1.eps}
\end{figure}](/articles/aa/full_html/2009/23/aa11458-08/img26.png) |
Figure 1:
Light curve of the point source point lens model occulted by an optically thick edge-on disk is plotted along with the corresponding source and image tracks and the astrometrically detectable astrometric offset from the source. Features A and B are caused by the occultation of the less magnified image while feature C is obtained from the occultation of both images. The impact parameter is
|
| Open with DEXTER | |
Bozza & Mancini (2002a) and Bozza et al. (2002b) have
studied the effects of microlensing by lenses consisting of gas clouds and
interacting binaries, which may be used as an approximation for a face-on proto-planetary disk and Zheng & Ménard (2005) have considered
the effects of disks around microlensing source stars, but to our knowledge the detectibility of circumstellar disks around lens stars has not been considered in the literature. About ![]() of the observed lens stars towards Baade's window are M stars and smaller, and only
of the observed lens stars towards Baade's window are M stars and smaller, and only ![]() 25% are of spectral type F, G, or K (Dominik 2006). Given that the microlensing survey groups OGLE (Udalski et al. 1994) and MOA (Abe et al. 1997) are detecting about 1000 events per year, the fraction of events containing a debris disk should be significant: about
4.0% or currently
25% are of spectral type F, G, or K (Dominik 2006). Given that the microlensing survey groups OGLE (Udalski et al. 1994) and MOA (Abe et al. 1997) are detecting about 1000 events per year, the fraction of events containing a debris disk should be significant: about
4.0% or currently ![]() 40/year. The chance of detecting proto-planetary disks among lens stars is correspondingly lower: 0.025% or
40/year. The chance of detecting proto-planetary disks among lens stars is correspondingly lower: 0.025% or ![]() 0.25 per year (neglecting the additional absorption likely to be found within star-forming regions). Although only 1 in 8000 lensed stars have proto-planetary disks, future
surveys like the Microlensing Planet Finder (Bennett et al.
2004) or EUCLID (e.g. Beaulieu et al. 2008) have a chance of detecting a significant number of such rare events.
0.25 per year (neglecting the additional absorption likely to be found within star-forming regions). Although only 1 in 8000 lensed stars have proto-planetary disks, future
surveys like the Microlensing Planet Finder (Bennett et al.
2004) or EUCLID (e.g. Beaulieu et al. 2008) have a chance of detecting a significant number of such rare events.
The effects of a circumstellar disk on microlensing light curves can be separated into two very different regimes. The disk can occult or at least extinct the light of the source star as it is bent around the lens star - a simple geometric effect given a description of the geometry and matter distribution of the disk and the geodesic paths of the photons from the source.
Alternatively, the mass of the disk itself can distort the geodesic paths of
the photons and hence change the apparent areas of the distorted source images
and the resulting light curve independent of any occultation or extinction effects.
The purely geometric disk parameters are the projected size, shape, inclination, and orientation angle ![]() of the major axis of the disk relative to the path of the source star and the size of the lens star's Einstein radius. The typical outer radii of proto-planetary disks are about 100-800 AU and of debris disks about 50 to 100 AU, (e.g. Greaves 2005)
corresponding to 20-320
of the major axis of the disk relative to the path of the source star and the size of the lens star's Einstein radius. The typical outer radii of proto-planetary disks are about 100-800 AU and of debris disks about 50 to 100 AU, (e.g. Greaves 2005)
corresponding to 20-320
![]() for a typical lens. In both cases we
adapt an outer radius of 150 AU as chosen by Brauer et al. (2008).
for a typical lens. In both cases we
adapt an outer radius of 150 AU as chosen by Brauer et al. (2008).
In the following we discuss the chance of detecting circumstellar disks by simulating a variety of potential light curves. We will start with optically thick disks, where the optical depth is greater than one (cf. Krivov 2005) representing the young proto-planetary disk phase and show that the corresponding magnification structure is scaled according to the ratio of the disk mass and its stellar host. This insight leads us to the most likely case of a microlens surrounded by an old debris disk modeled as optically thin and geometrically thick attenuating disks with optical depths
![]() .
.
2 Optically thick proto-planetary disks
Given that the major microlensing effects occur for impact parameters less than a few Einstein radii, a magnified background source will only be visible behind proto-planetary disks with high inclinations; disks with low inclinations may be too large to show any light deflection effects and will only show simpler occultations of non-magnified sources. Similarly, debris disks with high inclinations are more likely to be detected because both the projected extinction and the projected mass-density responsible for any additional lensing effect will be higher.
An optically thick disk can be modeled as an occulting disk with given inclination and orientation angles as parameters. The features of the corresponding light curves and the astrometrically observable change of the centroid (see Han & Lee 2002) of both images are illustrated in Fig. 1, neglecting the gravitational deflection due to the disk mass. The less magnified image is occulted close to the maximum of magnification. Because the disk structure is bound to the lens, it is unlikely to occult the magnified image exclusively, unless the edge-on-disk is nearly parallel to the straight line through the two images and the lens. An asymmetric total occultation of both images as in Fig. 1 indicates that an optically thick disk structure is present.
In addition to the purely photometric effect, the occultation also
produces a shift in the center-of-light position of the lensed source,
albeit small. The astrometric offset due to the occultation of the less
magnified images, without parallax effects (see Gould 1992), can be estimated by assuming that these images are located close to the Einstein radius
where u denotes the lens-source separation in
Given the rarity of such young disks and the difficulty of seeing microlensing effects, detecting such disks photometrically and astrometrically is not impossible but unlikely.
3 Optically thin debris disks
3.1 Geometrically thin disks
Up to now, we have neglected the gravitational deflection by the mass content of the circumstellar disk, represented by the mass surface density
(e.g. Brauer et al. 2008), where
Assuming ![]() is small, the maximum change in deflection angle and magnification is for edge-on oriented disks, whose effective linear mass distribution can be calculated by integrating the surface density. The deflection angle of the combined point source point lens (PSPL) and edge-on disk model has no rotational symmetry, so we have to consider the vectorial deflection angle
is small, the maximum change in deflection angle and magnification is for edge-on oriented disks, whose effective linear mass distribution can be calculated by integrating the surface density. The deflection angle of the combined point source point lens (PSPL) and edge-on disk model has no rotational symmetry, so we have to consider the vectorial deflection angle
![]() .
An analytical expression can be derived if one integrates the normalized line
density in the lens plane
.
An analytical expression can be derived if one integrates the normalized line
density in the lens plane
![]() along the disk radius
along the disk radius
![]() ,
expressed in units of the Einstein radius (cf. Schneider et al. 1992):
,
expressed in units of the Einstein radius (cf. Schneider et al. 1992):
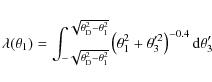
The normalized line density for a mass distribution parallel to
 |
(5) |
where
| |
= | 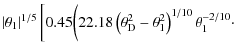 |
|
![$\displaystyle _2F_1 \left(-\frac{1}{10};\frac{4}{10};\frac{9}{10};\frac{\theta_1^2}{\theta_{\rm D}^2-\theta_1^2}\right)-18.94 \bigg) \bigg],$](/articles/aa/full_html/2009/23/aa11458-08/img48.png) |
(6) |
which can be efficiently evaluated when separated far enough from the singularities at
![\begin{figure}
\par\includegraphics[width=8cm,clip]{1458fig2.eps}
\end{figure}](/articles/aa/full_html/2009/23/aa11458-08/img53.png) |
Figure 2:
The normalized line density of an edge-on oriented disk with a surface density
|
| Open with DEXTER | |
Even though the lens equation with the additional term for the deflection
angle cannot be solved analytically, the disk can be embedded in a ray
shooting framework (Kayser et al. 1986, Wambsganss
1997, 1999). For
![]() ,
the calculated magnification offset within 1
,
the calculated magnification offset within 1
![]() from the disk is
from the disk is
![]() 1; hence potentially observable. Close to the linear mass distribution representing the disk, one sees an additional rectangular magnification caused by
the attraction of rays (Fig. 3). For small source-lens separations u (here
1; hence potentially observable. Close to the linear mass distribution representing the disk, one sees an additional rectangular magnification caused by
the attraction of rays (Fig. 3). For small source-lens separations u (here
![]() ), the singular peak splits in two in the central region. For
), the singular peak splits in two in the central region. For
![]() ,
the affected region of the
extended box is 0.02
,
the affected region of the
extended box is 0.02
![]() and the central distortion has a relative
deviation greater than 1% for 0.2
and the central distortion has a relative
deviation greater than 1% for 0.2
![]() ,
where the Einstein radius is calculated for the total mass of the system.
,
where the Einstein radius is calculated for the total mass of the system.
![\begin{figure}
\par\includegraphics[width=8.5cm,clip]{1458fig3.eps}
\end{figure}](/articles/aa/full_html/2009/23/aa11458-08/img58.png) |
Figure 3:
Top: magnification map for a linear mass distribution
created by ray shooting (Eq. (4)) for the combination of a point lens and a disk mass of 20% of the
stellar host along with contour lines of magnifications at
|
| Open with DEXTER | |
![\begin{figure}
\par\includegraphics[width=17cm,clip]{1458fig4.eps}
\end{figure}](/articles/aa/full_html/2009/23/aa11458-08/img61.png) |
Figure 4:
Contour lines of maximal relative deviation from PSPL and a grid of attenuated light curves with
|
| Open with DEXTER | |
According to Eq. (4), the
width of the distortion is proportional to
![]() and thus to
the mass ratio
and thus to
the mass ratio ![]() for
for
![]() .
The rectangular distortion is redistributed in case of an inclined disk
due to the conservation of rays: for
.
The rectangular distortion is redistributed in case of an inclined disk
due to the conservation of rays: for
![]() the conserved integral of
the rectangular distortion reduces the peak deviation to 2% and a face-on rotational symmetric disk has no effect at all. If the disk has
no central gap, a deviation containing a split singularity is observable as
long as the finite size of the source star does not smooth it out. Considering a bright giant source star with 10
the conserved integral of
the rectangular distortion reduces the peak deviation to 2% and a face-on rotational symmetric disk has no effect at all. If the disk has
no central gap, a deviation containing a split singularity is observable as
long as the finite size of the source star does not smooth it out. Considering a bright giant source star with 10 ![]() and
thus
and
thus
![]() at 8 kpc, this limit is reached at a mass ratio of
0.014 and, in the case of inclined disks, even earlier.
at 8 kpc, this limit is reached at a mass ratio of
0.014 and, in the case of inclined disks, even earlier.
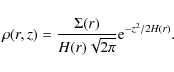
Calculating the extinction in a geometrically and optically thin debris
disk requires an estimation of the vertical optical depth
![]() .
The mean R-band optical depth of AU Mic is in the range 10-3 to 10-4 (Kalas 2004). Using Eq. (3) and an area-weighting of
.
The mean R-band optical depth of AU Mic is in the range 10-3 to 10-4 (Kalas 2004). Using Eq. (3) and an area-weighting of ![]() ,
one obtains an estimate of the extinction coefficient (assumed to be constant)
,
one obtains an estimate of the extinction coefficient (assumed to be constant)
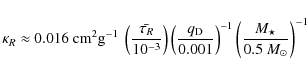 |
(7) |
and a final R-band optical depth distribution
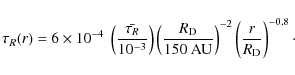
For a typical inner disk radius of 0.03 AU,
![\begin{figure}
\par\includegraphics[width=15cm,clip]{1458fig5.eps}
\end{figure}](/articles/aa/full_html/2009/23/aa11458-08/img74.png) |
Figure 5:
Differential light curves of a geometrically thick disk with a central hole are shown for different inclinations i and orientations |
| Open with DEXTER | |
3.2 Geometrically thick disks
The attenuating effect of a circumstellar disk depends especially on the path
length of the light ray through the disk and thus on its shape. For an edge-on
configuration and a 0.5 ![]() star of 0.6
star of 0.6 ![]() ,
the deflection causes a
vertical shift of 10-3 AU at 150 AU in the vertical direction and can be
neglected. In the following, a geometrically thick disk with a Gaussian vertical dust distribution and a scale height
,
the deflection causes a
vertical shift of 10-3 AU at 150 AU in the vertical direction and can be
neglected. In the following, a geometrically thick disk with a Gaussian vertical dust distribution and a scale height
![]() is used (for AU Mic cf. Metchev et al. 2005;
Krist et al. 2005). The density
is used (for AU Mic cf. Metchev et al. 2005;
Krist et al. 2005). The density ![]() of the disk is given by
of the disk is given by
 |
(9) |
The normalization constant is determined by integrating
 |
(10) |
In PSPL models the light path is usually parameterized using two straight lines according to the thin lens approximation. To first order, the true light path is a hyperbola: according to Gönner (1996, p. 206), the maximal deviation of the distance of closest approach R from the hyperbola is
 |
(11) |
where M is the mass of the deflecting star. The maximal deviation from the thin lens approximation for grazing incidence is
The sensitivity of different models for
![]() is shown in
Fig. 4. The source track for each pair of
is shown in
Fig. 4. The source track for each pair of ![]() was limited to a range from -1 to 1
was limited to a range from -1 to 1
![]() and the impact parameter
and the impact parameter
![]() has been kept fixed. It does not change the maximal variation of the transmissivity, only the maximal distance from the center. While the two-dimensional model (projected surface density) with
has been kept fixed. It does not change the maximal variation of the transmissivity, only the maximal distance from the center. While the two-dimensional model (projected surface density) with
![]() shows a maximal deviation below 1%, the more realistic
three-dimensional model with
shows a maximal deviation below 1%, the more realistic
three-dimensional model with
![]() shows an increased
deviation at high inclinations, because the transversed matter is taken into
account. The smaller the outer radius of the disk, the poorer the
detectability. From the calculated sensitivity pattern the fraction of the
parameter space exceeding 1%, i.e. 10 mmag, can be calculated: 17% for
shows an increased
deviation at high inclinations, because the transversed matter is taken into
account. The smaller the outer radius of the disk, the poorer the
detectability. From the calculated sensitivity pattern the fraction of the
parameter space exceeding 1%, i.e. 10 mmag, can be calculated: 17% for
![]() AU, 34% for
AU, 34% for
![]() AU, and 50%
for
AU, and 50%
for
![]() AU. These results are valid for a system without any inner
clearing, but Wyatt et al. (2007) have concluded from observations that
AU. These results are valid for a system without any inner
clearing, but Wyatt et al. (2007) have concluded from observations that
![]() show hot dust close to the star. Assuming an inner radius of
10 AU changes the detectability to 10% for
show hot dust close to the star. Assuming an inner radius of
10 AU changes the detectability to 10% for
![]() AU , to 18% for
AU , to 18% for
![]() AU, and to 23% for
AU, and to 23% for
![]() AU. Changing the scale height redistributes the sensitivity to smaller inclinations.
AU. Changing the scale height redistributes the sensitivity to smaller inclinations.
In Fig. 5, five different sensitivity configurations are calculated for
![]() AU and an inner gap with
10 AU radius. Simulations for 100 AU and 150 AU show similar results: all of them show a systematic decrease in the residuals close to the maximal magnification, especially at high inclination. The source and image tracks plotted over the map of
transmissivity explain this behavior for a surface density modeled as
an inverse power law. The image with positive parity reaches its maximal separation from
the lens when the source-lens distance is minimal, therefore the optical
depth
AU and an inner gap with
10 AU radius. Simulations for 100 AU and 150 AU show similar results: all of them show a systematic decrease in the residuals close to the maximal magnification, especially at high inclination. The source and image tracks plotted over the map of
transmissivity explain this behavior for a surface density modeled as
an inverse power law. The image with positive parity reaches its maximal separation from
the lens when the source-lens distance is minimal, therefore the optical
depth
![]() is also minimal. This indicates one possibility of detecting circumstellar disks - fitting a PSPL model
and analyzing the structure of the residuals within a few Einstein radii. The
simulated light curves show deviations between 0.1%
and 1% (i.e. 1 and 10 mmag without blending flux), a signal that is
detectable by a dedicated space mission like the Microlensing Planet
Finder or EUCLID.
is also minimal. This indicates one possibility of detecting circumstellar disks - fitting a PSPL model
and analyzing the structure of the residuals within a few Einstein radii. The
simulated light curves show deviations between 0.1%
and 1% (i.e. 1 and 10 mmag without blending flux), a signal that is
detectable by a dedicated space mission like the Microlensing Planet
Finder or EUCLID.
4 Relative extinction curves
It is possible to tell a priori whether a certain microlens is surrounded by
attenuating matter if a wavelength-dependent extinction signal can be seen. When fitting a PSPL model, the residuals can be used to show where relative attenuation in the lens plane occurs between images taken at different wavelengths. A combination of photometric and astrometric follow-up
could then infer the extinction structure of the central zone by measuring
the extinction coefficient for each image: the centroid of the lensed source star will move slightly to the less dimmed image. The centroid
![]() with
extinction is located at
with
extinction is located at
where
One of the transmission coefficients can be calculated from Eqs. (12) and (13):
Ideally, brightness and position are measured simultaneously and thus the measured magnification
5 Conclusions
We have shown that gravitational microlensing can - in principle - be used as a tool for detecting circumstellar disks beyond 1 kpc when the photometric
residuals relative to a PSPL model are searched for deviations between -3 and 3
![]() around the maximal magnification. We estimate that 4% of all F, G, & K-microlenses contain debris disks. However, if the optical depth
around the maximal magnification. We estimate that 4% of all F, G, & K-microlenses contain debris disks. However, if the optical depth
![]() (age
(age ![]() 1 Gyr), a tenth of these objects should have
detectable disks. Assuming a power-law model for the
surface density
1 Gyr), a tenth of these objects should have
detectable disks. Assuming a power-law model for the
surface density
![]() and depending on the inner and outer
radii distribution of debris disks, between 10 and 50% of all remaining light curves could show deviations greater than 1%. For
and depending on the inner and outer
radii distribution of debris disks, between 10 and 50% of all remaining light curves could show deviations greater than 1%. For ![]() 4000 existing light curves from the OGLE collaboration, we expect that around 10 of the F, G & K-lenses show a detectable signature induced by a debris disk. If we consider that anomalous
microlensing events, i.e. events that are not well-described by a PSPL model,
can also display systematic variations and blending occurs, it is unlikely that debris disks can be discovered from the existing datasets. Nevertheless, future space missions will almost certainly provide the required accuracy for detecting debris disks and probing the attenuating matter.
4000 existing light curves from the OGLE collaboration, we expect that around 10 of the F, G & K-lenses show a detectable signature induced by a debris disk. If we consider that anomalous
microlensing events, i.e. events that are not well-described by a PSPL model,
can also display systematic variations and blending occurs, it is unlikely that debris disks can be discovered from the existing datasets. Nevertheless, future space missions will almost certainly provide the required accuracy for detecting debris disks and probing the attenuating matter.
Acknowledgements
This work was inspired by the Wilhelm und Else Heraeus Physics School ``The Early Phase of Planet Formation''. M.H. would like to acknowledge the support by the German-Israeli Foundation and from the Graduiertenkolleg 1351.
References
- Abe, F., Allen, W., Banks, T., et al. 1997, Variables Stars and the Astrophysical Returns of the Microlensing Surveys, 75 (In the text)
- Abramowitz, M., & Stegun, I. A. 1972, Handbook of Mathematical Functions (New York: Dover), 1972 (In the text)
- Augereau, J.-C., & Beust, H. 2006, A&A, 455, 987 [NASA ADS] [CrossRef] [EDP Sciences] (In the text)
- Aumann, H. H., Beichman, C. A., Gillett, F. C., et al. 1984, ApJ, 278, L23 [NASA ADS] [CrossRef] (In the text)
- Beaulieu, J.-P., Bennett, D. P., Fouqué, P., et al. 2006, Nature, 439, 437 [NASA ADS] [CrossRef] (In the text)
- Beaulieu, J. P., Kerins, E., Mao, S., et al. 2008 [arXiv:0808.0005] (In the text)
- Bennett, D. P., Bond, I., Cheng, E., et al. 2004, Proc. SPIE, 5487, 1453 [NASA ADS] (In the text)
- Bennett, D. P., Bond, I. A., Udalski, A., et al. 2008, ApJ, 684, 663 [NASA ADS] [CrossRef] (In the text)
- van den Bergh, S. 1990, JRASC, 84, 410 [NASA ADS]
- Boden, A. F., Shao, M., & van Buren, D. 1998, ApJ, 502, 538 [NASA ADS] [CrossRef]
- Bozza, V., & Mancini, L. 2002, A&A, 394, L47 [NASA ADS] [CrossRef] [EDP Sciences] (In the text)
- Bozza, V., Jetzer, P., Mancini, L., & Scarpetta, G. 2002, A&A, 382, 6 [NASA ADS] [CrossRef] [EDP Sciences] (In the text)
- Brauer, F., Dullemond, C. P., & Henning, T. 2008, A&A, 480, 859 [NASA ADS] [CrossRef] [EDP Sciences] (In the text)
- Diehl, R., Halloin, H., Kretschmer, K., et al. 2006, Nature, 439, 45 [NASA ADS] [CrossRef] (In the text)
- Dominik, C., & Decin, G. 2003, ApJ, 598, 626 [NASA ADS] [CrossRef]
- Dominik, M. 2006, MNRAS, 367, 669 [NASA ADS] [CrossRef] (In the text)
- Gönner, H. 1996, Einführung in die spezielle und allgemeine Relativitätstheorie (Berlin: Spektrum Akademischer Verlag, Heidelberg) (In the text)
- Gould, A. 1992, ApJ, 392, 442 [NASA ADS] [CrossRef] (In the text)
- Greaves, J. S. 2005, Science, 307, 68 [NASA ADS] [CrossRef] (In the text)
- Han, C., & Lee, C. 2002, MNRAS, 329, 163 [NASA ADS] [CrossRef] (In the text)
- Kalas, P., Liu, M. C., & Matthews, B. C. 2004, Science, 303, 1990 [NASA ADS] [CrossRef] (In the text)
- Kayser, R., Refsdal, S., & Stabell, R. 1986, A&A, 166, 36 [NASA ADS] (In the text)
- Krivov, A. V. 2005, LPI Contributions, 1280, 98 [NASA ADS] (In the text)
- Krist, J. E., Ardila, D. R., Golimowski, D. A., et al. 2005, AJ, 129, 1008 [NASA ADS] [CrossRef] (In the text)
- Lindegren, L., & Perryman, M. A. C. 1996, A&AS, 116, 579 [NASA ADS] [CrossRef] [EDP Sciences] (In the text)
- McCaughrean, M. J., & O'dell, C. R. 1996, AJ, 111, 1977 [NASA ADS] [CrossRef] (In the text)
- McKee, C. F., & Williams, J. P. 1997, ApJ, 476, 144 [NASA ADS] [CrossRef] (In the text)
- Metchev, S. A., Eisner, J. A., Hillenbrand, L. A., & Wolf, S. 2005, ApJ, 622, 451 [NASA ADS] [CrossRef] (In the text)
- Paczynski, B. 1991, ApJ, 371, L63 [NASA ADS] [CrossRef] (In the text)
- Paczynski, B. 1998, ApJ, 494, L23 [NASA ADS] [CrossRef] (In the text)
- Rattenbury, N. J., & Mao, S. 2006, MNRAS, 365, 792 [NASA ADS] [CrossRef] (In the text)
- Rhee, J. H., Song, I., Zuckerman, B., & McElwain, M. 2007, ApJ, 660, 1556 [NASA ADS] [CrossRef] (In the text)
- Schneider, P., Ehlers, J., & Falco, E. E. 1992, Gravitational Lenses, XIV (Berlin, Heidelberg, New York: Springer-Verlag) (In the text)
- Trilling, D. E., Bryden, G., Beichman, C. A., et al. 2008, ApJ, 674, 1086 [NASA ADS] [CrossRef] (In the text)
- Udalski, A., Szymanski, M., Kaluzny, J., et al. 1994, Acta Astron., 44, 227 [NASA ADS] (In the text)
- Unwin, S. C., Shao, M., Tanner, Angelle, M., et al. 2008, PASP, 120, 38 [NASA ADS] [CrossRef] (In the text)
- Wambsganss, J. 1997, MNRAS, 284, 172 [NASA ADS] (In the text)
- Wambsganss, J. 1999, J. Comput. Appl. Math., 109, 353 [NASA ADS] [CrossRef] (In the text)
- Wambsganss, J. 2006, Saas-Fee Advanced Course 33: Gravitational Lensing: Strong, Weak and Micro, 453 (In the text)
- Wyatt, M. C., Smith, R., Greaves, J. S., Beichman, C. A., Bryden, G., & Lisse, C. M. 2007, ApJ, 658, 569 [NASA ADS] [CrossRef] (In the text)
- Zheng, Z., & Ménard, B. 2005, ApJ, 635, 599 [NASA ADS] [CrossRef] (In the text)
Footnotes
All Figures
| |
Figure 1:
Light curve of the point source point lens model occulted by an optically thick edge-on disk is plotted along with the corresponding source and image tracks and the astrometrically detectable astrometric offset from the source. Features A and B are caused by the occultation of the less magnified image while feature C is obtained from the occultation of both images. The impact parameter is
|
| Open with DEXTER | |
| In the text | |
| |
Figure 2:
The normalized line density of an edge-on oriented disk with a surface density
|
| Open with DEXTER | |
| In the text | |
| |
Figure 3:
Top: magnification map for a linear mass distribution
created by ray shooting (Eq. (4)) for the combination of a point lens and a disk mass of 20% of the
stellar host along with contour lines of magnifications at
|
| Open with DEXTER | |
| In the text | |
| |
Figure 4:
Contour lines of maximal relative deviation from PSPL and a grid of attenuated light curves with
|
| Open with DEXTER | |
| In the text | |
| |
Figure 5:
Differential light curves of a geometrically thick disk with a central hole are shown for different inclinations i and orientations |
| Open with DEXTER | |
| In the text | |
Copyright ESO 2009
Current usage metrics show cumulative count of Article Views (full-text article views including HTML views, PDF and ePub downloads, according to the available data) and Abstracts Views on Vision4Press platform.
Data correspond to usage on the plateform after 2015. The current usage metrics is available 48-96 hours after online publication and is updated daily on week days.
Initial download of the metrics may take a while.