| Issue |
A&A
Volume 500, Number 2, June III 2009
|
|
|---|---|---|
| Page(s) | 657 - 665 | |
| Section | Cosmology (including clusters of galaxies) | |
| DOI | https://doi.org/10.1051/0004-6361/200811077 | |
| Published online | 08 April 2009 | |
CFHTLS weak-lensing
constraints on the neutrino masses![[*]](/icons/foot_motif.png)
I. Tereno1,2 - C. Schimd3,4 - J.-P. Uzan2 - M. Kilbinger2 - F. H. Vincent2 - L. Fu5,2,6
1 - Argelander-Institut für Astronomie, Auf dem Hügel 71,
53121 Bonn, Germany
2 -
Institut d'Astrophysique de Paris, CNRS UMR 7095 & UPMC, 98 bis bd Arago, 75014 Paris, France
3 -
Laboratoire d'Astrophysique de Marseille, 38 rue Joliot-Curie, 13388 Marseille, France
4 -
Université de Provence - Aix - Marseille I , Marseille, France
5 -
INAF - Osservatorio Astronomico di Capodimonte, via Moiariello 16, 80131
Napoli, Italy
6 -
Shanghai Key Lab for Astrophysics, Shanghai Normal University,
200234 Shanghai, PR China
Received 3 October 2008 / Accepted 7 February 2009
Abstract
Context. Oscillation experiments yield strong evidence that at least some neutrinos are massive. As a hot dark-matter component, massive neutrinos should modify the expansion history of the Universe as well as the evolution of cosmological perturbations, in a different way from cold dark matter or dark energy.
Aims. We use the latest release of CFHTLS cosmic-shear data to constrain the sum of the masses
![]() of neutrinos, assuming three degenerate mass states. We also consider a joint analysis including other cosmological observables, notably CMB anisotropies, baryonic acoustic oscillations, and distance modulus from type Ia supernovae.
of neutrinos, assuming three degenerate mass states. We also consider a joint analysis including other cosmological observables, notably CMB anisotropies, baryonic acoustic oscillations, and distance modulus from type Ia supernovae.
Methods. Combining CAMB with a lensing code, we compute the aperture mass variance using a suitable recipe to deal with matter perturbations in the non-linear regime. The statistical analysis is performed by sampling an 8-dimensional likelihood on a regular grid as well as using the importance sampling technique.
Results. We obtain the first constraint on neutrino masses based on cosmic-shear data, and combine CFHTLS with WMAP, SDSS, 2dFGRS, Gold-set, and SNLS data. The joint analysis yields 0.03 eV
![]() eV at the 95% confidence level. The preference for massive neutrinos vanishes when systematics are included.
eV at the 95% confidence level. The preference for massive neutrinos vanishes when systematics are included.
Key words: cosmology: cosmological parameters - neutrinos - cosmology: large-scale structure of Universe - gravitational lensing
1 Introduction
The construction of a cosmological model (Bondi 1960; Ellis 1971), must take into account any progress in the understanding of the laws of physics. To date, the reference model
We know now that it is imperative to include the effects of massive
neutrinos, which behave as a warm or hot dark matter component depending
on their mass. Strong evidence of such particles, which have not yet been
included in
the standard model of particle physics but whose existance is supported by
e.g. grand-unified
theories (Calibbi et al. 2006), emerges from experimental results on oscillations
of atmospheric, solar, and accelerator- or reactor-produced neutrinos,
such as Super-Kamiokande, K2K, MINOS, KamLAND
(see Gonzalez-Garcia & Maltoni 2008, for a review).
These results indicate a mixing of the three known neutrinos species by
non-vanishing squared mass differences between the mass eigenstates
and the non-vanishing corresponding mixing angles. The most recent
results are
![]() eV2,
eV2,
![]() eV2, and mixing angles of
eV2, and mixing angles of
![]() ,
,
![]() ,
and
,
and
![]() .
These values yield a lower bound on the heavier mass of order
0.06 (0.1) eV
for normal (inverted) hierarchy, but cannot give the absolute mass scale.
Forthcoming experiments based on other mechanisms, such as SuperNEMO
(conceived to detect the neutrinoless double
.
These values yield a lower bound on the heavier mass of order
0.06 (0.1) eV
for normal (inverted) hierarchy, but cannot give the absolute mass scale.
Forthcoming experiments based on other mechanisms, such as SuperNEMO
(conceived to detect the neutrinoless double ![]() decay) and KATRIN
(designed to probe the tritium
decay) and KATRIN
(designed to probe the tritium ![]() decay) are designed to measure
directly the absolute mass of the electron neutrino with
a sensitivity of 0.05 and 0.2 eV, respectively.
decay) are designed to measure
directly the absolute mass of the electron neutrino with
a sensitivity of 0.05 and 0.2 eV, respectively.
Cosmological observations are compelling in providing an
independent way to probe the absolute neutrino mass. The effect of
light massive fermions in cosmology is well understood
(see Lesgourgues & Pastor 2006, for a review). The standard cosmological
model predicts the existence of relic neutrinos that decouple
from the primeval plasma while ultra-relativistic and produce a
cosmic neutrino background, which cannot yet be detected directly.
Their contribution to the total radiation energy density is a
fraction
![]() of the contribution of
photons,
of the contribution of
photons, ![]() and
and ![]() being the
temperatures of the neutrino and the photon backgrounds, respectively. The
effective number of neutrinos is constrained to be
being the
temperatures of the neutrino and the photon backgrounds, respectively. The
effective number of neutrinos is constrained to be
![]() ,
if
there are no extra relativistic degrees of freedom besides three active
neutrinos (Mangano et al. 2002), and has an impact mainly on the primordial
nucleosynthesis and the time of matter-radiation equality.
Analyses of light element abundances (Cuoco et al. 2004) and of the
time of equality (Komatsu et al. 2009) produce results that agree with this
value.
,
if
there are no extra relativistic degrees of freedom besides three active
neutrinos (Mangano et al. 2002), and has an impact mainly on the primordial
nucleosynthesis and the time of matter-radiation equality.
Analyses of light element abundances (Cuoco et al. 2004) and of the
time of equality (Komatsu et al. 2009) produce results that agree with this
value.
When neutrinos become non-relativistic, their velocities begin to decrease
from c as ![]() ,
due to momentum conservation. Assuming that the mass states are
degenerate (
,
due to momentum conservation. Assuming that the mass states are
degenerate (
![]() ), the velocity is given by
), the velocity is given by
![]() or, since
or, since
![]() K, by
K, by
The transition occurs at
For masses smaller than
After the transition, neutrino-density perturbations evolve in a similar way to
CDM on scales larger than a free-streaming length, and are damped
on smaller scales. The comoving free-streaming length is defined analogously
to a Jeans length, by replacing the sound of speed by
![]() ,
i.e.,
,
i.e.,
![]() .
It decreases from the time of transition onwards as,
.
It decreases from the time of transition onwards as,
which is valid at high redshift. The maximum occurs at the transition and is given by,
The density perturbations of the other components, in particular CDM, are affected by the presence of massive neutrinos as a consequence of the change in the background evolution, the change in the time of equality, and feedback from the neutrino perturbations. Roughly speaking, the effect of
Various combinations of cosmological data have been used to constrain
the neutrino mass.
Using CMB data alone, the WMAP 5-year analysis obtaied an upper 95% confidence
limit on the sum of the neutrinos masses of 1.3 eV, for a ![]() CDM
cosmology (Komatsu et al. 2009). By adding galaxy clustering data to CMB data and marginalizing
over the galactic bias, the upper limit decreases to around 0.7 eV-1.0 eV,
depending on the datasets used (e.g., Fogli et al. 2008; Tegmark et al. 2006).
If instead, distance indicators (supernovae and
baryon acoustic oscillations) were combined with CMB, stronger
constraints were obtained, e.g.,
CDM
cosmology (Komatsu et al. 2009). By adding galaxy clustering data to CMB data and marginalizing
over the galactic bias, the upper limit decreases to around 0.7 eV-1.0 eV,
depending on the datasets used (e.g., Fogli et al. 2008; Tegmark et al. 2006).
If instead, distance indicators (supernovae and
baryon acoustic oscillations) were combined with CMB, stronger
constraints were obtained, e.g.,
![]() eV (Komatsu et al. 2009).
When all of these probes were used together, the result improved to around
0.4 eV-0.5 eV (e.g., Goobar et al. 2006; Kristiansen et al. 2007). Similar results
were obtained using only CMB and galaxy clustering data but assuming that the
bias was known (McTavish et al. 2006), or measuring it independently
(Seljak et al. 2005). By applying the latter technique to WMAP 5-year data and new
galactic bias constraints, an improved value of
eV (Komatsu et al. 2009).
When all of these probes were used together, the result improved to around
0.4 eV-0.5 eV (e.g., Goobar et al. 2006; Kristiansen et al. 2007). Similar results
were obtained using only CMB and galaxy clustering data but assuming that the
bias was known (McTavish et al. 2006), or measuring it independently
(Seljak et al. 2005). By applying the latter technique to WMAP 5-year data and new
galactic bias constraints, an improved value of
![]() eV was obtained (De Bernardis et al. 2008).
Lyman-
eV was obtained (De Bernardis et al. 2008).
Lyman-![]() data was also added to different combinations of probes,
producing results of around 0.15 eV-0.3 eV, including the tighest constraint to
date of
data was also added to different combinations of probes,
producing results of around 0.15 eV-0.3 eV, including the tighest constraint to
date of
![]() eV (Seljak et al. 2006).
eV (Seljak et al. 2006).
In this paper we present the first constraints on neutrino masses
obtained with cosmic shear data.
The possibility of using the effect of weak gravitational lensing
of background galaxies by large-scale structures, or cosmic shear
(see Munshi et al. 2008, for a review), to constrain neutrino properties was
first studied in Cooray (1999). Since then, various forecasts have been made
and future cosmic shear surveys in combinations
with redshift information and CMB data from Planck are
expected to measure the sum of neutrino masses with an accuracy of
0.05 eV, using shear tomography (Hannestad et al. 2006) or the full
3D shear field (Kitching et al. 2008).
In the present work, we use the latest release of the
CFHTLS wide survey, CFHTLS-T0003,
where two-point angular correlations of the cosmic shear field were detected
on scales ranging from 1![]() to 4
to 4![]() (Fu et al. 2008).
The signal was measured on source galaxies with mean redshift
(Fu et al. 2008).
The signal was measured on source galaxies with mean redshift
![]() ,
implying it is produced mainly by the dark matter
distribution at
,
implying it is produced mainly by the dark matter
distribution at
![]() .
The measured range therefore probes
the non-linear matter power spectrum on comoving scales
of
0.08 < k < 10 h Mpc-1, reaching the quasi-linear regime
of largest scale corresponding to a physical size of approxiamtely 1 h-1 Gpc.
This largest scale probed is still one order of magnitude smaller than
the largest free-streaming scale,
.
The measured range therefore probes
the non-linear matter power spectrum on comoving scales
of
0.08 < k < 10 h Mpc-1, reaching the quasi-linear regime
of largest scale corresponding to a physical size of approxiamtely 1 h-1 Gpc.
This largest scale probed is still one order of magnitude smaller than
the largest free-streaming scale,
![]() ,
computed from Eq. (4). The data probes thus
both the scale-independent and the
scale-dependent suppression effects of the sub-free-streaming regime.
,
computed from Eq. (4). The data probes thus
both the scale-independent and the
scale-dependent suppression effects of the sub-free-streaming regime.
![\begin{figure}
\par\includegraphics[width=7cm,clip]{11077fg1a.ps}\hspace*{3mm}
\includegraphics[width=7cm,clip]{11077fg1b.ps}
\end{figure}](/articles/aa/full_html/2009/23/aa11077-08/img51.png) |
Figure 1:
Left: equation-of-state of fermionic massive
particles as function of redshift z for m=1.0 eV (solid line),
0.1 eV (dashed) and 0.01 eV (dotted). The transition redshift,
Eq. (2), is indicated in each case. The
dashed-dotted curve shows the lensing efficiency window (arbitrary
normalization). Right: aperture-mass variance
|
| Open with DEXTER | |
We proceed by presenting in Sect. 2 the methodology followed to compute the spectra. In the same section we introduce the statistical analysis performed and the datasets used. Cosmological constraints are obtained and discussed in Sect. 3 and our conclusions are presented in Sect. 4.
2 Methodology
2.1 Implementing massive neutrinos in cosmic-shear 2-point correlation functions
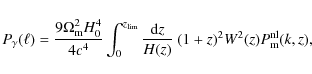
We perform a statistical analysis of a mixed dark-matter scenario by
considering a 8+1 dimensional parameter space (see Sect. 2.2). For each sampled model of this parameter space the
cosmic-shear power spectrum
![]() is computed by integrating the
non-linear total matter power spectrum
is computed by integrating the
non-linear total matter power spectrum
![]() along the
line-of-sight, up to the limiting redshift of the survey
along the
line-of-sight, up to the limiting redshift of the survey
![]() ,
to account for the distribution of source
galaxies n(z). It is given by
,
to account for the distribution of source
galaxies n(z). It is given by
where
![\begin{displaymath}W(z)= \int_z^{z_{\rm lim}}{\rm d}z' n(z')
\frac{S_K[\chi(z')-\chi(z)]}{S_K[ \chi(z')]}
\end{displaymath}](/articles/aa/full_html/2009/23/aa11077-08/img57.png) |
(6) |
defines the lensing efficiency window function, and
![\begin{displaymath}n(z)=N(z/z_{\rm s})^\alpha\exp\left[-(z/z_{\rm s})^\beta\right]
\end{displaymath}](/articles/aa/full_html/2009/23/aa11077-08/img60.png) |
(7) |
with best-fit parameters
The shear power spectrum is integrated over the
appropriate window function to obtain the mass variance in apertures
![]() (Schneider et al. 1998),
(Schneider et al. 1998),
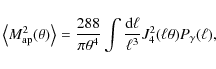 |
(8) |
where J4 is the 4th-order Bessel function of the first kind.
All quantities relying on the background evolution depend on the
equation-of-state of the various matter components.
The neutrino equation-of-state is defined as
![]() .
We compute the pressure P and the energy
density
.
We compute the pressure P and the energy
density ![]() at points of a grid
at points of a grid
![]() ,
using the fact that the
distribution of neutrinos in the phase space is a Fermi-Dirac distribution.
The result is well approximated by the fitting function
,
using the fact that the
distribution of neutrinos in the phase space is a Fermi-Dirac distribution.
The result is well approximated by the fitting function
![\begin{displaymath}
w_\nu(m_\nu,z)=\frac{1}{3}\left[1+\left(\frac{m_\nu}{(1+z)~0.058~{\rm eV} }\right)^{a}\right]^{-b},
\end{displaymath}](/articles/aa/full_html/2009/23/aa11077-08/img70.png)
where a=1.652 and b=0.561, and is shown in Fig. 1 (left panel). The transition to the non-relativistic regime occurs earlier for heavier particles, at the redshift given by Eq. (2) and indicated in the figure. The lensing efficiency window shows the redshift range probed by our data. At the upper end of this range,
The total matter power spectrum in Eq. (5) is
computed following Hannestad et al. (2006), which is also similar to the
description adopted for perturbed quintessence fields (Schimd et al. 2005).
By assuming that the neutrino overdensities remain always in the linear regime while
CDM and baryons grow non-linearly, the total matter power spectrum is given by
![\begin{displaymath}
P_{\rm m}^{\small {\rm nl}}(k,z)=\left[ f_\nu
\sqrt{P_\nu^{\...
...)\sqrt{P_{{\rm cdm}+{\rm b}}^{\small {\rm nl}}(k,z)}\right]^2,
\end{displaymath}](/articles/aa/full_html/2009/23/aa11077-08/img72.png)
where
The right panel of Fig. 1 shows the aperture
mass dispersion in the presence of massive and massless neutrinos,
computed from the total matter power spectrum, for the same
![]() .
The models are similar on large scales where the
neutrinos behave like cold dark matter and show a scale-dependent deviation
on intermediate scales. On small scales, which stay always inside the
free-streaming length, the suppression is constant. Linear perturbation theory
predicts the small-scale suppression to be,
.
The models are similar on large scales where the
neutrinos behave like cold dark matter and show a scale-dependent deviation
on intermediate scales. On small scales, which stay always inside the
free-streaming length, the suppression is constant. Linear perturbation theory
predicts the small-scale suppression to be,
![]() (Hu et al. 1998). For the non-linear power spectrum, the suppression is
higher, around
(Hu et al. 1998). For the non-linear power spectrum, the suppression is
higher, around ![]() ,
as predicted by both numerical simulations
(Brandbyge et al. 2008) and one-loop corrections (Wong 2008).
For the aperture mass dispersion, the models shown in
Fig. 1 have a small-scale suppression of
,
as predicted by both numerical simulations
(Brandbyge et al. 2008) and one-loop corrections (Wong 2008).
For the aperture mass dispersion, the models shown in
Fig. 1 have a small-scale suppression of
![]()
![]() .
.
2.2 Likelihood analysis
2.2.1 Cosmic shear alone
The statistical analysis evaluates a mixed dark matter scenario
with nine parameters, including the reduced Hubble parameter h,
the density of baryons
![]() ,
cold dark
matter,
,
cold dark
matter,
![]() ,
and massive neutrinos,
,
and massive neutrinos,
![]() ,
the effective number of relativistic
degrees of freedom
,
the effective number of relativistic
degrees of freedom
![]() ,
the optical depth to
reionization
,
the optical depth to
reionization ![]() ,
the primordial spectral index
,
the primordial spectral index ![]() ,
the rms of the
matter perturbations extrapolated to redshift z=0and filtered over the 8h-1 Mpc scale,
,
the rms of the
matter perturbations extrapolated to redshift z=0and filtered over the 8h-1 Mpc scale, ![]() ,
and the
mean redshift
,
and the
mean redshift ![]() of the source galaxies. The results
will be marginalized over a mean redshift range
of the source galaxies. The results
will be marginalized over a mean redshift range
![]() ,
corresponding to the
,
corresponding to the ![]() interval
of the redshift distribution found in Fu et al. (2008). The
neutrino physical density parameter relates to the total neutrino
mass as
interval
of the redshift distribution found in Fu et al. (2008). The
neutrino physical density parameter relates to the total neutrino
mass as
![]() eV, and we assume that the three neutrino
masses are degenerate.
eV, and we assume that the three neutrino
masses are degenerate.
In a very conservative approach, we shall work in a Friedmann-Lemaître-Robertson-Walker (FLRW) cosmology with cosmological constant as dark energy, with energy density fixed assuming spatial flatness. More generally, in this framework, dark energy is a fluid-like component that is dominant at low redshift and responsible for the recent accelerated expansion. A quintessence field, eventually allowing for non-minimal couplings (Tocchini-Valentini & Amendola 2002; Wetterich 1995; Uzan 1999), provides the most general alternative that might alleviate the coincidence problem (e.g., Copeland et al. 2006, for a review). Alternatively, it is possible to account for the global dynamics without advocating such an additional field, by considering back-reaction effects of structure formation (Wiltshire 2007; Ellis & Buchert 2005; Kolb et al. 2006), rejecting the Copernican principle (Uzan et al. 2008), or invoking theories of gravitation that differ from general relativity on large scales (see Uzan 2006, for a review). Our results do not exclude these possibilities, which require new, consistent analyses to be evaluated properly (see e.g., Schimd et al. 2007, for a weak-lensing analysis of quintessence).
The log-likelihood is defined as usual to be
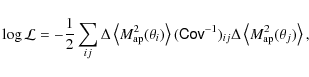
where
We sample the likelihood over a regular grid of the parameter space, for a
total of ![]() models.
The domain of the grid is:
models.
The domain of the grid is:
![]() ,
,
![]() ,
,
![]() ,
,
![]() ,
,
![]() ,
,
![]() ,
,
![]() ,
,
![]() .
.
In this work we use the aperture mass vector and covariance matrix obtained in
Fu et al. (2008), which was measured over 57 square degrees (35 square degrees of
effective area) in three connected patches of the sky, using
![]() galaxies with magnitudes
galaxies with magnitudes
![]() .
The covariance matrix includes shape noise in the shear
estimator, non-Gaussian cosmic variance, and the residual B-mode.
The shear-measurement pipeline was tested on STEP2
simulations (Massey et al. 2007) and shown to be slightly biased, underestimating
the shear on average by 2% (Fu et al. 2008). Moreover, this analysis showed that highly anisotropic point-spread-functions
(PSF) may introduce a spurious constant shear. The aperture mass statistic,
being computed with a compensated filter, is unaffect by a constant shear, which is the main reason for choosing this statistic for the present analysis.
In contrast, a constant shear affects top-hat two-point statistics. The impact of
redshift-dependent additive and multiplicative shear biases, which are present
in all KSB-based shear estimators, on cosmological
constraints is studied in Semboloni et al. (2008).
.
The covariance matrix includes shape noise in the shear
estimator, non-Gaussian cosmic variance, and the residual B-mode.
The shear-measurement pipeline was tested on STEP2
simulations (Massey et al. 2007) and shown to be slightly biased, underestimating
the shear on average by 2% (Fu et al. 2008). Moreover, this analysis showed that highly anisotropic point-spread-functions
(PSF) may introduce a spurious constant shear. The aperture mass statistic,
being computed with a compensated filter, is unaffect by a constant shear, which is the main reason for choosing this statistic for the present analysis.
In contrast, a constant shear affects top-hat two-point statistics. The impact of
redshift-dependent additive and multiplicative shear biases, which are present
in all KSB-based shear estimators, on cosmological
constraints is studied in Semboloni et al. (2008).
2.2.2 Joint analysis
In the joint analysis, we adopt the importance
sampling technique (Lewis & Bridle 2002; Hastings 1970),
adding CFHTLS-T0003 cosmic shear data to two Monte
Carlo Markov chains available in the L AMBDA
archive![]() for the mixed dark-matter scenario.
One of the chains was computed for CMB temperature and polarization
anisotropies derived from WMAP-5yr (Dunkley et al. 2009) data.
The other chain used a combination of these data with
baryon acoustic oscillations from SDSS and 2dFGRS
(Percival et al. 2007), and type Ia supernovae from the ``Gold'' sample
(Riess et al. 2004) and SNLS (Astier et al. 2006).
for the mixed dark-matter scenario.
One of the chains was computed for CMB temperature and polarization
anisotropies derived from WMAP-5yr (Dunkley et al. 2009) data.
The other chain used a combination of these data with
baryon acoustic oscillations from SDSS and 2dFGRS
(Percival et al. 2007), and type Ia supernovae from the ``Gold'' sample
(Riess et al. 2004) and SNLS (Astier et al. 2006).
Importance sampling consists of estimating a target distribution (a joint posterior distribution in our case) by sampling an auxiliary distribution. We assume that the public Monte Carlo Markov chains provided by the WMAP team have enough resolution at the region of parameter space intersecting the cosmic shear posterior distribution. This is a reasonable assumption since they are the dominant contribution to the joint constraints. They are thus useful auxiliary distributions and are biased distributions of the target distributions. To obtain the two unbiased joint distributions (WMAP+CFHTLS and WMAP+BAO+SNe+CFHTLS), we scale the chains by multiplying the weight of each chain element by its likelihood with respect to the cosmic shear data.
This method allows us to accelerate the computation
compared to sampling directly the joint posterior with a grid or a
Markov chain, since it requires only the computation of the cosmic shear
likelihood for each model of the chains.
Each model of the chains has a constant
![]() ,
hence in the joint
analysis, we consider only 7+1 physically independent parameters, i.e., the
remaining 7 cosmological parameters used in the cosmic shear analysis and the
lensing sources redshift.
,
hence in the joint
analysis, we consider only 7+1 physically independent parameters, i.e., the
remaining 7 cosmological parameters used in the cosmic shear analysis and the
lensing sources redshift.
3 Results
3.1 CFHTLS-T0003 alone
We now discuss the analysis of cosmic-shear data alone. Figure 2 shows the marginalized confidence contours in the
![]() plane. The degeneracy direction in the case of massless neutrinos is fitted by
plane. The degeneracy direction in the case of massless neutrinos is fitted by
 |
(12) |
This value was found by marginalizing over h but for fixed
In the presence of massive neutrinos, the contours are shifted towards the right.
This follows from the
![]() degeneracy, and shows that an increase in
degeneracy, and shows that an increase in
![]() is compensated by an increase in
is compensated by an increase in
![]() ,
confirming that the data are in
the sub-free-streaming-length regime, where the effect of the neutrinos
opposes that of the cold dark matter. The contours also broaden, since many
more preferred models exist now. For example, on angular scales of
between 10
,
confirming that the data are in
the sub-free-streaming-length regime, where the effect of the neutrinos
opposes that of the cold dark matter. The contours also broaden, since many
more preferred models exist now. For example, on angular scales of
between 10![]() and 100
and 100![]() ,
,
![]() of the best-fit models of the full
grid and the massless neutrino sub-grid, differ by less than 5%.
As the contours broaden, their shape remains unchanged, implying that the CDM
effect on the cosmic shear signal is more significant than that of the neutrinos. The degeneracy
direction in the case of massive neutrinos is now fitted by
of the best-fit models of the full
grid and the massless neutrino sub-grid, differ by less than 5%.
As the contours broaden, their shape remains unchanged, implying that the CDM
effect on the cosmic shear signal is more significant than that of the neutrinos. The degeneracy
direction in the case of massive neutrinos is now fitted by
 |
(13) |
where we chose a higher pivot
![\begin{figure}
\par\includegraphics[width=7cm,clip]{11077fg2.ps}
\end{figure}](/articles/aa/full_html/2009/23/aa11077-08/img120.png) |
Figure 2:
Confidence contours (68% and 95%) from the aperture-mass dispersion between 1 |
| Open with DEXTER | |
![\begin{figure}
\par\includegraphics[width=6cm,clip]{11077fg3a.ps}\includegraphic...
...m,clip]{11077fg3b.ps}\includegraphics[width=6cm,clip]{11077fg3c.ps}
\end{figure}](/articles/aa/full_html/2009/23/aa11077-08/img121.png) |
Figure 3:
Left: best-fit models found for massive (
|
| Open with DEXTER | |
Figure 3 (left panel) shows the massless and massive neutrino best-fit models, (![]() eV,
eV,
![]() )
and (
)
and (
![]() eV,
eV,
![]() ), respectively. They have the same values of
), respectively. They have the same values of ![]() and h and differ in
and h and differ in ![]() .
The difference between the two models, shown in the inset normalized by the massless neutrino model, increases on larger scales with the approach to the
free-streaming-length.
This indicates that combining cosmic shear measurements at sub-
and super-free-streaming-scales, might break the
.
The difference between the two models, shown in the inset normalized by the massless neutrino model, increases on larger scales with the approach to the
free-streaming-length.
This indicates that combining cosmic shear measurements at sub-
and super-free-streaming-scales, might break the
![]() degeneracy. Shown explicitly in
Fig. 3 (middle panel), this degeneracy, as well as the
similarly-oriented
degeneracy. Shown explicitly in
Fig. 3 (middle panel), this degeneracy, as well as the
similarly-oriented
![]() correlation (not shown), confirm
that an increasing neutrino density decreases the cosmic shear
signal. However, the tilting effect of the neutrino density on the
matter power spectrum around the free-streaming scale may mimic
the dependence on
correlation (not shown), confirm
that an increasing neutrino density decreases the cosmic shear
signal. However, the tilting effect of the neutrino density on the
matter power spectrum around the free-streaming scale may mimic
the dependence on ![]() ,
especially if the pivot scale k used is
similar to the free-streaming scale
,
especially if the pivot scale k used is
similar to the free-streaming scale
![]() Mpc-1. Therefore, the combination of sub- and super-free-streaming data
may not have enough information to additionally break the
Mpc-1. Therefore, the combination of sub- and super-free-streaming data
may not have enough information to additionally break the
![]() degeneracy. This
degeneracy is shown in the right panel of Fig. 3.
degeneracy. This
degeneracy is shown in the right panel of Fig. 3.
To explore the benefit of a broader range of scales, we construct a fiducial
model consisting of an extension of our best-fit
massless neutrino model to
![]() (also shown in
Fig. 3, left panel), where the flat-sky approximation
remains valid. We computed a new covariance matrix using the Schneider et al. (2002) approximation with the Semboloni et al. (2007) non-Gaussian correction
and WMAP-5yr mean parameter values (Dunkley et al. 2009). We assumed the
same sky coverage and galaxy density as in CFHTLS-T0003. In this way we can
evaluate the benefit of using large scales independent of a gain due to
better statistics. We obtain constraints similar to the ones obtained for
the data up to 230
(also shown in
Fig. 3, left panel), where the flat-sky approximation
remains valid. We computed a new covariance matrix using the Schneider et al. (2002) approximation with the Semboloni et al. (2007) non-Gaussian correction
and WMAP-5yr mean parameter values (Dunkley et al. 2009). We assumed the
same sky coverage and galaxy density as in CFHTLS-T0003. In this way we can
evaluate the benefit of using large scales independent of a gain due to
better statistics. We obtain constraints similar to the ones obtained for
the data up to 230![]() ,
the extension to
,
the extension to
![]() only adding a
small number of
independent points. Since the cosmic shear signal on large
scales becomes very small, better statistics are needed in attempting
to break the
only adding a
small number of
independent points. Since the cosmic shear signal on large
scales becomes very small, better statistics are needed in attempting
to break the
![]() degeneracy with cosmic shear data alone.
degeneracy with cosmic shear data alone.
Using either CFHTLS-T0003 data or its extension to
![]() ,
the marginalized upper bound on the
neutrino mass is,
,
the marginalized upper bound on the
neutrino mass is,
This constraint, while very loose when compared with the combined constraints mentioned in Sect. 2, is comparable to the ones obtained from SDSS or 2dF galaxy redshift surveys alone (see e.g., Kristiansen et al. 2007, who find
We note that the 95% C.L. contours in Fig. 2 do not close
inside the range of the parameters probed. This implies that our grid limits
are an effectively strong prior, in particular implying
![]() and
and
![]() .
In other words, the constraint in Eq. (14)
includes a marginalisation over an arbitrary and relatively narrow range of
parameters values, and is thus optimistic.
Furthermore, the derived constraint does not take account of
degeneracies with dark energy.
In more general scenarios with non-vanishing curvature or with
non-cosmological-constant dark energy, both
growth of structure and distances, as functions of redshift, depend on both
the dark-energy density parameter
.
In other words, the constraint in Eq. (14)
includes a marginalisation over an arbitrary and relatively narrow range of
parameters values, and is thus optimistic.
Furthermore, the derived constraint does not take account of
degeneracies with dark energy.
In more general scenarios with non-vanishing curvature or with
non-cosmological-constant dark energy, both
growth of structure and distances, as functions of redshift, depend on both
the dark-energy density parameter
![]() and the equation-of-state
and the equation-of-state
![]() .
To effectively break the
.
To effectively break the
![]() degeneracy, it will thus be necessary to
use a measure that is not degenerate in
degeneracy, it will thus be necessary to
use a measure that is not degenerate in
![]() and
and
![]() .
One possibility is to exploit the lens efficiency at
different redshift bins with tomography (e.g., Abazajian & Dodelson 2003).
However, even with tomography, some direct neutrino-dark energy degeneracy
will remain due to the
transition epoch from matter to dark-energy domination
(Kiakotou et al. 2008).
.
One possibility is to exploit the lens efficiency at
different redshift bins with tomography (e.g., Abazajian & Dodelson 2003).
However, even with tomography, some direct neutrino-dark energy degeneracy
will remain due to the
transition epoch from matter to dark-energy domination
(Kiakotou et al. 2008).
Regarding the effective number of relativistic species, cosmic shear is
sensitive to it via the change in the matter-radiation equality. A
higher
![]() implies a longer radiation-dominated era, and thus a more efficient
suppression of growth. Hence, the relative amplitude of small and large scales
changes and the shear power spectrum tilts. The effect is however weak and
we find an essentially flat likelihood in the probed range of
implies a longer radiation-dominated era, and thus a more efficient
suppression of growth. Hence, the relative amplitude of small and large scales
changes and the shear power spectrum tilts. The effect is however weak and
we find an essentially flat likelihood in the probed range of
![]() ,
meaning that the data do not constrain this parameter.
,
meaning that the data do not constrain this parameter.
![\begin{figure}
\par\includegraphics[width=6cm,clip]{11077fg4a.ps}\includegraphic...
...m,clip]{11077fg4b.ps}\includegraphics[width=6cm,clip]{11077fg4c.ps}
\end{figure}](/articles/aa/full_html/2009/23/aa11077-08/img131.png) |
Figure 4:
Joint analysis.
Left and middle: contours at 95% C.L. of
|
| Open with DEXTER | |
3.2 Joint analysis
We now explore the parameter space by adding CFHTLS-T0003 cosmic shear data to each of the Monte Carlo Markov chains defined in Sect. 2.2.2, aiming to determine the gain achieved by including lensing data.
The main independent piece of information provided by cosmic shear is the
power spectrum on small scales. As discussed above, it has a
distinctive scaling with both neutrino and CDM densities, while
these two parameters for CMB are instead weakly correlated, as seen in
Fig. 4 (left panel, largest contour). This allows us
to obtain a narrow, joint constraint, approximatively in the same
direction found for cosmic shear alone in Fig. 3 (middle
panel).
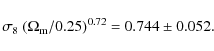
The direction orthogonal to the contour indicates the combination of parameters to which
cosmic shear is mostly sensitive to. It is well approximated by the linear relation
![]() and the WMAP5 + CFHTLS constraint on this combination of
parameters is,
and the WMAP5 + CFHTLS constraint on this combination of
parameters is,
| (15) |
The figure-of-merit (FoM) quantifies the error ellipses of correlated parameters and was introduced for the parameters of the dark energy equation of state (Albrecht et al. 2006). It is defined as the inverse area of the ellipse approximating the
 |
(16) |
where
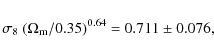
The introduction of distance measurements (BAO+SNe) is useful, since
its combination with WMAP5 data (also shown
in Fig. 4, left panel) defines a narrow region in the
![]() plane that complements that of the
WMAP5+CFHTLS data.
Both cases thus probe orthogonal combinations of the two parameters and,
furthermore, in a
way that is independent of the spectral index, since this is already well
determined by the CMB data alone (as shown in Fig. 4, middle panel).
Their combination thus has the same properties we were looking for when discussing the possibility of
using sub- and super-free-streaming scales from cosmic shear alone, along
with the need for an independent measure of
plane that complements that of the
WMAP5+CFHTLS data.
Both cases thus probe orthogonal combinations of the two parameters and,
furthermore, in a
way that is independent of the spectral index, since this is already well
determined by the CMB data alone (as shown in Fig. 4, middle panel).
Their combination thus has the same properties we were looking for when discussing the possibility of
using sub- and super-free-streaming scales from cosmic shear alone, along
with the need for an independent measure of ![]() .
This means that the
combination of the two cases (WMAP5 + BAO + SNe + CFHTLS) breaks the remaining
degeneracy, as is clear from Fig. 4 (left panel, smaller contour) and from
the fact that the combined contour has very small correlation (
.
This means that the
combination of the two cases (WMAP5 + BAO + SNe + CFHTLS) breaks the remaining
degeneracy, as is clear from Fig. 4 (left panel, smaller contour) and from
the fact that the combined contour has very small correlation (
![]() ,
for un-normalised parameters
,
for un-normalised parameters ![]() and
and
![]() ).
).
Figure 4 (right panel) shows the one-dimensional marginalized
probability distributions of the neutrino masses in the four cases.
The upper 95% confidence levels are
![]() eV (WMAP5),
eV (WMAP5),
![]() eV (WMAP5 + CFHTLS) and
eV (WMAP5 + CFHTLS) and
![]() eV
(WMAP5 + BAO + SNe).
For the full combination (WMAP5 + BAO + SNe + CFHTLS), we find that
eV
(WMAP5 + BAO + SNe).
For the full combination (WMAP5 + BAO + SNe + CFHTLS), we find that
 |
(17) |
with mean 0.31 eV. Interestingly, we obtain a lower bound, and thus a preference for massive neutrinos at the
It is worth to point out that the lower bound on
![]() is
strongly dependent on the position of the WMAP5 + CFHTLS contour in the
is
strongly dependent on the position of the WMAP5 + CFHTLS contour in the
![]() plane (see Fig. 4, left panel).
Any systematic effect that underestimates
the cosmic-shear signal would shift the
plane (see Fig. 4, left panel).
Any systematic effect that underestimates
the cosmic-shear signal would shift the
![]() contour
towards the bottom-left corner of Fig. 2 with a consequent shift
in the
contour
towards the bottom-left corner of Fig. 2 with a consequent shift
in the
![]() contour towards the bottom-right corner of
Fig. 4 (left panel).
The WMAP5 + BAO + SNe + CFHTLS contour would thus descend along the
WMAP5 + BAO + SNe
one producing a positive lower bound for the neutrino mass. A similar effect
appeared in Allen et al. (2003), which also showed
a preference for a non-zero neutrino mass from a combination of CMB, galaxy
clustering and X-ray cluster data; that result was in fact caused by an underestimation
of
contour towards the bottom-right corner of
Fig. 4 (left panel).
The WMAP5 + BAO + SNe + CFHTLS contour would thus descend along the
WMAP5 + BAO + SNe
one producing a positive lower bound for the neutrino mass. A similar effect
appeared in Allen et al. (2003), which also showed
a preference for a non-zero neutrino mass from a combination of CMB, galaxy
clustering and X-ray cluster data; that result was in fact caused by an underestimation
of ![]() ,
as pointed out by Seljak et al. (2005).
Similarly, the joint constraint depends crucially on BAO data. Komatsu
et al. (2009) pointed out a tension between SNe and BAO results when the joint
SDSS + 2dFGRS BAO sample is used. If BAO data overestimates the total matter
density, then an unbiased WMAP5 + BAO + SNe contour in the
,
as pointed out by Seljak et al. (2005).
Similarly, the joint constraint depends crucially on BAO data. Komatsu
et al. (2009) pointed out a tension between SNe and BAO results when the joint
SDSS + 2dFGRS BAO sample is used. If BAO data overestimates the total matter
density, then an unbiased WMAP5 + BAO + SNe contour in the
![]() plane (Fig. 4, left panel) will be
shifted towards the bottom-left corner, weakening the preference for massive neutrinos.
plane (Fig. 4, left panel) will be
shifted towards the bottom-left corner, weakening the preference for massive neutrinos.
3.3 Robustness of the constraints
We check here the robustness of our results against systematics of the cosmic
shear data, that have not been included in the analysis so
far. For this purpose, we first assume the data vector is biased as a
consequence of an underestimation in the shear, as indicated by the STEP simulations.
We assume a 2% redshift-independent bias in the shape measurements, which
translates into a scale-independent 4% error in the data vector, and repeat the joint analysis.
The resulting combined contour shifts upwards along the WMAP5+BAO+SNe
degeneracy in agreement with the discussion in Sect. 3.2.
As seen in Fig. 5 (left panel, solid lines), this
small bias is enough for the evidence of massless neutrinos to be lost and we
obtain at the 95% C.L.:
 |
(18) |
Other sources of errors that can affect cosmic-shear cosmological constraints are: contamination from intrinsic alignments, in particular shear-shape correlations (Hirata & Seljak 2004) for no precise theoretical modeling yet exists; uncertainties in the photometric redshifts; and extra PSF residuals not predicted by the STEP simulations. Modelling of some of the CFHTLS-T0003 systematics is included in the analysis of Kilbinger et al. (2009). Here we consider the rougher approach of marginalizing over a scale-independent calibration factor, accounting for all possible sources of biases, with the goal of finding a threshold of contamination above which the CFHTLS data do not improve the combined constraints.
| |
Figure 5:
Tests of the robustness of the result. Marginalized joint constraints
(68% and 95% C.L.) obtained using the actual data
(filled contours) and various assumptions (open contours).
Left: impact of systematics, assuming a 4% underestimation (solid) or
marginalizing over a |
| Open with DEXTER | |
We find a threshold of 25% for the aperture mass dispersion data. The
corresponding combined contour in the
![]() plane
is shown in Fig. 5 (left panel, dashed lines).
The contour is now elongated and similar to the WMAP+BAO+SNe one of
Fig. 4 (left panel).
If the data contains systematics of amplitude smaller than 25% of the signal,
we can quote conservative combined constraints
by marginalizing over the amplitude of the systematics. The final 95% C.L. for the
joint analysis will be
intermediate between the most optimistic case (no bias) of 0.03 eV
plane
is shown in Fig. 5 (left panel, dashed lines).
The contour is now elongated and similar to the WMAP+BAO+SNe one of
Fig. 4 (left panel).
If the data contains systematics of amplitude smaller than 25% of the signal,
we can quote conservative combined constraints
by marginalizing over the amplitude of the systematics. The final 95% C.L. for the
joint analysis will be
intermediate between the most optimistic case (no bias) of 0.03 eV
![]() eV
and the worst case (no contribution from lensing) of
eV
and the worst case (no contribution from lensing) of
![]() eV. For example, in the
case of systematics of 10%, the conservative constraints are
eV. For example, in the
case of systematics of 10%, the conservative constraints are
![]() eV.
These marginalized constraints, not including systematics
with a scale- or a redshift-dependence, are approximative since massive
neutrinos affect both the amplitude and the shape of the cosmic shear correlations.
Only on smaller scales (
eV.
These marginalized constraints, not including systematics
with a scale- or a redshift-dependence, are approximative since massive
neutrinos affect both the amplitude and the shape of the cosmic shear correlations.
Only on smaller scales (
![]() ,
see
e.g. Fig. 1 right panel) is the suppression
scale-independent.
,
see
e.g. Fig. 1 right panel) is the suppression
scale-independent.
We can also assess the robustness of the result by comparing it with a forecast.
For this, we compute a systematics-free
cosmic-shear covariance matrix for our survey size using
the results of Schneider et al. (2002) and Semboloni et al. (2007).
This covariance matrix differs from the one we have used so far,
which was computed by taking into account the true galaxy positions and weights.
The results do not change when we replace the covariance matrices,
as shown in Fig. 5 (middle and right panels, solid lines).
To ensure that the forecast is completely
independent of the data, we redo it by further replacing the data vector by a
fiducial model (the WMAP5 mean, Dunkley et al. 2009). This time we obtain
a shift in the contour location (Fig. 5, middle and right
panels, dashed lines). Again the evidence for massless neutrinos is lost,
this time due to the higher
![]() value of the WMAP5
fiducial model. This behaviour mimicks a correction for
an eventual overestimation of the source redshifts. Indeed, if the effective
redshift is lower, the models will have a higher value of
value of the WMAP5
fiducial model. This behaviour mimicks a correction for
an eventual overestimation of the source redshifts. Indeed, if the effective
redshift is lower, the models will have a higher value of
![]() for the same amplitude
for the same amplitude
![]() ,
shifting the combined
,
shifting the combined
![]() contour up.
It likewise mimicks a correction for an underestimation of the shear measurements.
The combined constraint on the neutrino mass, when using the WMAP5 fiducial model,
strengthens to
contour up.
It likewise mimicks a correction for an underestimation of the shear measurements.
The combined constraint on the neutrino mass, when using the WMAP5 fiducial model,
strengthens to
![]() eV. We note this is also the result that
would be obtained if the data were corrected for a negative calibration bias
of 20%.
eV. We note this is also the result that
would be obtained if the data were corrected for a negative calibration bias
of 20%.
In summary, the possible systematics do not change the angle between the
![]() degeneracy in the WMAP5 + CFHTLS and
WMAP5 + BAO + SNe cases, only shift or broaden the combined contour position and size.
Eventual corrections for an underestimation of the data vector or for an
overestimation of the source redshifts would produce both a tighter upper
bound and a looser lower bound on the neutrino mass.
degeneracy in the WMAP5 + CFHTLS and
WMAP5 + BAO + SNe cases, only shift or broaden the combined contour position and size.
Eventual corrections for an underestimation of the data vector or for an
overestimation of the source redshifts would produce both a tighter upper
bound and a looser lower bound on the neutrino mass.
The matter power spectrum also contributes as a source
of uncertainties. The prescription used, Eq. (10), does not
consider clustering of neutrinos on CDM structures, which occurs
when the neutrino thermal velocity drops below the velocity dispersion, v,
of forming clusters; for instance, it takes place at ![]() for
for
![]() km s-1 and
km s-1 and
![]() eV.
The corresponding neutrino halo profile is flatter in the centre than a pure
CDM Navarro-Frenk-White (Ringwald & Wong 2004).
Including it in the 1-halo term of the halo model, Abazajian et al. (2005)
showed that it decreases the non-linear matter power spectrum. Accordingly, in this
work the term
eV.
The corresponding neutrino halo profile is flatter in the centre than a pure
CDM Navarro-Frenk-White (Ringwald & Wong 2004).
Including it in the 1-halo term of the halo model, Abazajian et al. (2005)
showed that it decreases the non-linear matter power spectrum. Accordingly, in this
work the term
![]() is expected to be overestimated by
is expected to be overestimated by ![]() on scales around
k=0.5 h Mpc-1 for
on scales around
k=0.5 h Mpc-1 for
![]() eV.
Alternatively, results from perturbation theory with neutrinos (Wong 2008) also indicate
an overestimation of the matter power spectrum, as already mentioned in
Sect. 2.1.
eV.
Alternatively, results from perturbation theory with neutrinos (Wong 2008) also indicate
an overestimation of the matter power spectrum, as already mentioned in
Sect. 2.1.
The non-linear power spectrum is computed with the HALOFIT, which declares
a 3%
uncertainty on scales k<10 h/Mpc at z<3 (Smith et al. 2003), which are thus of the
same order as the supposed shear measurement bias.
This uncertainty is effectively both redshift- and scale-independent over the data redshift and scale ranges.
Marginalizing over a 5% uncertainty, the corresponding joint constraint is
![]() eV.
Furthermore, the HALOFIT does not take account of the effects of
cooling baryons and hot intra-cluster baryons, which are degenerate with the
neutrinos, affecting the power spectrum by a few percent
on small scales (Jing et al. 2006; Zhan & Knox 2004; White 2005).
eV.
Furthermore, the HALOFIT does not take account of the effects of
cooling baryons and hot intra-cluster baryons, which are degenerate with the
neutrinos, affecting the power spectrum by a few percent
on small scales (Jing et al. 2006; Zhan & Knox 2004; White 2005).
4 Conclusions
We have investigated the potential of cosmic shear to constrain the mass of
neutrinos. In the sub-free-streaming regime, the constraining power
originates, for a fixed density of baryons, in the tendency of relativistic
(hot) dark matter particles to escape from collapsed regions. Therefore
additional amounts of CDM are needed to produce the same cosmic-shear distortion, shifting
the
![]() degeneracy towards larger values of
degeneracy towards larger values of
![]() with
respect to the analysis without massive neutrinos
(Fig. 2), producing a
with
respect to the analysis without massive neutrinos
(Fig. 2), producing a
![]() degeneracy favoring higher amounts of CDM for higher amounts of
massive neutrinos (Fig. 3). The analysis of
CFHTLS-T0003 data alone yields a loose constraint of
degeneracy favoring higher amounts of CDM for higher amounts of
massive neutrinos (Fig. 3). The analysis of
CFHTLS-T0003 data alone yields a loose constraint of
![]() eV at the 95% C.L., for our particular choice of priors.
eV at the 95% C.L., for our particular choice of priors.
We have explored larger angular scales using a synthetic data vector extended
to
![]() to explore the possibility of breaking the
to explore the possibility of breaking the
![]() degeneracy using only cosmic shear.
This analysis did not predict an improvement in
the results, which would require higher signal-to-noise ratio at
large scales.
degeneracy using only cosmic shear.
This analysis did not predict an improvement in
the results, which would require higher signal-to-noise ratio at
large scales.
The introduction of CFHTLS-T0003 data in a WMAP5+BAO+SNe analysis provides
an interesting combination, breaking the
![]() degeneracy present in that analysis
(Fig. 4 , left panel). The joint analysis
yields 0.03 eV
degeneracy present in that analysis
(Fig. 4 , left panel). The joint analysis
yields 0.03 eV
![]() eV at the 95%
confidence level, marginally excluding massless neutrinos
(Fig. 4, right panel). The preference for massive neutrinos is
lost when the data is corrected for a possible underestimation of the shear
signal, which simulations indicate may be around 4%. In this case, the result
shifts to
eV at the 95%
confidence level, marginally excluding massless neutrinos
(Fig. 4, right panel). The preference for massive neutrinos is
lost when the data is corrected for a possible underestimation of the shear
signal, which simulations indicate may be around 4%. In this case, the result
shifts to
![]() eV. The CFHTLS data also shows some disagreement
with the result of WMAP5. Indeed, if a cosmic-shear fiducial WMAP5 model was used,
the expected combined WMAP5+BAO+SNe+CFHTLS constraint would be tighter:
eV. The CFHTLS data also shows some disagreement
with the result of WMAP5. Indeed, if a cosmic-shear fiducial WMAP5 model was used,
the expected combined WMAP5+BAO+SNe+CFHTLS constraint would be tighter:
![]() eV.
Finally, we showed that CFHTLS-T0003 data do not improve the WMAP5+BAO+SNe constraints on
the neutrino mass if they contain a bias larger than 25%.
eV.
Finally, we showed that CFHTLS-T0003 data do not improve the WMAP5+BAO+SNe constraints on
the neutrino mass if they contain a bias larger than 25%.
After submission of the manuscript, a similar study was submitted by Ichiki et al. (2009), also using CFHTLS-T0003 cosmic shear data to constrain the neutrino mass. Both analyses take a similar approach, the main differences being: they use the cosmic shear correlation function, which is more affected by systematics, as opposed to the aperture-mass dispersion; the non-Gaussian shear covariance matrix is also computed in different ways, as is the likelihood analysis. Their neutrino mass constraints from cosmic shear only are weaker, which is consistent with the fact they impose weaker priors, and the results for a WMAP5+BAO+SNe+CFHTLS joint analysis are very similar.
Besides the neutrino mass, we also considered the effective number of relativistic degrees of freedom,
![]() .
CMB anisotropies are by far more sensitive than cosmic shear and CFHTLS-T0003
data produced an almost flat likelihood with respect to this parameter. This
prevented us from using the
.
CMB anisotropies are by far more sensitive than cosmic shear and CFHTLS-T0003
data produced an almost flat likelihood with respect to this parameter. This
prevented us from using the
![]() degeneracy, caused by a higher
degeneracy, caused by a higher
![]() delaying the matter-radiation equivalence and the corresponding
defreezing of matter perturbations, which have less time to grow.
delaying the matter-radiation equivalence and the corresponding
defreezing of matter perturbations, which have less time to grow.
In summary, the CFHTLS cosmic-shear has already sufficient statistical precision for the accuracy of the results to be affected by systematics. The CFHTLS lensing systematics collaboration is currently undertaking a very detailed and lengthy analysis of those systematics. The statistical precision is however still insufficient to allow us to improve current constraints on the neutrino mass. Future ground-based and space-borne observations (such as KIDS, Pan-STARRS, DES, LSST, SNAP-L, JDEM, or EUCLID surveys; see Peacock et al. 2006), with better statistics, larger scales, and also the use of tomographic techniques, will allow to perform more elaborate analyses, for instance enabling to relax the assumption of degeneracy between mass eigenstates.
From the theoretical point-of-view, a more suitable computation of the
matter power spectrum in the non-linear regime will be mandatory, to take
more careful account of the effects of massive neutrinos without
relying on mappings based on ![]() CDM N-body simulations. This might be
achievable using either standard perturbation theory (e.g., Saito et al. 2008) or a
resummation scheme (see e.g., Pietroni 2008; Crocce & Scoccimarro 2006).
It will be
interesting, eventually, to investigate the degeneracy with the low-redshift
physics (
CDM N-body simulations. This might be
achievable using either standard perturbation theory (e.g., Saito et al. 2008) or a
resummation scheme (see e.g., Pietroni 2008; Crocce & Scoccimarro 2006).
It will be
interesting, eventually, to investigate the degeneracy with the low-redshift
physics (![]() ), such as reionization and dark energy, relevant if
), such as reionization and dark energy, relevant if
![]() eV.
On this mass scale, the normal/inverted hierarchy of mass states can also be
distinguished.
More elaborate models allowing for an interaction between massive neutrinos
and a quintessence field (Brookfield et al. 2006), or in which
mass-varying neutrinos behave as a negative pressure fluid, which could then
be the origin of the cosmic acceleration (Fardon et al. 2004), may then also be considered.
eV.
On this mass scale, the normal/inverted hierarchy of mass states can also be
distinguished.
More elaborate models allowing for an interaction between massive neutrinos
and a quintessence field (Brookfield et al. 2006), or in which
mass-varying neutrinos behave as a negative pressure fluid, which could then
be the origin of the cosmic acceleration (Fardon et al. 2004), may then also be considered.
Acknowledgements
We are thankful to Yannick Mellier for supporting this project and to Elisabetta Semboloni for many discussions. We thank Karim Benabed for help with computation in the early stage of this work and the Terapix group for computational facilities. We acknowledge the CFHTLS lensing systematics collaboration for helpful discussions. We are grateful to Peter Schneider and Jens Roediger for careful readings of the manuscript. We acknowledge use of CAMB and of the LAMBDA archive. IT and LF are supported by the European Commission Programme 6-th framework, Marie Curie Training and Research Network ``DUEL'', contract number MRTN-CT-2006-036133. M.K. is funded by the CNRS/ANR research grant ``ECOSSTAT'', contract number ANR-05-BLAN-0283-04. CS thanks IAP for hospitality.
References
- Abazajian, K., & Dodelson, S. 2003, , 91, 041301 (In the text)
- Abazajian, K., Switzer, E. R., Dodelson, S., Heitmann, K., & Habib, S. 2005, Phys. Rev. D71, 043507
- Albrecht, A., Bernstein, G., Cahn, R., et al. 2006[arXiv:astro-ph/0609591] (In the text)
- Allen, S. W., Schmidt, R. W., & Bridle, S. L. 2003, MNRAS, 346, 593 [NASA ADS] [CrossRef]
- Astier, P., Guy, J., Regnault, N., et al. 2006, A&A, 447, 31 [NASA ADS] [CrossRef] [EDP Sciences] (In the text)
- Bondi, F. 1960, Cosmology (Cambridge University Press)
- Brandbyge, J., Hannestad, S., Haugboelle, T., & Thomsen, B. 2008, JCAP, 08, 020B [NASA ADS] (In the text)
- Brookfield, A. W., van de Bruck, C. Mota, D. F., & Tocchini-Valentini, D. 2006, , 96, 061301 (In the text)
- Calibbi, L., Faccia, A., Masiero, A., & Vempati, S. K. 2006, Phys. Rev. D, 74, 116002 [NASA ADS] [CrossRef] (In the text)
- Cooray, A. 1999, A&A, 348, 31 [NASA ADS]
- Copeland, E. J., Sami, M., & Tsujikawa, S. 2006, Int. J. Mod. Phys. D, 15, 1753 [NASA ADS] [CrossRef] (In the text)
- Cuoco, A., Iocco, F., Mangano, G., et al. 2004, Int. J. Mod. Phys. A, 19, 4431 [NASA ADS] [CrossRef] (In the text)
- Crocce, M., & Scoccimarro, R. 2006, Phys. Rev. D, 73, 6
- De Bernardis, F., Serra, P., Cooray, A., & Melchiorri, A. 2008, Phys. Rev. D, 78, 083535 [NASA ADS] [CrossRef] (In the text)
- Dunkley, J., Komatsu, E., Nolta, M. R., et al. 2009, ApJS, 180, 306 [NASA ADS] [CrossRef] (In the text)
- Eisenstein, D. J., & Hu, W. 1998, ApJ, 496, 605 [NASA ADS] [CrossRef] (In the text)
- Ellis, G. F. R. 1971, Q. Jl. Astron. Soc., 16, 245 [NASA ADS]
- Ellis, G. F. R., & Buchert, T. 2005, Phys. Lett. A, 347, 38 [NASA ADS] [CrossRef]
- Fardon, R., Nelson, A. E., & Weiner, N. 2004, J. Cosmology Astropart. Phys., 10, 205 (In the text)
- Fogli, G. L., Lisi, E., Marrone, A., et al. 2008, Phys. Rev. D, 78, 033010 [NASA ADS] [CrossRef]
- Fu, L., Semboloni, E., Hoekstra, H., et al. 2008, A&A, 479, 9 [NASA ADS] [CrossRef] [EDP Sciences] (In the text)
- Gonzalez-Garcia, M. C., & Maltoni, M. 2008, Phys. Rep., 460, 1 [NASA ADS] [CrossRef] (In the text)
- Goobar, A., Hannestad, S., Moertsell, E., & Tu, H. 2006, J. Cosmology Astropart. Phys., 06, 019 [NASA ADS] [CrossRef]
- Hannestad, S., Tu, H., & Wong, Y. 2006, J. Cosmology Astropart. Phys., 06, 025 [NASA ADS] [CrossRef] (In the text)
- Hastings, W. K. 1970, Biometrika, 57, 1 [CrossRef]
- Hirata, C., & Seljak, U. 2004, Phys. Rev. D, 70, 063526 [NASA ADS] [CrossRef] (In the text)
- Hu, W., Eisenstein, D. J., & Tegmark, M. 1998, , 80, 5255 (In the text)
- Ichiki, K., Takada, M., & Takahashi, T. 2009, Phys. Rev. D, 79, 023520 [NASA ADS] [CrossRef]
- Ilbert, O., Arnouts, S., McCracken, H. J., et al. 2006, A&A, 457, 841 [NASA ADS] [CrossRef] [EDP Sciences]
- Jing, Y. P., Zhang, P., Ling, W. P., Gao, L., & Springel, V. 2006, ApJ, 640, L119 [NASA ADS] [CrossRef]
- Kiakotou, A., Elgarøy, Ø., & Lahav, O. 2008, Phys. Rev. D, 77, 063005 [NASA ADS] [CrossRef] (In the text)
- Kilbinger, M., Benabed, K., Guy, J., et al. 2009, A&A, 497, 677 [NASA ADS] [CrossRef] [EDP Sciences]
- Kitching, T. D., Heavens, A. F., Verde, L., Serra, P., & Melchiorri, A. 2008, Phys. Rev. D, 77, 103008 [NASA ADS] [CrossRef] (In the text)
- Kolb, E. W., Matarrese, S., & Riotto, A. 2006, New J. Phys., 8, 322 [CrossRef]
- Komatsu, E., Dunkley, J., Nolta, M. R., et al. 2009, ApJS, 180, 330 [NASA ADS] [CrossRef] (In the text)
- Kristiansen, J., Elgaroy, O., & Dahle, H. 2007, Phys. Rev. D, 75, 083510 [NASA ADS] [CrossRef]
- Lesgourgues, J., & Pastor, S. 2006, Phys. Rep., 429, 307 [NASA ADS] [CrossRef] (In the text)
- Lesgourgues, J., Pastor, S., & Perotto, L. 2004, Phys. Rev. D, 70, 045016 [NASA ADS] [CrossRef] (In the text)
- Lewis, A., & Bridle, S. 2002, Phys. Rev. D, 66, 103511 [NASA ADS] [CrossRef]
- Mangano, G., Miele, G., Pastor, S., & Peloso, M. 2002, Phys. Lett. B, 534, 8 [NASA ADS] [CrossRef] (In the text)
- Massey, R., Heymans, C., Berge, J., et al. 2007, MNRAS, 376, 13 [NASA ADS] [CrossRef] (In the text)
- McTavish, C. J., Ade, P. A. R., Bode, J. J., et al. 2006, ApJ, 647, 799 [NASA ADS] [CrossRef] (In the text)
- Munshi, D., Valageas, P., van Waerbeke, L., & Heavens, A. F. 2008, Phys. Rep., 462, 67 [NASA ADS] [CrossRef] (In the text)
- Peacock, J. A., & Dodds, S. J. 1996, MNRAS, 280, 19 [NASA ADS] (In the text)
- Peacock, J. A., Schneider, P., Efstathiou, G., et al. 2006, Report of the ESA-ESO Working Group on Fundamental Cosmology [arXiv:astro-ph/0610906] (In the text)
- Percival, W. J., Cole, S., Eisenstein, D., et al. 2007, MNRAS, 381, 1053 [NASA ADS] [CrossRef] (In the text)
- Pietroni, M. 2008, JCAP, 10, 036 [NASA ADS]
- Riess, A. G., Strolger, L.-G., Tonry, J., et al. 2004, ApJ, 607, 665 [NASA ADS] [CrossRef] (In the text)
- Ringwald, A., & Wong, Y. Y. 2004, JCAP, 0412, 005 [NASA ADS] (In the text)
- Saito, S., Takada, M., & Taruya, A. 2008, , 100, 191301 (In the text)
- Schneider, P., van Waerbeke, L., Jain, B., & Kruse, G. 1998, MNRAS, 296, 873 [NASA ADS] [CrossRef] (In the text)
- Schneider, P., van Waerbeke, L., Kilbinger, M., & Mellier, Y. 2002, A&A, 396, 1 [NASA ADS] [CrossRef] [EDP Sciences]
- Schimd, C., Uzan, J.-P., & Riazuelo, A. 2005, Phys. Rev. D, 71, 083512 [NASA ADS] [CrossRef] (In the text)
- Schimd, C., Tereno, I., Uzan, J.-P., et al. 2007, A&A, 463, 405 [NASA ADS] [CrossRef] [EDP Sciences] (In the text)
- Seljak, U., Makarov, A., Mandelbaum, R., et al. 2005, Phys. Rev. D, 71, 043511 [NASA ADS] [CrossRef] (In the text)
- Seljak, U., Slosar, A., McDonald, P., et al. 2006, JCAP, 10, 14 [NASA ADS] (In the text)
- Semboloni, E., van Waerbeke, L., Heymans, C., et al. 2007, MNRAS, 375, L6 [NASA ADS]
- Semboloni, E., Tereno, I., van Waerbeke, L., & Heymans, C. 2008 [arXiv:0812.1881]
- Smith, R. E., Peacock, J. A., Jenkins, A., et al. 2003, MNRAS, 341, 1311 [NASA ADS] [CrossRef] (In the text)
- Tegmark, M., Eisenstein, D. J., Strauss, M. A., et al. 2006, Phys. Rev. D, 74, 123507 [NASA ADS] [CrossRef]
- Tocchini-Valentini, D., & Amendola, L. 2002, Phys. Rev. D, 65, 063508 [NASA ADS] [CrossRef]
- Uzan, J.-P. 1999, Phys. Rev. D, 59, 123510 [NASA ADS] [CrossRef]
- Uzan, J.-P. 2006, Gen. Rel. Grav., 39, 307 [CrossRef] (In the text)
- Uzan, J.-P., Clarckson, C., & Ellis, G. F. R. 2008, , 100, 191303 (In the text)
- Wetterich, C. 1995, A&A, 301, 321 [NASA ADS]
- White, M. 2005, Astropar. Phys., 24, 334 [NASA ADS] [CrossRef]
- Wiltshire, D. 2007, New J. Phys., 9, 377 [CrossRef]
- Wong, Y. Y. Y. 2008, JCAP, 10, 035 [NASA ADS] (In the text)
- Zhan, H., & Knox, L. 2004, ApJ, 616, L75 [NASA ADS] [CrossRef]
Footnotes
- ... masses
- Based on observations obtained with MegaPrime/MegaCam, a joint project of CFHT and CEA/DAPNIA, at the Canada-France-Hawaii Telescope (CFHT) which is operated by the National Research Council (NRC) of Canada, the Institut National des Sciences de l'Univers of the Centre National de la Recherche Scientifique (CNRS) of France, and the University of Hawaii. This work is based in part on data products produced at TERAPIX and the Canadian Astronomy Data Centre as part of the Canada-France-Hawaii Telescope Legacy Survey, a collaborative project of NRC and CNRS.
- ...
CAMB
- http://camb.info
- ...
archive
- http://lambda.gsfc.nasa.gov/
All Figures
| |
Figure 1:
Left: equation-of-state of fermionic massive
particles as function of redshift z for m=1.0 eV (solid line),
0.1 eV (dashed) and 0.01 eV (dotted). The transition redshift,
Eq. (2), is indicated in each case. The
dashed-dotted curve shows the lensing efficiency window (arbitrary
normalization). Right: aperture-mass variance
|
| Open with DEXTER | |
| In the text | |
| |
Figure 2:
Confidence contours (68% and 95%) from the aperture-mass dispersion between 1 |
| Open with DEXTER | |
| In the text | |
| |
Figure 3:
Left: best-fit models found for massive (
|
| Open with DEXTER | |
| In the text | |
| |
Figure 4:
Joint analysis.
Left and middle: contours at 95% C.L. of
|
| Open with DEXTER | |
| In the text | |
| |
Figure 5:
Tests of the robustness of the result. Marginalized joint constraints
(68% and 95% C.L.) obtained using the actual data
(filled contours) and various assumptions (open contours).
Left: impact of systematics, assuming a 4% underestimation (solid) or
marginalizing over a |
| Open with DEXTER | |
| In the text | |
Copyright ESO 2009
Current usage metrics show cumulative count of Article Views (full-text article views including HTML views, PDF and ePub downloads, according to the available data) and Abstracts Views on Vision4Press platform.
Data correspond to usage on the plateform after 2015. The current usage metrics is available 48-96 hours after online publication and is updated daily on week days.
Initial download of the metrics may take a while.