| Issue |
A&A
Volume 499, Number 3, June I 2009
|
|
|---|---|---|
| Page(s) | 653 - 660 | |
| Section | Astrophysical processes | |
| DOI | https://doi.org/10.1051/0004-6361/200911847 | |
| Published online | 08 April 2009 | |
The core-collapse rate from the Supernova Legacy Survey
G. Bazin1 - N. Palanque-Delabrouille1 - J. Rich1 - V. Ruhlmann-Kleider1 - E. Aubourg1,2 - L. Le Guillou3 - P. Astier3 - C. Balland3,4 - S. Basa5 - R. G. Carlberg7 - A. Conley7 - D. Fouchez8 - J. Guy3 - D. Hardin3 - I. M. Hook10 - D. A. Howell7 - R. Pain3 - K. Perrett7 - C. J. Pritchet9 - N. Regnault3 - M. Sullivan10 - P. Antilogus3 - V. Arsenijevic11 - S. Baumont3 - S. Fabbro11 - J. Le Du8 - C. Lidman12 - M. Mouchet2,6 - A. Mourão11 - E. S. Walker10
1 - CEA/Saclay, DSM/Irfu/Spp, 91191 Gif-sur-Yvette Cedex, France
2 - APC, UMR 7164 CNRS, 10 rue Alice Domon et Léonie Duquet, 75205 Paris Cedex 13, France
3 - LPNHE, CNRS-IN2P3 and Universities of Paris 6 & 7, 75252 Paris Cedex 05, France
4 - University Paris 11, 91405 Orsay, France
5 - LAM, CNRS, BP8, Pôle de l'étoile, Site de Château-Gombert,
38 rue Frédéric Joliot-Curie, 13388 Marseille Cedex 13, France
6 - LUTH, UMR 8102 CNRS, Observatoire de Paris, Section de Meudon, 92195 Meudon Cedex, France
7 - Deparment of Astronomy and Astrophysics, University of Toronto, 50 St. George Street, Toronto, ON M5S 3H8, Canada
8 - CPPM, CNRS-Luminy, Case 907, 13288 Marseille Cedex 9, France
9 - Department of Physics and Astronomy, University of Victoria, PO Box 3055, Victoria, BC V8W 3P6, Canada
10 - University of Oxford, Astrophysics, Denys Wilkinson Building, Kneble Road, Oxford OX1 3RH, UK
11 - CENTRA-Centro M. de Astrofisica and Department of Physics, IST, Lisbon, Portugal
12 - European Southern Observatory, Alonso de Cordova 3107, Vitacura, Casilla 19001, Santiago 19, Chile
Received 13 February 2009 / Accepted 6 April 2009
Abstract
We use three years of data from the Supernova Legacy Survey (SNLS)
to study the general properties of core-collapse and type Ia supernovae.
This is the first such study using the ``rolling search'' technique
which guarantees well-sampled SNLS light curves and good efficiency for
supernovae brighter than
![]() .
Using host photometric redshifts,
we measure the supernova absolute magnitude distribution
down to luminosities
.
Using host photometric redshifts,
we measure the supernova absolute magnitude distribution
down to luminosities
![]() fainter than normal SNIa.
Using spectroscopy and light-curve fitting to
discriminate against SNIa,
we find a sample of 117 core-collapse supernova candidates with
redshifts z<0.4
(median redshift of 0.29)
and measure their rate to be larger than
the type Ia supernova rate by a factor
fainter than normal SNIa.
Using spectroscopy and light-curve fitting to
discriminate against SNIa,
we find a sample of 117 core-collapse supernova candidates with
redshifts z<0.4
(median redshift of 0.29)
and measure their rate to be larger than
the type Ia supernova rate by a factor
![]() .
This corresponds to a core-collapse rate at z=0.3 of
.
This corresponds to a core-collapse rate at z=0.3 of
![]() .
.
Key words: supernovae: general - stars: evolution - surveys
1 Introduction
The rate of supernova explosions is astrophysically
important because it
determines the rate at which
heavy elements are dispersed into the interstellar medium,
thereby constraining galactic chemical evolution.
Since the progenitors of core-collapse supernovae (SNcc) are
believed to be short-lived massive stars,
the SNcc rate is expected to reflect the star-formation
rate, increasing with redshift
like
![]() for z<0.5 (Hopkins & Beacom 2006).
Thermonuclear type Ia supernovae
(SNIa) have both long- and short-lived progenitors so the
SNIa rate has a delayed component making the
SNIa rate rise more slowly with redshift,
for z<0.5 (Hopkins & Beacom 2006).
Thermonuclear type Ia supernovae
(SNIa) have both long- and short-lived progenitors so the
SNIa rate has a delayed component making the
SNIa rate rise more slowly with redshift,
![]() (Pritchet et al. 2008).
(Pritchet et al. 2008).
The SNIa rate is now known to a precision of about ![]() .
Measurements have profited from
the high luminosity of SNIa which
make them relatively easy to detect and identify.
Furthermore,
their utility as cosmological distance indicators has
motivated intense searches.
An example is the Supernova Legacy
Survey (SNLS) at the Canada-France-Hawaii Telescope (CFHT)
performed between 2003 and 2008.
Using early SNLS data, Neill et al. (2006)
derived a SNIa rate at a redshift
.
Measurements have profited from
the high luminosity of SNIa which
make them relatively easy to detect and identify.
Furthermore,
their utility as cosmological distance indicators has
motivated intense searches.
An example is the Supernova Legacy
Survey (SNLS) at the Canada-France-Hawaii Telescope (CFHT)
performed between 2003 and 2008.
Using early SNLS data, Neill et al. (2006)
derived a SNIa rate at a redshift ![]() of
of
where
The rate for SNcc is more
difficult to measure because observed SNcc have a magnitude
distribution that peaks roughly
![]() fainter than SNIa
and covers a range of more than
fainter than SNIa
and covers a range of more than
![]() (Richardson et al. 2002).
The local rate was measured by Cappellaro et al. (1999)
using 137 supernovae discovered by eye and photographically.
Most had spectroscopic identification, about half being SNIa
and half SNcc (SNIb/c and SNII).
After efficiency corrections, the
SNcc rate was found to be a factor
(Richardson et al. 2002).
The local rate was measured by Cappellaro et al. (1999)
using 137 supernovae discovered by eye and photographically.
Most had spectroscopic identification, about half being SNIa
and half SNcc (SNIb/c and SNII).
After efficiency corrections, the
SNcc rate was found to be a factor ![]() greater
than the SNIa rate.
greater
than the SNIa rate.
The SNcc rate at ![]() was measured by Cappellaro et al. (2005) and more
recently by Botticella et al. (2008).
The latter used images taken over a six year period with typically
four months between images.
They found 18 SNcc candidates
and 13 SNIa candidates
(of which a total of 25 are spectroscopically confirmed)
to find a SNcc rate at
was measured by Cappellaro et al. (2005) and more
recently by Botticella et al. (2008).
The latter used images taken over a six year period with typically
four months between images.
They found 18 SNcc candidates
and 13 SNIa candidates
(of which a total of 25 are spectroscopically confirmed)
to find a SNcc rate at ![]() a factor
a factor ![]() greater than
the SNIa rate.
Finally, Dahlen et al. (2004) used the
Advanced Camera for Surveys
on the Hubble Space Telescope to obtain
images for five epochs separated by
greater than
the SNIa rate.
Finally, Dahlen et al. (2004) used the
Advanced Camera for Surveys
on the Hubble Space Telescope to obtain
images for five epochs separated by
![]() .
For redshifts <1, they found
17 SNIa candidates (with some spectroscopic identification)
and 16 SNcc candidates (no spectroscopic identification)
which allowed them to derive
.
For redshifts <1, they found
17 SNIa candidates (with some spectroscopic identification)
and 16 SNcc candidates (no spectroscopic identification)
which allowed them to derive
![]() at
at ![]() and
and
![]() at
at ![]() .
.
All existing measurements of the SNcc rate suffer from the
fact that the discovery procedure involved the comparison
of images separated in time by intervals comparable to
or greater than the characteristic
![]() time scales of supernovae.
Consequently,
well-sampled
light curves for most
candidates are not available,
complicating the type identification and
efficiency calculations.
The SNLS ``rolling search'' avoids this problem
because of its high cadence
monitoring of four
time scales of supernovae.
Consequently,
well-sampled
light curves for most
candidates are not available,
complicating the type identification and
efficiency calculations.
The SNLS ``rolling search'' avoids this problem
because of its high cadence
monitoring of four
![]() fields in the
fields in the ![]() ,
,
![]() ,
,
![]() and
and ![]() bands
over a total of 5 years.
During each 6 month observing season for each field,
typically four observations per lunation were obtained in the
bands
over a total of 5 years.
During each 6 month observing season for each field,
typically four observations per lunation were obtained in the
![]() and
and ![]() bands,
three in the
bands,
three in the ![]() band and two in the
band and two in the ![]() band.
This strategy yields well-sampled light curves
(e.g. Figs. 1-3) with high efficiency for all events
occurring during the observing season and having maximum fluxes
brighter than
band.
This strategy yields well-sampled light curves
(e.g. Figs. 1-3) with high efficiency for all events
occurring during the observing season and having maximum fluxes
brighter than
![]() .
This makes the sample of normal SNIa essentially complete up to z=0.6.
For the fainter SNcc, SNLS effectively monitors a volume that
is a calculable function of the apparent magnitude and redshift.
This will allow us to derive
the differential supernova rate
(rate per absolute magnitude interval) for
supernova with redshifts <0.4 and
within
.
This makes the sample of normal SNIa essentially complete up to z=0.6.
For the fainter SNcc, SNLS effectively monitors a volume that
is a calculable function of the apparent magnitude and redshift.
This will allow us to derive
the differential supernova rate
(rate per absolute magnitude interval) for
supernova with redshifts <0.4 and
within
![]() of normal SNIa.
of normal SNIa.
![\begin{figure}
\par\includegraphics[width=8cm,clip]{1847fg01.eps}
\end{figure}](/articles/aa/full_html/2009/21/aa11847-09/img40.png) |
Figure 1:
The |
| Open with DEXTER | |
![\begin{figure}
\par\includegraphics[width=8cm,clip]{1847fg02.eps}
\end{figure}](/articles/aa/full_html/2009/21/aa11847-09/img41.png) |
Figure 2:
The |
| Open with DEXTER | |
The primary goal of SNLS was cosmology with SNIa. As such, mostly SNIa-like objects were targeted for spectroscopy (Sullivan et al. 2006) and the majority of our SN candidates do not have spectroscopic identification or redshifts. We therefore used host photometric redshifts for this study though we are in the process of obtaining host spectroscopic redshifts. For supernovae without spectroscopic identification, knowledge of the host redshift allows us to determine if the supernova four-band light-curves are consistent with the family of light curves typical of SNIa. The combination of spectroscopic and photometric typing will allow us to identify most SNIa. A relatively uncontaminated sample of SNcc is then defined as those supernovae not identified as SNIa. Use of the previously measured SNIa rate (Neill et al. 2006) will then allow us to derive the SNcc rate. The measurement will use only supernovae with redshifts <0.4, beyond which the efficiency for detecting SNcc is too small to add significantly to the sample. This has the additional advantage that in this redshift range, the 615 nm Si II absorption feature is visible simplifying spectroscopic identification of SNIa.
![\begin{figure}
\par\includegraphics[width=8cm,clip]{1847fg03.eps}
\end{figure}](/articles/aa/full_html/2009/21/aa11847-09/img42.png) |
Figure 3:
The |
| Open with DEXTER | |
The outline of this paper is as follows. Section 2 presents the light curve construction and event selection. Section 3 presents the characteristics of the supernova candidates. Section 4 defines the SNIa and SNcc candidate samples. Section 5 derives the relative SNIa and SNcc rates from which we deduce the SNcc rate. Section 6 concludes with a comparison of previous results.
Throughout, magnitudes are expressed in the AB system
(Fukugita et al. 1996).
A flat
![]() universe with
universe with
![]() is assumed.
is assumed.
2 Event selection
For this study, we performed a ``deferred'' search for transient events
that was completely independent of the
real-time search![]() used
to select supernovae for spectroscopy
targets and for subsequent use in cosmological
parameter analyzes.
The details of the deferred search are given elsewhere
(Bazin 2008; Bazin et al. 2009).
We used
SNLS observations of the four ``deep'' fields (D1, D2, D3, D4)
from January 1st, 2003 to September 21, 2006.
A reference image for each field and filter was constructed by co-adding
the images from 20 good quality nights.
The reference image was then subtracted from all science images of the same
field and filter (after seeing-adjustment).
In the
used
to select supernovae for spectroscopy
targets and for subsequent use in cosmological
parameter analyzes.
The details of the deferred search are given elsewhere
(Bazin 2008; Bazin et al. 2009).
We used
SNLS observations of the four ``deep'' fields (D1, D2, D3, D4)
from January 1st, 2003 to September 21, 2006.
A reference image for each field and filter was constructed by co-adding
the images from 20 good quality nights.
The reference image was then subtracted from all science images of the same
field and filter (after seeing-adjustment).
In the ![]() filter,
the subtracted images from each lunation were combined to form one
``stacked'' image
per lunation
and stellar objects were searched for on each of these stacks.
Approximately 300 000 objects were found,
mostly spurious detections due to saturated signals from bright objects.
Four-filter light curves
for these objects were then obtained from individual subtracted images by
differential photometry with PSF fitting, imposing the position
found on the
filter,
the subtracted images from each lunation were combined to form one
``stacked'' image
per lunation
and stellar objects were searched for on each of these stacks.
Approximately 300 000 objects were found,
mostly spurious detections due to saturated signals from bright objects.
Four-filter light curves
for these objects were then obtained from individual subtracted images by
differential photometry with PSF fitting, imposing the position
found on the ![]() stack.
Fluxes were calibrated using the set of SNLS tertiary
standards (Astier et al. 2006).
stack.
Fluxes were calibrated using the set of SNLS tertiary
standards (Astier et al. 2006).
The event selection criteria applied on the detected light curves are
described in detail in Bazin et al. (2009).
Spurious detections were mostly eliminated by requiring that the
light curves in ![]() and
and ![]() have at least
three successive photometric points with fluxes above
have at least
three successive photometric points with fluxes above ![]() from
base line and their dates of maximum flux should be within 50 days from
each other.
Light curves corresponding to detections near stars as identified
in our reference images were also discarded.
Accepted light curves were fit with the phenomenological form
from
base line and their dates of maximum flux should be within 50 days from
each other.
Light curves corresponding to detections near stars as identified
in our reference images were also discarded.
Accepted light curves were fit with the phenomenological form
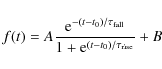
while this form has no particular physical motivation, it is sufficiently general to fit the shape of all types of supernovae. Long-term variable objects (such as AGNs) were rejected by comparing the
Light-curves for three events are shown in
Figs. 1-3.
The first shows a typical spectroscopically-confirmed SNIa
with spectroscopic redshift z=0.332and the second a typical spectroscopically-confirmed SNcc
with spectroscopic redshift z=0.328.
The third is one of the faintest events to be used in Sect. 5
to measure the core-collapse rate.
Its peak magnitude is
![]() ,
as fitted by (1).
,
as fitted by (1).
To identify host galaxies for the events, we used
the photometric galaxy catalog of Ilbert et al. (2006).
The host for an event was chosen to be the
galaxy with the smallest distance, r, between the event and
the galaxy center in units of the galaxy's effective radius,
![]() ,
defined as
the half-width of the galaxy in the direction of the
event.
The value of
,
defined as
the half-width of the galaxy in the direction of the
event.
The value of
![]() was defined by the A, B and
was defined by the A, B and ![]() SExtractor
parameters (Bertin & Arnouts 1996).
The match was considered successful if the host was at a distance
SExtractor
parameters (Bertin & Arnouts 1996).
The match was considered successful if the host was at a distance
![]() .
This choice was a compromise between host finding efficiency
and accidental mismatching.
Of the 1462 selected events, 1329 (91%) have matched hosts
and of these 1207 (91%) have a photometric redshift.
Figure 4 shows the host spectroscopic redshift vs.
photometric redshift (Ilbert et al. 2006) for events with both.
After elimination of outliers,
the deduced resolution for photometric redshifts is
.
This choice was a compromise between host finding efficiency
and accidental mismatching.
Of the 1462 selected events, 1329 (91%) have matched hosts
and of these 1207 (91%) have a photometric redshift.
Figure 4 shows the host spectroscopic redshift vs.
photometric redshift (Ilbert et al. 2006) for events with both.
After elimination of outliers,
the deduced resolution for photometric redshifts is
![]() for z<0.4.
for z<0.4.
![\begin{figure}
\par\includegraphics[width=8cm,clip]{1847fg04.eps}
\end{figure}](/articles/aa/full_html/2009/21/aa11847-09/img52.png) |
Figure 4: SNLS spectroscopic redshifts vs. host photometric redshifts taken from the catalog of Ilbert et al. (2006). Spectroscopically identified supernovae and photometrically identified SNIa are marked by the signs defined at the top of the figure. The crosses are supernovae whose type is not determined spectroscopically or photometrically. |
| Open with DEXTER | |
For the SNcc rate measurements, we will consider only the
239 events with
![]() .
These light curves were visually scanned in order to eliminate a few
residual non-SN events. Six light curves were clear physical variable
events, varying on a time-scale consistent with that of SNe but their
light curves showed other details incompatible with that hypothesis (no
flux in g', r', z' filter or rise time longer than fall time). Another 12 events had light curves with very low maximum flux and erratic
variations and thus most probably residual noise events which appear to
be associated with low redshift galaxies.
After elimination of these events, we were left with 221 events.
.
These light curves were visually scanned in order to eliminate a few
residual non-SN events. Six light curves were clear physical variable
events, varying on a time-scale consistent with that of SNe but their
light curves showed other details incompatible with that hypothesis (no
flux in g', r', z' filter or rise time longer than fall time). Another 12 events had light curves with very low maximum flux and erratic
variations and thus most probably residual noise events which appear to
be associated with low redshift galaxies.
After elimination of these events, we were left with 221 events.
![\begin{figure}
\par\includegraphics[width=8cm,clip]{1847fg05.eps}
\end{figure}](/articles/aa/full_html/2009/21/aa11847-09/img55.png) |
Figure 5:
Pre-selection efficiency as a function of |
| Open with DEXTER | |
The efficiency of the event selection procedure was calculated
by treating
simulated supernovae with the same procedure.
Supernovae added to real ![]() -band images were used to
test the initial detection stage in
-band images were used to
test the initial detection stage in ![]() .
The efficiency of the subsequent event selection cuts was calculated
by applying them to light curves
generated by a Monte-Carlo simulation that takes into
account the photometric resolution and the observing sequence.
The resulting efficiency is a function of the maximum
fluxes in the four bands and the associated time scales.
However, to good approximation the efficiency is
simply a function of the maximum in the
.
The efficiency of the subsequent event selection cuts was calculated
by applying them to light curves
generated by a Monte-Carlo simulation that takes into
account the photometric resolution and the observing sequence.
The resulting efficiency is a function of the maximum
fluxes in the four bands and the associated time scales.
However, to good approximation the efficiency is
simply a function of the maximum in the ![]() band.
The efficiency is shown in Fig. 5 for
SNIa and for long SNcc (
band.
The efficiency is shown in Fig. 5 for
SNIa and for long SNcc (
![]() ).
In both cases,
the efficiency is relatively
).
In both cases,
the efficiency is relatively ![]() -independent
at a value of
-independent
at a value of ![]() for
for
![]() at which point it starts to decline, reaching
0.4 at
at which point it starts to decline, reaching
0.4 at
![]() .
.
The performance of our selection pipeline was checked by comparing
it with the results of
the SNLS real-time pipeline used to select spectroscopy
targets. A total of 340 supernovae
were targeted during the period considered here
including events as faint as
![]() .
Of these, all but two were found on the
.
Of these, all but two were found on the ![]() stacked images.
(The two lost events were outside the reference images.)
Of the 338 events, 295 passed our selection criteria.
The loss of the 43 events was due to our
time sampling criteria which is more restrictive than
the real-time criteria.
stacked images.
(The two lost events were outside the reference images.)
Of the 338 events, 295 passed our selection criteria.
The loss of the 43 events was due to our
time sampling criteria which is more restrictive than
the real-time criteria.
3 Event characteristics
Figure 6
shows the ![]() Hubble diagram for the 221 events
with host photometric redshifts <0.4.
Events that are spectroscopically
identified as SNIa or SNcc (SNII, SNIb, SNIc) are marked.
Also marked are photometrically identified SNIa as
discussed in Sect. 4.
The spectroscopic SNIa's fall mostly
along the band of bright events
centered approximately on
Hubble diagram for the 221 events
with host photometric redshifts <0.4.
Events that are spectroscopically
identified as SNIa or SNcc (SNII, SNIb, SNIc) are marked.
Also marked are photometrically identified SNIa as
discussed in Sect. 4.
The spectroscopic SNIa's fall mostly
along the band of bright events
centered approximately on
![]() .
The spectroscopic SNcc's are generally fainter with
.
The spectroscopic SNcc's are generally fainter with
![]() .
.
![\begin{figure}
\par\includegraphics[width=8cm,clip]{1847fg06.eps}
\end{figure}](/articles/aa/full_html/2009/21/aa11847-09/img62.png) |
Figure 6:
The peak |
| Open with DEXTER | |
The supernovae that we will use to measure rates have
a wide range of redshifts up to z=0.4.
In order to compare supernovae of differing z, we
define an AB magnitude centered on 570 nm
in the supernova rest-frame by a simple
redshift-dependent interpolation between ![]() and
and ![]() :
:
This gives
![\begin{displaymath}\Delta M_{570} \equiv m_{570} - 2.5\log\left[(1+z)d(z)^2\right] -C
\end{displaymath}](/articles/aa/full_html/2009/21/aa11847-09/img68.png)
where
The constant C=24.2 is chosen so that the spectroscopically confirmed SNIa are centered on
![\begin{figure}
\par\includegraphics[width=8cm,clip]{1847fg07.eps}
\end{figure}](/articles/aa/full_html/2009/21/aa11847-09/img70.png) |
Figure 7:
The pseudo-absolute magnitude
|
| Open with DEXTER | |
![\begin{figure}
\par\includegraphics[width=8cm,clip]{1847fg08.eps}
\end{figure}](/articles/aa/full_html/2009/21/aa11847-09/img71.png) |
Figure 8:
Host morphological type as a function of
|
| Open with DEXTER | |
Figure 7 shows
![]() as a function of redshift.
The spectroscopically identified SNIa and SNcc are now
separated horizontally with
as a function of redshift.
The spectroscopically identified SNIa and SNcc are now
separated horizontally with
![]() dominated by
SNIa and
dominated by
SNIa and
![]() containing most spectroscopically-confirmed SNcc.
The characteristics of the events as a function of
containing most spectroscopically-confirmed SNcc.
The characteristics of the events as a function of
![]() ,
shown in Figs. 8-10,
are broadly consistent with those expected for SNIa and SNcc.
Figure 8 shows
,
shown in Figs. 8-10,
are broadly consistent with those expected for SNIa and SNcc.
Figure 8 shows
![]() as a function
of the photometric host types (Ilbert et al. 2006).
As expected for a sample dominated by SNcc,
the faint events have relatively fewer early-type hosts (19/152)
compared to 24/69 for the bright events.
Figure 9 shows
as a function
of the photometric host types (Ilbert et al. 2006).
As expected for a sample dominated by SNcc,
the faint events have relatively fewer early-type hosts (19/152)
compared to 24/69 for the bright events.
Figure 9 shows
![]() as a function of
as a function of
![]() .
As with low redshift SNcc (Richardson et al. 2002), about half (47/108) the
faint events have
.
As with low redshift SNcc (Richardson et al. 2002), about half (47/108) the
faint events have
![]() ,
characteristic
of plateau SNII and significantly longer than fall times for
SNIa,
,
characteristic
of plateau SNII and significantly longer than fall times for
SNIa,
![]() .
Finally, Fig. 10 shows the color-magnitude diagram
using
the AB magnitude at
.
Finally, Fig. 10 shows the color-magnitude diagram
using
the AB magnitude at
![]() in the rest frame:
in the rest frame:
| (5) |
The SNIa candidates have a narrower color distribution than the SNcc candidates.
![\begin{figure}
\par\includegraphics[width=8cm,clip]{1847fg09.eps}
\end{figure}](/articles/aa/full_html/2009/21/aa11847-09/img78.png) |
Figure 9:
Fall time
|
| Open with DEXTER | |
![\begin{figure}
\par\includegraphics[width=8cm,clip]{1847fg10.eps}
\end{figure}](/articles/aa/full_html/2009/21/aa11847-09/img79.png) |
Figure 10:
The color-magnitude diagram. Only
the subset of
events with points in |
| Open with DEXTER | |
4 Supernova classification
SNLS did not have sufficient telescope time to obtain spectra
of all SNIa candidates.
Therefore, in order to define a more complete SNIa sample,
the four-band light curves of all events were compared to
SALT2 SNIa template light curves (Guy et al. 2007).
The SALT2 model characterizes light curves by four parameters:
the date of maximum in the rest-frame B-band, the maximum flux in the
rest-frame B band, a ``color'' parameter roughly equivalent to rest-frame B-V,
and a ``stretch'' parameter that dilates the event time scale.
The light curves were fit for these parameters
imposing the host photometric redshift.
Events were ``photometrically'' classified as SNIa if
the four-band fit was reasonable (
![]() )
and if
fit parameters corresponded to normal SNIa.
In particular, cuts were applied to the rise and fall times, the
color, c, and to the position in the two
color magnitude diagrams,
)
and if
fit parameters corresponded to normal SNIa.
In particular, cuts were applied to the rise and fall times, the
color, c, and to the position in the two
color magnitude diagrams,
![]() vs.
vs. ![]() and
and
![]() vs.
vs. ![]() .
.
Table 1 shows the number of events photometrically classified as SNIa or ``not SNIa'' for events classified spectroscopicaly as SNIa, SNcc and ``ambiguous'', as well as for events for which no spectrum was obtained. The table contains only those events that will be used for rate measurements in the next section, i.e. those with 0.05<z<0.4 and m570<24.1 (Eq. (2)). The reasonable performance of the photometric classification is demonstrated by the fact that only seven of the 46 spectroscopic SNIa were not selected and only one of the 24 spectroscopic SNcc was selected. The photometric classification also selected 14 events that had not been classified spectroscopically as SNIa. As detailed below, the lack of spectroscopic confirmation was generally due to an insufficient supernova signal over the galactic background or to lack of telescope time to obtain a spectrum.
Table 1: The numbers of events for each spectroscopic and photometric classification.
![\begin{figure}
\par\includegraphics[width=8cm,clip]{1847fg11.eps}
\end{figure}](/articles/aa/full_html/2009/21/aa11847-09/img83.png) |
Figure 11:
The distribution of
|
| Open with DEXTER | |
![\begin{figure}
\par\includegraphics[width=8.3cm,clip]{1847fg12.eps}
\end{figure}](/articles/aa/full_html/2009/21/aa11847-09/img85.png) |
Figure 12:
The differential SNcc rate.
The data points are those of Fig. 11
with the SNIa subtracted
(statistical errors only).
The left-hand scale is the number of events and
the right-hand scale is the absolute differential rate derived
from the total rate in Sect. 5.
The dashed curve shows the intrinsic distribution
for a toy model (of no physical motivation) with rate
|
| Open with DEXTER | |
As our nominal SNIa sample, we choose the 46 events that
were spectroscopically identified as SNIa plus the 14 events
photometrically identified as SNIa that were not spectroscopic SNcc.
The nominal SNcc sample is the 117 remaining events.
The distribution of
![]() for these events are
shown as the histograms in Figs. 11 and 12.
for these events are
shown as the histograms in Figs. 11 and 12.
We have no evidence that the 60 SNIa candidates are contaminated
with SNcc incorrectly identified as SNIa.
We first consider the 46 spectroscopically identified SNIa.
It is unlikely that these events are significantly
contaminated with SNcc since for z<0.4 the Si(615 nm) line
is visible making the identification reliable.
In fact, of the 46 events, 43 were classified spectroscopically
as ``SNIa'' and only 3 as ``SNIa?''. The three ``SNIa?'' events are all
selected photometrically making them good SNIa candidates.
Of the 46 events, only seven were not photometrically accepted but
for reasons that do not call into question their SNIa character:
three had photometric redshifts significantly different
from the spectroscopic redshifts causing the
SALT fit to be very poor;
one event had an extreme color parameter falling outside our
cuts; three events had a small number of poor photometric points
causing the fits to fail our ![]() cut.
cut.
We now consider contamination of the
14 SNIa that have only photometric confirmation.
Of these, four events have spectroscopy that was of
insufficient signal-to-noise to determine
the SN type.
The remaining 10 events had no spectra either because
the event was discovered too late or because the estimated
signal-to-noise was insufficiently (local flux increase <20%).
Only one of the 14 events was judged ``unlikely'' to be a SNIa by
the spectroscopy target selection group, but the full
light curve indicates that it is consistent with being a
normal SNIa.
We therefore have no evidence that the 14 events are contaminated
with SNcc.
However, we have no good template catalog of bright SNcc to evaluate
the probability that a bright SNcc passes our SNIa photometric
selection. We therefore
conservatively assign a systematic one standard deviation
upper limit of
![]() to contamination of the SNIa sample with SNcc.
to contamination of the SNIa sample with SNcc.
While we have no evidence that the SNIa sample is contaminated with SNcc, it is certain that the SNcc sample is contaminated by sub-luminous SNIa. We will evaluate this contamination in the next section.
5 The core-collapse rate
In this section, we will derive the SNcc rate using
events with
0.05<z<0.4 and
m570<24.1.
The cut on m570 is used to ensure that only
events with good detection efficiency are used.
The requirement that z>0.05 eliminates one event at z=0.04.
The uncertainty in
![]() is
is
![]() so the
event with z=0.04 has
so the
event with z=0.04 has
![]() and we prefer to
eliminate it.
(In fact, this event is a spectroscopic
outlier with
and we prefer to
eliminate it.
(In fact, this event is a spectroscopic
outlier with
![]() .)
With the m570 and redshift cuts, we are left with
177 events,
60 of which are spectroscopically
or photometrically identified SNIa.
.)
With the m570 and redshift cuts, we are left with
177 events,
60 of which are spectroscopically
or photometrically identified SNIa.
From these numbers,
we will derive the SNcc rate as follows.
We first
assign weights to the observed events
that take into account detection
efficiency and the volume over which the event could
be detected by SNLS.
Because of their intrinsic faintness,
this will significantly increase the number of SNcc candidates to 287.
We next evaluate two effects that can change the number of SNcc candidates
relative to SNIa candidates.
The first is simple
spectral or photometric misidentification.
The second comes from the use of host photometric redshifts which,
we will see, has a slight tendency to increase the number of SNIa
candidates relative to SNcc candidates.
Using the corrected
number of candidates, we then
calculate the SNcc rate relative to the SNIa rate.
By adopting the previously measured SNIa rate, we then
derive the SNcc rate for luminosities within
![]() of normal SNIa.
Finally, we estimate the total SNcc rate taking into account
the decrease in the number of observed supernovae due to extinction by dust
in the host galaxy.
of normal SNIa.
Finally, we estimate the total SNcc rate taking into account
the decrease in the number of observed supernovae due to extinction by dust
in the host galaxy.
5.1 Event weights
The observed distribution of
![]() is
the histogram shown in Fig. 11
for the 177 events with z<0.4 and
m570<24.1.
In order to derive the true distribution of
is
the histogram shown in Fig. 11
for the 177 events with z<0.4 and
m570<24.1.
In order to derive the true distribution of
![]() for events with z<0.4,
this distribution must be corrected for the
for events with z<0.4,
this distribution must be corrected for the ![]() -dependent
detection efficiency and, more importantly, for the fact that
an event with absolute
magnitude
-dependent
detection efficiency and, more importantly, for the fact that
an event with absolute
magnitude
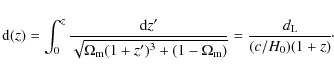
![]() can be seen only up to a
redshift,
can be seen only up to a
redshift, ![]() defined by
defined by
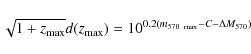 |
(6) |
where d(z) is defined by (4) and
where
Weighting individual events gives
the corrected
![]() distribution
shown by the data points and error bars in Fig. 11.
All of the 60 SNIa candidates have weights near unity.
Because of their faintness, many of the 117 SNcc candidates have
W>1 and the corrected number of SNcc candidates
is
distribution
shown by the data points and error bars in Fig. 11.
All of the 60 SNIa candidates have weights near unity.
Because of their faintness, many of the 117 SNcc candidates have
W>1 and the corrected number of SNcc candidates
is ![]() (statistical error only).
(statistical error only).
5.2 Corrections for misidentification and redshift migration
In this section we correct the raw number of SNIa and SNcc candidates for two effects that can affect their numbers: type misidentification (summarized in Table 2) and redshift migration due to the use of photometric redshifts.
Table 2: Corrections applied to the 60 SNIa candidates and 287 (weighted) SNcc candidates.
The first shift in the SNIa-SNcc ratio
is due to SNIa that are incorrectly
identified as SNcc.
We divided this correction into that for ``sub-luminous'' SNIa and
normal SNIa.
Sub-luminous SNIa (Li et al. 2001) have a mean
magnitude 1.5 mag below the mean magnitude for normal SNIa and
account for ![]() of SNIa.
None are found in our sample since both selection for spectroscopy
and photometric selection aimed at finding normal SNIa.
We therefore add (subtract)
of SNIa.
None are found in our sample since both selection for spectroscopy
and photometric selection aimed at finding normal SNIa.
We therefore add (subtract)
![]() to the SNIa (from
the SNcc) samples.
For normal SNIa, we must
correct for events that were neither spectroscopically
nor photometrically selected.
From Table 1,
of the 46 spectroscopically confirmed events, only 7 were not
photometrically selected.
This gives an inefficiency of 7/46=0.15for photometric identification of spectroscopically confirmed SNIa.
To the 14 SNIa candidates relying solely on photometric
selection, we can therefore add
to the SNIa (from
the SNcc) samples.
For normal SNIa, we must
correct for events that were neither spectroscopically
nor photometrically selected.
From Table 1,
of the 46 spectroscopically confirmed events, only 7 were not
photometrically selected.
This gives an inefficiency of 7/46=0.15for photometric identification of spectroscopically confirmed SNIa.
To the 14 SNIa candidates relying solely on photometric
selection, we can therefore add
![]() and
subtract the same number from the SNcc.
and
subtract the same number from the SNcc.
As discussed in Sect. 4, we make no
correction for SNcc incorrectly identified as SNIa but
assign a systematic one standard deviation
upper limit of
![]() to contamination of the SNIa sample with SNcc.
to contamination of the SNIa sample with SNcc.
Contamination with non-supernova events is expected to be unimportant. The scan of events resulted in the elimination of only six AGN-like events and the identification of four additional events that were judged uncertain. We adopt four events as our one standard deviation upper limit on AGN contamination of the SNcc sample.
Finally, we correct for redshift migration (Eddington bias), an effect that
comes from our use of photometric redshifts with a modest
resolution of
![]() .
Because there are more supernovae at high redshift than
at low redshift, the main effect of this resolution is
for high redshift supernovae to migrate below the z=0.4 cutoff.
If there were no cut
m570<24.1,
this would increase the number of SNIa and SNcc
candidates by the same factor.
The fact that SNcc are fainter than SNIa means that migrating
SNcc are less likely to satisfy
m570<24.1 than
migrating SNIa.
We have used a Monte Carlo simulation to estimate this effect.
The simulation generates events with a realistic redshift
and M570 distribution and uses the observed spectroscopic-photometric
redshift pairs from Fig. 4 to assign photometric
redshifts. Outliers in this plot are used so the simulation
takes into account catastrophic redshifts.
Counting weighted simulated events indicates that the
migration makes the measured SNcc-SNIa rate ratio
.
Because there are more supernovae at high redshift than
at low redshift, the main effect of this resolution is
for high redshift supernovae to migrate below the z=0.4 cutoff.
If there were no cut
m570<24.1,
this would increase the number of SNIa and SNcc
candidates by the same factor.
The fact that SNcc are fainter than SNIa means that migrating
SNcc are less likely to satisfy
m570<24.1 than
migrating SNIa.
We have used a Monte Carlo simulation to estimate this effect.
The simulation generates events with a realistic redshift
and M570 distribution and uses the observed spectroscopic-photometric
redshift pairs from Fig. 4 to assign photometric
redshifts. Outliers in this plot are used so the simulation
takes into account catastrophic redshifts.
Counting weighted simulated events indicates that the
migration makes the measured SNcc-SNIa rate ratio
![]() less than the real rate ratio.
The statistical error comes from the limited number of redshift
pairs we have used for the simulation.
The measured SNcc-SNIa rate will therefore be multiplied by a factor
1.15 to take into account this effect.
less than the real rate ratio.
The statistical error comes from the limited number of redshift
pairs we have used for the simulation.
The measured SNcc-SNIa rate will therefore be multiplied by a factor
1.15 to take into account this effect.
5.3 The SNcc-SNIa relative rate
The corrections for the number of events shown in Table 2
give an increase of
11+5-9 SNIa candidates,
and a corresponding decrease in the number of SNcc candidates.
The corrected relative rate for z<0.4 is therefore
where the factor 1.15 takes into account redshift migration. The ratio is for z<0.4 corresponding to an expected mean redshift of 0.306 for a rate proportional to (1+z)2 and a mean of 0.313 for a rate proportional to (1+z)3.6. Our sample of 60 SNIa has a mean redshift of
The systematic error in
![]() includes those due to the corrections
from the previous section as well as three
additional systematic
uncertainties which we add in quadrature.
includes those due to the corrections
from the previous section as well as three
additional systematic
uncertainties which we add in quadrature.
The first additional systematic
concerns the uncertainty in the relative efficiencies for SNIa and
the fainter SNcc.
To avoid large uncertainties, we have used only events with
m570<24.1where the efficiency is high.
With this cut, there is only a 10% difference in the SNcc rate
calculated with the nominal efficiencies and that
calculated assuming a magnitude-independent efficiency.
We adopt 10% as the nominal systematic error from this source.
To check that
there is no significant uncorrected event loss near the magnitude cut,
we verified that the derived SNcc rate does not depend significantly
on the position of the magnitude cut.
For example, using
![]() ,
the number of events
SNcc candidates is reduced from
117 to 82.
After weighting, this is increased to
,
the number of events
SNcc candidates is reduced from
117 to 82.
After weighting, this is increased to
![]() consistent with the
consistent with the
![]() event found using
event found using
![]() .
(Most of the increase comes from the two events with
.
(Most of the increase comes from the two events with
![]() which are given greater weights
with
which are given greater weights
with
![]() .)
.)
The second systematic concerns the star-formation rate.
The corrected differential rate was calculated assuming
that the SNcc rate is proportional to
![]() with
with
![]() according to Hopkins & Beacom (2006).
These authors do not cite an uncertainty for
according to Hopkins & Beacom (2006).
These authors do not cite an uncertainty for ![]() but inspection
of the data indicates that
but inspection
of the data indicates that
![]() is reasonable.
This corresponds to a 10% systematic uncertainty in the SNcc rate.
is reasonable.
This corresponds to a 10% systematic uncertainty in the SNcc rate.
The final systematic concerns our requirement that a host galaxy be found and that a redshift be given in the Ilbert et al. (2006) catalog. This requirement could conceivably favor SNcc or SNIa. For spectroscopically identified supernovae with z<0.4, a host galaxy is generally found but a redshift may not be given in the catalog. For 41 spectroscopic SNIa with spectroscopic redshifts <0.4 that were found in the deferred search, only 4 have no host redshift while for the 36 spectroscopic SNcc there are only 3 with no host redshift. Thus, we see no difference in host-redshift measurement efficiency at the 5% level and we adopt this as the systematic uncertainty.
5.4 The SNcc rate
To derive a value of
![]() we adopt the value of
we adopt the value of
![]() measured by Neill et al. (2006) at z=0.5:
measured by Neill et al. (2006) at z=0.5:
![]() Our measurement of
Our measurement of
![]() is effectively
at z=0.3
and we adopt a SNIa rate at this redshift of
is effectively
at z=0.3
and we adopt a SNIa rate at this redshift of
![]() calculated assuming
calculated assuming
![]() .
This gives a SNcc rate
within 4.5 mag of normal SNIa of
.
This gives a SNcc rate
within 4.5 mag of normal SNIa of
we have added the statistical and systematic uncertainties of
With the determination of the total SNcc rate, we can give
an absolute differential rate per unit magnitude for SNcc.
It is shown as the right-hand scale in Fig. 12.
The rate is measured down to luminosities
![]() fainter than normal SNIa.
It should however be emphasized that
there are only two events with
fainter than normal SNIa.
It should however be emphasized that
there are only two events with
![]() .
One of them has spectroscopic confirmation
and the spectroscopic redshift, z=0.131, is in good
agreement with the host photometric redshift, z=0.119.
The other event has a host
spectroscopic redshift
.
One of them has spectroscopic confirmation
and the spectroscopic redshift, z=0.131, is in good
agreement with the host photometric redshift, z=0.119.
The other event has a host
spectroscopic redshift![]() z=0.0815in good agreement with the host photometric redshift used
here, z=0.095.
Thus, we have no indication that these two events are higher
luminosity events that have migrated from high redshift.
z=0.0815in good agreement with the host photometric redshift used
here, z=0.095.
Thus, we have no indication that these two events are higher
luminosity events that have migrated from high redshift.
To estimate a total rate for SNcc we need to estimate
the number of SNcc with
![]() either because they are intrinsically faint
(e.g. SN1987A,
either because they are intrinsically faint
(e.g. SN1987A,
![]() )
or
because of high host extinction.
SNLS obviously cannot say anything about intrinsically faint supernovae.
However,
by adopting a host galaxy extinction model, we can
estimate the number of SNcc that have intrinsic
luminosities within our range of sensitivity but that are
lost because of high host extinction.
We have used the results of
Hatano et al. (1998) who give (their Table 1 and Fig. 1)
the distribution of ABas a function of host inclination angle.
This can be converted to a distribution of absorption
at
)
or
because of high host extinction.
SNLS obviously cannot say anything about intrinsically faint supernovae.
However,
by adopting a host galaxy extinction model, we can
estimate the number of SNcc that have intrinsic
luminosities within our range of sensitivity but that are
lost because of high host extinction.
We have used the results of
Hatano et al. (1998) who give (their Table 1 and Fig. 1)
the distribution of ABas a function of host inclination angle.
This can be converted to a distribution of absorption
at
![]() and convoluted with the
pre-absorption distribution of M570.
For example, if we model the intrinsic SNcc
magnitude distribution
shown as the dashed line in Fig. 12,
then
the SNcc host extinction model of Hatano et al. (1998) predicts
the distribution shown by the solid line in the figure.
With this model,
15% of SNcc have
and convoluted with the
pre-absorption distribution of M570.
For example, if we model the intrinsic SNcc
magnitude distribution
shown as the dashed line in Fig. 12,
then
the SNcc host extinction model of Hatano et al. (1998) predicts
the distribution shown by the solid line in the figure.
With this model,
15% of SNcc have
![]() .
Our estimated total rate is then increased to
.
Our estimated total rate is then increased to
![]() .
In our model, most of the events with
.
In our model, most of the events with
![]() are highly absorbed so our estimate
should be considered a lower limit on the SNcc rate that
ignores supernovae that
are intrinsically fainter than
are highly absorbed so our estimate
should be considered a lower limit on the SNcc rate that
ignores supernovae that
are intrinsically fainter than
![]() .
.
6 Discussion
Figure 13 summarizes the published measurement
of the SNcc rate.
All data is consistent with a rate that increases with redshift
like the
![]() .
It should be emphasized that the previous measurements
use quite different detection and analysis procedures.
We therefore refrain from drawing any quantitative
conclusions about
the redshift dependence of the SNcc rate.
.
It should be emphasized that the previous measurements
use quite different detection and analysis procedures.
We therefore refrain from drawing any quantitative
conclusions about
the redshift dependence of the SNcc rate.
![\begin{figure}
\par\includegraphics[width=8.4cm,clip]{1847fg13.eps}
\end{figure}](/articles/aa/full_html/2009/21/aa11847-09/img142.png) |
Figure 13:
The measured rate of SNcc as a function of redshift.
The SNLS point includes a 15% correction for host absorption
as described in the text.
The error bars correspond to statistical and systematic
uncertainties added in quadrature.
The line is the best fit for rate
|
| Open with DEXTER | |
Our results will be improved in the future with the addition of two more years of SNLS data, and with the use of host spectroscopic redshifts that we are in the process of obtaining.
Acknowledgements
The SNLS collaboration gratefully acknowledges the assistance of Pierre Martin and the CFHT Queued Service Observations team. Canadian collaboration members acknowledge support from NSERC and CIAR; French collaboration members from CNRS/IN2P3, CNRS/INSU and CEA. SNLS relies on observations with MegaCam, a joint project of CFHT and CEA/DAPNIA, at the Canada-France-Hawaii Telescope (CFHT) which is operated by the National Research Council (NRC) of Canada, the Institut National des Science de l'Univers of the Centre National de la Recherche Scientifique (CNRS) of France, and the University of Hawaii. This work is based in part on data products produced at the Canadian Astronomy Data Centre as part of the Canada-France-Hawaii Telescope Legacy Survey, a collaborative project of the National Research Council of Canada and the French Centre national de la recherche scientifique.
References
- Astier, P., Guy, J., Regnault, N., et al. 2006, A&A, 447, 31 [NASA ADS] [CrossRef] [EDP Sciences] (In the text)
- Bazin, G. 2008, Ph.D. Thesis
- Bazin, G., et al. 2009, in prep.
- Bertin, E., & Arnouts, S. 1996, A&AS, 117, 39 [NASA ADS] [CrossRef] [EDP Sciences] (In the text)
- Botticella, M. T., Riello, M., Cappellaro, E., et al. 2008, A&A, 479, 49 [NASA ADS] [CrossRef] [EDP Sciences] (In the text)
- Cappellaro, E., Evans, R., & Turatto, M. 1999, A&A, 351, 459 [NASA ADS] (In the text)
- Cappellaro, E., Riello, M., Altavilla, G., et al. 2005, A&A, 430, 83 [NASA ADS] [CrossRef] [EDP Sciences] (In the text)
- Dahlen, T., Strolger, L.-G., Riess, A. G., et al. 2004, ApJ, 613, 189 [NASA ADS] [CrossRef] (In the text)
- Guy, J., Astier, P., Baumont, S., et al. 2007, A&A, 466, 11 [NASA ADS] [CrossRef] [EDP Sciences] (In the text)
- Hatano, K., Branch, D., & Deaton, J. 1998, ApJ, 502, 177 [NASA ADS] [CrossRef] (In the text)
- Hopkins, A. M., & Beacom, J. F. 2006, ApJ, 651, 142 [NASA ADS] [CrossRef] (In the text)
- Ilbert, O., Arnouts, S., McCracken, H. J., et al. 2006, A&A, 457, 841I [NASA ADS] [CrossRef] (In the text)
- Li, W., Filippenko, A., Treffers, V., Richard, R., et al. 2001, ApJ, 546, 734 [NASA ADS] [CrossRef] (In the text)
- Neill, J. D., Sullivan, M., Balam, D., et al. 2006, AJ, 132, 1126 [NASA ADS] [CrossRef] (In the text)
- Fukugita, M., Ichikawa, T., Gunn J., et al. 1996, AJ, 111, 1748 [NASA ADS] [CrossRef] (In the text)
- Pritchet, C., Howell, A., & Sullivan, M. 2008, ApJ, 683L, 25 [NASA ADS] [CrossRef] (In the text)
- Richardson, D., Branch, D., Casebeer, D., et al. 2002, AJ, 123, 745 [NASA ADS] [CrossRef] (In the text)
- Sullivan, M., Howell, D. A., Perrett, K., et al. 2006, AJ, 131, 960 [NASA ADS] [CrossRef] (In the text)
Footnotes
All Tables
Table 1: The numbers of events for each spectroscopic and photometric classification.
Table 2: Corrections applied to the 60 SNIa candidates and 287 (weighted) SNcc candidates.
All Figures
| |
Figure 1:
The |
| Open with DEXTER | |
| In the text | |
| |
Figure 2:
The |
| Open with DEXTER | |
| In the text | |
| |
Figure 3:
The |
| Open with DEXTER | |
| In the text | |
| |
Figure 4: SNLS spectroscopic redshifts vs. host photometric redshifts taken from the catalog of Ilbert et al. (2006). Spectroscopically identified supernovae and photometrically identified SNIa are marked by the signs defined at the top of the figure. The crosses are supernovae whose type is not determined spectroscopically or photometrically. |
| Open with DEXTER | |
| In the text | |
| |
Figure 5:
Pre-selection efficiency as a function of |
| Open with DEXTER | |
| In the text | |
| |
Figure 6:
The peak |
| Open with DEXTER | |
| In the text | |
| |
Figure 7:
The pseudo-absolute magnitude
|
| Open with DEXTER | |
| In the text | |
| |
Figure 8:
Host morphological type as a function of
|
| Open with DEXTER | |
| In the text | |
| |
Figure 9:
Fall time
|
| Open with DEXTER | |
| In the text | |
| |
Figure 10:
The color-magnitude diagram. Only
the subset of
events with points in |
| Open with DEXTER | |
| In the text | |
| |
Figure 11:
The distribution of
|
| Open with DEXTER | |
| In the text | |
| |
Figure 12:
The differential SNcc rate.
The data points are those of Fig. 11
with the SNIa subtracted
(statistical errors only).
The left-hand scale is the number of events and
the right-hand scale is the absolute differential rate derived
from the total rate in Sect. 5.
The dashed curve shows the intrinsic distribution
for a toy model (of no physical motivation) with rate
|
| Open with DEXTER | |
| In the text | |
| |
Figure 13:
The measured rate of SNcc as a function of redshift.
The SNLS point includes a 15% correction for host absorption
as described in the text.
The error bars correspond to statistical and systematic
uncertainties added in quadrature.
The line is the best fit for rate
|
| Open with DEXTER | |
| In the text | |
Copyright ESO 2009
Current usage metrics show cumulative count of Article Views (full-text article views including HTML views, PDF and ePub downloads, according to the available data) and Abstracts Views on Vision4Press platform.
Data correspond to usage on the plateform after 2015. The current usage metrics is available 48-96 hours after online publication and is updated daily on week days.
Initial download of the metrics may take a while.