| Issue |
A&A
Volume 499, Number 3, June I 2009
|
|
|---|---|---|
| Page(s) | 789 - 797 | |
| Section | Interstellar and circumstellar matter | |
| DOI | https://doi.org/10.1051/0004-6361/200811474 | |
| Published online | 08 April 2009 | |
Discovery of optical emission from the supernova remnant G 32.8-0.1 (Kes 78)
P. Boumis1 - E. M. Xilouris1 - J. Alikakos1,2 - P. E. Christopoulou2 - F. Mavromatakis3 - A. C. Katsiyannis1 - C. D. Goudis1,2
1 - Institute of Astronomy & Astrophysics, National
Observatory of Athens, I. Metaxa & V. Paulou, P. Penteli, 15236
Athens, Greece
2 - Astronomical Laboratory, Department of Physics, University of
Patras, 26500 Rio-Patras, Greece
3 - Technological Education Institute of Crete, Department of
Sciences, PO Box 1939, GR-710 04 Heraklion, Crete, Greece
Received 4 December 2008 / Accepted 18 March 2009
Abstract
Deep optical CCD images of the supernova remnant G 32.8-0.1 were obtained where filamentary and diffuse emission was
discovered. The images were acquired in the emission lines of H![]() N II] and [S II]. Filamentary and diffuse structures are detected in most
areas of the remnant, while no significant [O III] emission is
present. The flux-calibrated images suggest that the optical emission
originates from shock-heated gas since the [S II]/H
N II] and [S II]. Filamentary and diffuse structures are detected in most
areas of the remnant, while no significant [O III] emission is
present. The flux-calibrated images suggest that the optical emission
originates from shock-heated gas since the [S II]/H![]() ratio is
greater than 1.2. The Spitzer images at 8
ratio is
greater than 1.2. The Spitzer images at 8 ![]() m and 24
m and 24 ![]() m show a
few filamentary structures to be correlated with the optical
filaments, while the radio emission at 1.4 GHz in the same area is
found to be very well correlated with the brightest optical
filaments. The results from deep long-slit spectra also
support the origin of the emission being from shock-heated gas
([S II]/H
m show a
few filamentary structures to be correlated with the optical
filaments, while the radio emission at 1.4 GHz in the same area is
found to be very well correlated with the brightest optical
filaments. The results from deep long-slit spectra also
support the origin of the emission being from shock-heated gas
([S II]/H![]() > 1.5). The absence of [O III] emission indicates slow
shock velocities into the interstellar ``clouds'' (
> 1.5). The absence of [O III] emission indicates slow
shock velocities into the interstellar ``clouds'' (![]() 100 km s-1),
while the [S II
100 km s-1),
while the [S II
![]() ratio indicates electron densities up to
ratio indicates electron densities up to
![]() 200 cm-3. The H
200 cm-3. The H![]() emission is measured to lie between 1.8
to 4.6
emission is measured to lie between 1.8
to 4.6 ![]() 10-17 erg s-1 cm-2 arcsec-2, while from VGPS H I images the distance to
the SNR is estimated to be between 6 to 8.5 kpc.
10-17 erg s-1 cm-2 arcsec-2, while from VGPS H I images the distance to
the SNR is estimated to be between 6 to 8.5 kpc.
Key words: ISM: general - ISM: supernova remnants - ISM: individual objects: 32.8-0.1 (Kes 78)
1 Introduction
Supernova remnants (SNRs) are important components of a galaxy since during supernova ejecta they release huge amounts of energy and in subsequent phases heavy elements are mixed into the interstellar medium (ISM). Hence, they play an important role in our understanding of the supernova mechanism, the interstellar medium (ISM) and their interaction. The majority of SNRs have been discovered in radio wavelengths from their non-thermal synchrotron emission and only a few of them have been detected in soft X-rays and in the optical (Green 2006). Optical observations (i.e. Boumis et al. 2005, 2008) offer an important tool for the study of the interaction of the shock wave with dense concentrations of gas found in the ISM.
The Galactic SNR G 32.8-0.1 (Kes78) was discovered in a 408 MHz radio
continuum survey by Kesteven (1968), where it appears as a
small source (20![]()
![]() 10
10![]() in diameter). Several
radio observations have been perfromed at 30.9, 330, 408, 430, 2700,
5000, 10 600 MHz by Kassim (1989), Kassim (1992),
Caswell et al. (1975), Dickel & Denoyer (1975),
Velusamu & Kundu (1974), Caswell et al. (1975) and
Beckel & Kundu (1975) showing its non-thermal emission,
while a spectral index between 0.5 and 0.78 was
established. Observations of the hydroxyl molecule (OH) at 1720 MHz
(Koralesky et al. 1998) showed that the emission results from
masers that are shock-excited due to the interaction of the SNR and
an adjacent molecular cloud. They found a magnetic field of
in diameter). Several
radio observations have been perfromed at 30.9, 330, 408, 430, 2700,
5000, 10 600 MHz by Kassim (1989), Kassim (1992),
Caswell et al. (1975), Dickel & Denoyer (1975),
Velusamu & Kundu (1974), Caswell et al. (1975) and
Beckel & Kundu (1975) showing its non-thermal emission,
while a spectral index between 0.5 and 0.78 was
established. Observations of the hydroxyl molecule (OH) at 1720 MHz
(Koralesky et al. 1998) showed that the emission results from
masers that are shock-excited due to the interaction of the SNR and
an adjacent molecular cloud. They found a magnetic field of
![]() mG and determined a kinematic distance to the SNR of
7.1 kpc. Allakhverdiyev et al. (1983) and Case & Bhattacharya
(1998) using the radio surface brightness - diameter
relationship (
mG and determined a kinematic distance to the SNR of
7.1 kpc. Allakhverdiyev et al. (1983) and Case & Bhattacharya
(1998) using the radio surface brightness - diameter
relationship (![]() -D) calculated a distance of 7.1 kpc and 6.3 kpc respectively. Neutral hydrogen observations at 21 cm (Gosachinskii
& Khersonskii 1985) resulted in a distance of 9 kpc, an age
of
-D) calculated a distance of 7.1 kpc and 6.3 kpc respectively. Neutral hydrogen observations at 21 cm (Gosachinskii
& Khersonskii 1985) resulted in a distance of 9 kpc, an age
of
![]() yr and an explosion energy of
yr and an explosion energy of
![]() erg for the SNR. In radio surveys of the surrounding region
at 1.4 GHz (Manchester et al. 1985), no pulsar of period
erg for the SNR. In radio surveys of the surrounding region
at 1.4 GHz (Manchester et al. 1985), no pulsar of period
![]() 10 ms was found to be associated with G 32.8-0.1 up to
10 ms was found to be associated with G 32.8-0.1 up to ![]() 1 mJy.
IRAS observations (Saken et al. 1992) showed a barely resolved
IR shell to be coincident with the SNR's radio emission. The Spitzer
Space Telescope observed the region of interest as part of a large
survey to map a large part of the Galactic plane. In a recent study
(Reach et al. 2006), the radio emission of Kes 78 was compared
with the infrared emission of this part of the sky and the comparison
was described as ``confused'' since no clear correlation was evident.
1 mJy.
IRAS observations (Saken et al. 1992) showed a barely resolved
IR shell to be coincident with the SNR's radio emission. The Spitzer
Space Telescope observed the region of interest as part of a large
survey to map a large part of the Galactic plane. In a recent study
(Reach et al. 2006), the radio emission of Kes 78 was compared
with the infrared emission of this part of the sky and the comparison
was described as ``confused'' since no clear correlation was evident.
In this paper we report the optical detection of G 32.8-0.1 and present flux calibrated images in major optical emission lines. Deep long slit spectroscopy was also performed in a number of selected areas of interest. In Sect. 2, information about the observations and data reduction is given, while the results of the imaging and spectroscopic observations are presented in Sect. 3 and 4. In Sect. 5, we compare our data with observations at other wavelengths, in Sect. 6 we discuss the optical properties of the SNR, and in Sect. 7 we summarize the results of this work.
Table 1: Imaging and spectral log.
![\begin{figure}
\par\includegraphics[width=15.6cm,clip]{11474fig1.eps}
\end{figure}](/articles/aa/full_html/2009/21/aa11474-08/img32.png) |
Figure 1:
The G 32.8-0.1 in a) the H |
| Open with DEXTER | |
2 Observations
A summary and log of our observations are given in Table 1. In the sections below, we describe these observations in detail.
2.1 Imaging
2.1.1 Wide-field imagery
The wide-field imagery of G 32.8-0.1 was obtained with the
0.3 m Schmidt-Cassegrain (f/3.2) telescope at Skinakas Observatory, Crete,
Greece on June 7-9, 11 and August 26, 2005. A
![]() Thomson CCD was used which has a pixel size of 19
Thomson CCD was used which has a pixel size of 19 ![]() m resulting in
a 70
m resulting in
a 70![]()
![]() 70
70![]() field of view and an image scale of 4
field of view and an image scale of 4
![]() per pixel. The area of the remnant was observed with the
H
per pixel. The area of the remnant was observed with the
H![]() N II], [S II], and [O III] filters. The exposure time was
set to 2400 s for each exposure and 180 s for the continuum red
and blue filters. The corresponding continuum images were subtracted
from those containing the emission lines to eliminate the confusing
star field (see Boumis et al. 2002, for details of this
technique). The continuum-subtracted images of the H
N II], [S II], and [O III] filters. The exposure time was
set to 2400 s for each exposure and 180 s for the continuum red
and blue filters. The corresponding continuum images were subtracted
from those containing the emission lines to eliminate the confusing
star field (see Boumis et al. 2002, for details of this
technique). The continuum-subtracted images of the H![]() N II] and
[S II] emission lines are shown in Figs. 1a and 1b, respectively.
N II] and
[S II] emission lines are shown in Figs. 1a and 1b, respectively.
The IRAF and MIDAS packages were used for the data reduction. All
frames were bias-subtracted and flatfield-corrected using a series
of well exposed twilight frames. A smoothing of a
![]() pixels median box was applied to all images while the stars were
removed by appropriately scaling and subtracting the continuum images.
The spectrophotometric standards stars HR 5501, HR 7596, HR 7950, HR 8634,
and HR9087 (Hamuy et al. 1992) were used for the absolute flux
calibration. The astrometric solution for all data frames was
calculated using the Hubble Space Telescope (HST) Guide Star Catalogue
(Lasker et al. 1999). All the equatorial coordinates quoted in
this work refer to epoch 2000.
pixels median box was applied to all images while the stars were
removed by appropriately scaling and subtracting the continuum images.
The spectrophotometric standards stars HR 5501, HR 7596, HR 7950, HR 8634,
and HR9087 (Hamuy et al. 1992) were used for the absolute flux
calibration. The astrometric solution for all data frames was
calculated using the Hubble Space Telescope (HST) Guide Star Catalogue
(Lasker et al. 1999). All the equatorial coordinates quoted in
this work refer to epoch 2000.
![\begin{figure}
\par\includegraphics[width=13cm,clip]{11474fig2.eps}
\end{figure}](/articles/aa/full_html/2009/21/aa11474-08/img35.png) |
Figure 2:
The continuum-subtracted mosaic of G 32.8-0.1 taken with
the 1.3-m telescope in H |
| Open with DEXTER | |
2.1.2 High-resolution imagery
Optical images at higher angular resolution of G 32.8-0.1 were
obtained with the 1.3 m (f/7.7) Ritchey- Cretien telescope at
Skinakas Observatory on July 4-7 and 8-10, 2007, using the
H![]() +[N II] interference filter. The detector was a
+[N II] interference filter. The detector was a
![]() SITe CCD with a field of view of
SITe CCD with a field of view of
![]() arcmin2 and an image scale of 0.5
arcmin2 and an image scale of 0.5
![]() per pixel. Six
exposures were taken through the H
per pixel. Six
exposures were taken through the H![]() + [N II] filter, each
of 2400 s and six corresponding exposures in the continuum, each of
180 s. After the continuum subtraction, all fields were projected to a
common origin on the sky and were subsequently combined to create the
final mosaic in H
+ [N II] filter, each
of 2400 s and six corresponding exposures in the continuum, each of
180 s. After the continuum subtraction, all fields were projected to a
common origin on the sky and were subsequently combined to create the
final mosaic in H![]() N II]. Note that the upper right field was
observed close to the morning twilight, significantly reducing its
signal-to-noise in comparison with the surrounding fields. During
the observations, the ``seeing'' varied between 0.8
N II]. Note that the upper right field was
observed close to the morning twilight, significantly reducing its
signal-to-noise in comparison with the surrounding fields. During
the observations, the ``seeing'' varied between 0.8
![]() and
1.5
and
1.5
![]() ,
while the full width at half maximum (FWHM) of the star
images was between 1.1
,
while the full width at half maximum (FWHM) of the star
images was between 1.1
![]() and 2.1
and 2.1
![]() .
The
continuum-subtracted mosaic is shown in Fig. 2.
.
The
continuum-subtracted mosaic is shown in Fig. 2.
2.2 Spectroscopy
Low dispersion long-slit spectra were obtained with the 1.3 m telescope at Skinakas Observatory on June 4 and 5 and September 7, 2005. The exposure time was 3900 s. The 1300 line mm-1 grating was used with theTable 2: Typically measured fluxes over the brightest filaments.
Table 3: Relative line fluxes.
3 The H + [N II],
[S II] and [O II] emission line images
+ [N II],
[S II] and [O II] emission line images
Optical emission was detected for the first time from this
remnant. The most interesting regions lie in the south, east and
north, where bright filamentary and faint diffuse structures are
present (between
![]() 18
18![]() 51
51![]() 35
35![]() ,
,
![]()
![]() 17
17![]() 30
30
![]() ;
;
![]()
![]() 51
51![]() 51
51![]() ,
,
![]()
![]() 08
08![]() 40
40
![]() and
and
![]()
![]() 51
51![]() 41
41![]() ,
,
![]()
![]() 01
01![]() 20
20
![]() ), which all are very well
correlated with the radio emission. The bright H
), which all are very well
correlated with the radio emission. The bright H![]() N II] filaments cover
most of the emission found in radio wavelengths and extend for
N II] filaments cover
most of the emission found in radio wavelengths and extend for
![]() 16
16![]() from south to north through the east part of the
SNR. In contrast to the above results, diffuse emission was mainly
detected in the west with only one bright filament between
from south to north through the east part of the
SNR. In contrast to the above results, diffuse emission was mainly
detected in the west with only one bright filament between
![]()
![]() 51
51![]() 09
09![]() ,
,
![]()
![]() 09
09![]() 45
45
![]() and
and
![]()
![]() 51
51![]() 14
14![]() ,
,
![]()
![]() 10
10![]() 48
48
![]() (
(![]() 1
1![]() long). No significant
emission was found in the image of the [O III] medium ionization line
and therefore it is not shown here. The morphology of the [S II] image
is generally similar to, though not as bright as, that of the H
long). No significant
emission was found in the image of the [O III] medium ionization line
and therefore it is not shown here. The morphology of the [S II] image
is generally similar to, though not as bright as, that of the H![]() N II] image. We detected [S II] emission where most of the H
N II] image. We detected [S II] emission where most of the H![]() N II] emission
was found with filamentary bright structures in the south and east
areas, while diffuse emission characterizes the rest of the remnant's
emission.
N II] emission
was found with filamentary bright structures in the south and east
areas, while diffuse emission characterizes the rest of the remnant's
emission.
The flux calibrated images of H![]() N II] and [S II] provide a
first indication of the nature of the observed emission (see
Table 2). A study of these images shows that all parts of
the optical remnant originate from shock heated gas since we estimate
ratios [S II]/H
N II] and [S II] provide a
first indication of the nature of the observed emission (see
Table 2). A study of these images shows that all parts of
the optical remnant originate from shock heated gas since we estimate
ratios [S II]/H![]()
![]() 1.2 consistent with the
spectral measurements. In particular, the eastern and southern areas
show [S II]/H
1.2 consistent with the
spectral measurements. In particular, the eastern and southern areas
show [S II]/H![]()
![]() 1.5 and 1.7 respectively, while the northern area
shows [S II]/H
1.5 and 1.7 respectively, while the northern area
shows [S II]/H![]()
![]() 1.3. Only the western area does not show strong
[S II] emission, hence only upper limits are given.
1.3. Only the western area does not show strong
[S II] emission, hence only upper limits are given.
4 The optical spectra from G 32.8-0.1
Deep low-resolution spectra were taken on the brightest optical filaments in the eastern and southern parts of the SNR (their exact position are given in Table 1). In Table 3, we present the relative line fluxes taken from two different apertures along the slit. In particular, apertures I and II have an offset (see Table 1) north or south of the slit center because they are free of field stars and at the same time they include sufficient line emission to allow for an accurate determination of the line fluxes. The background extraction aperture was taken towards the northern or the southern ends of the slit depending on the filament's position within the slit.
The measured line fluxes indicate emission from shock-heated gas,
since [S II]/H![]() > 1.5. Furthermore, the [N II]/H
> 1.5. Furthermore, the [N II]/H![]() ratio, which takes
values between 1.3 and 2.2 (see Table 3), falls well inside
the range expected for an SNR (Fesen et al. 1985). The
signal-to-noise ratios do not include calibration errors, which are
less than 10 percent. Typical spectra from the east (E1) and south
(SII) are shown in Fig. 3. The absolute H
ratio, which takes
values between 1.3 and 2.2 (see Table 3), falls well inside
the range expected for an SNR (Fesen et al. 1985). The
signal-to-noise ratios do not include calibration errors, which are
less than 10 percent. Typical spectra from the east (E1) and south
(SII) are shown in Fig. 3. The absolute H![]() flux covers a
range of values from 1.8 to 4.6
flux covers a
range of values from 1.8 to 4.6 ![]() 10-17 erg s-1 cm-2 arcsec-2. The [S II
10-17 erg s-1 cm-2 arcsec-2. The [S II
![]() ratio
that was measured between 1.3 and 1.5 indicates electron densities
below 150 cm-3 (Osterbrock & Ferland 2006). However,
taking into account the statistical errors on the sulfur lines, it is
found that electron densities up to 200 cm-3 are allowed (Shaw &
Dufour 1995). [O III] emission was not detected, while the very
weak H
ratio
that was measured between 1.3 and 1.5 indicates electron densities
below 150 cm-3 (Osterbrock & Ferland 2006). However,
taking into account the statistical errors on the sulfur lines, it is
found that electron densities up to 200 cm-3 are allowed (Shaw &
Dufour 1995). [O III] emission was not detected, while the very
weak H![]() emission and the absence of the [O III] line suggest
significant interstellar attenuation of the optical emission. The
absence of [O III] emission can also be explained by slow shocks
propagating into the interstellar clouds (
emission and the absence of the [O III] line suggest
significant interstellar attenuation of the optical emission. The
absence of [O III] emission can also be explained by slow shocks
propagating into the interstellar clouds (![]() 100 km s-1; Hartigan
et al. 1987) since higher velocity shocks should produce
detectable [O III] emission.
100 km s-1; Hartigan
et al. 1987) since higher velocity shocks should produce
detectable [O III] emission.
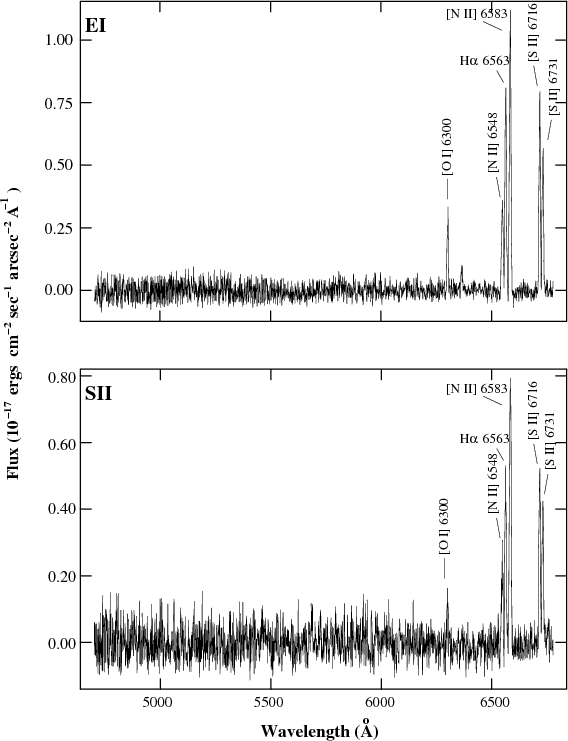 |
Figure 3: Long-slit spectra from the east (EI) and south (SII) areas of G 32.8-0.1. |
| Open with DEXTER | |
![\begin{figure}
\par\includegraphics[width=16cm,clip]{11474fig4.eps}
\end{figure}](/articles/aa/full_html/2009/21/aa11474-08/img49.png) |
Figure 4:
The correlation between the H |
| Open with DEXTER | |
![\begin{figure}
\par\includegraphics[width=16cm,clip]{11474fig5.eps}
\end{figure}](/articles/aa/full_html/2009/21/aa11474-08/img54.png) |
Figure 5:
The comparison between the H |
| Open with DEXTER | |
![\begin{figure}
\par\includegraphics[width=17cm,clip]{11474fig6.eps}
\end{figure}](/articles/aa/full_html/2009/21/aa11474-08/img55.png) |
Figure 6:
VGPS images of the 21 cm line correlated with the radio
emission of G 32.8-0.1. The LSR velocities are indicated on
the top left of each panel. The VGPS images scale linearly from 10 to
130 K
for panels a)- c) and from 0 to 120 K for panels d)- f).
The 1.4 GHz radio contours (blue line) scale linearly from
|
| Open with DEXTER | |
5 Observations at other wavelengths
The optical emission matches the radio emission of G 32.8-0.1 very well at 1.4 GHz, suggesting their association (Fig. 4). The observed filaments are located close to the outer edge of the radio contours but the low resolution of the radio images does not allow us to determine the relative position of the filament with respect to the shock front.
We investigate possible correlations of the optical
emission with infrared emission. The region of interest has been observed with the Spitzer Space
Telescope in both
![]() and
and
![]() bands as part of the large
surveys GLIMPSE and MIPSGAL (Benjamin et al. 2003; and Carey
et al. 2005, respectively) along the Galactic plane. The superb
resolution of Spitzer in these wavelengths allowed us to perform a
very careful comparison between optical and infrared emission and look
for possible correlations. In Fig. 5, we present a composite
image of the H
bands as part of the large
surveys GLIMPSE and MIPSGAL (Benjamin et al. 2003; and Carey
et al. 2005, respectively) along the Galactic plane. The superb
resolution of Spitzer in these wavelengths allowed us to perform a
very careful comparison between optical and infrared emission and look
for possible correlations. In Fig. 5, we present a composite
image of the H![]() optical emission (red), the
optical emission (red), the
![]() emission
(green) and the
emission
(green) and the
![]() emission (blue). It is evident that
although there is quite a lot of structure and confusion in the
background due to neighboring emission regions (as already pointed out
by Reach et al. 2006), there are regions (e.g. in the North,
North-West and South) where the optical emission overlaps with
infrared (mostly with the
emission (blue). It is evident that
although there is quite a lot of structure and confusion in the
background due to neighboring emission regions (as already pointed out
by Reach et al. 2006), there are regions (e.g. in the North,
North-West and South) where the optical emission overlaps with
infrared (mostly with the
![]() )
emission. We also argue that the
discontinuity of the shape of the remnant in the North-West part may
be due to heavy obscuration due to dust clouds seen in the
infrared.
)
emission. We also argue that the
discontinuity of the shape of the remnant in the North-West part may
be due to heavy obscuration due to dust clouds seen in the
infrared.
New H I kinematics data are available from the VLA Galactic Plane Survey (VGPS; Stil et al. 2006). The distribution of the atomic gas was examined in detail by searching radial velocities in the range from -113 to 165 km s-1 and looking for signs of interaction between the expanding shock fronts of the SNR and the surrounding medium. In Fig. 6, we present velocities from six different channels and radio contours on top of the H I emission. The H I images in the range of 10 to 25 km s-1 (Figs. 6a-c) are interesting because intense H I emission is present almost all over the SNR's radio boundaries. If the H I emission is due to the SNR's expanding envelope then using the Galactic rotation curve model and recent measurements of its parameters (R0=7.6 kpc, Eisenhauer et al. 2005; V0=220 km s-1 Feast & Whitelock 1997) we can estimate distances in the range of 0.8 to 2 kpc. At velocities greater than 80 km s-1 (Fig. 6d-e) and especially at 113 km s-1 (Fig. 6f) features all around the remnant show signs of interaction of the SNR with the H I emission. In that case, the distances are estimated to be in the range of 6 to 8.5 kpc.
ROSAT All-sky survey data were also examined, but no significant X-ray emission was detected.
6 Discussion
The supernova remnant G 32.8-0.1 appears as an almost complete shell in the radio band; its optical emission marginally correlates with the infrared emission and no X-ray emission has been detected so far. The absence of soft X-ray emission may indicate a low shock temperature and/or a low density of the local interstellar medium. The [O III] flux production depends mainly on the shock velocity and the ionization state of the preshocked gas. Therefore, as mentioned in Sect. 3.2, the absence of [O III] emission may be explained by slow shocks propagating into the ISM. The H
The interstellar extinction c cannot be accurately determined due to
the low significance of the H![]() flux. However, using the H
flux. However, using the H![]() upper limits (see Table 3), the lower limits on c(H
upper limits (see Table 3), the lower limits on c(H![]() )
are calculated as 2.2 and 2.7 or
)
are calculated as 2.2 and 2.7 or ![]() of 4.51 and 5.53 for the
areas in the South and the East, respectively. Both limits derived
from our spectra suggest an area of high interstellar extinction as
is expected for an object being at the galactic plane.
of 4.51 and 5.53 for the
areas in the South and the East, respectively. Both limits derived
from our spectra suggest an area of high interstellar extinction as
is expected for an object being at the galactic plane.
Estimated values of
![]() cm-2 and
cm-2 and
![]() cm-2 are given by Dickey &
Lockman (1990) and Kalberla et al. (2005)
respectively, for the column density in the direction of G
32.8-0.1. Using the relation of Ryter et al. (1975), we
obtain an
cm-2 are given by Dickey &
Lockman (1990) and Kalberla et al. (2005)
respectively, for the column density in the direction of G
32.8-0.1. Using the relation of Ryter et al. (1975), we
obtain an
![]() and
and
![]() for the c limits calculated from our
spectra, respectively. Both values are consistent with the estimated
galactic
for the c limits calculated from our
spectra, respectively. Both values are consistent with the estimated
galactic ![]() considering the uncertainties involved.
considering the uncertainties involved.
We have also determined the electron density measuring the
density-sensitive line ratio of [S II
![]() .
The measured densities lie
below 200 cm-3. Assuming that the temperature is close to 104 K,
it is possible to estimate basic SNR parameters. The remnant under
investigation has not been studied in detail hence the current stage
of its evolution is unknown. Assuming that the remnant is still in the
adiabatic phase of its evolution the preshock cloud density
.
The measured densities lie
below 200 cm-3. Assuming that the temperature is close to 104 K,
it is possible to estimate basic SNR parameters. The remnant under
investigation has not been studied in detail hence the current stage
of its evolution is unknown. Assuming that the remnant is still in the
adiabatic phase of its evolution the preshock cloud density ![]() can be measured by using the relationship (Dopita 1979)
can be measured by using the relationship (Dopita 1979)
![\begin{displaymath}{n_{\rm [SII]} \simeq\ 45\ n_{\rm c} V_{\rm s}^2}~{\rm cm^{-3}},
\end{displaymath}](/articles/aa/full_html/2009/21/aa11474-08/img64.png) |
(1) |
where
 |
(2) |
The factor
Since there are no other measurements of the interstellar density
n0, values of 0.1 and 1.0 will be examined. Following the result
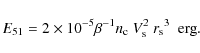
of Eq. (2) and assuming the value of 0.53 (Gosachinskii & Khersonskii
1985) for the supernova explosion energy (E51), we find that the
remnant may lie at a distance greater than 7.9 kpc. Then, the higher
interstellar density of ![]() 1 cm-3 suggests that the column
density is greater than
1 cm-3 suggests that the column
density is greater than
![]() ,
while for
,
while for
![]() it becomes greater than
it becomes greater than
![]() .
Combining the previous results and assuming
that the column density is found in the range of
.
Combining the previous results and assuming
that the column density is found in the range of
![]() ,
then the higher interstellar density seems to
be more probable. The observed H I morphology provides clear
evidence of the interaction of the SNR with the surrounding
ISM. However, in all cases, the actual distance depends also on the
adopted Galactic rotation curve even in the case where a correlation
is well established. Therefore, the values found is Sect. 5 may be
slightly over (or under) estimated, since some contribution of H
I that is not associated with the SNR may be included. The kinematic
distances in the second case are in aggrement with previous estimates
of the distance to the SNR, based on several methods summarized in
Sect. 1. Thus, a distance to the SNR between 6 to 8.5 kpc might be
more plausible. However, more observations are needed
(e.g. kinematic) in order to confidently determine the current stage
of evolution of G 32.8-0.1.
,
then the higher interstellar density seems to
be more probable. The observed H I morphology provides clear
evidence of the interaction of the SNR with the surrounding
ISM. However, in all cases, the actual distance depends also on the
adopted Galactic rotation curve even in the case where a correlation
is well established. Therefore, the values found is Sect. 5 may be
slightly over (or under) estimated, since some contribution of H
I that is not associated with the SNR may be included. The kinematic
distances in the second case are in aggrement with previous estimates
of the distance to the SNR, based on several methods summarized in
Sect. 1. Thus, a distance to the SNR between 6 to 8.5 kpc might be
more plausible. However, more observations are needed
(e.g. kinematic) in order to confidently determine the current stage
of evolution of G 32.8-0.1.
7 Conclusions
Optical emission from the supernova remnant G 32.8-0.1 was detected for the first time with both filamentary and diffuse structure present. The bright optical filaments correlate very well with the remnant's radio emission at 1.4 GHz suggesting their association, while correlation evidences is also shown with the Spitzer Space Telescope mostly at 8
Acknowledgements
The authors would like to thank John Meaburn and Jeroen Stil for their helpful discussions oncalculation. J.A. acknowledges funding by the European Union and the Greek Ministry of Development in the framework of the programme ``Promotion of Excellence in Research Institutes (2nd Part)''. Skinakas Observatory is a collaborative project of the University of Crete, the Foundation for Research and Technology-Hellas and the Max-Planck-Institut für Extraterrestrische Physik. The National Radio Astronomy Observatory is a facility of the National Science Foundation operated under cooperative agreement by Associated Universities, Inc.
References
- Allakhverdiyev, A. O., Guseinov, O. Kh., Kasumov, F. K., & Yusifov, I. M. 1983, Ap&SS, 97, 287 [NASA ADS] [CrossRef] (In the text)
- Becker, R. H., & Kundu, M. R. 1975, AJ, 80, 679 [NASA ADS] [CrossRef] (In the text)
- Benjamin, R. A., Churchwell, E., Babler, B. L., et al. 2003, PASP, 115, 953 [NASA ADS] [CrossRef] (In the text)
- Boumis, P., Mavromatakis, F., Palaiologou, E. V., & Becker, W. 2002, A&A, 396, 225 [NASA ADS] [CrossRef] [EDP Sciences] (In the text)
- Boumis, P., Mavromatakis, F., Xilouris, E. M., et al. 2005, A&A, 443, 175 [NASA ADS] [CrossRef] [EDP Sciences] (In the text)
- Boumis, P., Alikakos, J., Christopoulou, P. E., et al. 2008, A&A, 481, 705 [NASA ADS] [CrossRef] [EDP Sciences] (In the text)
- Carey, S. J., et al., 2005, A&AS, 207, 63.33 (In the text)
- Case, G. L., & Bhattacharya, D. 1998, ApJ, 504, 761 [NASA ADS] [CrossRef] (In the text)
- Caswell, J. L., Clark, D. H., & Crawford, D. F., 1975, AuJPA, 39 (In the text)
- Dickel, J. R., & DeNoyer, L. K. 1975, AJ, 80, 437 [NASA ADS] [CrossRef] (In the text)
- Dickey, J. M., & Lockman, F. J. 1990, ARAA, 28, 215 [NASA ADS] [CrossRef] (In the text)
- Dopita, M. A. 1979, ApJS, 40, 455 [NASA ADS] [CrossRef] (In the text)
- Eisenhauer, F., Genzel, R., Alexander, T., et al. 2005, ApJ, 628, 246 [NASA ADS] [CrossRef] (In the text)
- Feast, M., & Whitelock, P. 1997, MNRAS, 291, 683 [NASA ADS] (In the text)
- Fesen, R. A., Blair, W. P., & Kirshner, R. P. 1985, ApJ, 292, 29 [NASA ADS] [CrossRef] (In the text)
- Gosachinskij, I. V., & Khersonskij, V. K. 1985, Ap&SS, 108, 303 [NASA ADS] [CrossRef] (In the text)
- Green, D. A. 2006, A Catalog of Galactic Supernova Remnants (2006 April version), Mullard Radio Astronomy Observatory Cambridge (In the text)
- Hamuy, M., Walker, A. R., Suntzeff, N. B., et al. 1992, PASP, 104, 533 [NASA ADS] [CrossRef] (In the text)
- Hartigan, P., Raymond, J., & Hartmann, L. 1987, ApJ, 316, 323 [NASA ADS] [CrossRef] (In the text)
- Kalberla, P. M. W., Burton, W. B., Hartmann, D., et al. 2005, A&A, 440, 775 [NASA ADS] [CrossRef] [EDP Sciences] (In the text)
- Kassim, N. E. 1989, ApJS, 71, 799 [NASA ADS] [CrossRef] (In the text)
- Kassim, N. E. 1992, AJ, 103, 943 [NASA ADS] [CrossRef] (In the text)
- Kesteven, M. J. L. 1968, AuJPh, 21, 369 [NASA ADS] (In the text)
- Koralesky, B., Frail, D. A., Goss, W. M., Claussen, M. J., & Green, A. J. 1998, AJ, 116, 1323 [NASA ADS] [CrossRef] (In the text)
- Lasker, B. M., Russel, J. N., & Jenkner, H. 1999, in the HST Guide Star Catalog, version 1.1-ACT, The Association of Universities for Research in Astronomy, Inc (In the text)
- Manchester, R. N., D'Amico, N., & Tuohy, I. R. 1985, MNRAS, 212, 975 [NASA ADS] (In the text)
- McKee, C. F., & Cowie, L. L. 1975, ApJ, 195, 715 [NASA ADS] [CrossRef] (In the text)
- Olling, R. P., & Merrifield, M. R., 1998, MNRAS, 297,943
- Osterbrock, D. E., & Ferland, G. J. 2006, Astrophysics of gaseous nebulae and AGN, 2nd edn (Sausalito, CA: University Science Books) (In the text)
- Reach, W. T., Rho, J., Tappe, A., et al., 2006, AJ, 131, 1479 [NASA ADS] [CrossRef] (In the text)
- Ryter, C., Cesarsky, C. J., & Audouze, J. 1975, ApJ, 198, 103 [NASA ADS] [CrossRef] (In the text)
- Saken, J, M., Fesen, R. A., & Shull, J. M. 1992, ApJS, 81, 715 [NASA ADS] [CrossRef] (In the text)
- Shaw, R. A., & Dufour, R. J. 1995, PASP, 107, 896 [NASA ADS] [CrossRef] (In the text)
- Stil, J. M., Taylor, A. R., Dickey, J. M., et al. 2006, AJ, 132, 1158 [NASA ADS] [CrossRef] (In the text)
- Velusamy, T., & Kundu, M. R. 1974, A&A, 32, 375 [NASA ADS] (In the text)
All Tables
Table 1: Imaging and spectral log.
Table 2: Typically measured fluxes over the brightest filaments.
Table 3: Relative line fluxes.
All Figures
| |
Figure 1:
The G 32.8-0.1 in a) the H |
| Open with DEXTER | |
| In the text | |
| |
Figure 2:
The continuum-subtracted mosaic of G 32.8-0.1 taken with
the 1.3-m telescope in H |
| Open with DEXTER | |
| In the text | |
| |
Figure 3: Long-slit spectra from the east (EI) and south (SII) areas of G 32.8-0.1. |
| Open with DEXTER | |
| In the text | |
| |
Figure 4:
The correlation between the H |
| Open with DEXTER | |
| In the text | |
| |
Figure 5:
The comparison between the H |
| Open with DEXTER | |
| In the text | |
| |
Figure 6:
VGPS images of the 21 cm line correlated with the radio
emission of G 32.8-0.1. The LSR velocities are indicated on
the top left of each panel. The VGPS images scale linearly from 10 to
130 K
for panels a)- c) and from 0 to 120 K for panels d)- f).
The 1.4 GHz radio contours (blue line) scale linearly from
|
| Open with DEXTER | |
| In the text | |
Copyright ESO 2009
Current usage metrics show cumulative count of Article Views (full-text article views including HTML views, PDF and ePub downloads, according to the available data) and Abstracts Views on Vision4Press platform.
Data correspond to usage on the plateform after 2015. The current usage metrics is available 48-96 hours after online publication and is updated daily on week days.
Initial download of the metrics may take a while.